Combining Quantitative Data on Growth, Wood Density and Other Traits with SSR Markers to Evaluate Genetic Diversity and Structure in a Planted Population of Eucalyptus camaldulensis Dehn.


Abstract
:1. Introduction
2. Materials and Methods
2.1. Genetic Material
2.2. Trial Design and Establishment
2.3. Quantitative Trait Assessments
2.4. Analyses of Quantitative Trait Data
2.5. Sampling DNA
2.6. DNA Extraction and SSR Marker Assay
2.7. SSR Loci Data Analyses
3. Results
3.1. Variation among Seed Sources
3.2. Variation among Families
3.3. Genetic Diversity by Molecular Markers
3.4. Genetic Diversity within Seed Sources
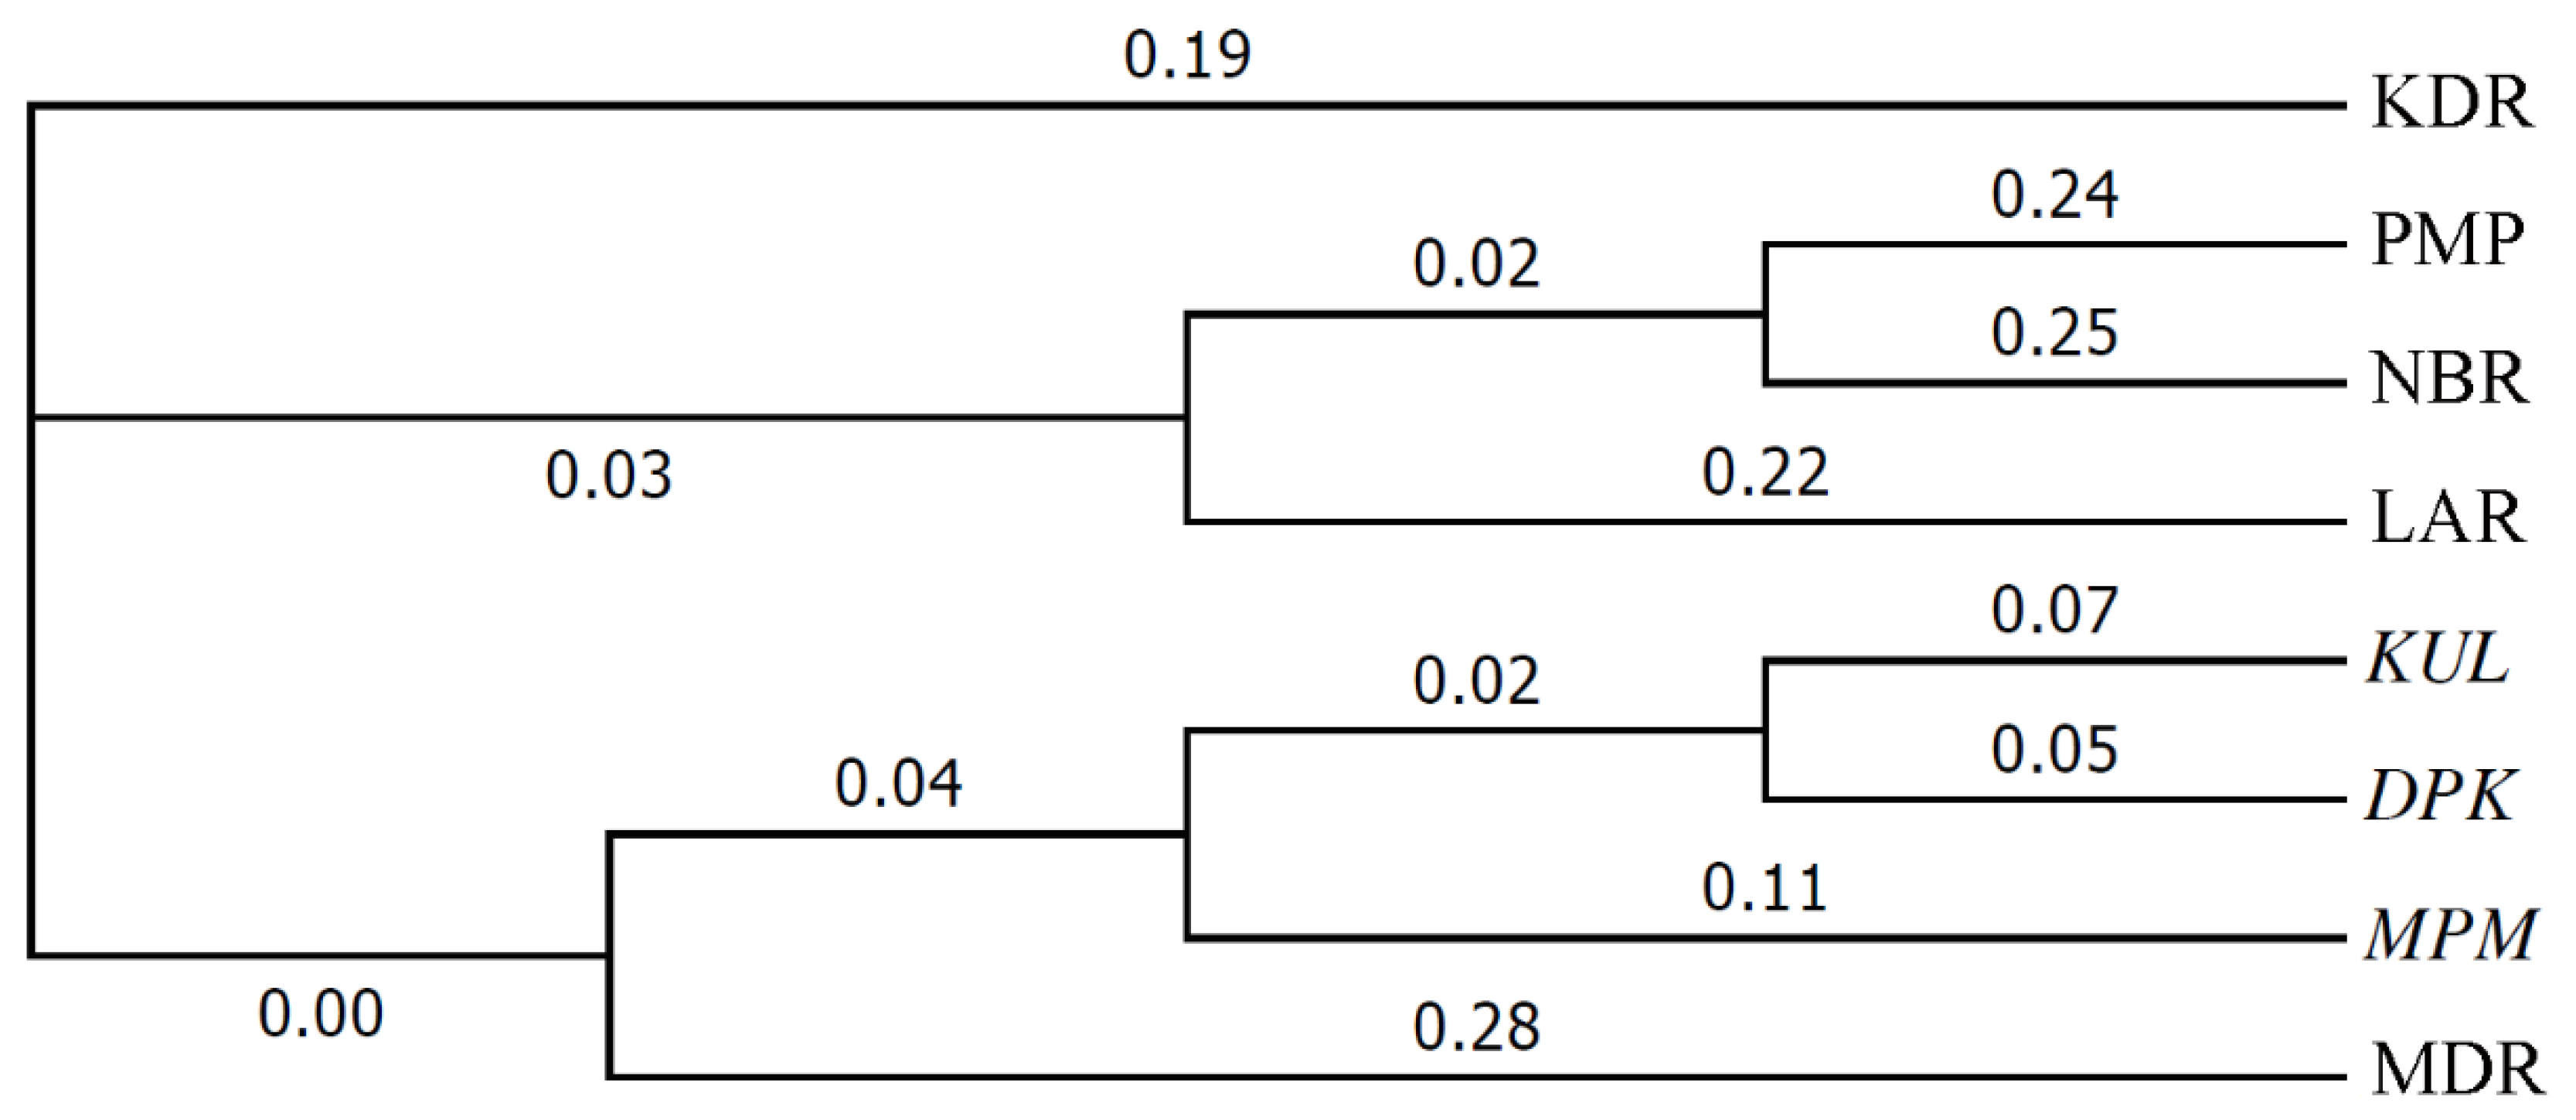
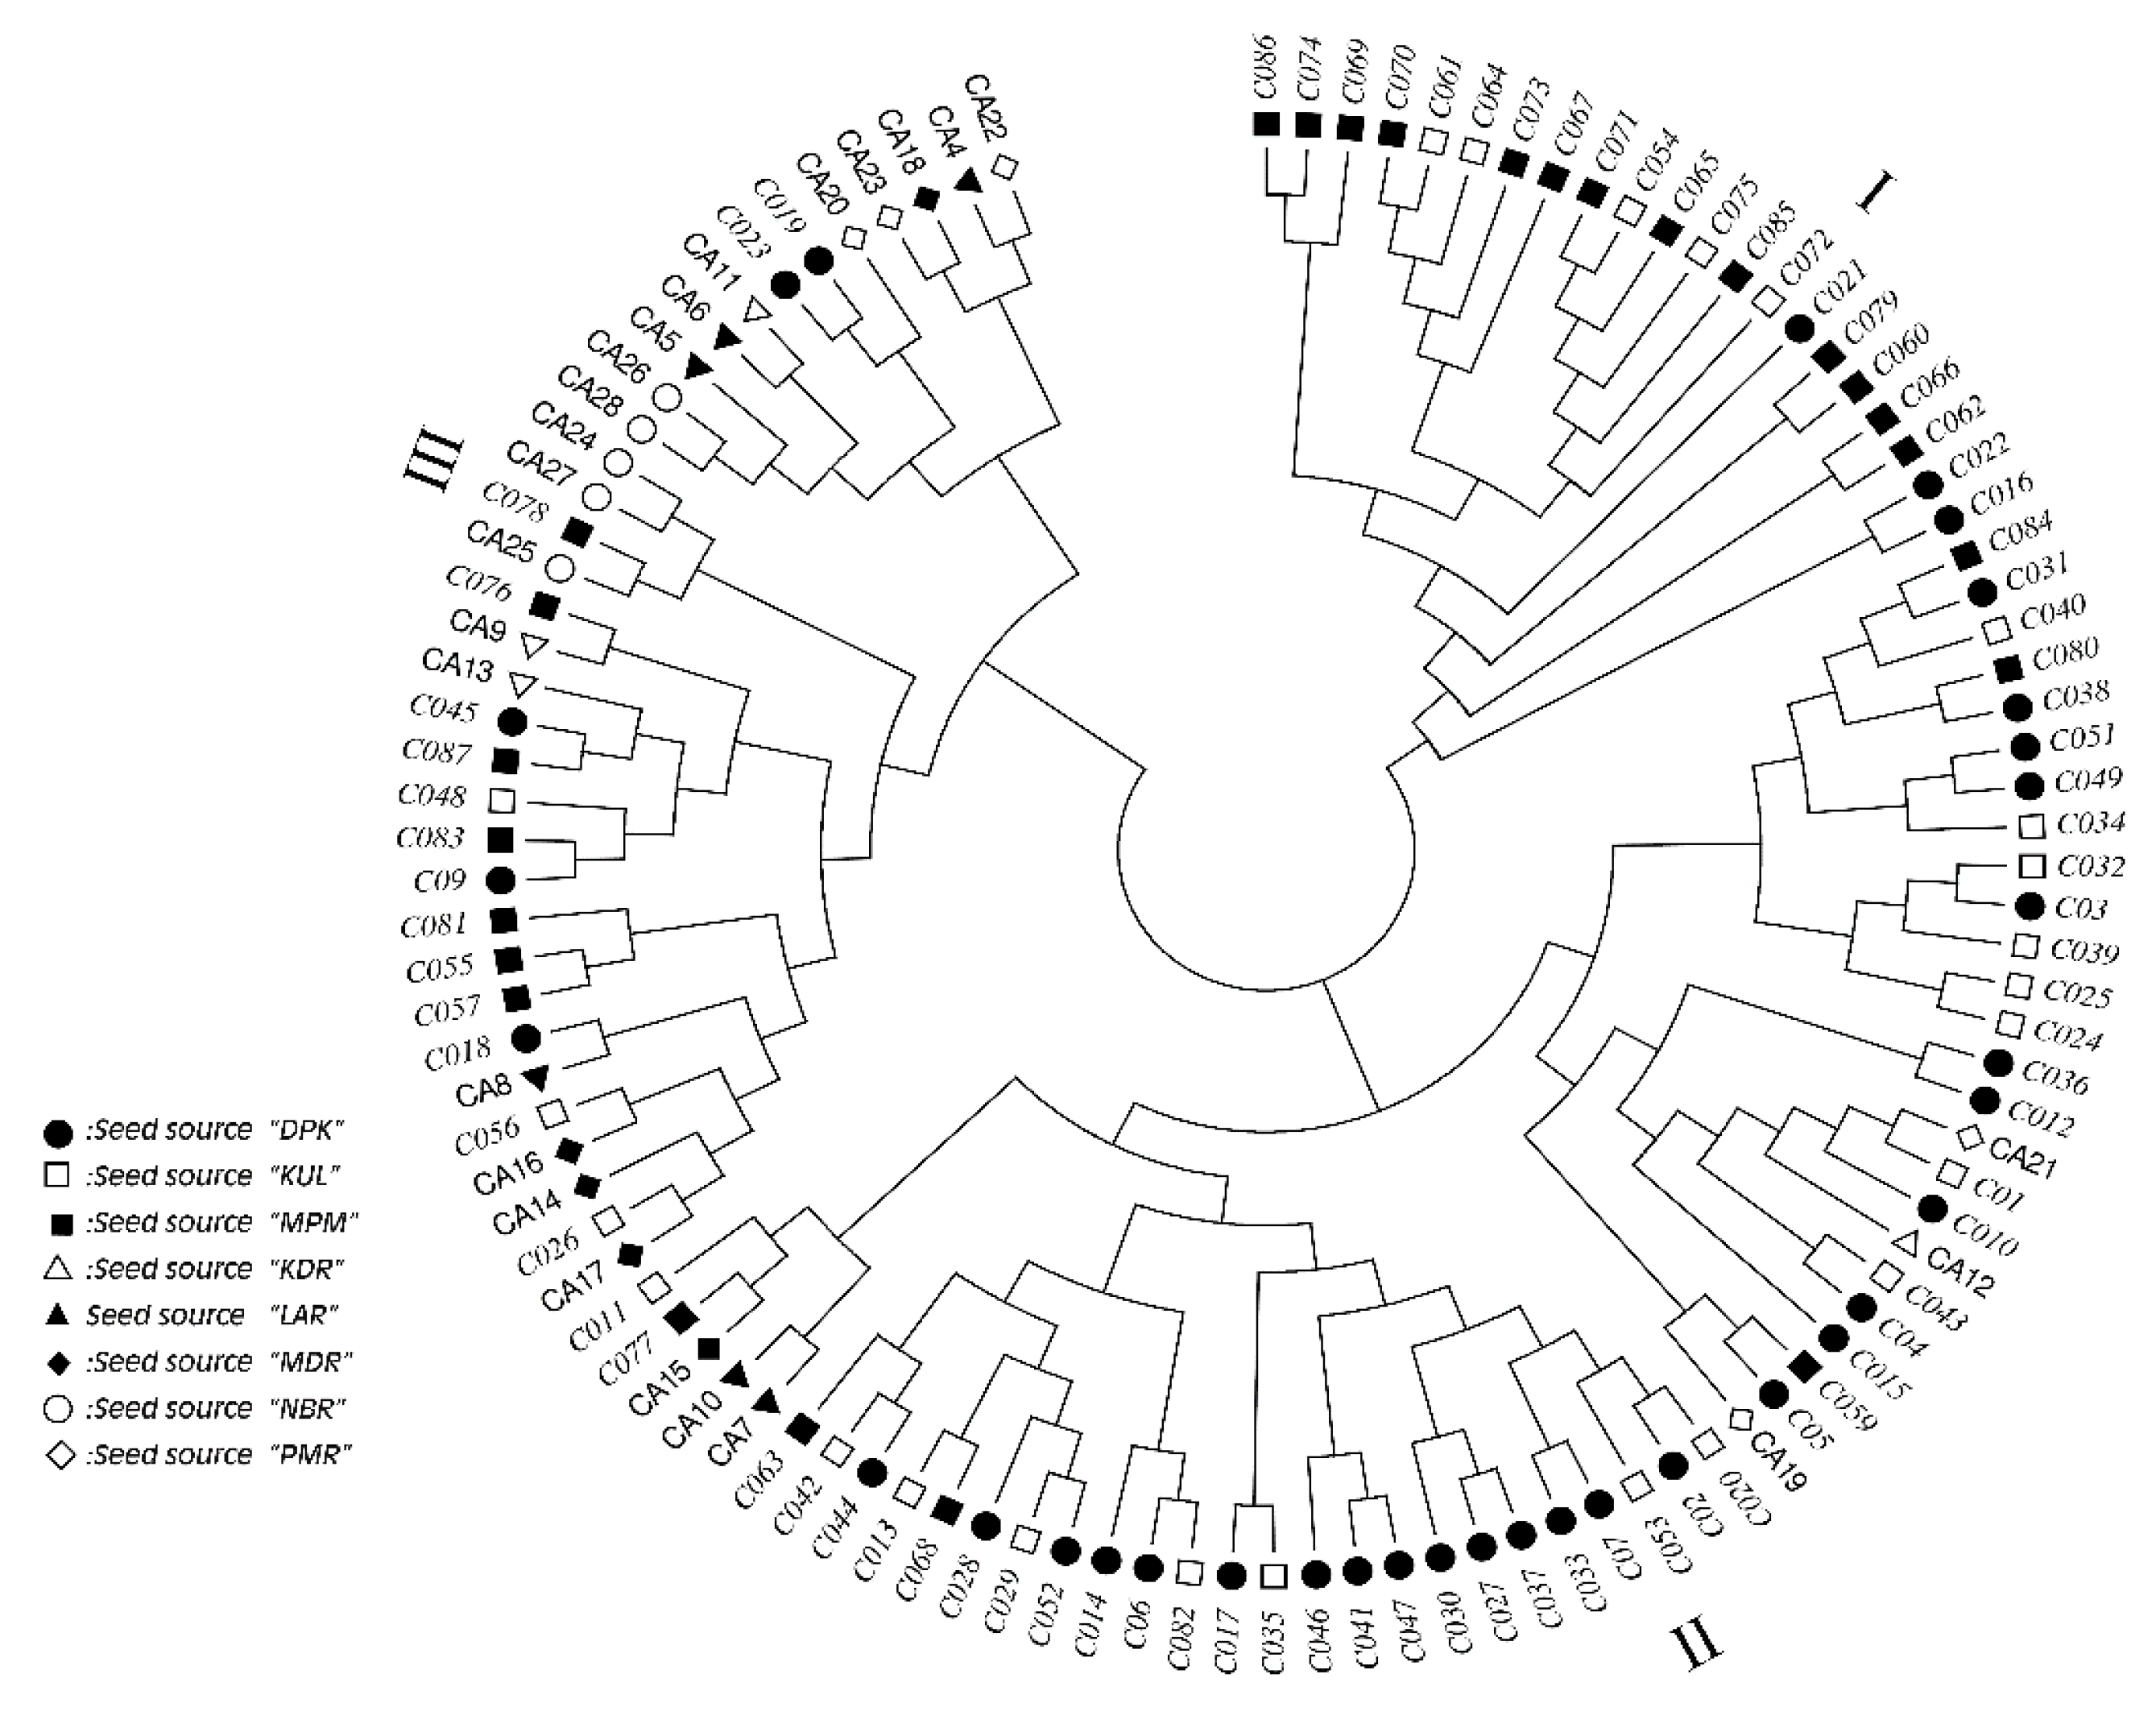
3.5. Distribution and Structure of Genetic Variation
4. Discussion
5. Conclusions
Supplementary Materials
Author Contributions
Funding
Acknowledgments
Conflicts of Interest
References
- Arnold, R.J.; Luo, J.Z. Eucalyptus camaldulensis. In Trees for Life in Oceania: Conservation and Utilisation of Genetic Diversity; ACIAR Monograph No. 201; Thomson, L., Doran, J., Clarke, B., Eds.; Australian Centre for International Agricultural Research: Canberra, Australia, 2018; pp. 94–99. [Google Scholar]
- Butcher, P.A.; McDonald, M.W.; Bell, J.C. Congruence between environmental parameters, morphology and genetic structure in Australia’s most widely distributed eucalypt Eucalyptus Camaldulensis. Tree Genet. Genomes 2009, 5, 189–210. [Google Scholar] [CrossRef]
- McDonald, M.W.; Brooker, M.I.H.; Butcher, P.A. A taxonomic revision of Eucalyptus camaldulensis (Myrtaceae). Aust. Syst. Bot. 2009, 22, 257–285. [Google Scholar] [CrossRef]
- Luo, J.Z.; Xie, Y.J.; Cao, J.G.; Lu, W.H.; Ren, S.Q. Genetic variation in 2-year eucalypt hybrids’ growth and typhoon resistance. J. Grass Ind. 2009, 18, 91–97. [Google Scholar]
- Eldridge, K.; Davidson, J.; Harwood, C.; Van Wyk, G. Eucalypt Domestication and Breeding; Oxford University Press: Oxford, UK, 1993; p. 312. [Google Scholar]
- CABI. Eucalyptus camaldulensis. In The Forestry Compendium: Global Module; CAB International: Oxon, UK, 2000. [Google Scholar]
- Arumugasundaram, S.; Ghosh, M.; Veerasamy, S.; Ramasamy, Y. Species discrimination, population structure and linkage disequilibrium in Eucalyptus camaldulensis and Eucalyptus tereticornis using SSR Markers. PLoS ONE 2011, 6, e28252. [Google Scholar] [CrossRef] [PubMed]
- Dillon, S.; McEvoy, R.; Baldwin, D.S.; Rees, G.N.; Parsons, Y.; Southerton, S. Characterisation of adaptive genetic diversity in environmentally contrasted populations of Eucalyptus camaldulensis Dehnh. (River Red Gum). PLoS ONE 2014, 9, e103515. [Google Scholar] [CrossRef] [PubMed]
- Luo, J.Z.; Zhou, G.; Wu, D.; Chen, D.; Cao, J.; Lu, W.H.; Pegg, R.E.; Arnold, R.J. Genetic variation and age-age correlations Eucalyptus grandis in Southern China. Aust. For. 2010, 73, 67–80. [Google Scholar] [CrossRef]
- Luo, J.Z.; Arnold, R.J.; Lu, W.H.; Lin, Y. Genetic variation in Eucalyptus camaldulensis and E. tereticornis for early growth and susceptibility to the gall wasp Leptocybe invasa in China. Euphytica 2014, 196, 397–411. [Google Scholar] [CrossRef]
- Turnbull, J.W. Development of sustainable forestry plantations in China: A review. In ACIAR Impact Assessment Series Report No. 45; Australian Centre for International Agricultural Research: Canberra, Australia, 2007. [Google Scholar]
- Arnold, R.J.; Luo, J.Z.; Lu, W.H.; Wang, C.B.; Lin, Y. Co-operative Improvement of Key Eucalypt Species in China. In Scientific Cultivation and Green Development to Enhance the Sustainability of Eucalypt Plantations; Proceedings of IUFRO Eucalypt Conference, Zhanjiang, China, 21–24 October 2015; China Eucalypt Research Centre: Zhanjiang, China.
- Harwood, C.E.; Nambiar, E.K.S. Sustainable Plantation Forestry in South-East Asia. In ACIAR Technical Reports No. 84; Australian Centre for International Agricultural Research: Canberra, Australia, 2014; p. 100. [Google Scholar]
- Thu, P.Q.; Dell, B.; Burgess, T.I. Susceptibility of 18 eucalypt species to the gall wasp Leptocybe invasa in the nursery and young plantations in Vietnam. Sci. Asia 2009, 35, 113–117. [Google Scholar]
- Hansen, C.P. Application of the Pilodyn in Forest Tree Improvement; DFSC Series of Technical Notes TN55; Danida Forest Seed Centre: Humlebaek, Denmark, 2000. [Google Scholar]
- Ilic, J.; Boland, D.; McDonald, M.; Downes, G.; Blakemore, P. Wood Density Phase 1—State of Knowledge; National Carbon Accounting System–Technical Report No. 18; Australian Greenhouse Office Press: Canberra, Australia, 2000. [Google Scholar]
- Williams, E.R.; Matheson, A.C.; Harwood, C.E. Experimental design and analysis for use in Tree Improvement, 2nd ed.; CSIRO: Melbourne, Australia, 2002. [Google Scholar]
- Butcher, P.A.; Williams, E.R. Variation in outcrossing rates and growth in Eucalyptus camaldulensis from the Petford region, Queensland; evidence of outbreeding depression. Silvae Genet. 2003, 51, 6–12. [Google Scholar]
- Payn, K.G.; Dvorak, W.S.; Myburg, A.A. Chloroplast DNA phylogeography reveals the island colonisation route of Eucalyptus urophylla (Myrtaceae). Aust. J. Bot. 2007, 55, 673–683. [Google Scholar] [CrossRef]
- Payn, K.G.; Dvorak, W.S.; Janse, B.J.H.; Myburg, A.A. Microsatellite diversity and genetic structure of the commercially important tropical tree species Eucalyptus urophylla endemic to seven islands in eastern Indonesia. Tree Genet. Genomes 2008, 4, 519–530. [Google Scholar] [CrossRef]
- Tripiana, V.; Bourgeois, M.; Verhaegen, D.; Vigneron, P.; Bouvet, J.M. Combining microsatellites, growth, and adaptive traits for managing in situ genetic resources of Eucalyptus urophylla. Can. J. For. Res. 2007, 37, 773–785. [Google Scholar] [CrossRef]
- Lu, W.H.; Arnold, R.J.; Zhang, L.; Luo, J.Z. Genetic diversity and structure through three cycles of a Eucalyptus urophylla S.T. Blake breeding program. Forests 2018, 9, 372. [Google Scholar]
- Gan, S.; Shi, J.; Li, M.; Wu, K.M.; Wu, J.Y.; Bai, J.Y. Moderate-density molecular maps of Eucalyptus urophylla S.T. Blake and E. tereticornis Smith genomes based on RAPD markers. Genetica 2003, 118, 59–67. [Google Scholar] [CrossRef]
- Li, F.; Gan, S. An optimised protocol for fluorescent-dUTP based SSR genotyping and its application to genetic mapping in Eucalyptus. Silvae Geneica 2011, 60, 18–25. [Google Scholar] [CrossRef]
- Rousset, F. Genepop’007: A complete reimplementation of the Genepop software for Windows and Linux. Mol. Ecol. Resour. 2008, 8, 103–106. [Google Scholar] [CrossRef]
- Peakall, R.; Smouse, P. GENALEX 6: Genetic analysis in Excel. Population genetic software for teaching and research. Mol. Ecol. Notes 2006, 6, 288–295. [Google Scholar] [CrossRef]
- Yeh, F.C.; Yang, R.; Boylet, T. POPGENE Version 1.32: Software Microsoft Window-Based Freeware for Population Genetic Analysis; University of Alberta: Edmonton, AB, Canada, 1997. [Google Scholar]
- Liu, K.; Muse, S.V. Powermarker: Integrated analysis environment for genetic marker data. Bioinformatics 2005, 21, 2128–2129. [Google Scholar] [CrossRef]
- Tamura, K.; Dudley, J.; Nei, M. MEGA4: Molecular evolutionary genetics analysis (MEGA) software version 4.0. Mol. Biol. Evol. 2007, 24, 1596–1599. [Google Scholar] [CrossRef]
- Hartl, D.L.; Clark, A.G. Principles of Population Genetics, 3rd ed.; Sinauer Associates, Inc. Publishers: Sunderland, MA, USA, 1997. [Google Scholar]
- Balloux, F.; Lugon-Moulin, N. The estimation of population differentiation with microsatellite markers. Mol. Ecol. 2002, 11, 155–165. [Google Scholar] [CrossRef]
- Bush, D.; Marcar, N.; Arnold, R.; Crawford, D. Assessing genetic variation within Eucalyptus camaldulensis for survival and growth on two spatially variable saline sites in southern Australia. For. Ecol. Manag. 2013, 306, 68–78. [Google Scholar] [CrossRef]
- Mahmod, K.; Marcar, N.E.; Naqvi, M.H.; Arnold, R.J.; Crawford, D.F.; Iqbal, S.; Aken, A.K. Genetic variation in Eucalyptus camaldulensis Denh. for growth and stem straightness in a provenance-family trial on saltland in Pakistan. For. Ecol. Manag. 2003, 176, 405–416. [Google Scholar] [CrossRef]
- Shi, T.Y.; Arnold, R.J.; Kang, W.L.; Duan, F.W.; Qian, Y.X.; Xie, H.; Xu, J.M. Genetic variation and gains for two generations of Eucalyptus dunnii in China. Aust. For. 2016, 79, 15–24. [Google Scholar] [CrossRef]
- Arnold, R.; Bush, D.; Stackpole, D. Genetic variation and tree improvement. In New Forests—Wood Production and Environmental Services; Nambiar, S., Ferguson, I., Eds.; CSIRO Publishing: Melbourne, Australia, 2005; pp. 25–49. [Google Scholar]
- Lee, D.J.; Huth, J.R.; Osborne, D.O.; Hogg, B.W. Selecting hardwood taxa for wood and fibre production in Queensland’s subtropics. Aust. For. 2010, 73, 106–114. [Google Scholar] [CrossRef]
- Bandara, K.M.A.; Arnold, R.J.; Aken, K.M. Genetic variation in a Eucalyptus grandis seedling seed orchard in the up-country of Sri Lanka. Sri. Lankan For. 2000, 25, 21–36. [Google Scholar]
- Lan, H.S.; Huang, X.M.; Luo, J.Z.; Arnold, R.J. Genetic variation in growth and stem straightness in Eucalyptus saligna trials in Fujian. Aust. For. 2012, 75, 163–174. [Google Scholar]
- Butcher, P.A.; Otero, A.; McDonald, M.W.; Moran, G.F. Nuclear RFLP variation in Eucalyptus camaldulensis Dehnh. From northern Australia. Heredity 2002, 88, 402–412. [Google Scholar] [CrossRef]
- Song, Z.J.; Yang, H.Y.; Weng, Q.J.; Zhou, C.P.; Li, F.G.; Li, M.; Lu, W.H.; Luo, J.Z.; Gan, S.M. Genetic diversity and selective loci in Eucalyptus tereticornis populations. Sci. Silvae Sin. 2016, 52, 40–47. [Google Scholar]
- Steane, D.A.; Potts, B.M.; Mclean, E.; Prober, S.M.; Srock, W.D.; Vaillancout, R.E.; Byrne, M. Genome-wide scans detect adaptation to aridity in a widespread forest tree species. Mol. Ecol. 2014, 23, 2500–2513. [Google Scholar] [CrossRef]
- Liu, S.R.; Lin, Y.; Liu, X.H.; Luo, J.Z. Genetic diversity and genetic structure of Corymbia citriodora based on SSR analysis. Mol. Plant. Breed. 2016, 14, 1923–1929. [Google Scholar]
- Li, C.R.; Xiong, T.; Chen, D.L.; Deng, Z.Y.; Chen, S.K.; Lan, B.B.; Liang, J.X.; Lan, J. Analysis on genetic diversity of Eucalyptus pellita based on SSR markers. J. South. Agric. 2016, 47, 7–12. [Google Scholar]
- Burgess, I.P. Provenance trials of Eucalyptus grandis and E. saligna in Australia. Silvae Genet. 1988, 37, 221–227. [Google Scholar]
- Matheson, A.C.; Mullin, L.J. Variation among neighbouring and distant provenances of Eucalyptus grandis and E. tereticornis in Zimbabwean field trials. Aust. For. Res. 1987, 17, 233–250. [Google Scholar]

| Source ID Code | Seed Source Number 1,2 | Taxa 3 | Details of Seed Source Geographic Origin 4 | No. of Families/Seedlots (= Trial Entries) | ||||
|---|---|---|---|---|---|---|---|---|
| Location | Latitude | Longitude | Altitude (m asl) | Type 5 | ||||
| KUL | IN1 | EC | SSO2, India | - - | - - | - - | SSO | 24 |
| DPK | IN2 | EC | CSO1, India | - - | - - | - - | CSO | 34 |
| MPM | IN3 | EC | SSO1, India | - - | - - | - - | SSO | 26 |
| DCA | C21108 | ECS | SSO Davies Creek, QLD, Australia | 16°54′ S | 145°33′ E | 400 | SSO | 1 |
| WPZ | C19478 | ECO | SSO EB12 Wrotham Park, Zimbabwe | 18°56′ S | 27°48′ E | 1012 | SSO | 1 |
| LKT | C20629 | ECO | SSO Lad Krathing, Thailand | 13°45′ N | 101°06′ E | 150 | SSO | 1 |
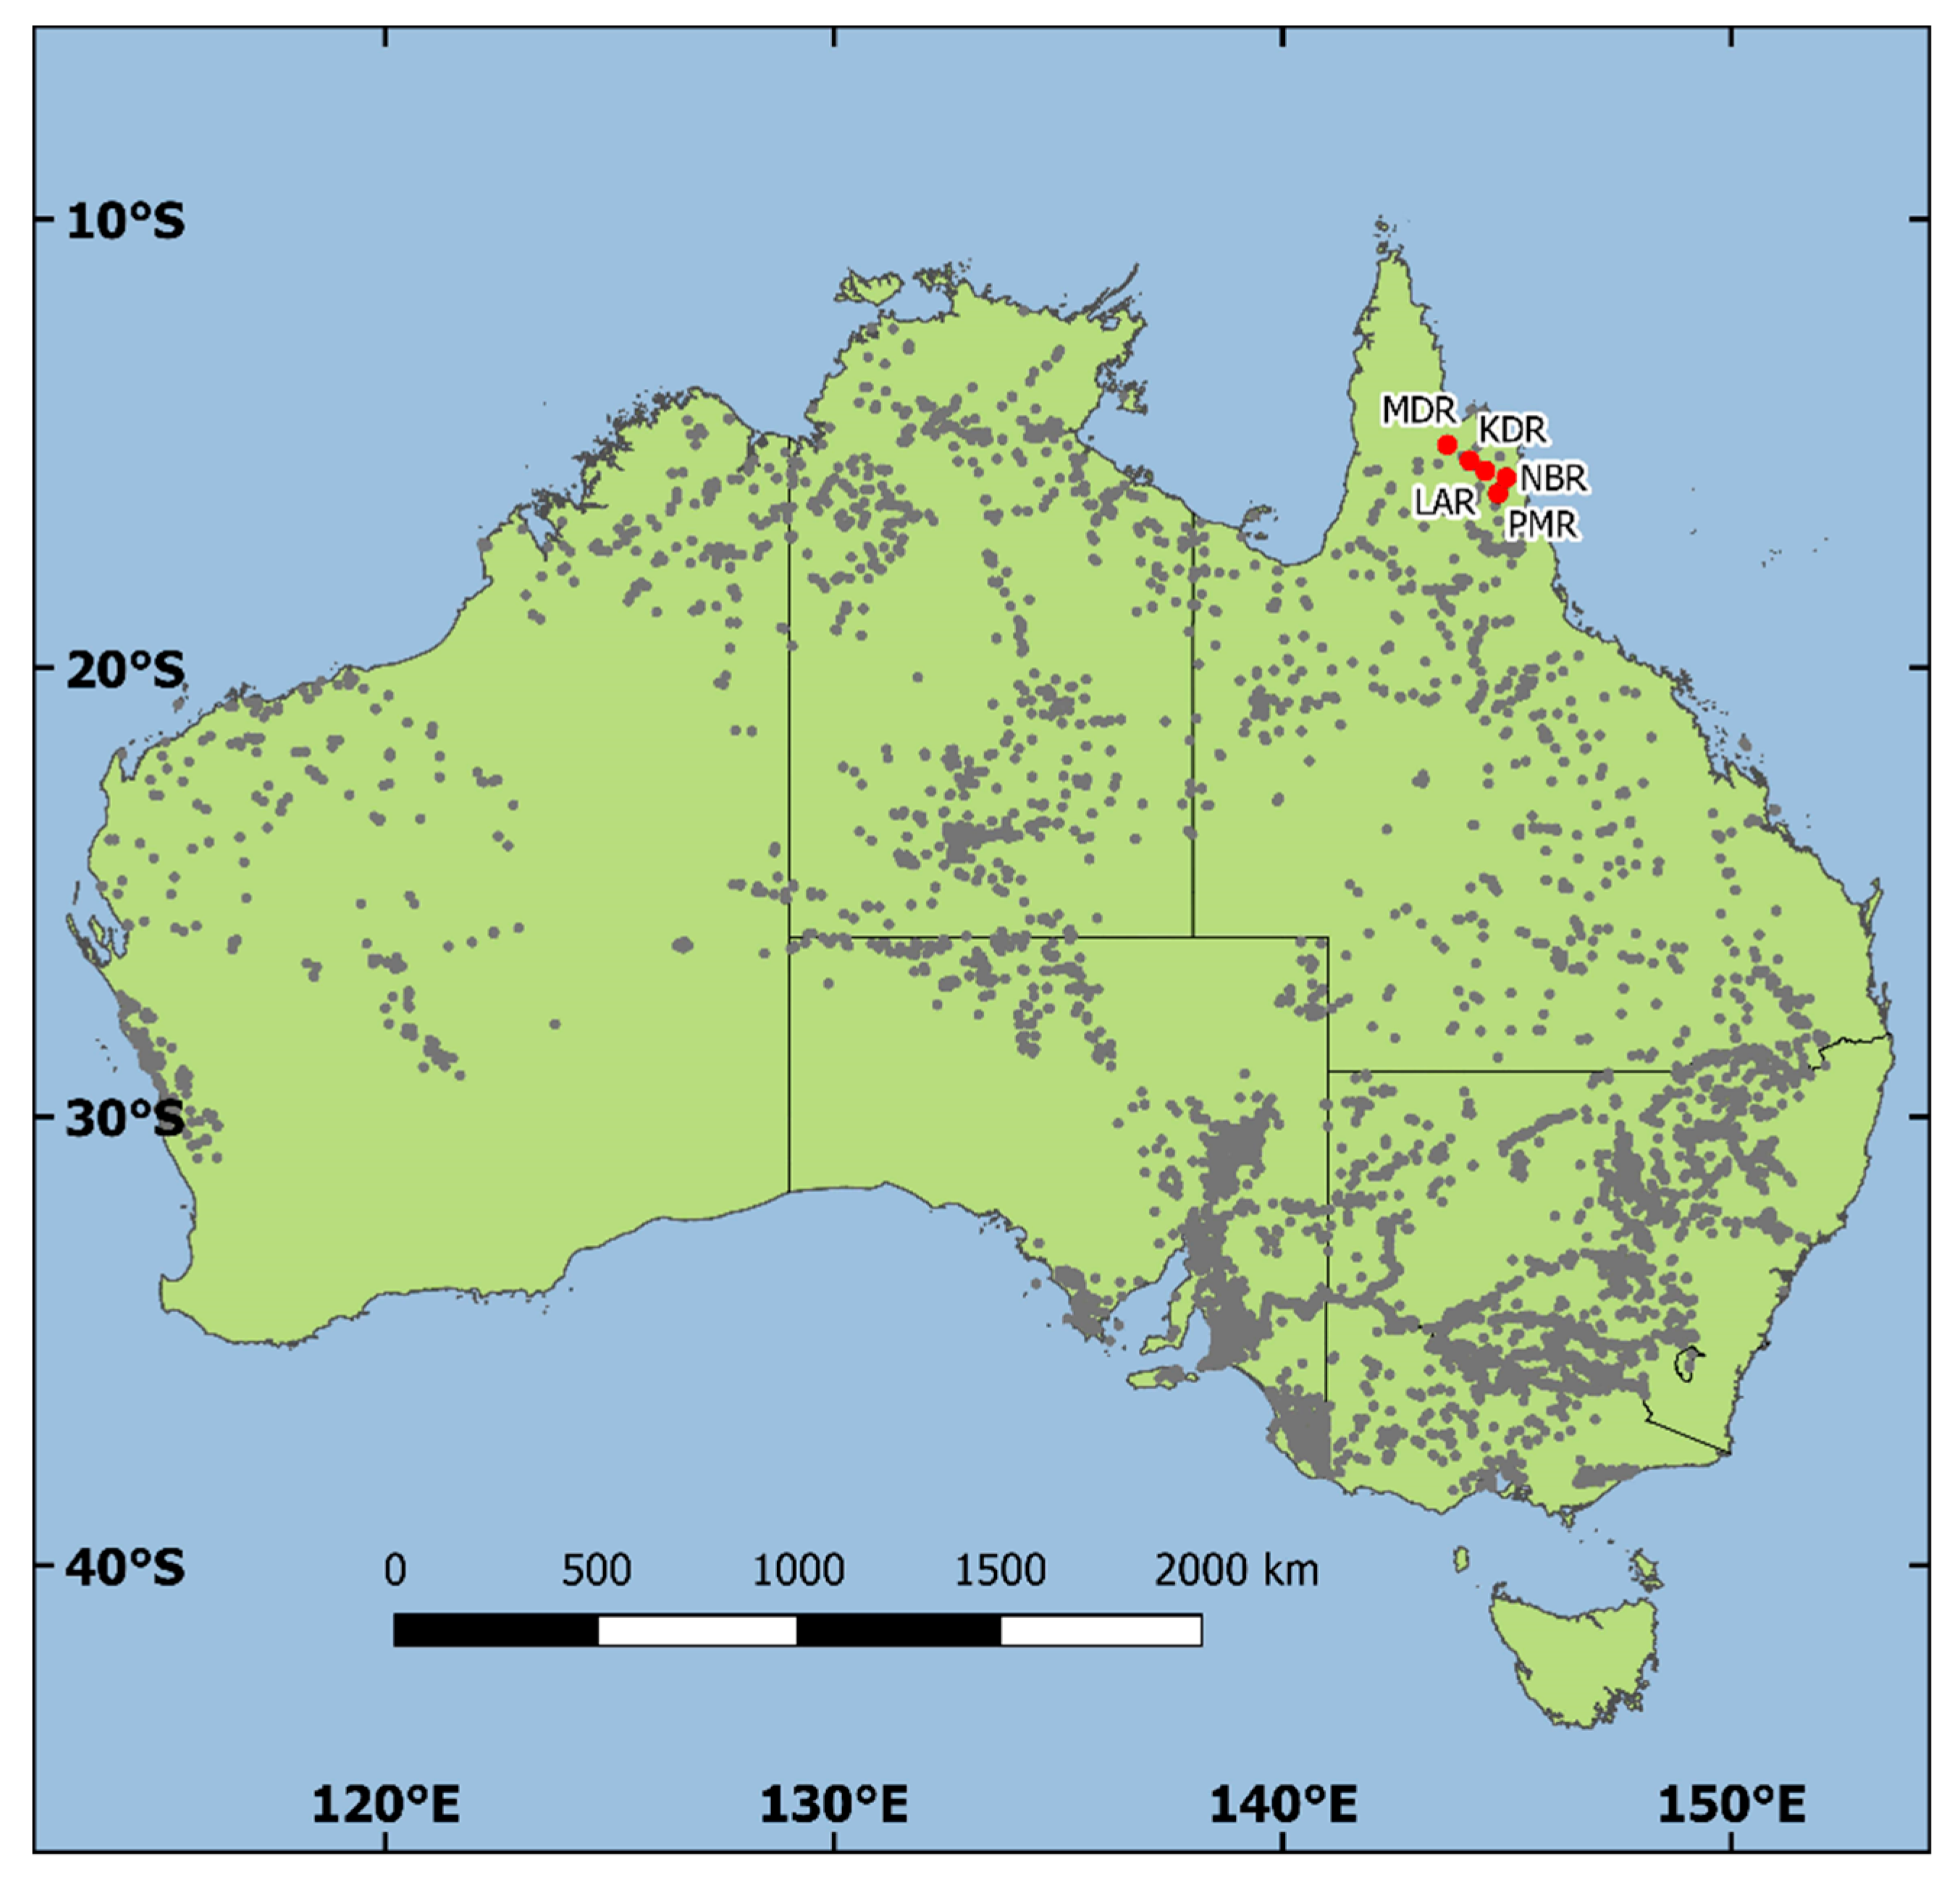
| LAR | D1139 | ECS | Laura River, QLD, Australia | 15°37′ S | 144°31′ E | 95 | NS | 5 |
| KDR | D1141 | ECS | Kennedy River, QLD, Australia | 15°23′ S | 144°10′ E | 80 | NS | 5 |
| MDR | D1140 | ECA | Morehead River, QLD, Australia | 15°02′ S | 143°40′ E | 60 | NS | 5 |
| PMR | D1142 | ECO | Palmer River, Qld, Australia | 16°07′ S | 144°48′ E | 410 | NS | 5 |
| NBR | D1145 | ECO | Normanby River, Qld, Australia | 15°46′ S | 144°59′ E | 205 | NS | 5 |
| Subtotals | All Taxa | 112 | ||||||
| EC | 84 | |||||||
| ECA | 5 | |||||||
| ECO | 2 | |||||||
| ECS | 21 | |||||||
| Seed Source | Seed Source Means (Coefficients of Variation) by Age and Trait | |||||||||||||||||
|---|---|---|---|---|---|---|---|---|---|---|---|---|---|---|---|---|---|---|
| 9 Months | 24 Months | 36 Months | ||||||||||||||||
| Height (m) | L. invasa Susceptibility | Height (m) | DBH (cm) | Height (m) | DBH (cm) | Pilodyn Penetration (mm) | Bark Thickness (cm) | Survival | ||||||||||
| KUL | 2.3 | (21%) | 1.44 | (74%) | 6.0 | (21%) | 6.1 | (23%) | 8.4 | (27%) | 9.2 | (27%) | 13.0 | (10%) | 0.52 | (19%) | 80.0% | (22%) |
| DPL | 2.3 | (21%) | 2.09 | (48%) | 6.2 | (16%) | 6.1 | (20%) | 9.0 | (23%) | 9.6 | (19%) | 13.2 | (7%) | 0.56 | (13%) | 85.0% | (19%) |
| MPM | 2.1 | (23%) | 0.68 | (105%) | 5.7 | (18%) | 5.8 | (24%) | 8.2 | (25%) | 8.5 | (28%) | 13.0 | (7%) | 0.51 | (22%) | 85.0% | (16%) |
| DCA | 2.6 | 0.45 | 7.2 | 5.9 | 9.6 | 9.0 | 11.9 | 0.52 | 75.0% | |||||||||
| WPZ | 2.8 | 0.56 | 6.4 | 6.9 | 12.0 | 10.4 | 12.5 | 0.56 | 88.0% | |||||||||
| LKT | 2.7 | 0.86 | 6.3 | 5.7 | 8.2 | 8.2 | 12.5 | 0.58 | 100.0% | |||||||||
| LAR | 2.5 | (13%) | 0.97 | (68%) | 6.7 | (12%) | 6.5 | (13%) | 10.4 | (12%) | 9.5 | (9%) | 12.5 | (7%) | 0.58 | (9%) | 98.0% | (6%) |
| KDR | 2.3 | (14%) | 0.43 | (101%) | 6.1 | (19%) | 5.5 | (28%) | 9.0 | (24%) | 8.1 | (15%) | 12.8 | (9%) | 0.53 | (14%) | 78.0% | (23%) |
| MDR | 2.6 | (16%) | 0.32 | (71%) | 6.1 | (14%) | 6.1 | (21%) | 8.4 | (9%) | 8.2 | (12%) | 11.5 | (5%) | 0.51 | (15%) | 88.0% | (13%) |
| PMR | 2.3 | (7%) | 0.77 | (44%) | 6.5 | (5%) | 6.1 | (6%) | 10.0 | (11%) | 9.0 | (11%) | 13.9 | (5%) | 0.54 | (9%) | 96.0% | (6%) |
| NBR | 2.3 | (9%) | 0.89 | (54%) | 6.3 | (4%) | 6.4 | (13%) | 10.4 | (14%) | 10.0 | (14%) | 13.5 | (3%) | 0.59 | (9%) | 91.0% | (6%) |
| Trial Mean | 2.3 | (20%) | 1.27 | (80%) | 6.1 | (17%) | 6.1 | (20%) | 8.9 | (23%) | 9.1 | (22%) | 13.0 | (8%) | 0.54 | (17%) | 84.9% | (18%) |
| Standard Error | 0.26 | 0.43 | 0.6 | 0.6 | 1.1 | 0.9 | 0.2 | 0.016 | 8.7% | |||||||||
| F prob.—significance of differences among seed source means | ns 1 | <0.01 | <0.01 | <0.01 | <0.01 | <0.01 | <0.01 | <0.01 | <0.01 | |||||||||
| F prob.—significance of differences among means of families within seed sources | <0.01 | <0.01 | <0.01 | <0.01 | <0.01 | <0.01 | <0.01 | <0.01 | <0.01 | |||||||||
| Seed Source 1 | L. invasa Resistance | DBH (cm)—36 Months | Pilodyn Penetration (mm) | |||
|---|---|---|---|---|---|---|
| No. Families in Top 10 | No. Families in Top 20 | No. Families in Top 10 | No. Families in Top 20 | No. Families in Top 10 | No. Families in Top 20 | |
| KUL | 3 | 5 | 4 | 5 | 4 | 6 |
| DPL | 1 | 2 | 4 | 7 | 0 | 2 |
| MPM | 6 | 10 | 0 | 3 | 2 | 4 |
| DCA | 0 | 0 | 0 | 0 | 0 | 1 |
| WPZ | 0 | 0 | 0 | 1 | 0 | 0 |
| LKT | 0 | 0 | 0 | 0 | 0 | 0 |
| LAR | 0 | 0 | 1 | 1 | 1 | 1 |
| KDR | 0 | 0 | 0 | 0 | 0 | 2 |
| MDR | 0 | 2 | 0 | 0 | 3 | 4 |
| PMR | 0 | 0 | 0 | 1 | 0 | 0 |
| NBR | 0 | 1 | 1 | 2 | 0 | 0 |
| Mean of top ranked 10/20 families | 0.01 | 0.06 | 11.1 | 10.9 | 11.3 | 11.6 |
| Trial mean | 1.27 | 9.1 | 13.0 | |||
| Parameter 1 | 9 Months | 24 Months | 36 Months | |||||
|---|---|---|---|---|---|---|---|---|
| L. invasa Susceptibility | Height | Height | DBH | Height | DBH | Pilodyn Penetration | Bark Thickness | |
| σss2 | 0.31 | 0.00 | 0.03 | 0.02 | 0.12 | 0.13 | 0.05 | 0.0004 |
| σsl2 | 0.61 | 0.12 | 0.46 | 0.82 | 1.20 | 0.92 | 0.48 | 0.0005 |
| σp2 | 1.72 | 0.59 | 3.38 | 4.66 | 13.48 | 9.85 | 3.68 | 0.0295 |
| Ratio – σss2/σsl2 | 50.8% | 0.1% | 7.4% | 1.5% | 10.1% | 14.2% | 9.8% | 75.2% |
| hi2 ± std. error | 0.54 ± 0.40 | 0.11 ± 0.15 | 0.24 ± 0.22 | 0.37 ± 0.22 | 0.27 ± 0.19 | 0.18 ± 0.15 | 0.18 ± 0.19 | 0.10 ± 0.14 |
| PIC | NA | NE | I | HO | HE | F | FIS | FST |
|---|---|---|---|---|---|---|---|---|
| 0.84 (0.15) | 28.5 (8.1) | 6.4 (2.6) | 1.84 (0.46) | 0.77 (0.22) | 0.77 (0.14) | −0.02 (0.23) | 0.054 (0.23) | 0.081 (0.08) |
| Source of Variation | Degrees of Freedom | Sum of Squares | Mean Square | Percent of Variance |
|---|---|---|---|---|
| Among seed sources | 7 | 208.3 | 29.8 | 1% |
| Among individuals within seed sources | 101 | 2328.1 | 23.1 | 13% |
| Within individuals | 109 | 1921.5 | 17.6 | 86% |
| Seed Source | N | NA | NE | I | HO | HE | F | FIS |
|---|---|---|---|---|---|---|---|---|
| KUL | 24 | 15.1 | 8.5 | 2.26 | 0.78 | 0.83 | 0.05 | 0.12 |
| DPK | 36 | 15.9 | 7.9 | 2.18 | 0.77 | 0.80 | 0.03 | 0.08 |
| MPM | 26 | 17.1 | 10.3 | 2.44 | 0.78 | 0.86 | 0.08 | 0.14 |
| LAR | 5 | 6.4 | 5.4 | 1.67 | 0.84 | 0.76 | −0.11 | −0.09 |
| KDR | 5 | 5.5 | 4.5 | 1.48 | 0.74 | 0.70 | −0.07 | 0.04 |
| MDR | 5 | 6.0 | 5.0 | 1.59 | 0.77 | 0.74 | −0.05 | −0.03 |
| PMR | 5 | 5.8 | 4.9 | 1.55 | 0.72 | 0.73 | 0.01 | 0.11 |
| NBR | 5 | 5.8 | 4.7 | 1.57 | 0.80 | 0.74 | −0.09 | −0.08 |
| Means | 12.8 | 9.7 | 6.4 | 1.84 | 0.77 | 0.77 | −0.02 | 0.04 |
| Seed Source | KUL | DPK | MPM | LAR | KDR | MDR | PMR | NBR |
|---|---|---|---|---|---|---|---|---|
| KUL | - | 0.12 | 0.18 | 0.41 | 0.32 | 0.43 | 0.42 | 0.39 |
| DPK | - | 0.21 | 0.37 | 0.29 | 0.40 | 0.38 | 0.37 | |
| MPM | - | 0.43 | 0.35 | 0.41 | 0.44 | 0.44 | ||
| LAR | - | 0.42 | 0.55 | 0.50 | 0.48 | |||
| KDR | - | 0.47 | 0.50 | 0.52 | ||||
| MDR | - | 0.55 | 0.61 | |||||
| PMR | - | 0.50 | ||||||
| NBR | - |
© 2019 by the authors. Licensee MDPI, Basel, Switzerland. This article is an open access article distributed under the terms and conditions of the Creative Commons Attribution (CC BY) license (http://creativecommons.org/licenses/by/4.0/).
Share and Cite
Shang, X.; Arnold, R.J.; Wu, Z.; Zhang, P.; Liu, G.; Luo, J.; Zhan, N. Combining Quantitative Data on Growth, Wood Density and Other Traits with SSR Markers to Evaluate Genetic Diversity and Structure in a Planted Population of Eucalyptus camaldulensis Dehn. Forests 2019, 10, 1090. https://doi.org/10.3390/f10121090
Shang X, Arnold RJ, Wu Z, Zhang P, Liu G, Luo J, Zhan N. Combining Quantitative Data on Growth, Wood Density and Other Traits with SSR Markers to Evaluate Genetic Diversity and Structure in a Planted Population of Eucalyptus camaldulensis Dehn. Forests. 2019; 10(12):1090. https://doi.org/10.3390/f10121090
Chicago/Turabian StyleShang, Xiuhua, Roger J. Arnold, Zhihua Wu, Peijian Zhang, Guo Liu, Jianzhong Luo, and Ni Zhan. 2019. "Combining Quantitative Data on Growth, Wood Density and Other Traits with SSR Markers to Evaluate Genetic Diversity and Structure in a Planted Population of Eucalyptus camaldulensis Dehn." Forests 10, no. 12: 1090. https://doi.org/10.3390/f10121090
APA StyleShang, X., Arnold, R. J., Wu, Z., Zhang, P., Liu, G., Luo, J., & Zhan, N. (2019). Combining Quantitative Data on Growth, Wood Density and Other Traits with SSR Markers to Evaluate Genetic Diversity and Structure in a Planted Population of Eucalyptus camaldulensis Dehn. Forests, 10(12), 1090. https://doi.org/10.3390/f10121090