Article

Sub-Genome Polyploidization Effects on Metabolomic Signatures in Triploid Hybrids of Populus

1
School of Chemical and Environmental Engineering, Pingdingshan University, Pingdingshan 467000, China
2
Department of Genetics, University of Georgia, Athens, GA 30602, USA
*
Author to whom correspondence should be addressed.
Forests 2019, 10(12), 1091; https://doi.org/10.3390/f10121091
Submission received: 2 November 2019 / Revised: 27 November 2019 / Accepted: 28 November 2019 / Published: 1 December 2019
(This article belongs to the Special Issue Forest Genetics and Tree Improvement)

Abstract

:
Allopolyploids are known to have superior advantages such as high growth speed. Triploids have even greater heterozygosity, explaining more phenotypic variance than 2n hybrid F1 and have therefore become new resources in breeding. To date, the metabolomic basis underlying polyploidization vigor remains unclear. Here, we identified and compared 235 metabolites in the shoot apical buds between multiple allo-triploid populations and parental 2n hybrid F1 in Populus via metabolome profiling using liquid chromatography–mass spectrometry (LC–MS) assays. Associations with growth vigor in three types of allo-triploid populations, namely first division restitution (FDR), second division restitution (SDR) and postmeiotic restitution (PMR) generated from doubled 2n female gametes and male gametes of 2n hybrid, were also investigated. Each allo-triploid population has different sub-genome duplicated. Major metabolomes were amino acids, secondary metabolism associated, and carbohydrates. We mapped 181 metabolites into known metabolism pathways in the Kyoto Encyclopedia of Genes and Genomes (KEGG). Ten compounds, i.e., fructose 1,6-diphosphate and xylulose, were more abundant in all allo-triploids than the 2n hybrid. Principal component analysis revealed the abundance of metabolites fell into distinct clusters corresponding to ploidy composition. Heterozygosity in triploids mainly effected the contents of carbohydrates and secondary metabolites rather than lipids. Comparisons between subgroups with different growth rates revealed some carbohydrates and secondary metabolites of flavonoids were positively associated with gene expression and the high growth vigor. The results provided an informative metabolomic basis for factors conferring growth vigor in polyploid Populus.

1. Introduction

Polyploid organisms have more than two sets of chromosomes; 30–80% of plant kingdom are polyploid. Many plant lineages show evidence of palaeopolyploidization in their genomes. Polyploid plants usually have larger cell size and faster growth, which are both agronomically preferred traits [1]. Polyploid breeding in plants, including synthesized polyploidization, has increased the rate of breeding in many crops and also in trees, such as Populus [2,3,4,5]. Polyploidization leads to a series of genomic, metabolomic, cellular and physiological changes. Typically, a reduction in genome size occurs after polyploidization, followed by neo-functionalization, sub-functionalization and gene product dosage balance, gene rearrangement, and epigenetic modification, which all drive the evolution and speciation [6]. Cell size is usually increased in polyploid plants likely due to a delayed cell division [5]. Wild and artificial Arabidopsis thaliana auto-tetraploids show different metabolic profiles [7], indicating that polyploidization affects metabolite accumulation. Polyploidy has become a major force in the evolution of both wild and cultivated plants for its ability to confer high environmental adaption and superiority resulting from genome polyploidization [5]. Hybrid vigor has been widely used in breeding to create new cultivars with superior performance and has revolutionized the improvement in plant breeding [8,9]. Both hybridization and polyploidization are fundamental to evolution and are very useful in breeding applications [4].
To date, Populus has been the model system for woody trees due to its small genome size, available genetic background, tree-specific traits, and fast growth speed [10]. The diploid Populus trichocarpa has 19 chromosomes, a genome size of 500 Mb, and a genomic sequence that is publicly available [11]. Both hybridization and polyploidization are widely used for tree breeding [5,9]. Three types of synthetic Populus allo-triploid populations were derived from a hybridization between male gametes and doubled 2n female gametes from the first division restitution (FDR) or second division restitution (SDR) or postmeiotic restitution (PMR) gametes of 2n hybrid F1 [2,3]. All of these allo-triploids have relatively high heterozygosity. Triploid FDR is known to have ~75% of 2n-gamete inherited heterozygosity while triploids SDR and PMR even have 36–39% of inherited heterozygosity [2]. These triploids have been found to exhibit superiority in growth vigor, stress resistance, photosynthesis and timber quality compared with 2n hybrids [2,12]. Further RNA-Seq based transcriptome analyses in these triploids and 2n hybrids show that levels of differentially expressed genes are mostly additive with only a small proportion being biased or non-additive and transgressive [13].
Most studies on polyploidization effects are conducted on non-woody plants [4,5]. Analyses of different Arabidopsis ploid lines show that the ploidy level negatively correlated with lignin and cellulose content, and positively correlated with matrix polysaccharide content in the stem tissue [14]. Gene expression in other polyploid crops like wheat and cotton also displays biased patterns i.e., parental, non-additive, and transgressive besides additive pattern compared with diploid [15,16]. For trees, both autoploid triploid and tetraploid Salix, willow trees, have less lignin and are taller than diploids [17]. Colchicine-induced autotetraploid apple trees (Malus × domestica) with dwarf phenotype have lower hormone levels of indoleacetic acid and brassinosteroid than diploids [18]. However, the effects of triploidization generated directly from hybrid F1 on metabolome abundance in trees remain unknown due to the complexity of polyploidization. Since the triploids have superior growth vigor and great potential in woody tree breeding, the molecular basis by which different composition of triploids affects metabolomic accumulation and growth vigor is of great interest.
In this study, we profiled the metabolomes of apical buds of the 2n hybrid Populus, three populations of allo-triploid Populus, and their progenitor parents with the aim of elucidating the metabolome basis in different allo-triploids and their role in growth rate difference when compared with 2n hybrids. Untargeted metabolites in populations of allo-triploid FDR, SDR and PMR as well as 2n hybrids were examined. We conducted comparative analyses of 235 metabolomic compounds to identify differentially accumulated metabolites with focuses on enriched carbohydrates, secondary metabolites and lipids. We conclude that the metabolite accumulation is genomic polyploidization dependent and partially associated with growth rate in triploid Populus. The knowledge obtained here provides a further understanding of the molecular mechanisms in metabolome changes responsible for superior phenotype in polyploids of the model tree and will help to guide plant breeding.

2. Materials and Methods

2.1. Plant Materials

One-year-old trees were propagated from 16 cm-long cuttings from six trees of each genotype in plastic pots of 35 cm in diameter and 35 cm in depth in Pingdingshan University under natural light and controlled temperature conditions (Henan, China). The 2n hybrid F1 was from a previous cross between Populus pseudo-simonii × P. nigra ‘Zheyin3#’ and P. pyramidalis × P. cathayana cv. ‘Beijingensis’. Allo-triploids namely FDR, SDR and PMR were previously generated from the 2n hybrid F1 [2,3,13]. Briefly, the FDR population is generated from male gametes and non-reduced egg gametes in which chromosomes do not move to the opposite poles during meiosis I. The SDR population is generated from male gametes and non-reduced egg gametes in which no cell plate is formed during sister chromatid separation in meiosis II. The PMR population is generated from male gametes and non-reduced egg gametes in which chromosomes are duplicated after meiosis [2,3,13]. The apical buds were collected from 15 individuals of 2n hybrid F1 Populus, and 15 individuals from each of three allo-triploid populations namely FDR, SDR and PMR, and 15 individuals from their parental progenitors. Tissues from a tree individual were pooled as one sample. Tree height was measured as described previously [13] and grouped into high (G, 10% of the tallest), low (D, 10% of the lowest) and mixed group (H) according the average plant height and base diameter. Collected samples were flash frozen in liquid nitrogen and transferred into a −80 °C freezer until subsequent use. Three independent experiments were conducted and in total 45 individuals from each population were used.

2.2. Metabolites Extraction, Liquid Chromatography–Mass Spectrometry (LC-MS) Metabolomic Profiling, and Data Analysis

Metabolites in each sample were extracted and prepared for analysis using Novelbio’s standard solvent extraction method. The extracted samples were split into equal parts for analysis on the liquid chromatography–mass spectrometry (LC–MS) platform as described previously [19,20]. The LC–MS platform (Shanghai, China) was based on a Waters ACQUITY ultra-performance liquid chromatography (UPLC, Ann Arbor, MI, USA) and a Thermo-Finnigan LTQ mass spectrometer (Thermo Fisher Scientific Inc., PA, USA). Three technical replicates were created from the same homogeneous sample. For the data analysis, the present dataset comprises a total of 323 compounds of known identity (named biochemicals) from Plant Metabolic Network (http://www.plantcyc.org/, accessed on 13 November 2018) was used. After log transformation and imputation with minimum observed values for each compound, Welch’s two-sample t-test p ≤ 0.05 was used to identify significant difference between designed groups.
Identified metabolites were mapped into metabolism pathways at the Kyoto Encyclopedia of Genes and Genomes (KEGG) using the KEGG mapper online (https://www.genome.jp/kegg/, accessed on 18 September 2019) and then the pathways were retrieved.
Principal component analysis was conducted with the R package of Principal Component Analysis (PCA) (version 3.5.2, www.r-project.org, accessed on 15 August 2019) to cluster the distribution of relative abundance of metabolites in all samples. The mean value of three experimental replicates for each sample was used.

2.3. Transcriptome Data and Gene Ontology (GO) Analysis

Transcriptome data was obtained from apical buds of the same population of 2n hybrids and triploid populations and retrieved from previous report [13]. Differentially expressed genes (DEGs) number and associated gene ontology (GO) enrichment followed previously reported procedures [13]. Briefly, the cleaned transcriptome reads from RNA-Seq were mapped to Populus trichocarpa reference genome [11] with TopHat [21] and the abundance of transcripts was calculated in fragments per kilobase of exon per million mapped reads (FPKM) with HTSeq [22], and then the DEGs were identified with limma package in R language [23,24]. GO term analysis of DEGs was done by mapping against the GO database (http://www.geneontology.org/, accessed on 20 January 2019) and GO terms with a Bonferroni–Holm corrected FDR <0.05 were considered significantly enriched. Package ggplot2 in R language [24,25] was used to create the graph for GO enrichment in the biological process category.

3. Results

3.1. Identification and Clusters of Metabolites in Diploid and Triploid Populus

To understand the effects of polyploidization in polyploids on metabolite accumulation, we examined the profiles of accumulated metabolomes in the apical buds of 2n hybrid F1, allo-triploids, and their progenitor poplars using LC–MS assays. Three populations from three triploid lines FDR, SDR and PMR reported previously were used (Figure 1a) [2,3]. To further characterize the effects on growth vigor, we also measured the plant height and classified individuals in each hybrid population into low (D, 10% of the lowest plants), high (G, 10% of the tallest plants) and mixed (H, all plants) subgroups, and 15 individuals in each subgroup were assayed with LC–MS. Overall, we identified and relatively quantified 235 metabolites commonly presented in each individual. Nine compounds, namely betaine, stachydrine, fructose 1,6-diphosphate, glucose 1,6-diphosphate, myo-inositol 1,4 or 1,3-diphosphate, fructose-6-phosphate, glycerate and xylulose were more abundant (p < 0.05) in all allo-triploids than in 2n hybrids. The abundance of 20 and 19 metabolites was higher and lower (p < 0.05) in at least one and two types of allo-triploids, respectively, than that in 2n hybrids. However, the alterations were not commonly shared by three types of allo-triploids.
Metabolism pathway mapping analysis revealed all metabolites were involved in eight super-pathways, 43 sub-pathways especially in amino acid pathways, secondary metabolism associated pathways, carbohydrate pathway and lipid pathway (Figure 1b). PCA analysis revealed that four major primary components, which explained 21.1%, 17.5%, 14.0%, and 11.7% of the variance in abundance of metabolic compounds among 2n hybrids, allo-triploids and two progenitors, respectively (Figure 1c). The relative abundance of metabolites in allo-triploids and 2n hybrids colocalizes into distinct clusters corresponding to ploidy, whereas three types of allo-triploids are in closely relative clusters with overlapping, meaning a higher similarity in the abundance of metabolites but some are allo-triploid specific.
Among all detected metabolites, 181 compounds were mapped to pathways at the KEGG database (https://www.genome.jp/kegg/, accessed on 18 September 2019). The top pathways with the higher number of detected metabolites were general metabolic pathways, biosynthesis of secondary metabolites, ABC transporters, and biosynthesis of amino acids, etc. (Table 1).

3.2. Alteration of Primary Metabolite Carbohydrate in Allo-Triploids

To investigate the effects of polyploidization on carbohydrates, we compared the abundance of 49 commonly identified metabolites in the carbohydrate super-pathway between allo-triploids and 2n hybrids, and between the subgroups with different plant heights in triploids relative to 2n hybrids (Table 2, Table S1). Comparison within the mixed subgroup H revealed that five (1,3-dihydroxyacetone, Isobar, erythronate, xylose, and mannose-6-phosphate) and three compounds (glycerate, pyruvate, and N-acetylglucosamine) were found to have increased and reduced abundance (p < 0.05) in allo-triploids than those in 2n hybrids, respectively, meaning an overall association between these metabolites and polyploidization. For subgroup D with a low-growth phenotype, seven altered metabolites exhibited a significantly higher abundance (p < 0.05) in triploids than in 2n hybrids. Of those, the malate was commonly increased among three types of triploids FDR, SDR and PMR, indicating the malate is a key metabolite responsible for the low-growth phenotype in spite of composition differences of triploids. For subgroup G with a high-growth phenotype, comparison showed that two and five metabolites exhibited higher and lower abundance (p < 0.05) in one or two triploids than those in 2n hybrids, respectively. The significantly altered metabolites were not shared between the low-growth subgroup and the high-growth subgroup except raffinose, which shouldn’t be associated with growth rate, indicating that the growth rate is controlled by at least two different sets of metabolites.

3.3. Alteration in Secondary Metabolites between Diploid and Triploid Populus

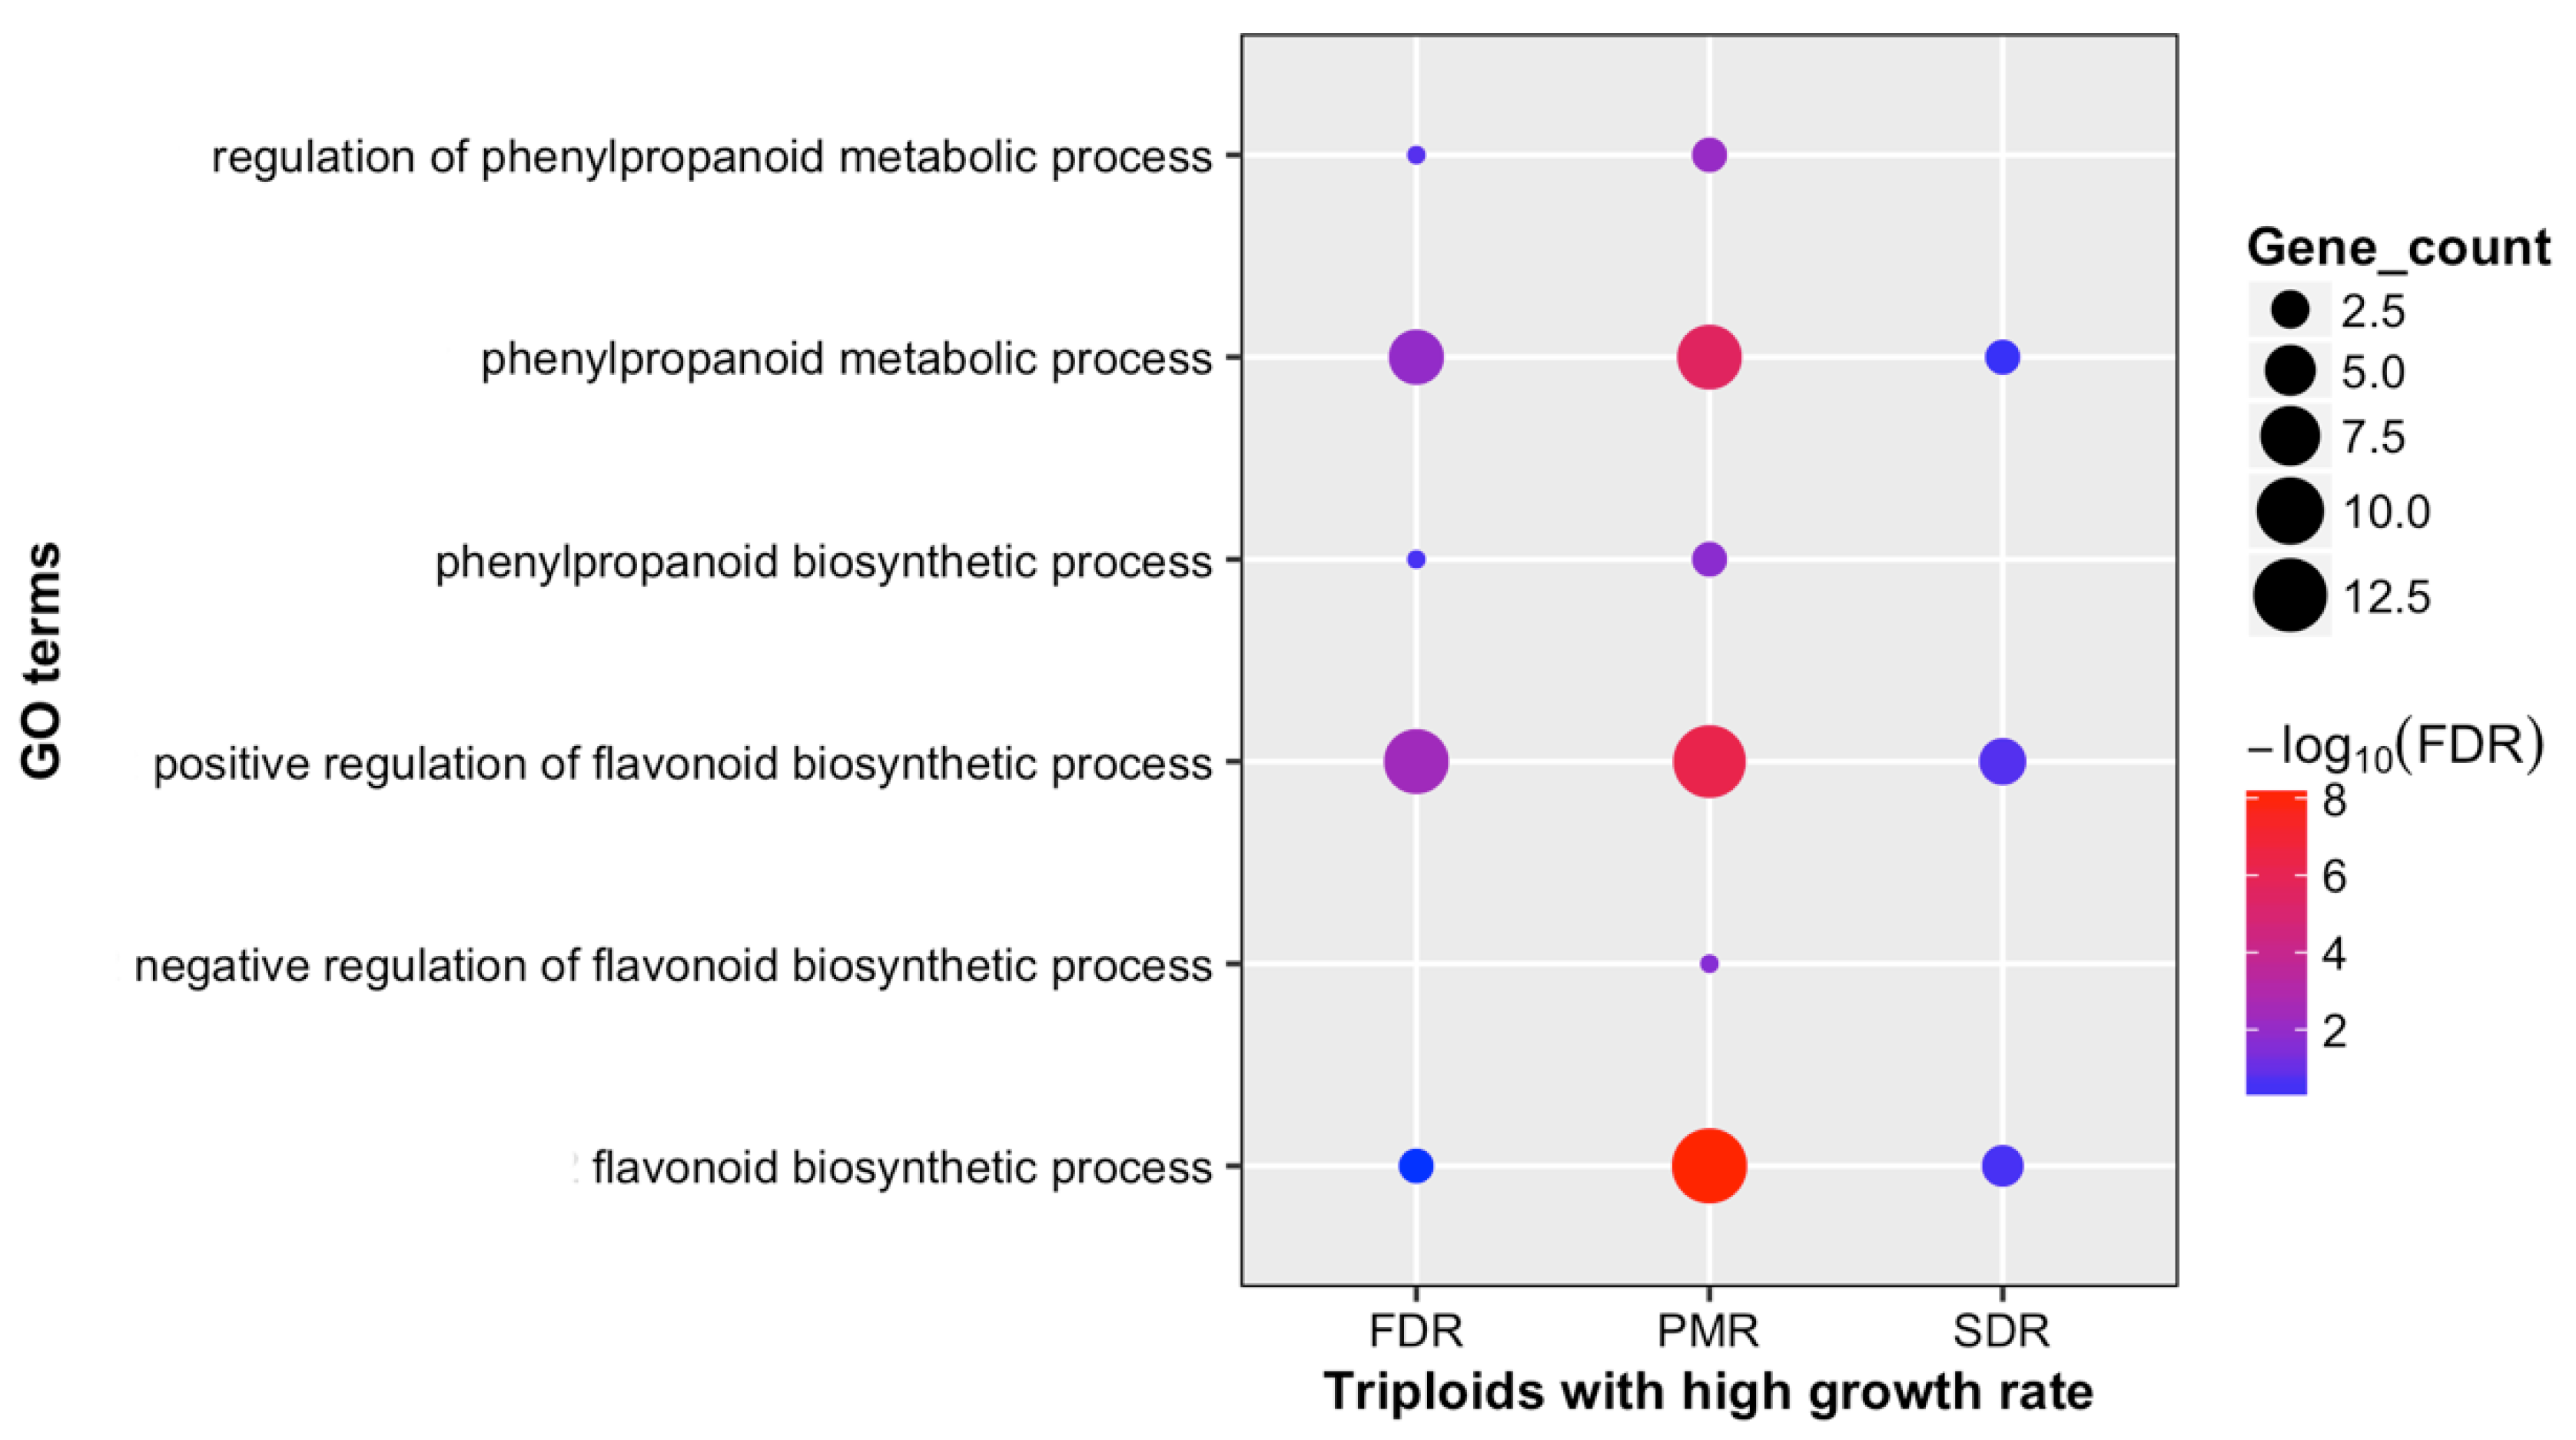
Fifty one compounds, 22% of all detected metabolites belonging to secondary metabolites, were identified. 75% of those are flavonoids (22 out of 51) and phenylpropanoids (16 out of 51). Overall, polyploidization caused an increased accumulation of flavonoids in triploids compared with that in diploid 2n hybrids (Table S2). For each of the subgroups G, D and H, we also compared the secondary metabolites with those in 2n hybrids. In the subgroup G with high growth rate, the abundance of dihydrokaempferol, dihydroquercetin, hesperetin and quercetin was increased (p < 0.05) in triploids, suggesting a positive association. In the subgroup D, the abundance of eriodictyol, quercitrin, kaempferol-3-rhamnoside and pinostrobin was increased while the levels of cyanidin galactoside, quercetin-3-o-glucoside, rutin and ponciretin were decreased in triploids compared with in 2n hybrids. Since the high growth rate phenotype is of importance in breeding, we further checked the expressional regulation of genes on these flavonoids and gene ontology of the differentially expressed genes (DEGs) identified in previous RNA-Seq data [13]. Results showed the GO terms and DEGs were enriched in the biosynthesis and positive regulatory pathways of flavonoids, consistent with changes in metabolites (Figure 2). In the mixed subgroup H, no significant change in flavonoids was found, indicating a high variance within population.
Thirteen out of 19 detected phenylpropanoids showed altered accumulation. In the subgroup D, the levels of 3,4-dimethoxycinnamic acid and isoferulate were significantly increased (p < 0.05) in both triploids FDR and PMR while an observed increase trend was not significant in triploids SDR compared with those in 2n hybrids. In the subgroup G, the level of vanillin was decreased significantly (p < 0.05) while the level of caffeate was significantly increased in all allo-triploids relative to 2n hybrids (p < 0.05). Similarly, the GO terms of DEGs were enriched in biosynthesis, metabolic and regulatory pathways of phenylpropanoids in the RNA-Seq transcriptome analysis, meaning expressional regulation on the phenylpropanoids in triploids (Figure 2).
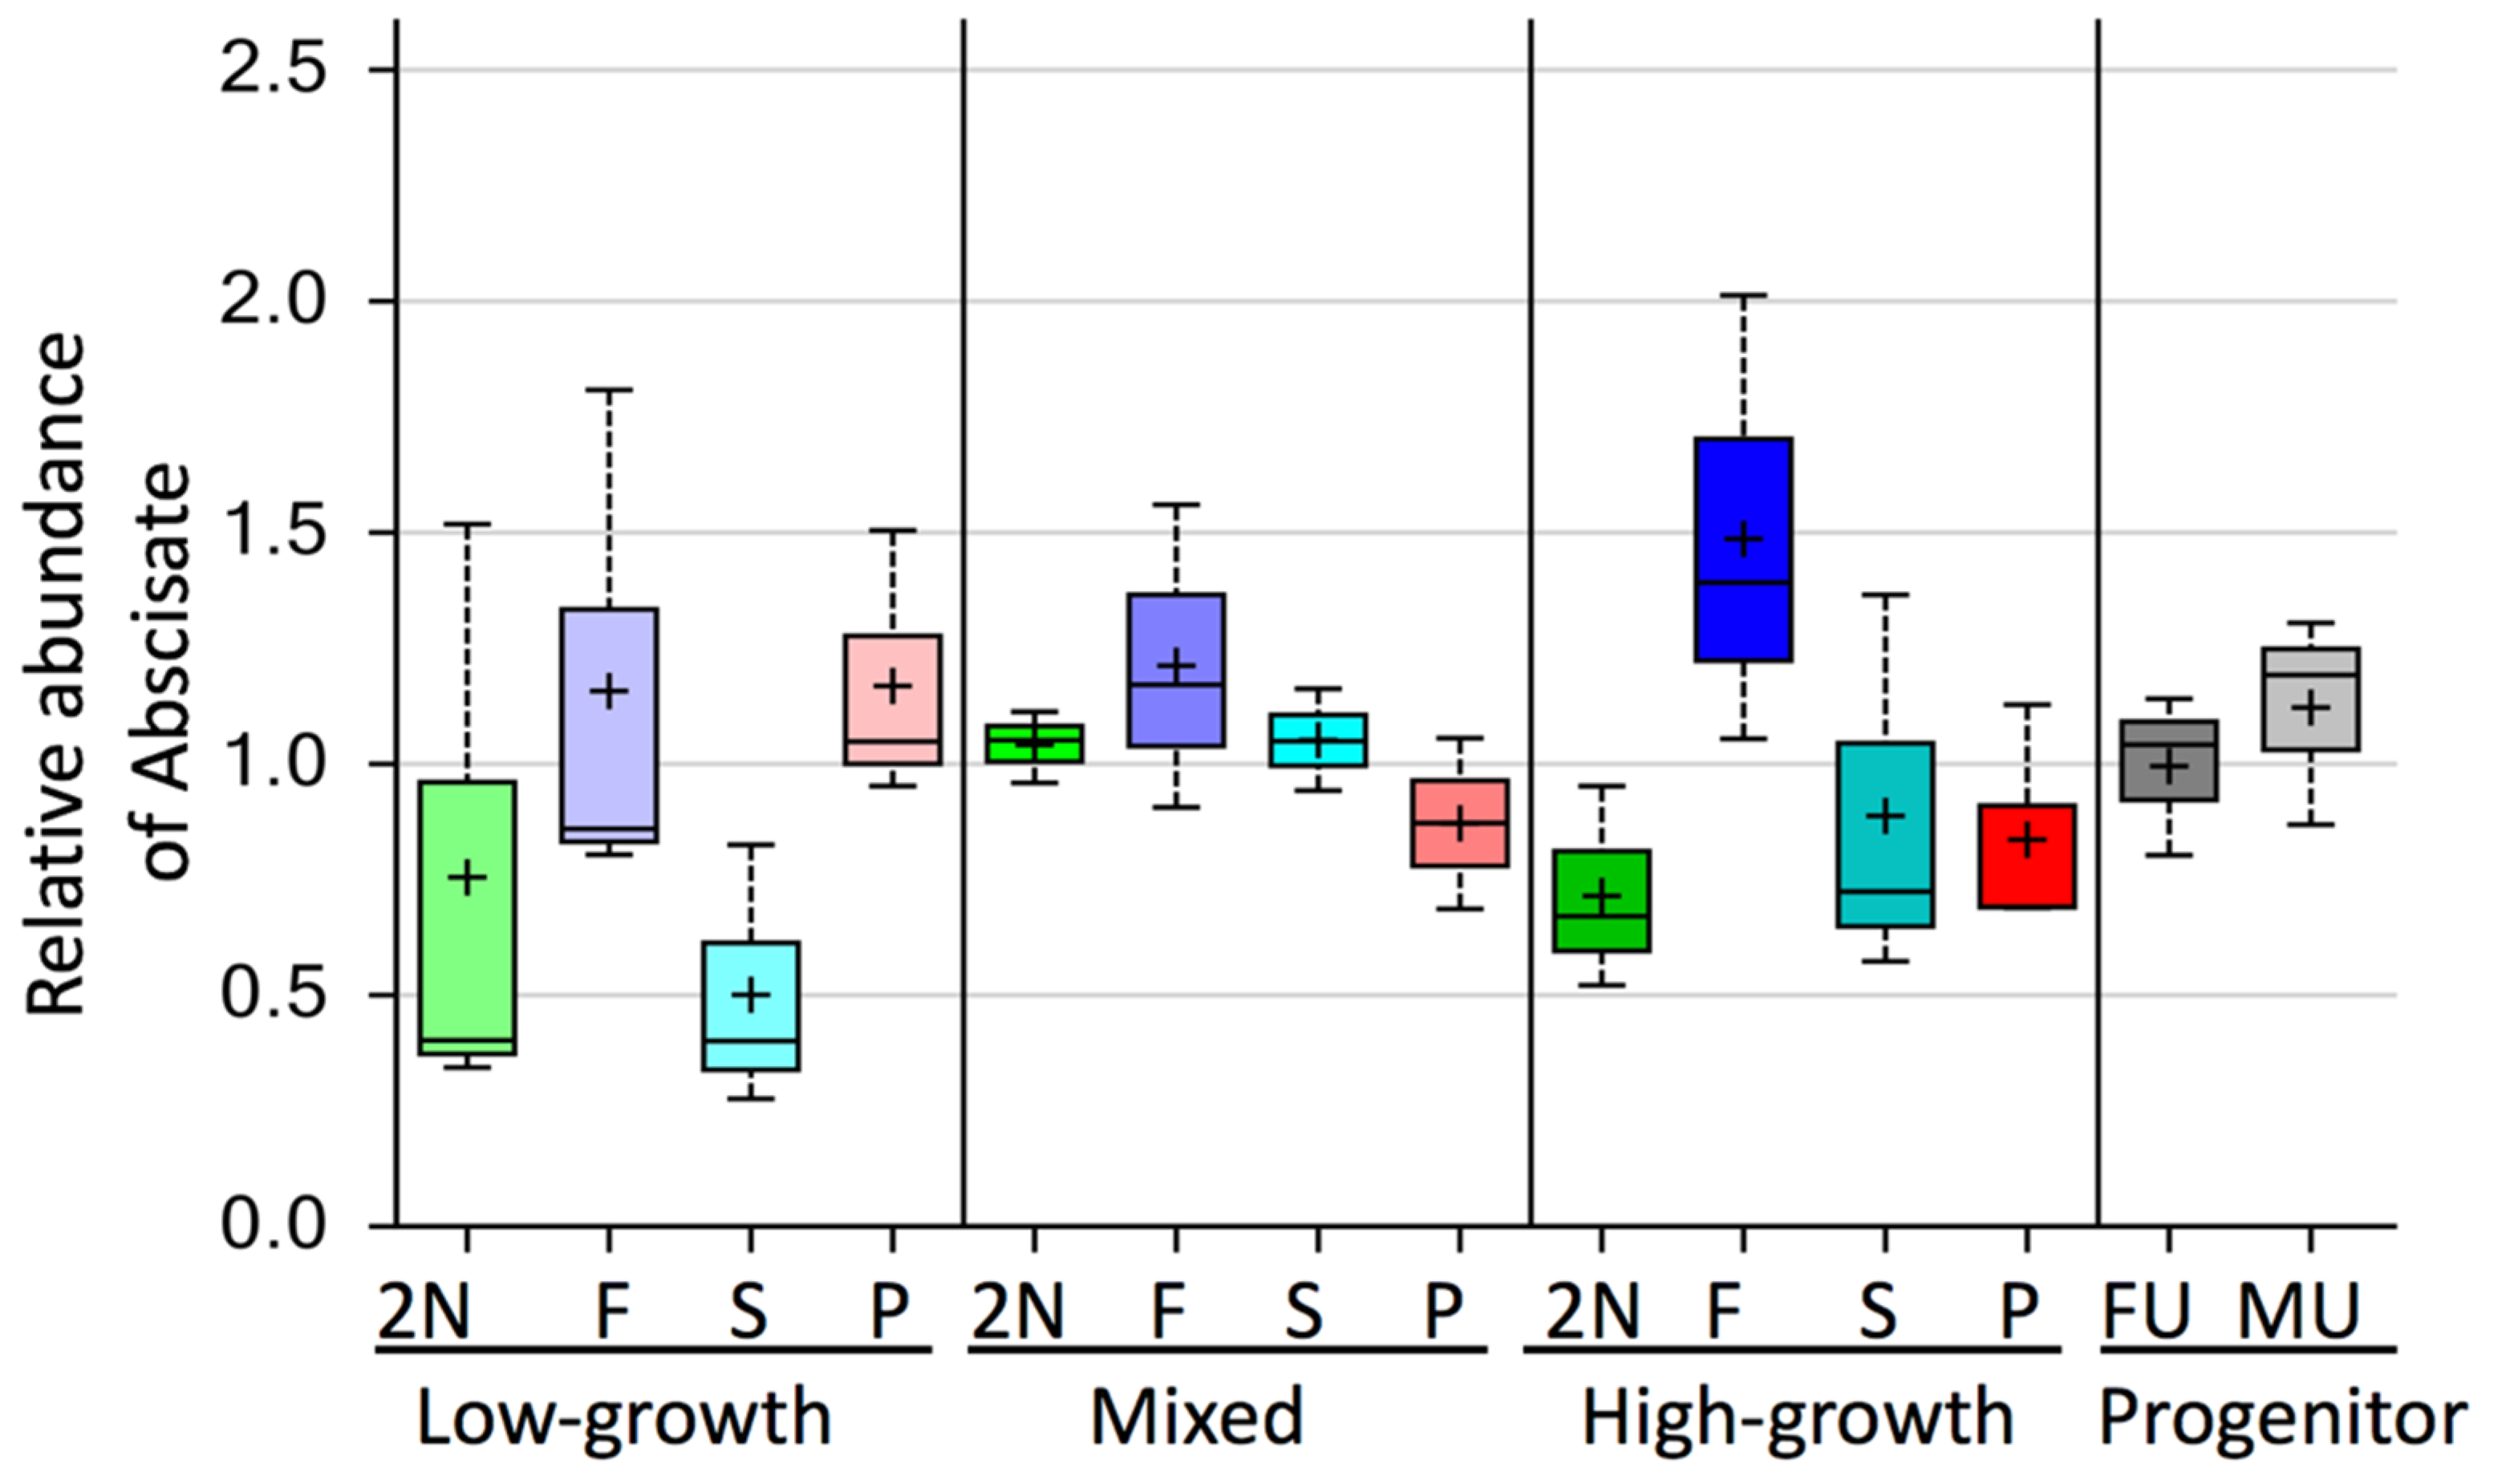
For the hormone associated metabolites, only the abscisate in the abscisic acid (ABA) pathway was identified in this study. Comparisons showed that a higher level of abscisate was present in all subgroups of triploids FDR than in 2n hybrids (Figure 3).

3.4. Difference in Lipids between Dipoid and Triploid Populus

In total, 47 metabolites in the lipid category belonging to eight sub-pathways were identified (Table S3). Most of those are phospholipids (19), followed by free fatty acids (10) and then by glycerolipids (8). Compared with those in 2n hybrids, polyploidization caused an increased accumulation of 2-hydroxypalmitate in the free fatty acid category and phytosphingosine in the sphingolipid category in allo-triploidy subgroup H of FDR and SDR, respectively. However, 1-linolenoylglycerol in glycerolipids was reduced in both subgroups H of SDR and PMR. In addition, the abundance of 1-oleoylglycerophosphocholine (18:1) and 1-palmitoylglycerophosphoethanolamine (16:0) in the phospholipids was reduced in allo-triploid SDR subgroup H when compared with those in 2n hybrids. No common lipid metabolite was found to be increased or decreased across three types of allo-triploids, suggesting that the lipid content is highly dependent on the type of genotype.

4. Discussion

Hybridization merges genomic variance, which increases the genetic heterozygosity. Polyploidization duplicates the whole genome both naturally in major evolutional transitions and artificially, enabling polyploids to outperform their diploid relatives [4,5]. However, the mechanisms for effect of genomic polyploidization in polyploid hybrids on metabolites remain largely unclear and, to our best knowledge, have not been reported in allo-triploids of trees. Here, we used triploid and diploid hybrids as the research system, which harbored rich and different genomic compositions from both polyploidization and hybridization, in order to gain clues about these mechanisms. Previous studies mainly have focused on physiological, expressional, cellular and metabolomic differences in polyploids compared with 2n hybrids [2,3,4,5,15,16]. However, no report has yet investigated the changes of metabolites in allo-polyploids with different sub-genome duplications at population level. Here, we used three types of populations of triploids, which have different sub-genome duplications. Results of the metabolite changes in apical buds between triploid populations and 2n hybrids of Populus provide informative molecular basis of polyploidization’s effects on metabolite accumulation and growth vigor. We found the metabolite contents were associated with the composition of hybrid genomes and fell into with hybrid-specific clusters of colocalization in PCA. The key difference between triploids with different sub-genome duplications and 2n hybrids is the differential accumulation of important primary carbohydrates; the association of significant changes in metabolites with plant height suggests that polyploidization effects growth vigor in hybrids. The combined results may explain the superiority in triploid hybrids than diploid hybrids. Thus, the metabolite differences in hybrids provide very informative molecular basis conferring effects of genomic polyploidization on metabolites and growth rate with polyploidization and hybridization, which is very important in modern breeding [4].
A fast-growth rate is one of common features of hybrid vigor. Compared with the 2n hybrids, the growth vigor varies in allo-triploids with different plant heights, which could be caused by genome instability, genome dosage, heterozygosity differences, genomic rearrangements, genomic epigenetic modifications and gene sub-functionalization [1]. This is supported by the very high heterozygosity in triploid SDR and a relatively low heterozygosity in FDR and PMR triploids [2,3]. Here, the observed primary carbohydrates and secondary metabolites were casually associated with plant height in all allo-triploids, which may suggest a common dosage effect on metabolites resulting from genome polyploidization. Most DEG expression is positively correlated with metabolite contents in triploids, which could be due to the fact that the DEGs are enzyme encoding genes [13]. Therefore, these metabolites could be further developed into molecular markers for growth vigor selection in breeding. In addition, to track these metabolite changes in the progeny of the interested triploids is worthy of further investigation. Plant hormones, i.e., auxin, are well known to play very important roles in growth [26]. However, the plant hormones were not well identified in our metabolome dataset. Additional efforts may be taken for the further plant hormones detection considering the novel advances in hormone analysis [27].
Interestingly, the changes of many differentially accumulated flavonoids and phenylpropanoids were presented in allo-triploids when compared with those in the 2n hybrids. This deserves consideration because the flavonoids are mainly involved in plant immunity, defense and flavor molecules [28,29]. Changes in flavonoids and phenylpropanoids might increase immunity and defense to ensure growth vigor in triploids, which could be of priority in future investigation for the association mapping using a method called metabolite quantitative trait loci analysis [30]. Our previous transcriptome comparisons show that the DEGs between hybrids are involved in stress responses [13]. Thus, taking metabolome analyses into account here, we propose that the polyploidization in polyploids increases the defense against stress via flavonoids and phenylpropanoids. This is worthy of further investigation in the future. The results of small change in lipid contents indicate that lipids are pretty stable in apical buds even after polyploidization no matter which sub-genome is duplicated in the triploids. Therefore, the lipids may be not the important metabolites resulting from polyploidy in one-year old trees. Of course, some metabolites are triploid-specific which may be related to the variance that comes with the formation of triploids.

5. Conclusions

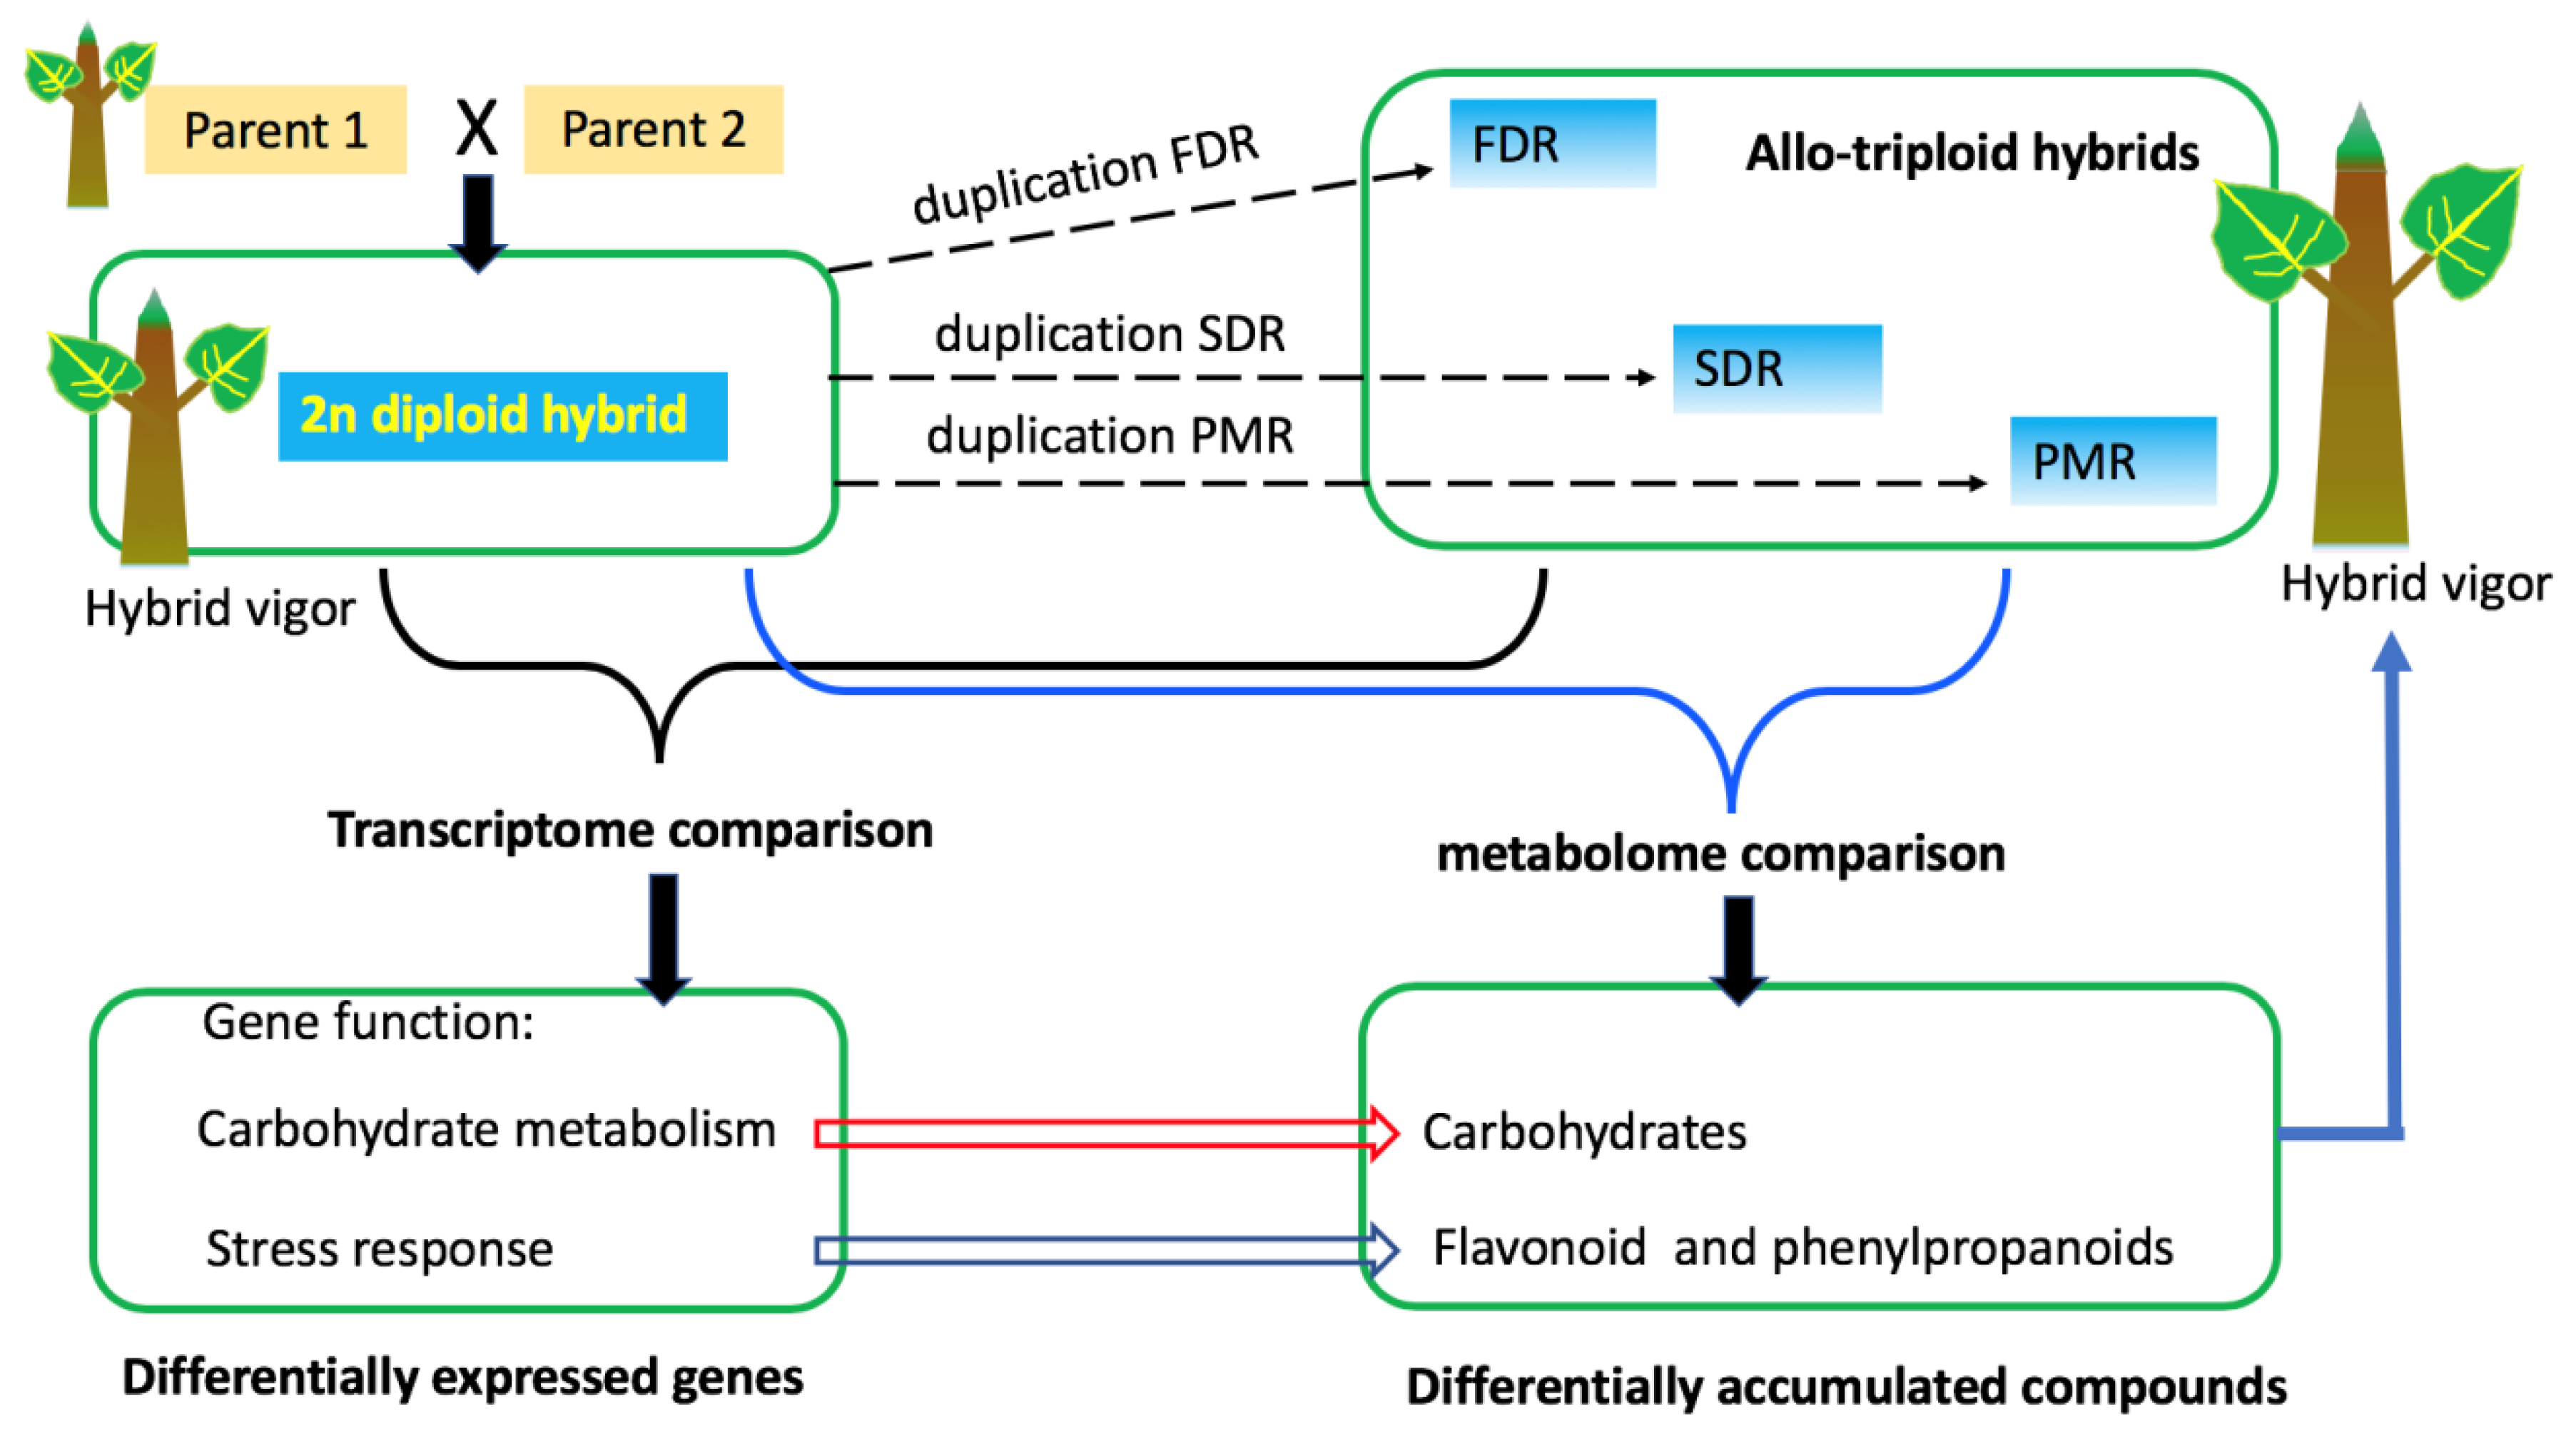
In summary, we identified the differences in 235 metabolites in apical buds between allo-triploids and 2n hybrids using metabolome profiling. The abundance of metabolites in triploids and 2n hybrids forms different clusters, meaning there is a different metabolic basis for the hybrid vigor resulting from the polyploidization in triploids. Major changes of metabolites occur in primary carbohydrates and secondary metabolites, i.e., flavonoids, which show a strong association with growth vigor. The differential gene expression resulting from polyploidization in triploids may positively regulate the metabolite accumulation. We summarized the scheme of gene expression and associated major regulation on metabolites in triploids in Figure 4. Finally, we have concluded that the polyploidization confers changes in gene expression and metabolites, especially carbohydrates and secondary metabolites in triploid hybrids, which leads to the hybrid vigor. The results elucidate an informative metabolomics basis for superior growth vigor in polyploidy Populus.

Supplementary Materials

The following are available online at https://www.mdpi.com/1999-4907/10/12/1091/s1: Table S1. The carbohydrates metabolites in Populus, Table S2. Secondary metabolites and their comparison in Populus, Table S3. Lipids and their comparison in Populus.

Author Contributions

Conceptualization, S.C. and X.W.; methodology, S.C. and Y.Z.; formal analysis, S.C. and Y.Z.; investigation, S.C. and X.W.; writing—original draft preparation, S.C. and X.W.; writing—review and editing, X.W.; funding acquisition, S.C.

Funding

This work was jointly funded by Scientific Research Foundation for Natural Science Fund of China, grant number 31600527, Introduction of talent of Pingdingshan University, grant number PXY-BSQD2016009, Key Research Project of Colleges and Universities of Henan Province, grant number 182102110132, 172102110111, and 16A220004.

Conflicts of Interest

The authors declare no conflict of interest. The funders had no role in the design of the study; in the collection, analyses, or interpretation of data; in the writing of the manuscript, or in the decision to publish the results.

References

  1. Doyle, J.J.; Coate, J.E. Polyploidy, the Nucleotype, and Novelty: The Impact of Genome Doubling on the Biology of the Cell. Int. J. Plant Sci 2018, 180, 1–52. [Google Scholar] [CrossRef]
  2. Dong, C.-B.; Suo, Y.-J.; Kang, X.-Y. Assessment of the genetic composition of triploid hybrid Populus using SSR markers with low recombination frequencies. Can. J. For. Res. 2014, 44, 692–699. [Google Scholar] [CrossRef]
  3. Wang, J.; Kang, X.Y. Distribution of Microtubular Cytoskeletons and Organelle Nucleoids During Microsporogenesis in a 2n Pollen Producer of Hybrid Populus. Silvae Genet. 2009, 58, 220–226. [Google Scholar] [CrossRef]
  4. Alix, K.; Gerard, P.R.; Schwarzacher, T.; Heslop-Harrison, J.S.P. Polyploidy and interspecific hybridization: Partners for adaptation, speciation and evolution in plants. Ann. Bot. 2017, 120, 183–194. [Google Scholar] [CrossRef] [PubMed]
  5. Sattler, M.C.; Carvalho, C.R.; Clarindo, W.R. The polyploidy and its key role in plant breeding. Planta 2016, 243, 281–296. [Google Scholar] [CrossRef]
  6. Cheng, F.; Wu, J.; Cai, X.; Liang, J.; Freeling, M.; Wang, X. Gene retention, fractionation and subgenome differences in polyploid plants. Nat. Plants 2018, 4, 258–268. [Google Scholar] [CrossRef]
  7. Vergara, F.; Rymen, B.; Kuwahara, A.; Sawada, Y.; Sato, M.; Hirai, M.Y. Autopolyploidization, geographic origin, and metabolome evolution in Arabidopsis thaliana. Am. J. Bot. 2017, 104, 905–914. [Google Scholar] [CrossRef]
  8. Hochholdinger, F.; Hoecker, N. Towards the molecular basis of heterosis. Trends Plant Sci. 2007, 12, 427–432. [Google Scholar] [CrossRef]
  9. Chen, Z.J. Genomic and epigenetic insights into the molecular bases of heterosis. Nat. Rev. Genet. 2013, 14, 471–482. [Google Scholar] [CrossRef]
  10. Jansson, S.; Douglas, C.J. Populus: A model system for plant biology. Annu. Rev. Plant Biol. 2007, 58, 435–458. [Google Scholar] [CrossRef]
  11. Tuskan, G.A.; DiFazio, S.; Jansson, S.; Bohlmann, J.; Grigoriev, I.; Hellsten, U.; Putnam, N.; Ralph, S.; Rombauts, S.; Salamov, A.; et al. The Genome of Black Cottonwood, Populus trichocarpa. Science 2006, 313, 1596–1604. [Google Scholar] [CrossRef] [PubMed]
  12. Cheng, S.; Huang, Z.; Suo, Y.; Wang, J.; Kang, X. Gene expression differences associated with growth vigor in Populus full-sib allotriploid progeny following manipulated first division restitution of the diploid maternal parent. Euphytica 2015, 203, 683–700. [Google Scholar] [CrossRef]
  13. Cheng, S.; Yang, J.; Liao, T.; Zhu, X.; Suo, Y.; Zhang, P.; Wang, J.; Kang, X. Transcriptomic changes following synthesis of a Populus full-sib diploid and allotriploid population with different heterozygosities driven by three types of 2n female gamete. Plant Mol. Biol. 2015, 89, 493–510. [Google Scholar] [CrossRef] [PubMed]
  14. Corneillie, S.; De Storme, N.; Van Acker, R.; Fangel, J.U.; De Bruyne, M.; De Rycke, R.; Geelen, D.; Willats, W.G.T.; Vanholme, B.; Boerjan, W. Polyploidy Affects Plant Growth and Alters Cell Wall Composition. Plant Physiol. 2019, 179, 74–87. [Google Scholar] [CrossRef]
  15. Yoo, M.J.; Szadkowski, E.; Wendel, J.F. Homoeolog expression bias and expression level dominance in allopolyploid cotton. Heredity (Edinb) 2013, 110, 171–180. [Google Scholar] [CrossRef]
  16. Powell, J.J.; Fitzgerald, T.L.; Stiller, J.; Berkman, P.J.; Gardiner, D.M.; Manners, J.M.; Henry, R.J.; Kazan, K. The defence-associated transcriptome of hexaploid wheat displays homoeolog expression and induction bias. Plant Biotechnol. J. 2017, 15, 533–543. [Google Scholar] [CrossRef]
  17. Serapiglia, M.J.; Gouker, F.E.; Hart, J.F.; Unda, F.; Mansfield, S.D.; Stipanovic, A.J.; Smart, L.B. Ploidy Level Affects Important Biomass Traits of Novel Shrub Willow (Salix) Hybrids. BioEnergy Res. 2015, 8, 259–269. [Google Scholar] [CrossRef]
  18. Ma, Y.; Xue, H.; Zhang, L.; Zhang, F.; Ou, C.; Wang, F.; Zhang, Z. Involvement of Auxin and Brassinosteroid in Dwarfism of Autotetraploid Apple (Malus × domestica). Sci. Rep. 2016, 6, 26719. [Google Scholar] [CrossRef]
  19. Evans, A.M.; DeHaven, C.D.; Barrett, T.; Mitchell, M.; Milgram, E. Integrated, nontargeted ultrahigh performance liquid chromatography/electrospray ionization tandem mass spectrometry platform for the identification and relative quantification of the small-molecule complement of biological systems. Anal. Chem. 2009, 81, 6656–6667. [Google Scholar] [CrossRef]
  20. Oliver, M.J.; Guo, L.; Alexander, D.C.; Ryals, J.A.; Wone, B.W.M.; Cushman, J.C. A Sister Group Contrast Using Untargeted Global Metabolomic Analysis Delineates the Biochemical Regulation Underlying Desiccation Tolerance in Sporobolus stapfianus. Plant Cell 2011, 23, 1231–1248. [Google Scholar] [CrossRef]
  21. Trapnell, C.; Pachter, L.; Salzberg, S.L. TopHat: Discovering splice junctions with RNA-Seq. Bioinformatics 2009, 25, 1105–1111. [Google Scholar] [CrossRef] [PubMed]
  22. Anders, S.; Pyl, P.T.; Huber, W. HTSeq—A Python framework to work with high-throughput sequencing data. Bioinformatics 2015, 31, 166–169. [Google Scholar] [CrossRef] [PubMed]
  23. Ritchie, M.E.; Phipson, B.; Wu, D.; Hu, Y.; Law, C.W.; Shi, W.; Smyth, G.K. Limma powers differential expression analyses for RNA-sequencing and microarray studies. Nucleic Acids Res. 2015, 43, e47. [Google Scholar] [CrossRef] [PubMed]
  24. R Development Core Team. R: A Language and Environment for Statistical Computing; R Foundation for Statistical Computing: Vienna, Austria, 2018. [Google Scholar]
  25. Wickham, H. ggplot2: Elegant Graphics for Data Analysis; Springer: New York, NY, USA, 2009. [Google Scholar]
  26. Zhao, Y. Auxin biosynthesis and its role in plant development. Annu. Rev. Plant Biol. 2010, 61, 49–64. [Google Scholar] [CrossRef]
  27. Walton, A.; Stes, E.; De Smet, I.; Goormachtig, S.; Gevaert, K. Plant hormone signalling through the eye of the mass spectrometer. Proteomics 2015, 15, 1113–1126. [Google Scholar] [CrossRef]
  28. Yonekura-Sakakibara, K.; Higashi, Y.; Nakabayashi, R. The Origin and Evolution of Plant Flavonoid Metabolism. Front. Plant Sci. 2019, 10, 943. [Google Scholar] [CrossRef]
  29. Mathesius, U. Flavonoid Functions in Plants and Their Interactions with Other Organisms. Plants (Basel, Switzerland) 2018, 7, 30. [Google Scholar] [CrossRef]
  30. Morreel, K.; Goeminne, G.; Storme, V.; Sterck, L.; Ralph, J.; Coppieters, W.; Breyne, P.; Steenackers, M.; Georges, M.; Messens, E.; et al. Genetical metabolomics of flavonoid biosynthesis in Populus: A case study. Plant J. 2006, 47, 224–237. [Google Scholar] [CrossRef]
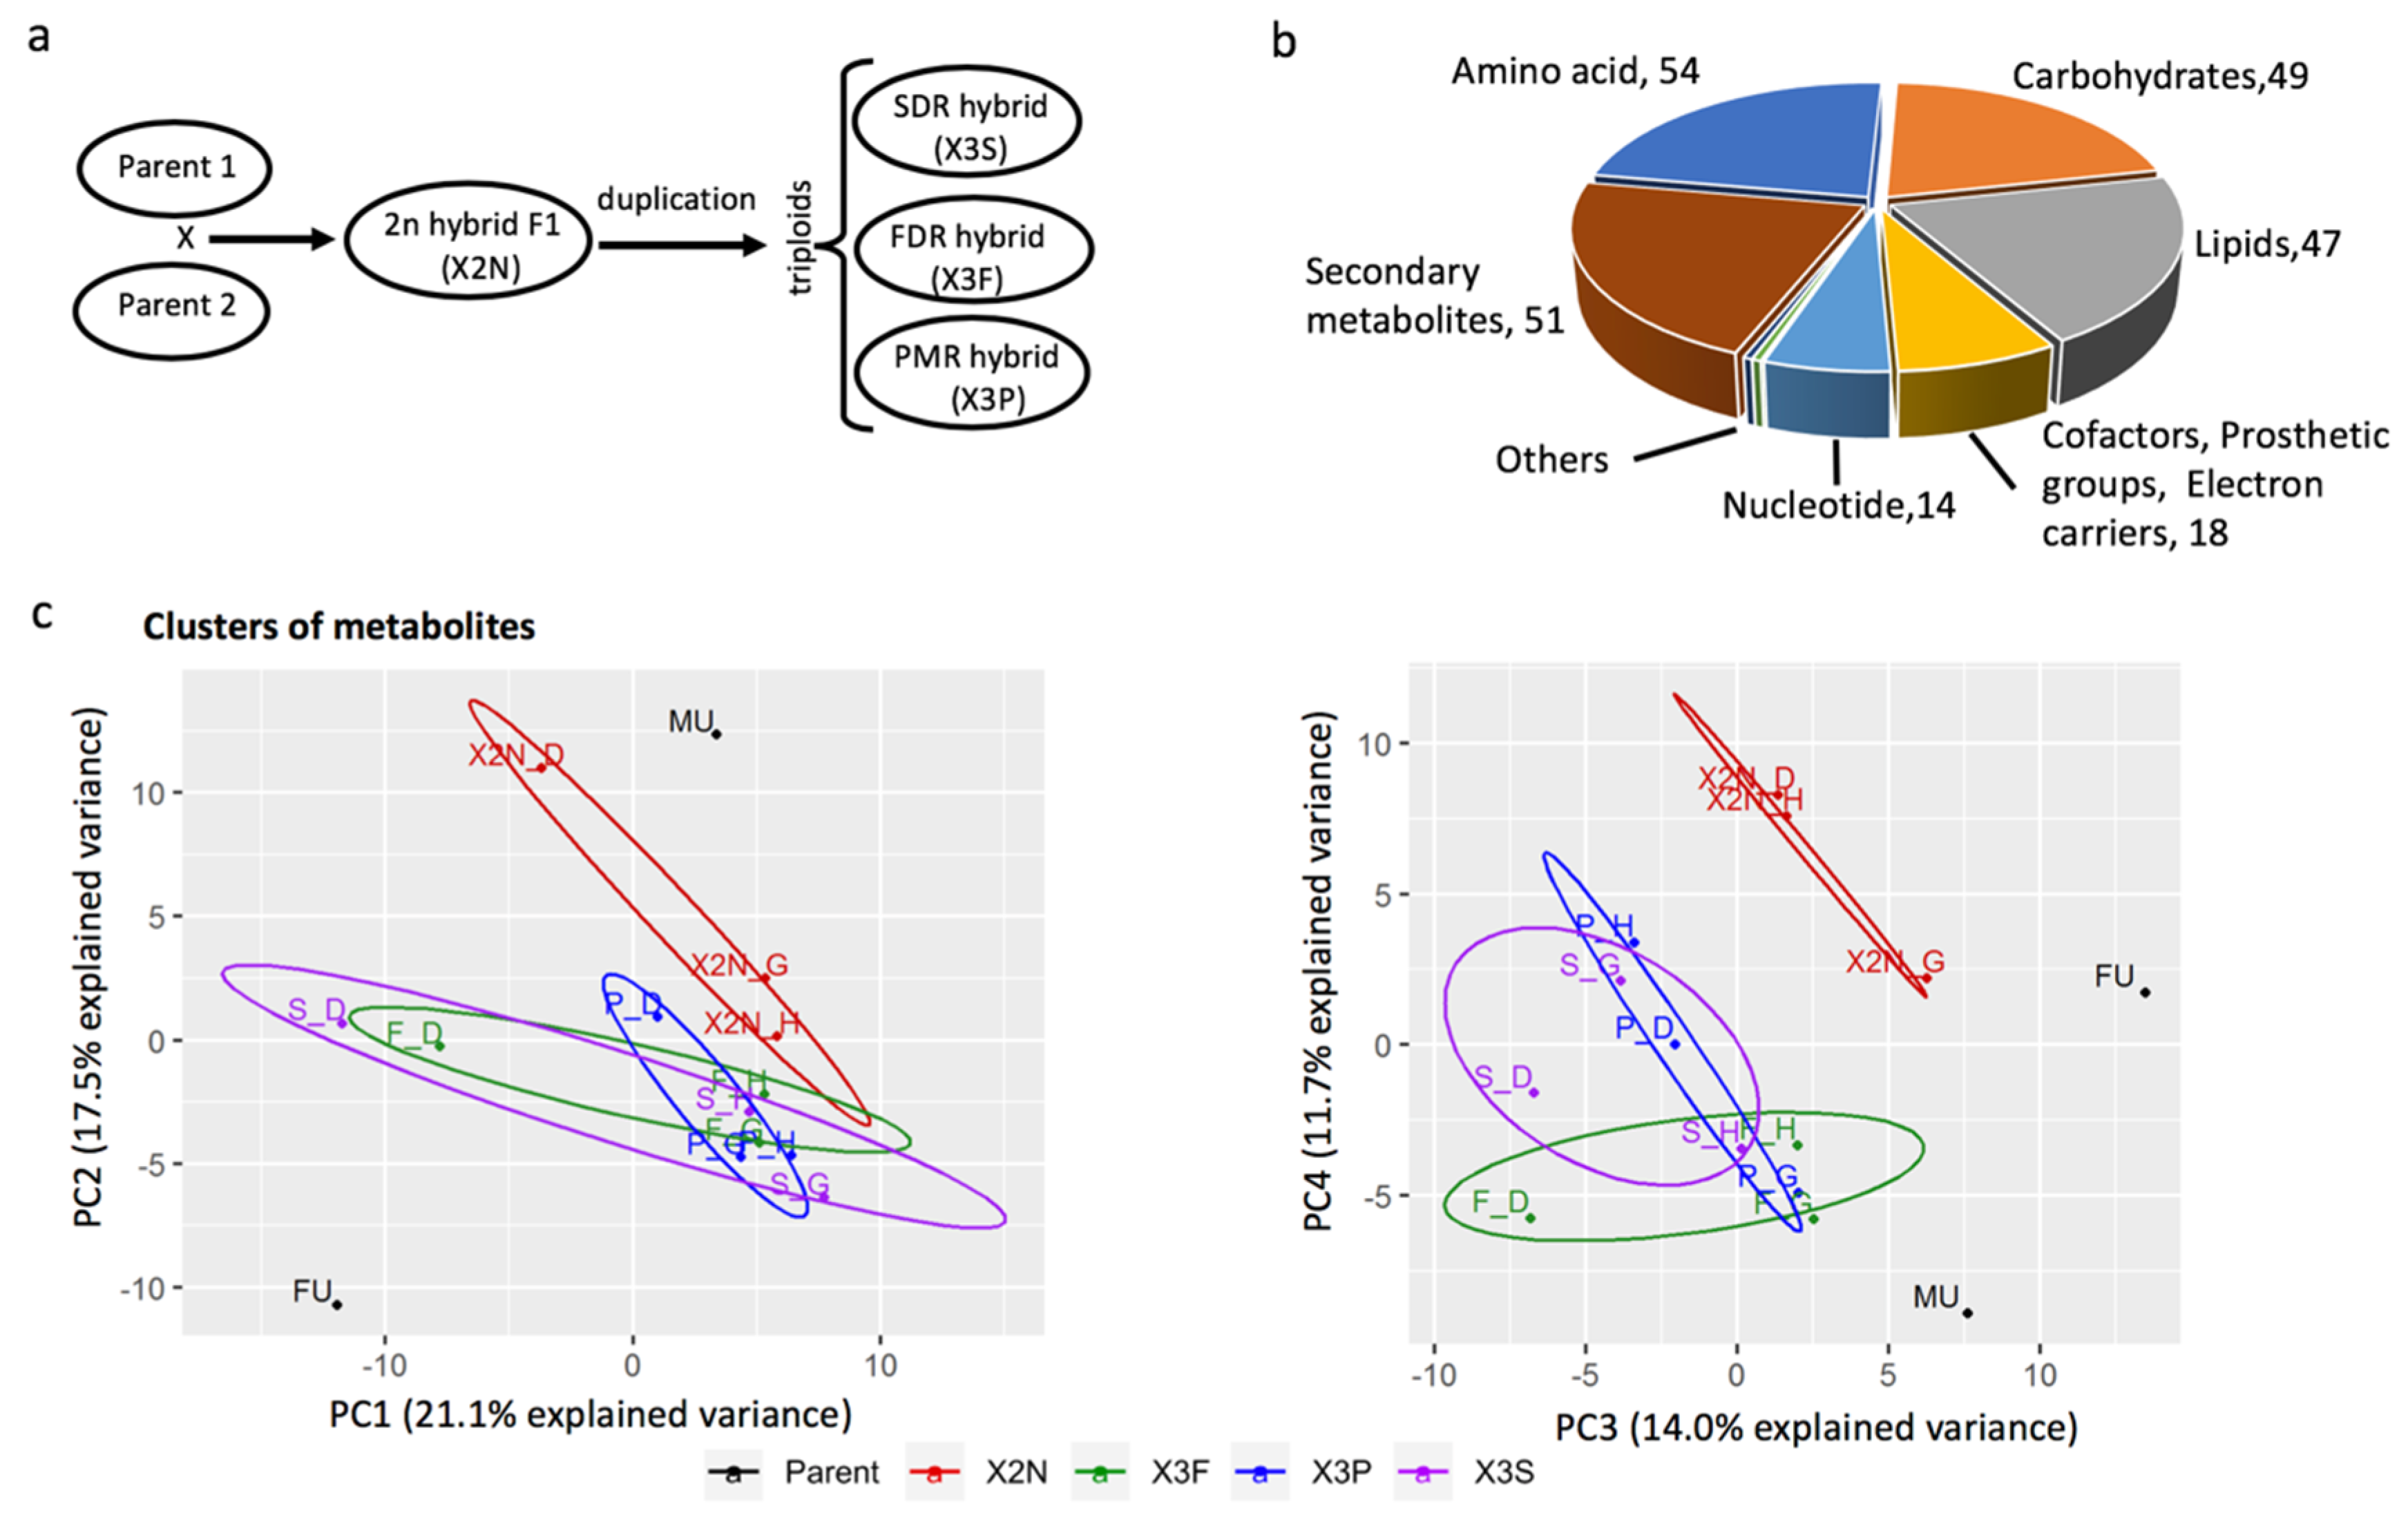
Figure 1. Metabolites, clustering of metabolite abundance in population of 2n hybrids, allo-triploids and progenitors of Populus. (a) The origins of 2n hybrids, allo-triploid hybrids; (b) The distribution of abundance of metabolites detected in all hybrids, the number showing the number of metabolites in each category; (c) The clusters of colocalized metabolites via principal components analysis. The mean abundance of each compound in each sample was used for the principal component analysis. X2N, X3F, X3P and X3S represent the hybrid population of diploid 2n hybrid F1, populations of allo-triploid first division restitution (FDR), postmeiotic restitution (PMR) and second division restitution (SDR), respectively. Data are from 15 individuals of each population and three experimental replicates were conducted. FU and MU represent the female and male progenitors of 2n hybrids.
Forests 10 01091 g001
Figure 2. Enriched pathways of differentially expressed genes involved in metabolisms of flavonoids and phenylpropanoids in hybrids of Populus. Differentially expressed genes (DEGs) were identified in apical buds of triploids of FDR, PMR and SDR compared with those in 2n hybrids of Populus via RNA-Seq analysis. Gene ontology (GO) was enriched for these DEGs involved in metabolisms of flavonoids and phenylpropanoids. Gene count is the number of DEGs and FDR represents false discovery rate. Only the significantly enriched DEGs were plotted.
Forests 10 01091 g002
Figure 3. Boxplot showing the abscisate levels in diploids and triploids. 2N, F, P, S represent the hybrid populations of 2n diploid hybrid, allo-triploid FDR, PMR and SDR, which were derived from a cross between duplicated 2n female gametes (F, P, S) and male gametes of 2n hybrid. FU and MU represent progenitors of 2n hybrid. Data are from 15 individuals of each population and three triplicate experiments were conducted. Low-growth, mixed and high-growth represent the subgroups with low, mixed and high growth rate in populations, respectively.
Forests 10 01091 g003
Figure 4. The schematic molecular basis for hybrid growth vigor in polyploid Populus. FDR, PMR and SDR represent different types of allo-triploids.
Forests 10 01091 g004
Table 1. The top 12 Populus pathways involved by detected metabolites.
Pathway ID 1PathwayMetabolites
pop01100Metabolic pathways (general)134
pop01110Biosynthesis of secondary metabolites73
pop02010ABC transporters36
pop01230Biosynthesis of amino acids33
pop012102-Oxocarboxylic acid metabolism21
pop01200Carbon metabolism20
pop00970Aminoacyl-tRNA biosynthesis17
pop00630Glyoxylate and dicarboxylate metabolism14
pop00052Galactose metabolism13
pop00260Glycine, serine and threonine metabolism11
pop00250Alanine, aspartate and glutamate metabolism11
pop00941Flavonoid biosynthesis11
1 the pathway ID is linked to associated online KEGG pathway database (https://www.genome.jp/kegg/, accessed on 18 September 2019).
Table 2. The comparison of carbohydrates in hybrids of Populus.
PathwayBiochemical NameComparison within Low Growth RateComparison within High Growth RateComparison within Mixed Growth Rate
F_D/2N_DS_D/2N_DP_D/2N_DF_G/2N_GS_G/2N_GP_G/2N_GF_H/2N_HS_H/2N_HP_H/2N_H
Glycolysis1,3-dihydroxyacetone0.931.080.891.291.481.321.941.111.04
1,6-anhydroglucose0.70.930.640.860.80.890.690.740.95
fructose-6-phosphate1.441.691.671.231.451.371.291.291.29
glucose0.970.90.910.880.960.940.9610.96
glucose-6-phosphate2.172.783.531.371.462.231.161.351.26
glycerate2.942.320.771.020.990.770.920.820.78
Isobar 10.960.821.341.591.551.192.061.531.84
pyruvate0.770.920.770.60.730.630.820.860.87
Citric Acid Cycle TCAalpha-ketoglutarate0.991.230.840.930.90.880.780.790.75
cis-aconitate1.111.031.361.051.210.881.161.051.12
citrate1.131.231.410.941.061.011.111.121.04
fumarate0.770.780.850.790.860.991.31.11.13
isocitrate1.171.421.061.080.910.850.990.941.09
malate1.721.561.441.021.091.111.091.011.02
succinate0.680.741.250.980.811.330.720.840.81
Calvin Cycle and pentose phosphatesedoheptulose-7-phosphate2.442.563.180.951.621.110.710.830.78
Amino sugar and nucleotide sugararabinose1.31.291.171.021.131.120.931.041.04
arabitol1.180.991.320.830.591.260.890.861.1
arabonate0.650.790.620.970.921.041.210.830.95
erythritol1.431.411.21.061.250.991.050.960.99
erythronate1.792.130.811.231.241.041.061.131.18
lyxose1.181.081.180.860.810.81.011.070.97
N-acetylglucosamine0.790.651.310.790.850.710.940.590.91
ribitol1.261.930.661.181.260.860.90.871.1
ribose0.970.510.711.160.980.931.241.121.05
ribulose1.131.010.741.461.291.051.411.050.84
UDP-glucose0.891.111.721.091.381.351.391.071.54
xylonate1.080.920.990.940.930.89111
xylose1.551.341.241.131.181.111.051.121.22
xylulose0.950.941.191.151.311.171.431.421.35
UDP-galactose0.580.591.310.721.080.990.880.841.31
Inositol metabolisminositol 1-phosphate (I1P)0.990.791.230.890.940.80.860.850.83
myo-inositol1.781.051.50.980.930.870.910.971.06
Sucrose, glucose, fructose metabolism3-deoxyoctulosonate1.120.921.411.11.061.061.041.071
fructose0.810.840.820.910.850.840.820.840.84
galactinol9.525.623.273.922.92.181.911.541.9
galactitol (dulcitol)1.51.861.380.920.80.860.690.920.96
galacturonate1.170.840.971.361.11.060.820.831.02
glucarate 1,4-lactone0.890.80.810.71.390.580.820.881.25
mannitol1.380.960.960.930.850.930.940.961.01
mannose-6-phosphate1.281.311.970.851.021.4610.951.15
raffinose1.911.311.191.971.81.921.71.41.43
rhamnose1.091.161.080.920.950.760.830.880.88
sorbitol1.1111.090.860.840.990.920.910.99
stachyose2.851.780.772.642.912.222.391.682.02
sucrose2.382.042.161.121.031.161.221.191.13
trehalose1.060.911.251.011.281.021.071.031.03
methyl-beta-glucopyranoside0.450.480.660.760.821.030.8310.75
C5 branched dibasic acid metabolismcitramalate1.060.990.940.840.770.950.880.940.97
The red and green shaded cells represent the significantly up-regulated and down-regulated, respectively (t-test, p < 0.05). The value here is the ratio of metabolites content of a sample relative to that of a control. F_D/2N_D, S_D/2N_D, P_D/2N_D, F_G/2N_G, S_G/2N_G, P_G/2N_G, F_H/2N_H, S_H/2N_H and P_H/2N_H represent the comparisons between triploids and diploids at given group. 2N, F, P, S represent the hybrids of 2n diploid hybrid, allo-triploids FDR, PMR and SDR, respectively; _D, _G, and _H represent the phenotypic groups of low, high and mixed plant height, respectively. 1 Isobar for fructose 1,6-diphosphate, glucose 1,6-diphosphate, myo-inositol 1,4 or 1,3-diphosphate.