Abstract
Sustainable energy systems such as anaerobic digestion (AD) bioreactors exhibit complex nonlinear dynamics that complicate the monitoring of key stability indicators using conventional laboratory-based methods. As a preliminary investigation, this pilot study explores the feasibility of using machine learning-based soft sensing to estimate Total Volatile Fatty Acids (TVFA(M)) from routinely measured physicochemical parameters. Using a short-term laboratory dataset obtained from controlled CO2 biomethanisation experiments, several regression models were benchmarked, including an attention-based deep learning architecture (TabNet), multi-architecture artificial neural networks (ANNs), gradient-boosting ensembles (CatBoost, XGBoost, LightGBM), and classical kernel-based approaches. Model performance was evaluated under a cross-validated framework to assess predictive capability and consistency across folds within the limited experimental scope. Among the tested models, TabNet achieved highly competitive performance, yielding an R2 of 0.8551, an RMSE of 0.0090, and an MAE of 0.0067. To support model transparency and interpretability, Explainable Artificial Intelligence (XAI) techniques based on SHapley Additive exPlanations (SHAP) were applied, identifying pCO2 as the dominant contributor to TVFA(M) predictions within the studied operational range. The results demonstrate the potential of explainable machine learning models as soft sensors for TVFA(M) estimation under controlled laboratory conditions. Although restricted to controlled laboratory conditions and a short observation period, this pilot study demonstrates the potential of explainable machine learning models for TVFA(M) estimation and provides a methodological benchmark for future validation using larger and more diverse datasets.
1. Introduction
Anaerobic digestion (AD) is a complex, non-linear biochemical process widely used for organic waste management and biogas production [1,2,3,4]. Process stability depends on tightly coupled physicochemical and biological factors, including substrate composition, organic loading rate, and microbial community dynamics [3,5,6,7,8]. Among routinely monitored variables, pH is a critical indicator, as it directly governs microbial activity and metabolic pathways [9,10,11,12]. Even small deviations from neutral pH can disrupt the balance between acidogenesis and methanogenesis, leading to instability. However, the assessment of anaerobic digestion stability remains methodologically challenging, particularly due to the sensitivity of methanogenic archaea and the delayed availability of laboratory-based measurements for key indicators such as volatile fatty acids (VFAs).
Machine learning (ML) approaches have been increasingly applied to bioprocess systems to capture nonlinear relationships between physicochemical variables and process performance. Previous studies have shown that ANN, SVR, and ensemble-based models can accurately predict biomass growth, biogas yield, and related performance indicators, often outperforming traditional modeling approaches. In anaerobic digestion, ML-based methods have demonstrated high predictive capability when trained on sensor-accessible variables, highlighting their utility for data-driven analysis under controlled and experimental conditions [13,14,15]. Nevertheless, many existing studies emphasize predictive accuracy while giving limited attention to interpretability and experimental constraints.
A well-characterized laboratory benchmark for investigating AD stability was established by Zhang et al. through CO2 biomethanisation experiments conducted at the University of Southampton [16]. Controlled H2 additions were used to induce and recover from instability, producing a high-quality dataset comprising pH, pCO2, TVFA, and total ammonia nitrogen (TAN(M)). This dataset spans a range of operational states from stable operation to acidification and includes high-frequency measurements of pH and pCO2, parameters that are both mechanistically linked to TVFA(M) dynamics.
Using this dataset, the present pilot study explores the feasibility of predicting TVFA(M) from a minimal set of experimentally accessible physicochemical parameters. While the original work focused on validating analytical relationships for pH and stability control, this study repurposes the same experimental data to develop and evaluate a proof-of-concept soft-sensing framework for TVFA(M) prediction. Model interpretation is supported through SHapley Additive exPlanations (SHAP), enabling transparent assessment of the relative influence of pH, pCO2, and TAN(M).
Although TVFA(M) accumulation is a well-established indicator of anaerobic digestion instability [17], its computational modeling remains challenging due to nonlinear and interaction-driven metabolic effects. Previous studies on soft-sensing approaches have reported limitations related to model transparency and interpretability [18], while dependence on laboratory-based quantification methods introduces temporal gaps in data availability [19,20].
Explainable artificial intelligence (XAI) methods address this challenge by revealing how input variables influence model predictions. In particular, SHAP provides a theoretically grounded framework for quantifying feature contributions at both global and local levels [21,22].
Consequently, the contributions of this study are explicitly distinguished into applied and methodological domains. In terms of application, this study introduces a pilot, explainable machine learning framework for TVFA(M) soft sensing that is explicitly designed to evaluate methodological feasibility under controlled experimental conditions. The work investigates whether TVFA(M) dynamics can be inferred from a minimal set of routinely measured physicochemical variables, namely pH, pCO2, and TAN(M), using data-driven models trained on laboratory-scale data. The focus of this study is on assessing model suitability and predictive behavior within the constraints of a controlled experimental setting, serving as a proof of concept. Methodologically, the study establishes a reference point by benchmarking attention-based deep learning against established machine learning and neural network baselines within a leakage-safe cross-validation framework.
In addition to predictive accuracy, the novelty of this work lies in the structured integration of explainable artificial intelligence to move beyond purely statistical characterization of process variables. By combining SHAP-based global importance, dependence analysis, and permutation feature importance, this study enables interpretation of nonlinear and interaction-driven effects that are not captured by conventional statistical metrics, supporting preliminary validation of TVFA(M) soft sensors.
The remainder of this paper is organized as follows. Section 2 details the materials and methods, including the experimental dataset generation, data preprocessing steps, and the theoretical architectures of the machine learning models employed for benchmarking. Section 3 presents the comparative experimental analysis of the regression algorithms and evaluates the model interpretability using Explainable AI techniques. Section 4 discusses the interpretation of the results in the context of controlled laboratory conditions. Finally, Section 5 provides concluding remarks and outlines directions for future research.
2. Materials and Methods
2.1. System and Dataset Description
The proposed analytical framework is designed to explore the feasibility of predicting TVFA(M) in bioreactor systems using machine learning models trained on key physicochemical parameters. As a pilot study, the primary aim is to evaluate the appropriateness of the selected input features, modeling workflow, and interpretability techniques prior to conducting a larger-scale and more comprehensive investigation. The proposed analytical framework follows a structured workflow, illustrated in Figure 1, encompassing data acquisition, data integration and preprocessing, feature relevance analysis, model training, and performance evaluation with model interpretability analysis.
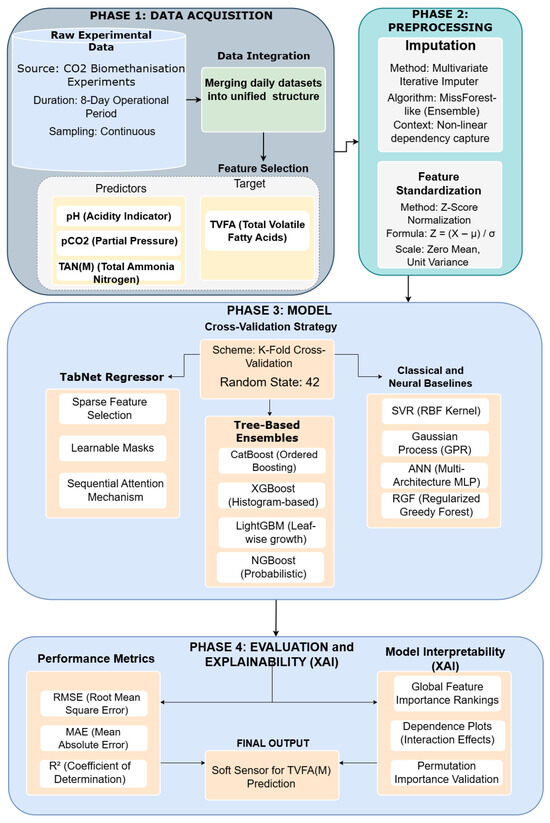
Figure 1.
Workflow pipeline.
The dataset used in this study was obtained from a publicly available open-source repository accompanying the work of Zhang et al. (2023) [16], which reports physicochemical measurements collected during an eight-day operational period of CO2 biomethanisation experiments. To construct a unified dataset suitable for preliminary model development, raw measurements from all eight days were merged into a single dataset. Although limited in duration, this aggregation enables exposure to multiple operational states and is sufficient for methodological validation within a pilot context. Following data integration, preprocessing steps were applied, and variables were explicitly assigned as either input features or the target output variable.
The model’s predictive capabilities are built upon three primary physicochemical input features and one target output variable. The framework utilizes pH, pCO2, and TAN(M) as input features, with TVFA(M) designated as the target variable. pH is a fundamental indicator of system acidity [23] and is among the most cost-effective and widely monitored parameters in anaerobic digestion processes. Despite its simplicity, pH reflects complex biochemical interactions and provides indirect information regarding process stability [24]. pCO2 represents the pressure exerted by dissolved carbon dioxide and serves as an indicator of microbial metabolic activity and acid–base equilibrium within the system [25]. TAN(M) corresponds to the combined concentration of free ammonia (NH3) and ammonium ions (NH4+) and plays a dual role in anaerobic digestion, contributing to buffering capacity at moderate concentrations while potentially exerting inhibitory effects at elevated levels [26,27].
TVFA(M) represents the concentration of short-chain volatile fatty acids produced as intermediate products during the anaerobic degradation of organic matter. Excessive accumulation of TVFA(M) is widely recognized as an early indicator of process imbalance and often precedes system acidification and performance deterioration [28]. In this pilot study, TVFA(M) prediction is explored as a proof-of-concept, assessing whether it can be inferred from readily available and low-cost parameters such as pH, pCO2, and TAN(M), thereby reducing dependence on frequent laboratory-based chemical analyses.
To assess the relevance of the selected input features, Mutual Information analysis was employed as an initial feature relevance evaluation step. Machine learning regression models were subsequently trained using the defined input–output configuration. Model performance was evaluated using standard regression metrics, and SHAP analysis was applied to interpret model behavior and quantify the contribution of each input feature to the predicted TVFA(M) values.
2.2. Data Preprocessing
The raw data were collected continuously over eight days, capturing variations in key physicochemical parameters. To ensure consistency and enable effective machine learning analysis, all eight daily datasets were merged into a single unified dataset. After integration, the final pilot dataset comprised a total of 984 samples, providing a more comprehensive representation of the system’s behavior and contributing to more consistent model training within the evaluated setting.
Following data unification, feature selection was performed to define the input variables and the target variable. Specifically, pCO2, TAN(M), and pH were designated as the independent features (X), as they are experimentally accessible parameters that reflect acid–base balance, metabolic activity, and buffering behavior within the system. TVFA(M) (M) were defined as the dependent variable (y) and served as the prediction target for all subsequent modeling tasks. This structured dataset provided a clear input–output relationship essential for developing regression models under the evaluated experimental conditions.
Due to the presence of missing values in the feature space, a multivariate iterative imputation strategy inspired by the MissForest algorithm was adopted [29]. Each feature with missing entries was iteratively modeled as a function of the remaining features using an ensemble-based regressor. The imputation process was initialized using the median of each feature and refined over multiple iterations to capture nonlinear dependencies among process variables. To prevent data leakage, the imputer was fitted exclusively on the training subset and subsequently applied to the validation subset.
Following imputation, feature values were standardized using z-score normalization to ensure numerical stability and comparable feature scales. This preprocessing step transformed the data to have zero mean and unit variance, ensuring that all predictors contributed proportionally to model training and enhancing numerical stability, particularly for algorithms sensitive to feature scales. The scaling parameters were fitted on the training data and subsequently used to transform both the training and test sets to prevent data leakage. The standardization process is mathematically expressed as [30]:
In Equation (1), X corresponds to the raw input value of the feature (in its original unit), Z represents the resulting standardized score, μ denotes the arithmetic mean of the distribution, and is the standard deviation (same unit as X).
To evaluate the predictive contribution of each biochemical variable toward the target parameter (TVFA(M)), a Mutual Information (MI) analysis was conducted. MI is a measure of statistical correlation derived from information theory that quantifies the strength of both linear and non-linear dependencies between variables [31,32].
As illustrated in Figure 2, TAN (M) exhibited the highest mutual information value (0.476), suggesting a relatively high association with variations in TVFA(M) within this pilot dataset. pH followed with a mutual information value of 0.449, indicating a meaningful relationship with TVFA(M) dynamics. The mutual information value for pCO2 was lower (0.215), pointing to a weaker association in the context of the present analysis.
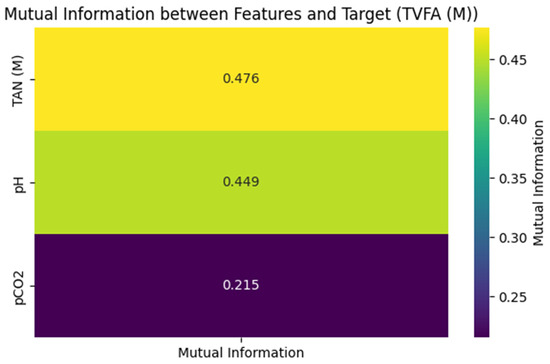
Figure 2.
Mutual information matrix between features and Target (TVFA(M)).
2.3. Machine Learning Algorithms for Regression
To predict the target biochemical response variable under controlled laboratory conditions, we formulated the regression task by defining the target variable, TVFA(M) concentration, as a function of three process parameters: pCO2, TAN (M), and pH.
All preprocessing operations were performed within each fold to avoid data leakage. Specifically, missing values were imputed using a MissForest-like iterative imputer, and both features and target variables were standardized using a StandardScaler fitted exclusively on the training data. The target was normalized to zero mean and unit variance before model fitting and inverse-transformed for evaluation. Nine regression models were evaluated to explore a diverse range of learning paradigms, including deep neural attention architectures, kernel-based learners, probabilistic models, and gradient-boosted ensembles.
Model performance was assessed using five-fold cross-validation on the entire dataset. In each iteration, 80% of the data was allocated for training and the remaining 20% for validation. This procedure was carried out five times so that each subset was used once as the validation set. During each fold, models were trained solely on the training data and evaluated only on the corresponding validation portion. Final performance metrics were reported as the mean values averaged across all five folds.
The TabNet Regressor was employed for its ability to perform sequential attention-based feature selection and learn sparse, interpretable representations directly from tabular data [33,34]. The model was configured with decision and attention dimensions = 16 and = 16, five decision steps ( = 5), shared and independent layer counts of 2 each ( = = 2), and a sparsity regularization coefficient = . The entmax masking function was used to stabilize feature selection, and the model was optimized using the Adam optimizer with a learning rate of 2 × .
The CatBoost Regressor was implemented to leverage its effectiveness in handling numerical features, while maintaining resistance to overfitting through its ordered boosting strategy [35]. The model was configured with 3000 boosting iterations, a learning rate of 0.03, a tree depth of 6, and an L2 leaf regularization coefficient of 3.0.
The XGBoost Regressor was employed as a high-performance gradient boosting framework designed to capture complex nonlinear relationships through an ensemble of decision trees [36]. The model was configured with the following parameters: objective = “reg:squarederror”, learning rate = 0.03, maximum tree depth = 6, subsample ratio = 0.8, column sampling ratio per tree = 0.8, and tree_method = “hist” for efficient histogram-based splitting. Training proceeded for up to 3000 boosting rounds with early stopping after 50 rounds of no improvement in validation RMSE.
The RGF Regressor was implemented to combine the interpretability and nonlinearity of decision-tree ensembles with explicit regularization to mitigate potential overfitting. The RGF model was configured with a maximum of 500 leaf nodes, the “RGF” algorithm type, least squares (LS) loss function, L2 regularization coefficient of 0.01, learning rate of 0.05, 100 boosting iterations, and a minimum of 10 samples per leaf. RGF directly constructs and regularizes the forest structure during training, applying coefficient shrinkage to reduce overfitting.
The NGBoost Regressor was employed to model both the mean and uncertainty of the target variable through a probabilistic boosting framework. The NGBoost model was configured with a Normal distribution as the predictive density, using DecisionTreeRegressor base learners with a maximum depth of 2 and a minimum of 20 samples per leaf to promote stability. The model was trained for up to 1500 boosting iterations with a learning rate of 0.02, employing natural gradient descent for improved convergence efficiency and numerical stability. Early stopping was applied after 50 rounds of no improvement in validation loss to mitigate overfitting.
The LightGBM Regressor was implemented for its computational efficiency and high predictive capability in modeling nonlinear relationships through gradient boosting [37]. The model was configured with the following parameters: objective = “regression”, evaluation metric = “rmse”, learning rate = 0.03, number of leaves = 31, feature fraction = 0.8, bagging fraction = 0.8, bagging frequency = 1, maximum depth = unrestricted, and L2 regularization term (λ2) = 1.0. Training was conducted for up to 3000 boosting iterations with early stopping after 50 rounds of no improvement in validation RMSE.
Support Vector Regression extends support vector machines to regression by employing an epsilon-insensitive loss function that penalizes only deviations exceeding a specified tolerance, thereby providing resilience to small noise while maintaining sparsity through a limited set of support vectors. Model complexity and fitting accuracy are balanced through a regularization parameter, while kernel functions enable SVR to capture nonlinear relationships in high-dimensional feature spaces. SVR is computationally efficient, effective against, and well-suited for large-scale and industrial soft sensor applications. SVR focuses on robust point prediction rather than full probabilistic uncertainty estimation, making it preferable when scalability and noise resistance are prioritized over Bayesian uncertainty quantification [38,39,40,41]. The SVR model with RBF kernel was utilized to capture nonlinear relationships between the input features and the target variable through a margin-based optimization framework. The SVR model was configured with C = 10.0, ε = 0.01, and γ = “scale”, which controls the penalty for large errors, the width of the ε-insensitive zone, and the influence radius of support vectors, respectively. The RBF kernel was selected for its ability to project data into a high-dimensional space where linear separation of nonlinear relationships becomes feasible [42].
GPR is a non-parametric Bayesian regression method that models an unknown function as a distribution over functions rather than a fixed set of parameters. The model is defined by a mean function, typically assumed to be zero, and a covariance kernel that encodes prior assumptions such as smoothness and stationarity. A key advantage of GPR is its ability to provide both predictive means and principled uncertainty estimates through an analytically tractable posterior distribution. This makes GPR particularly suitable for uncertainty-critical applications, including Bayesian optimization, active learning, and surrogate modeling of expensive functions [43,44,45,46]. The GPR model was implemented to model the underlying functional relationship between input features and the target variable while providing calibrated uncertainty estimates for predictions. The GPR model employed a kernel-based framework, where a predefined covariance kernel (specified as kernel) captured spatial correlations and smoothness in the data. The model was configured with alpha = 0.0 (no additional noise term), normalize_y = False, and n_restarts_optimizer = 5 to ensure convergence toward an optimal set of hyperparameters. During training, GPR optimized the kernel parameters by maximizing the log marginal likelihood, enabling flexible adaptation to the data’s variance structure. Predictions produced both a mean estimate and a corresponding standard deviation, quantifying predictive uncertainty.
Artificial Neural Networks (ANNs) were implemented to model the nonlinear relationships between the input features and the target variable. Three feedforward ANN architectures (ANN-A to ANN-C) of increasing depth and regularization strength were evaluated to assess the impact of network complexity and stabilization strategies on predictive performance. All architectures consisted of fully connected (dense) layers with ReLU activation functions, followed by a single linear output neuron to support continuous regression. ANN-A represented a moderately deep baseline architecture with two hidden layers (128 and 64 neurons) and dropout regularization to mitigate overfitting. ANN-B increased model depth by introducing an additional hidden layer, enabling greater representational capacity. ANN-C emphasized higher regularization through higher dropout rates and an additional hidden layer, targeting the mitigation of overfitting in the presence of limited or noisy data. All ANN models were trained using the Adam optimizer with a fixed learning rate of 0.001 and mean squared error (MSE) as the loss function.
It should be noted that exhaustive hyperparameter optimization was not performed for all models. Instead, hyperparameters were selected based on established best practices, values commonly reported in the literature, and limited preliminary experimentation to ensure convergence and fair comparison across models.
This approach was adopted to balance computational efficiency with consistent model performance and to avoid excessive tuning that could bias comparative results.
Model performance was assessed using commonly adopted regression evaluation metrics, including RMSE, MAE, and R2.
The RMSE measures the square root of the average squared difference between the predicted and actual values. It penalizes larger errors more heavily than smaller ones, making it sensitive to outliers. A lower RMSE indicates higher predictive accuracy.
where represents the true values , denotes the predicted values (), and n is the number of test observations (dimensionless).
The MAE represents the average magnitude of prediction errors, disregarding their direction. It treats all errors equally and is therefore more robust to outliers. Smaller MAE values reflect closer alignment between predictions and true observations.
where is the absolute error magnitude for a given observation ().
R2 quantifies the proportion of the variance in the target variable that is explained by the model. Values close to 1 indicate that the model explains most of the variability, whereas values near 0 suggest weak explanatory power
where represents the mean of the observed values (), and the resulting R2 score is dimensionless.
Model interpretability was addressed through the application of SHAP (SHapley Additive exPlanations), a unified framework grounded in cooperative game theory. Unlike traditional impurity-based feature importance metrics, which can be biased, SHAP provides a consistent measure of global feature attribution by calculating the marginal contribution of each input variable across all possible coalitions of features. For each trained model, SHAP values were computed to quantify the impact of physicochemical parameters (pCO2, TAN(M), and pH) on the predicted TVFA(M) output. The analysis was conducted on two levels: first, the mean absolute SHAP values across all test instances were aggregated to derive global feature importance rankings, visualized as horizontal bar plots. Second, local interpretability was examined to understand how specific variable ranges positively or negatively influence the model’s prediction for individual samples [47]. This rigorous approach ensures a transparent assessment of the model’s predictive logic, validating that the learned dependencies within this specific laboratory setup align with the biological principles of anaerobic digestion. The workflow pipeline is shown in Figure 3.
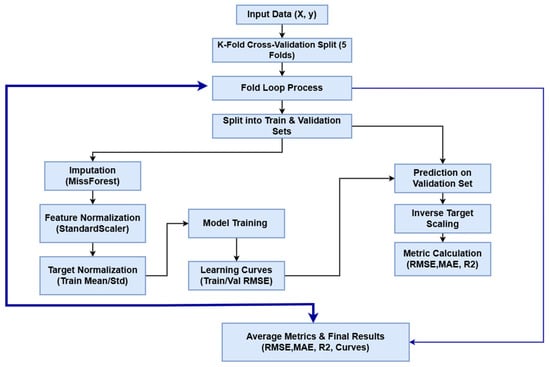
Figure 3.
The pipeline of the Model training.
3. Results
To assess the predictive performance of different regression approaches, a diverse set of models was implemented, including TabNet, CatBoost, XGBoost, RGF, NGBoost, LightGBM, SVR with an RBF kernel, and GPR. These models were selected to represent modern deep learning-based architectures, gradient boosting methods, and classical kernel and probabilistic regressors. Performance was assessed using MAE, RMSE, and R2, as summarized in Table 1. TabNet demonstrated the lowest RMSE (0.0090 ± 0.0009), a low MAE (0.0067), and the highest coefficient of determination (R2 = 0.8551) among the evaluated models within the five-fold cross-validation procedure applied to the analyzed dataset. CatBoost yielded the lowest MAE (0.0065) and an RMSE of 0.0095 ± 0.0011, with an R2 value of 0.8417 under the applied evaluation procedure. XGBoost followed with an RMSE of 0.0100 ± 0.0003, MAE of 0.0068, and R2 of 0.8222 within the same experimental setting.

Table 1.
Performance Comparison of Machine Learning Regression Models (MAE, R2, and RMSE ± Cross-Validation Standard Deviation).
Models such as RGF, NGBoost, and LightGBM showed comparable but slightly lower performance, with RMSE values around 0.0100–0.0101 and R2 scores between 0.8184 and 0.8197, indicating comparable performance variability but reduced predictive capability relative to the top-performing models. In contrast, SVR with an RBF kernel and GPR showed higher prediction errors and lower R2 values within the same experimental framework. SVR achieved an RMSE of 0.0106 ± 0.0010 and R2 of 0.8041, while GPR recorded the weakest performance, with an RMSE of 0.0109 ± 0.0010, MAE of 0.0077, and the lowest R2 (0.7910). Overall, the results indicate that deep learning-based and gradient boosting models outperform traditional kernel and probabilistic approaches on this dataset. The relatively small standard deviations of RMSE across models reflect the limited variability of the error estimates across the evaluated data partitions.
Figure 4 presents the evolution of training and validation RMSE for the TabNet model over the course of training. Both curves show a rapid decrease during the early training phase, followed by a more gradual reduction in error values. Most of the reduction in RMSE occurs within the first 20–30% of the training process, after which the decrease becomes progressively smaller.
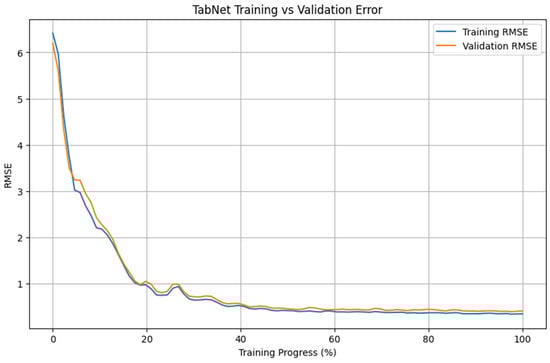
Figure 4.
Training and validation RMSE convergence of the TabNet model.
Importantly, the training and validation RMSE curves remain closely aligned throughout the training phase, with no pronounced divergence visible. Within the evaluated setting, the error values on the training and validation partitions follow similar trajectories. After approximately 40–50% of the training epochs, both curves exhibit a plateau, with only minor changes in RMSE observed thereafter. These patterns are consistent with the performance values reported in Table 1 for the analyzed dataset.
Figure 5 illustrates the comparison between measured TVFA(M) values and the corresponding predictions obtained using different machine learning models. The predicted values are plotted against the experimental measurements to evaluate the agreement between model outputs and actual observations. For all models, the predicted values generally align along the diagonal reference line, indicating agreement between predicted and observed TVFA values within the evaluated dataset. Among the evaluated models, TabNet, CatBoost, XGBoost, LightGBM, RGF, SVR with RBF kernel, and GPR show clustering of data points around the unity line, with varying degrees of spread across the TVFA range. By comparison, NGBoost shows a wider dispersion of points and increased deviation from the diagonal reference line, especially at higher TVFA values. The tighter concentration of points for the tree-based ensemble models and kernel-based approaches indicates lower performance variability and reduced systematic bias within the evaluated dataset compared to probabilistic boosting.
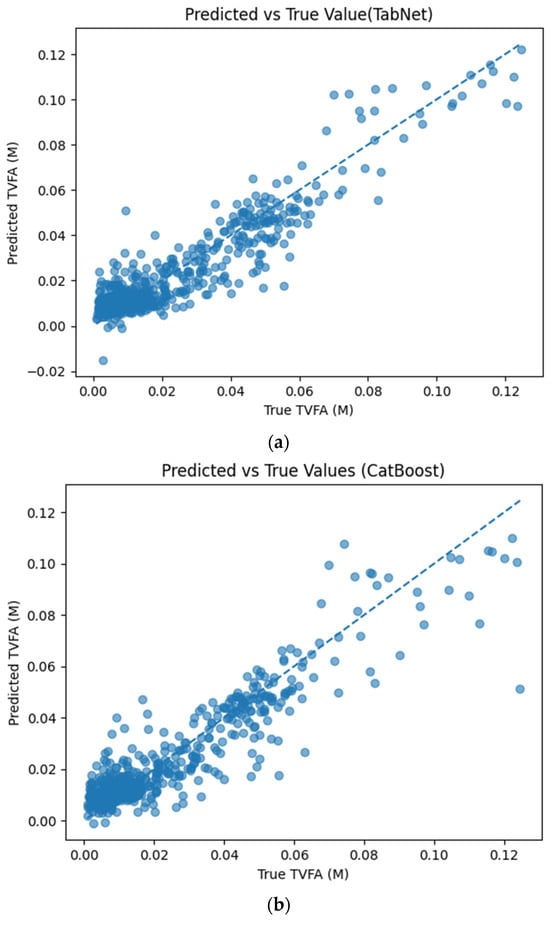
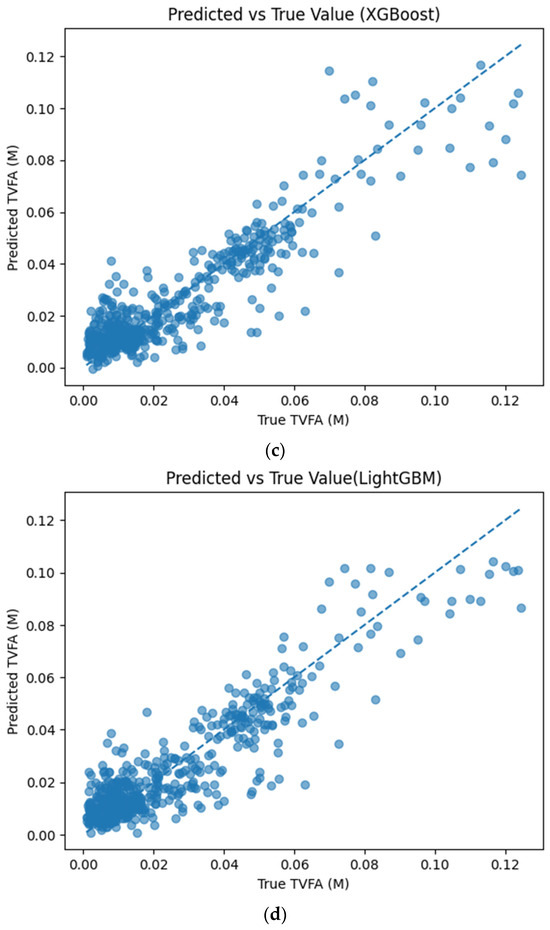
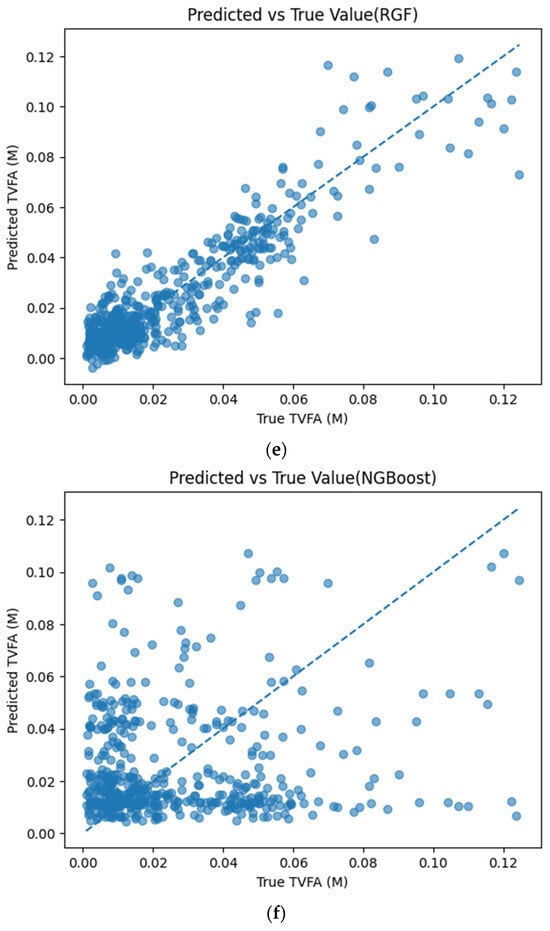
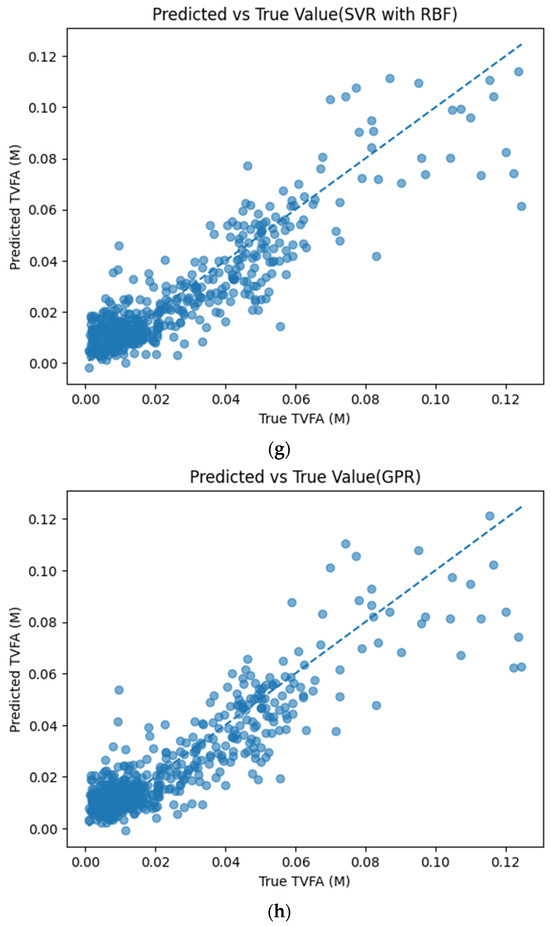
Figure 5.
Comparison of predicted TVFA (M) with measured values based on different machine learning models: (a) TabNet predicted performance; (b) CatBoost predicted performance; (c) XGBoost predicted performance; (d) LightGBM predicted performance; (e) RGF predicted performance; (f) NGBoost predicted performance; (g) SVR-RBF predicted performance; and (h) GPR predicted performance.
Figure 6 presents the distributions of prediction residuals for the evaluated machine learning models, defined as the difference between predicted and measured TVFA (M) values. The residual histograms illustrate the distribution of prediction errors for each model within the evaluated dataset. For most models, the residuals are symmetrically distributed around zero, indicating limited systematic bias and good agreement between predicted and experimental values. TabNet, CatBoost, XGBoost, LightGBM, SVR-RBF, and GPR exhibit narrow and approximately Gaussian-shaped residual distributions, with the majority of errors concentrated near zero. The residual histograms illustrate the distribution of prediction errors for each model within the evaluated dataset. RGF exhibits a slightly broader distribution of residuals, with values spread over a wider range around zero. In contrast, NGBoost displays a noticeably wider and more dispersed residual distribution, with heavier tails extending toward both positive and negative errors. This pattern corresponds to a wider spread of residuals, particularly at extreme TVFA values.
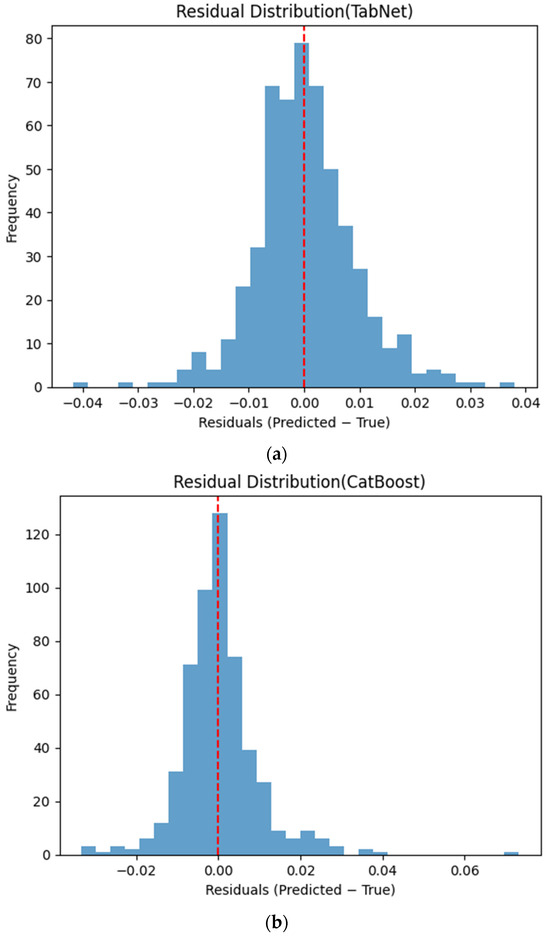
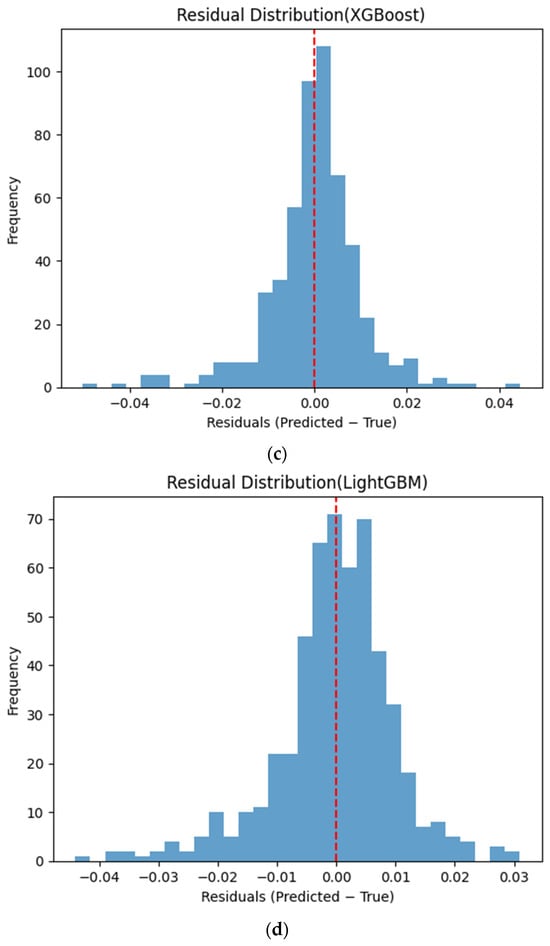
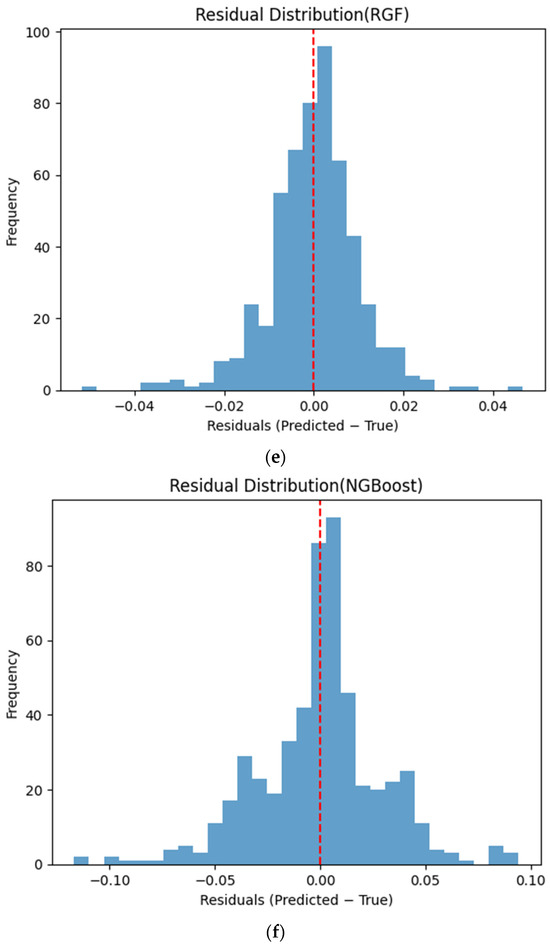
Figure 6.
Distribution of prediction residuals (predicted − measured TVFA (M)) for different machine learning models: (a) TabNet; (b) CatBoost; (c) XGBoost; (d) LightGBM; (e) RGF; (f) NGBoost; (g) SVR-RBF; and (h) GPR. The red dashed line denotes zero residual error.
The calibration curves in Figure 7 provide a quantitative assessment of how accurately the predicted TVFA (M) values reflect the corresponding observed concentrations across different operating regimes. Models whose calibration curves closely follow the diagonal reference line show closer agreement between predicted and observed TVFA values across the evaluated range. For most models, including TabNet, CatBoost, XGBoost, LightGBM, RGF, SVR-RBF, and GPR, the predicted and observed means exhibit a near-linear correspondence, particularly at lower and intermediate TVFA levels. This alignment indicates smaller deviations between predicted and observed values across the TVFA range within the analyzed dataset. At higher TVFA concentrations, modest deviations from the ideal line become apparent, indicating a gradual loss of calibration that is likely associated with data sparsity in these regimes. A markedly different pattern is observed for NGBoost, whose calibration curve departs substantially from the diagonal across nearly the entire range. The weak sensitivity of its predicted means to increasing observed TVFA values indicates inadequate calibration and limited adaptability to concentration variability.
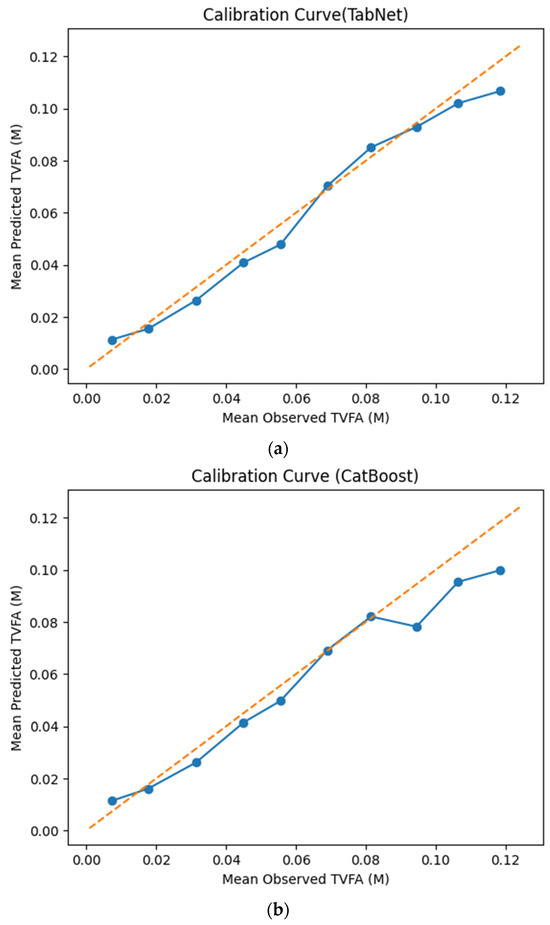
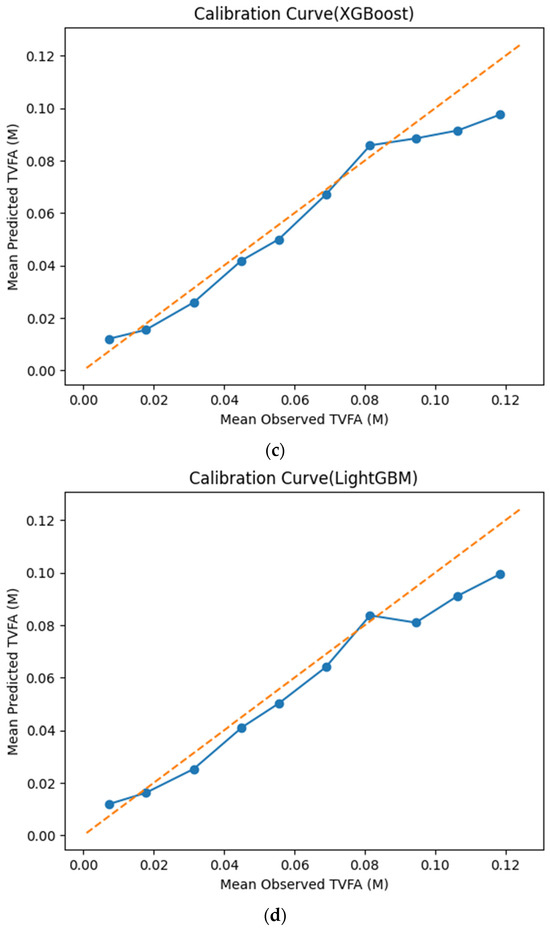
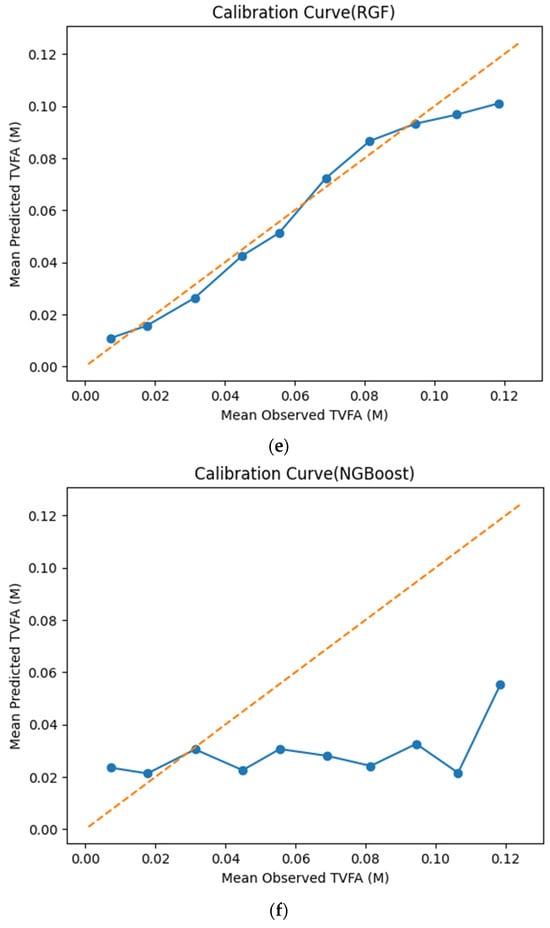
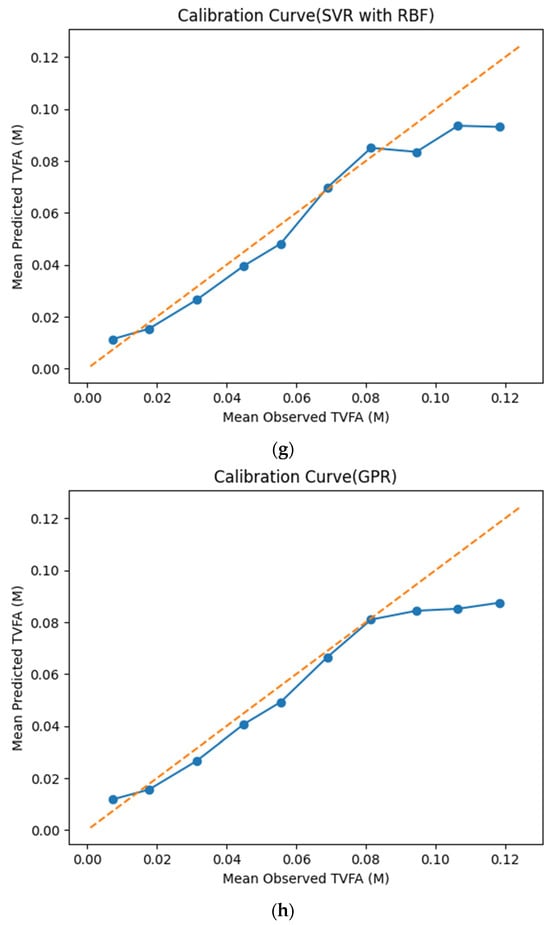
Figure 7.
Calibration curves illustrating the agreement between mean observed and mean predicted TVFA (M) values for the evaluated machine learning models: (a) TabNet; (b) CatBoost; (c) XGBoost; (d) LightGBM; (e) Random Forest Gradient (RGF); (f) NGBoost; (g) SVR-RBF; and (h) GPR. The diagonal dashed line indicates perfect calibration.
The SHAP feature importance analysis, shown in Figure 8, identifies pCO2 as the most influential predictor of TVFA(M), exhibiting the highest mean absolute SHAP value. pH follows as the second most important feature, indicating a high contribution to the model predictions and highlighting its relevance in capturing variations in organic acid accumulation. In comparison, TAN(M) displays a lower mean SHAP value, suggesting a more moderate influence on TVFA(M) prediction within the operational range examined in this pilot study. These results indicate that gas-related and acid–base parameters dominate the model’s decision-making process, while nitrogen-related effects play a secondary role.
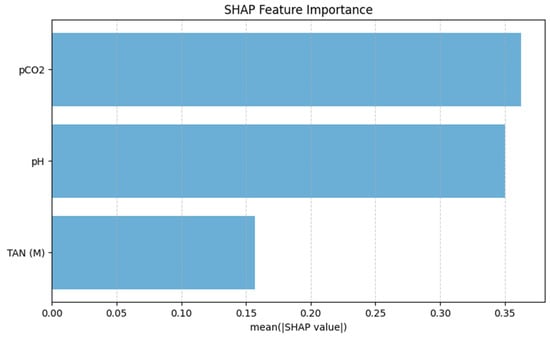
Figure 8.
SHAP-based feature importance of the TabNet model.
Figure 9, Figure 10 and Figure 11 present SHAP dependence plots that elucidate the nonlinear and interaction-driven effects of pCO2, TAN, and pH in the TabNet-based TVFA prediction model. Figure 9 illustrates the dependence of SHAP values for pCO2 colored by TAN, revealing a pronounced nonlinear relationship in which increasing pCO2 is associated with decreasing SHAP contributions, while the color gradient indicates that this effect is highly modulated by TAN concentration, particularly at lower pCO2 levels. Figure 10 shows the SHAP dependence of TAN colored by pCO2, highlighting a non-monotonic contribution pattern in which TAN’s influence on TVFA predictions varies substantially across pCO2 regimes, thereby confirming a bidirectional interaction between these variables. Figure 11 depicts the SHAP dependence of pH colored by pCO2, demonstrating a threshold-like nonlinear effect whereby pH contributes positively at lower values but its influence diminishes and reverses under higher pH conditions, with pCO2 further modulating this behavior. These figures provide clear evidence that feature effects are context-dependent and governed by nonlinear interactions, supporting the conclusion that explainable nonlinear models are essential for accurately characterizing soft sensor behavior and revealing process drivers that may be overlooked by purely statistical metrics.
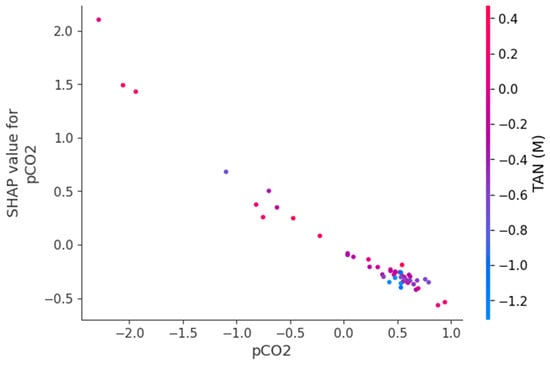
Figure 9.
Dependence of SHAP values for pCO2 with interaction effects colored by TAN(M).
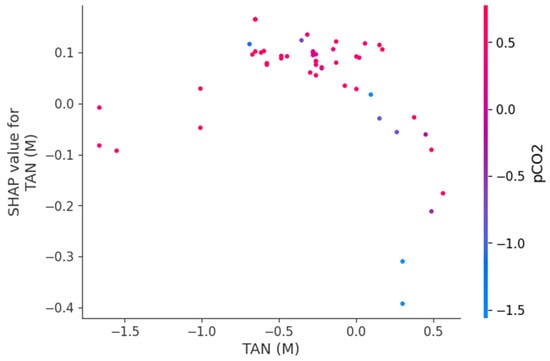
Figure 10.
Dependence of SHAP values for TAN (M) with interaction effects colored by pCO2.
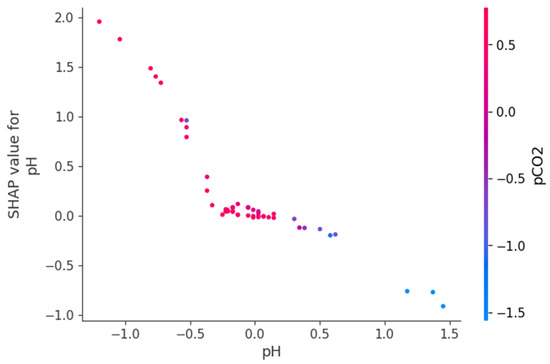
Figure 11.
Dependence of SHAP values for pH with interaction effects colored by pCO2.
The permutation feature importance analysis evaluates the contribution of each input variable to the predictive performance of the TabNet regression model by measuring the increase in RMSE after randomly permuting individual features. A larger increase in RMSE indicates a greater dependence of the model’s predictions on the corresponding feature.
As shown in Figure 12, pCO2 emerges as the most influential feature, producing the largest increase in RMSE when permuted. This suggests that the model relies heavily on pCO2 to generate accurate TVFA(M) predictions, highlighting its dominant role in the learned feature representations. The feature pH ranks second in importance, with a moderate but substantial increase in RMSE upon permutation, indicating that acid–base balance also provides critical information for TVFA(M) estimation. In contrast, TAN(M) exhibits a comparatively smaller impact on model performance, suggesting a more limited but still non-negligible contribution to the prediction task.
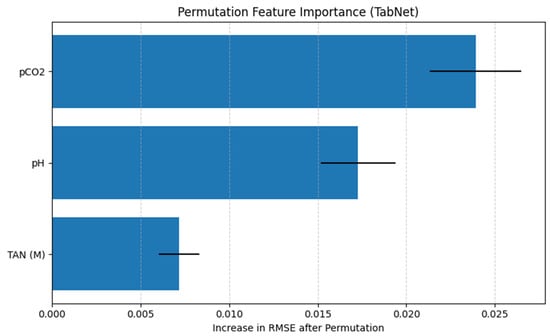
Figure 12.
Permutation feature importance for the TabNet regression model.
Importantly, the ranking obtained from permutation feature importance is fully consistent with the results of the SHAP analysis, which also identifies pCO2 as the most influential predictor, followed by pH and TAN(M). This agreement between two complementary interpretability methods provides convergent evidence for the identified feature effects, as permutation importance captures the global impact of features on model error, while SHAP explains feature contributions at the prediction level. The convergence of both approaches reflects comparable trends in the reported performance metrics under the applied evaluation framework.
Benchmarking against deep learning models was conducted to assess whether increased model expressiveness provides measurable performance gains over machine learning approaches for TVFA(M) prediction. Table 2 summarizes the cross-validated performance of multiple artificial neural network (ANN) architectures evaluated under identical preprocessing, regularization, and validation conditions.
Table 2.
Cross-Validated Performance of Multi-Architecture ANN Models.
Among the tested configurations, ANN-B produced the highest R2 value (0.83 ± 0.02) together with the lowest MAE and RMSE under the evaluated experimental conditions. The confidence intervals across the evaluation folds are relatively narrow, reflecting a small range of metric variation within the analyzed dataset. Architecturally, ANN-B incorporates increased depth and representational capacity relative to the other models, enabling it to effectively capture nonlinear interactions among pCO2, TAN (M), and pH without inducing overfitting. The ANN-A architecture, characterized by a shallower structure, exhibited moderately lower performance (R2 ≈ 0.73) and higher error metrics. This configuration produced lower R2 values and higher error metrics compared to the alternative configurations within the evaluated setting. In contrast, ANN-C, which applies higher dropout-based regularization, achieved an R2 of approximately 0.68 in the current evaluation. This behavior is indicative of mild underfitting, where aggressive regularization constrains the network’s learning capacity. Although such regularization improves training stability, it suppresses the model’s ability to resolve subtle variations in the low-variance TVFA(M) target. These results demonstrate that deep learning performance is highly sensitive to architectural design and that increasing complexity alone does not guarantee improved outcomes. Instead, an optimal balance between depth, width, and regularization is required. For the present dataset, moderate-depth architectures such as ANN-B provide an effective trade-off between bias and variance within the evaluated experimental setting.
4. Discussion
This pilot study explores the potential of a machine learning based soft sensing framework for estimating anaerobic digestion process stability through TVFA(M) prediction. The primary contribution lies in demonstrating, within a controlled experimental setting, that TVFA(M) concentration, an established indicator of process acidification and instability [48], can be predicted with reported accuracy using three routinely measurable physicochemical parameters, namely pH, pCO2, and TAN (M).
This approach addresses a practical limitation in anaerobic digestion systems, where direct VFA measurement typically depends on laboratory-based chemical analyses or specialized online instrumentation that may be resource-intensive [19]. Since pH, pCO2, and TAN (M) can be obtained using conventional sensor technologies commonly utilized in laboratory-scale anaerobic digestion systems, the results indicate that these variables contain sufficient information to support data-driven estimation of TVFA(M) under the experimental conditions investigated.
The use of multiple interpretability techniques, including Mutual Information analysis and SHAP-based feature importance, further strengthens this study by going beyond prediction accuracy and providing transparent insights into the biochemical relationships linking the selected input parameters to TVFA(M) dynamics.
Among the evaluated models, TabNet demonstrated marginally better predictive performance than the other approaches, while offering enhanced interpretability through its attention-based architecture, achieving an R2 of 0.8551 with an RMSE of 0.0090 ± 0.0009 and an MAE of 0.0067. While tree-based gradient boosting methods (CatBoost and XGBoost) demonstrated competitive results with R2 values of 0.8417 and 0.8222, respectively, TabNet exhibited consistent performance across multiple iterations, as reflected by the minimal standard deviation of RMSE and the convergence behavior observed in the training–validation curves. Rapid error reduction followed by convergence indicates efficient learning without apparent overfitting, while the close alignment between training and validation RMSE indicates consistent performance across validation folds.
The predicted versus true TVFA(M) scatter plot of the Tabnet model demonstrates a calibration of the model predictions across the operational range of the pilot system. Predictions cluster tightly around the identity line with minimal systematic deviation, suggesting that TabNet captures the underlying nonlinear relationships between the input features and TVFA(M) without bias toward overestimation or underestimation The slightly increased variability at higher TVFA(M) values is expected and reflects the challenge of predicting extremes in process behavior; however, the model maintains reported accuracy even in these regions. The residual analysis indicates a mathematical fit for the investigated dataset: residuals are centered at zero with a narrow distribution, suggesting low systematic error for the majority of samples. The approximate symmetry of the residual distribution with few extreme outliers indicates consistent error characteristics and suggests that systematic process deviations are captured by the selected features.
To contextualize the reported prediction accuracy, the error metrics were interpreted relative to the absolute scale and variability of TVFA(M) observed in the dataset. In the present study, TVFA(M) values ranged from approximately 0.0009 M to 0.1246 M, yielding an operational span of 0.1237 under controlled laboratory conditions. Within this range, the achieved RMSE of approximately 0.009 corresponds to 7.28% of the total observed TVFA(M) variation, which is hereafter referred to as the relative RMSE, computed by normalizing the RMSE with respect to the observed TVFA(M) range. This scale-normalized error indicates that the model error remains small relative to the natural fluctuations of the process and that the model is capable of resolving meaningful changes in TVFA(M) rather than merely reproducing an average trend. Moreover, the standard deviation of TVFA(M) (0.024) exceeds the RMSE, suggesting that the prediction error is substantially smaller than the inherent variability of the system.
The use of SHAP analysis in this study provides a structured approach to examining feature contributions and enhances transparency in the interpretation of machine learning predictions for bioprocess data. Rutland and colleagues, in their systematic review, identified model interpretability as a critical research gap in machine learning applications for anaerobic digestion, noting that black box models limit trust. In this study, the combined use of mutual information analysis and SHAP values enables complementary interpretability at different levels. This approach is consistent with best practices reported in recent explainable AI literature, where SHapley Additive exPlanations are widely regarded as a theoretically grounded, model-agnostic framework for interpreting supervised learning models [49]. The SHAP analysis identified pCO2 as the most influential predictor for TVFA(M) because it directly reflects the carbonate equilibrium and dissolved CO2 pressure, which are mechanistically coupled to VFA production and acidogenesis rates in anaerobic systems [50]. pH emerged as the secondary important feature, as it serves as an integrative, rapid-response indicator of the system’s acid–base balance and is directly perturbed by VFA accumulation, making it a sensitive proxy for process instability [51]. In contrast, TAN(M) exhibited a lower SHAP importance, consistent with its dual role as a nutrient and buffer at moderate concentrations but an inhibitor at elevated levels, leading to a more complex and conditional relationship with TVFA dynamics that is less directly predictive within the studied operational range [26,27].
The SHAP dependency plots provide direct insight into the direction, nonlinearity, and interaction-driven behavior of the variables governing TVFA prediction. The plots indicate that increases in pCO2 are generally associated with decreasing SHAP contributions, implying a reduction in predicted TVFA at higher pCO2 levels, whereas lower pCO2 values correspond to positive contributions and elevated predicted TVFA. This relationship is clearly nonlinear, with a transition region separating regimes of positive and negative influence, suggesting the presence of critical operating zones. Similarly, the SHAP dependency plots for pH show that lower pH values contribute positively to TVFA prediction, consistent with acid accumulation, while increasing pH gradually reduces and ultimately reverses this effect. The contribution of TAN is non-monotonic and highly conditioned by the prevailing pCO2 and pH levels, indicating that TAN may exert either stabilizing or destabilizing effects depending on the system state. These interaction patterns demonstrate that TVFA accumulation cannot be attributed to single-variable effects but instead emerges from joint variable configurations. From an operational perspective, regions characterized by positive SHAP contributions correspond to conditions associated with higher predicted TVFA and increased instability risk, whereas negative contributions indicate comparatively stable operating regimes.
The MI analysis reveals distinct levels of association between the three input features and TVFA(M) concentration. TAN (M) exhibited the highest MI value (0.476), followed by pH (0.449) and pCO2 (0.215). While this ranking indicates that TAN (M) and pH contain substantial global statistical information related to TVFA(M) dynamics, the SHAP-based feature importance analysis provides a more mechanistically informative interpretation. In particular, SHAP analysis of the TabNet model identifies pCO2 as the most influential feature, despite its relatively low MI value. This discrepancy constitutes clear evidence of the limitations of purely statistical, correlation-based metrics when applied to complex, nonlinear bioprocess systems. Mutual Information captures global, static dependencies between variables, whereas SHAP quantifies feature contributions within a nonlinear predictive model, accounting for interaction effects and condition-dependent behavior. The observed divergence therefore demonstrates that reliance on statistical association measures alone may obscure key process drivers, while explainable machine learning approaches are better suited to uncovering the functional importance of variables within the model’s internal logic. Furthermore, the application of SHAP analysis in this work functions as a systematic sensitivity analysis, elucidating how variations in physicochemical inputs drive the internal logic of the model. This methodology aligns with the approach demonstrated by Ma et al. [52], who utilized SHAP-based interpretable ensemble learning to decode complex non-linear sensitivities in thermal engineering systems. Similar to their findings in microchannel heat exchangers, our results indicate that SHAP can uncover critical functional dependencies that are often obscured by global statistical measures like Mutual Information. Specifically, while pCO2 shows a lower global correlation, the SHAP-based sensitivity analysis identifies it as a pivotal driver for the model’s response to process shifts, highlighting its importance for future monitoring frameworks.
In this exploratory pilot study, the comparative evaluation of TabNet and several artificial neural network architectures provides observations regarding the performance of deep learning methods on structured tabular data. In the present low-dimensional setting, TabNet achieved the reported predictive performance (R2 ≈ 0.85), marginally outperforming the best-performing ANN configuration (R2 ≈ 0.83). While deeper ANN architectures yielded measurable improvements over simpler network designs, they did not consistently surpass the performance of TabNet. These results contribute to the ongoing discussion regarding the role of deep learning for tabular data, reinforcing the notion that increased architectural complexity alone does not guarantee superior predictive accuracy [53,54,55]. Instead, the findings support the view that model architectures specifically tailored for structured tabular inputs, such as TabNet, can be particularly effective in pilot-scale process studies characterized by limited feature dimensionality and constrained data availability.
Tree-based gradient boosting models (CatBoost, XGBoost, and LightGBM) also demonstrated high predictive capability, confirming their effectiveness for structured tabular data. Their competitive performance suggests that ensemble learning remains a high comparative baseline for soft-sensor development within the evaluated setting. Classical models such as SVR and GPR exhibited comparatively lower performance, indicating limitations in their ability to effectively capture the nonlinear and multiscale dynamics of anaerobic digestion.
The proposed soft-sensing framework enables indirect assessment of anaerobic digestion stability through TVFA(M) estimation under controlled laboratory conditions. In this study, anaerobic digestion instability refers to a sustained imbalance between acid production and methanogenic consumption, leading to the accumulation of volatile fatty acids (TVFA(M)) and associated acid–base disturbances. Conversely, bioreactor stability denotes the operational condition in which acidogenesis and methanogenesis remain balanced, maintaining TVFA(M) within non-inhibitory limits. While this demonstrates the potential of the approach for stability monitoring, the present study is limited to offline validation and does not constitute a validated real-time monitoring, predictive maintenance, or control system. Further long-term and industrial-scale validation is required before operational deployment can be considered.
Despite the promising performance of the proposed soft sensor framework, additional limitations inherent to this pilot study must be acknowledged. The research is based on a dataset of limited duration, spanning only an eight-day operational period of CO2 biomethanisation. Although merging daily datasets provided a unified view of multiple operational states and was sufficient for model benchmarking, this short observation window does not allow for a rigorous assessment of properties that are fundamental to monitoring systems intended for continuous operation. In particular, the models were not exposed to regime shifts, concept drift, or seasonal variability, nor to systematic changes in organic loading rates, operational disturbances, or evolving microbial dynamics that commonly occur in long-term industrial anaerobic digestion processes. Additionally, the dataset does not capture sensor-related challenges such as signal noise, temporary data loss, sensor degradation, or calibration drift, which can significantly affect model robustness in real-world environments. Consequently, the present findings should be interpreted as proof-of-concept results that demonstrate feasibility rather than long-term reliability. Validation using extensive longitudinal datasets collected under continuous and industrially relevant operating conditions is required to assess external validity, stability under non-stationary process behavior, and performance consistency in the presence of real-world noise characteristics. Furthermore, it must be noted that this study did not include stability assessments between independent datasets, out-of-distribution tests, or transfer experiments across different reactors and operating configurations. Given that the current comparative model ranking is based on a single experimental context, it is plausible that the observed performance order could be reversed under different operating scenarios. The input feature space was intentionally restricted to three specific physicochemical parameters (pH, pCO2 and TAN (M)) to prioritize cost-effectiveness and sensor availability. While this selection was sufficient for predicting TVFA(M) within the specific experimental conditions of this study, it does not account for other process variables such as temperature, organic loading rate, or hydraulic retention time, which can also influence reactor stability and acidification dynamics. The exclusion of these variables may limit the model’s ability to sustain predictive performance in reactor systems operating under different environmental conditions or processing diverse substrate compositions. Moreover, our preliminary study does not implement or experimentally validate a complete system architecture for online deployment. Key aspects associated with real-time operation, including computational latency, streaming data processing, edge or cloud inference, integration with industrial IoT infrastructures, and interaction with process control strategies, were not explicitly evaluated. Model development and assessment were conducted offline using an existing laboratory-scale dataset, without validation under continuous operating conditions or deployment in anaerobic digestion systems. As a result, the study primarily represents a comparative evaluation of machine learning models applied to historical data rather than a fully validated algorithmic framework for real-time process control. Consequently, further work is required to assess robustness, latency, and control integration under real-world operational conditions.
Furthermore, it is important to acknowledge the potential sensitivity of the proposed models to sensor noise in practical settings. While the laboratory-grade sensors used in this pilot study produced signals with limited variability, real-world monitoring of pH and pCO2 can be subject to stochastic fluctuations and signal interference. Such noise could impact the precision of TVFA(M) estimations. Future research should evaluate the performance of our approach under varying noise levels to better understand its behavior in environments outside controlled laboratory conditions.
As this is a pilot study, future large-scale investigations will incorporate longer monitoring periods, seasonal variations, and additional process parameters to improve overall model performance and predictive consistency.
5. Conclusions
This pilot study presented a SHAP-enhanced machine learning framework for the prediction of TVFA(M) in anaerobic digestion systems using simple and continuously measurable physicochemical parameters, namely pH, pCO2, and TAN (M). The results demonstrated that data-driven soft sensors can effectively estimate TVFA(M) concentrations without requiring direct chemical analysis. Among the eight regression models tested, the TabNet architecture achieved the highest performance with an R2 of 0.8551 and an RMSE of 0.0090 ± 0.0009, indicating high predictive accuracy with limited performance variability across folds. The application of SHAP enhanced the interpretability of model predictions and revealed that pCO2 was the most influential parameter, followed by pH and TAN (M), underscoring the importance of gas–liquid equilibrium and acid–base interactions in determining reactor stability.
The soft-sensing concept in the present work functions as a data-driven inferential layer that estimates TVFA(M), a key indicator of anaerobic digestion instability, from routinely measurable physicochemical parameters (pH, pCO2, and TAN(M)), thereby reducing reliance on laboratory-based chemical analyses [17,18]. Unlike conventional black-box predictive approaches, the proposed framework integrates SHAP analysis to provide mechanistic interpretability of feature contributions, aligning predictive behavior with known biochemical relationships governing acid–base equilibrium and VFA accumulation Within the scope of this pilot study, soft sensing is therefore positioned not as a deployed control or IoT monitoring system, but aimed to show interpretable, data-driven stability assessment that could, following large independent validation, be integrated into anaerobic digestion process monitoring architectures.
Although the results are promising, this work remains a proof of concept limited by the short duration and controlled conditions of the experimental dataset. It is important to clarify that the proposed framework is limited to offline model development and methodological feasibility assessment using controlled laboratory data. The pilot study does not implement or experimentally validate real-time monitoring, predictive maintenance, or process control strategies. Instead, the contribution lies in evaluating whether TVFA(M), as an indicator of anaerobic digestion instability, can be reliably inferred from selected physicochemical variables within a constrained experimental setting. Any extension toward operational deployment in biogas plants requires independent large-scale validation.
Future research will aim to expand the study by collecting long-term datasets from pilot-scale and industrial-scale anaerobic digesters operating under varied environmental and feedstock conditions. This will enable the models to capture seasonal variations, microbial community dynamics, and sensor drift, thereby enhancing their adaptability and predictive consistency. Additional process parameters such as temperature, organic loading rate, hydraulic retention time, biogas production rate, and substrate composition will also be incorporated to better represent the complexity of anaerobic digestion. Furthermore, the integration of the predictive models into online inference systems platforms will be pursued to enable continuous soft sensing, early warning of process disturbances, and adaptive process control.
Subsequent work will also explore transfer learning and domain adaptation techniques to allow model reusability across different reactor systems, minimizing the need for retraining on new datasets. A hybrid modeling approach that combines mechanistic process understanding with data-driven machine learning will be developed to further enhance interpretability and stability under dynamic operating conditions. The continued use of explainable artificial intelligence techniques such as SHAP and other model-agnostic interpretability tools will support transparency and trust in industrial applications. Finally, the long-term goal is to integrate the soft sensor framework into an Internet of Things (IoT)-based process management system, enabling real-time data transmission, cloud-based analytics, and automated control strategies.
By extending this pilot study into a comprehensive, multi-scale research framework, future work can contribute to more efficient biogas production, improved operational reliability, and the advancement of sustainable energy technologies.
Author Contributions
Conceptualization, B.A., N.T., Z.B., A.J.G. and D.T.; B.A., A.B., Z.B., A.J.G., D.T., M.K. and W.W.; software, B.A., A.B., N.T., Z.B., A.J.G. and D.T.; validation, B.I., M.K. and W.W.; formal analysis, B.A., N.T., Z.B. and A.B.; investigation, B.A., A.B., N.T., A.J.G. and M.K.; resources, A.B., N.T., B.I., D.T., M.K. and W.W.; data curation, B.A., A.B., N.T., Z.B., A.J.G. and D.T.; writing—original draft preparation, B.A., A.B., N.T., Z.B., A.J.G. and D.T.; writing—review and editing, B.I., M.K. and W.W.; visualization, A.J.G. and D.T.; supervision, B.I. and W.W.; project administration, B.A., A.B., N.T. and Z.B.; funding acquisition, B.I. All authors have read and agreed to the published version of the manuscript.
Funding
This research was funded by the Science Committee of the Ministry of Science and Higher Education of the Republic of Kazakhstan (Grant No. AP26103739).
Data Availability Statement
The data supporting the findings of this study are publicly available in open-source repositories: https://doi.org/10.3390/pr11010113.
Conflicts of Interest
Authors Assiya Boltaboyeva, Zhanel Baigarayeva, Aliya Jemal Getahun and Dinara Turmakanbet were employed by the company LLP “Kazakhstan R&D Solutions”. The remaining authors declare that the research was conducted in the absence of any commercial or financial relationships that could be construed as a potential conflict of interest.
Abbreviations
The following abbreviations are used in this manuscript:
| AD | Anaerobic Digestion |
| ADM1 | Anaerobic Digestion Model No. 1 |
| AI | Artificial Intelligence |
| ANN | Artificial Neural Network |
| CO2 | Carbon Dioxide |
| CH4 | Methane |
| CV | Cross-Validation |
| DL | Deep Learning |
| GPR | Gaussian Process Regression |
| HPC | High-Performance Computing |
| HRT | Hydraulic Retention Time |
| IoT | Internet of Things |
| K-Fold | K-Fold Cross-Validation |
| LightGBM | Light Gradient Boosting Machine |
| MAE | Mean Absolute Error |
| MI | Mutual Information |
| ML | Machine Learning |
| NGBoost | Natural Gradient Boosting |
| OLR | Organic Loading Rate |
| pCO2 | Partial Pressure of Carbon Dioxide |
| pH | Potential of Hydrogen |
| RF | Random Forest |
| RGF | Regularized Greedy Forest |
| RMSE | Root Mean Square Error |
| R2 | Coefficient of Determination |
| SHAP | SHapley Additive exPlanations |
| SVR | Support Vector Regression |
| TAN | Total Ammonia Nitrogen |
| TAN(M) | Total Ammonia Nitrogen (Molar concentration) |
| TVFA | Total Volatile Fatty Acids |
| TVFA(M) | Total Volatile Fatty Acids (Molar concentration) |
| VFA | Volatile Fatty Acids |
| XAI | Explainable Artificial Intelligence |
| XGBoost | Extreme Gradient Boosting |
References
- Zhu, X.; Blanco, E.; Bhatti, M.; Borrion, A. Improving anaerobic digestion process against acetate accumulation: Insights into organic loading rates and nano magnetite additions. Chem. Eng. J. 2025, 512, 162641. [Google Scholar] [CrossRef]
- Meola, A.; Wolf, K.; Weinrich, S. Meta-tuning and fast optimization of machine learning models for dynamic methane prediction in anaerobic digestion. Bioresour. Technol. 2025, 432, 132654. [Google Scholar] [CrossRef]
- Rutland, H.; You, J.; Liu, H.; Bowman, K. Application of machine learning for FOS/TAC soft sensing in bio-electrochemical anaerobic digestion. Molecules 2025, 30, 1092. [Google Scholar] [CrossRef]
- Zhu, X.; Blanco, E.; Bhatti, M.; Borrion, A. Promoting methanogenesis and stability in anaerobic digestion with nano magnetite under VFA-induced stress. Biofuel Res. J. 2025, 12, 2432–2450. [Google Scholar] [CrossRef]
- Tasmurzayev, N.; Amangeldy, B.; Baigarayeva, Z.; Mansurova, M.; Resnik, B.; Amirkhanova, G. Improvement of HVAC system using the intelligent control system. In Proceedings of the IEEE 7th International Energy Conference (ENERGYCON); IEEE: Piscataway, NJ, USA, 2022. [Google Scholar] [CrossRef]
- Simeonov, I.; Chorukova, E.; Kabaivanova, L. Two-stage anaerobic digestion for green energy production: A review. Processes 2025, 13, 294. [Google Scholar] [CrossRef]
- Sidi Habib, S.; Torri, S.; Mol, S.K. New methodologies for the optimization of operational parameters of biogas power plants: A review. J. Renew. Energy Environ. 2024, 11, 9–27. [Google Scholar] [CrossRef]
- Long, F.; Xu, M.; Liao, W.; Liu, H. Machine learning for predicting and optimizing the performance of a commercial-scale anaerobic digester with diverse feedstocks and operating conditions. Bioresour. Technol. 2025, 435, 132940. [Google Scholar] [CrossRef] [PubMed]
- Yin, D.; Mahboubi, A.; Wainaina, S.; Qiao, W.; Taherzadeh, M.J. Effect of mono- and multiple fermentation parameters on volatile fatty acids production from chicken manure via anaerobic digestion. Bioresour. Technol. 2021, 330, 124992. [Google Scholar] [CrossRef] [PubMed]
- Jin, Q.; Kirk, M.F. pH as a Primary Control in Environmental Microbiology: 1. Thermodynamic Perspective. Front. Environ. Sci. 2018, 6, 21. [Google Scholar] [CrossRef]
- Sarker, S.; Lamb, J.J.; Hjelme, D.R.; Lien, K.M. Role of critical parameters in the design and operation of biogas production plants: A review. Appl. Sci. 2019, 9, 1915. [Google Scholar] [CrossRef]
- Wu, H.; Yang, D.; Zhou, Q.; Song, Z. Effect of pH on anaerobic fermentation of primary sludge at room temperature. J. Hazard. Mater. 2009, 172, 196–201. [Google Scholar] [CrossRef] [PubMed]
- Imamoglu, E. Artificial intelligence and machine learning algorithms in microalgae bioprocesses. Bioengineering 2024, 11, 1143. [Google Scholar] [CrossRef]
- Sami, S.; Massah, J. Advancing biogas production forecasting using artificial intelligence: A comprehensive review. Biomech. Bioenergy Res. 2025, 4, 29–41. [Google Scholar] [CrossRef]
- Zhang, P.; Zhang, T.; Zhang, J.; Liu, H.; Chicaiza-Ortiz, C.; Lee, J.T.E.; He, Y.; Dai, Y.; Tong, Y.W. Machine-learning-assisted prediction of potential biochar and its applications in anaerobic digestion. Carbon Neutrality 2024, 3, 2. [Google Scholar] [CrossRef]
- Zhang, Y.; Heaven, S.; Banks, C.J. Validation of two theoretically derived equations for predicting pH in CO2 biomethanisation. Processes 2023, 11, 113. [Google Scholar] [CrossRef]
- Boe, K. Online Monitoring and Control of the Biogas Process. Ph.D. Thesis, Technical University of Denmark, Lyngby, Denmark, 2006. [Google Scholar]
- Yan, P.; Gai, M.; Wang, Y.; Gao, X. Review of soft sensors in anaerobic digestion process. Processes 2021, 9, 1434. [Google Scholar] [CrossRef]
- Hill, A.; Tait, S.; Baillie, C.; Virdis, B.; McCabe, B. Microbial electrochemical sensors for volatile fatty acid measurement in high-strength wastewaters. Biosens. Bioelectron. 2020, 165, 112409. [Google Scholar] [CrossRef]
- Sun, H.; Wu, S.; Dong, R. Monitoring volatile fatty acids and carbonate alkalinity in anaerobic digestion: Titration methodologies. Chem. Eng. Technol. 2016, 39, 599–610. [Google Scholar] [CrossRef]
- Adeleke, O.; Jen, T.-C. Data-driven and explainable AI framework for optimizing methane yield in large-scale biogas production. Energy Sustain. Dev. 2025; in press. [Google Scholar] [CrossRef]
- Kabir, S.; Hossain, M.S.; Andersson, K. A Review of Explainable Artificial Intelligence from the Perspectives of Challenges and Opportunities. Algorithms 2025, 18, 556. [Google Scholar] [CrossRef]
- Xu, W.; Ma, Z.; Tian, Q.; Chen, Y.; Jiang, Q.; Fan, L. Review of fluorescent pH probes: Ratiometric strategies and multifunctional utility. Chemosensors 2025, 13, 280. [Google Scholar] [CrossRef]
- Pan, H.; Chu, X.; Li, S.; Wang, Z.; Chen, J. Effect of pH on the stability of dairy beverages stabilized with soybean polysaccharides. Foods 2025, 14, 3632. [Google Scholar] [CrossRef]
- Bardi, M.J.; Müller, F.; Polag, D.; Habtu, N.G.; Koch, K. The intriguing effect of CO2 enrichment in anaerobic digestion. Bioresour. Technol. 2024, 416, 131743. [Google Scholar] [CrossRef]
- Cai, Y.; Gallegos, D.; Zheng, Z.; Stinner, W.; Wang, X.; Pröter, J.; Schäfer, F. Combined effect of total ammonia nitrogen, pH, and temperature on anaerobic digestion of chicken manure. Bioresour. Technol. 2021, 337, 125328. [Google Scholar] [CrossRef]
- Yenigün, O.; Demirel, B. Ammonia inhibition in anaerobic digestion: A review. Process Biochem. 2013, 48, 901–911. [Google Scholar] [CrossRef]
- Ahring, B.K.; Sandberg, M.; Angelidaki, I. Volatile fatty acids as indicators of process imbalance in anaerobic digestors. Appl. Microbiol. Biotechnol. 1995, 43, 559–565. [Google Scholar] [CrossRef]
- Emmanuel, T.; Maupong, T.; Mpoeleng, D.; Semong, T.; Mphago, B.; Tabona, O. Survey on missing data in machine learning. J. Big Data 2021, 8, 140. [Google Scholar] [CrossRef] [PubMed]
- Oikonomou, E.D.; Moustakli, E.; Zikopoulos, A.; Dafopoulos, S.; Prapa, E.; Gkountis, A.-M.; Zachariou, A.; Pantou, A.; Giannakeas, N.; Pantos, K.; et al. A Preliminary Machine Learning Assessment of Oxidation-Reduction Potential and Classical Sperm Parameters as Predictors of Sperm DNA Fragmentation Index. DNA 2026, 6, 3. [Google Scholar] [CrossRef]
- Jalali-Najafabadi, F.; Stadler, M.; Dand, N.; Jadon, D.; Soomro, M.; Ho, P.; Marzo-Ortega, H.; Helliwell, P.; Korendowych, E.; Simpson, M.A.; et al. Genetic risk prediction using information theoretic feature selection. Sci. Rep. 2021, 11, 23335. [Google Scholar] [CrossRef]
- Karell-Albo, J.A.; Legón-Pérez, C.M.; Socorro-Llanes, R.; Rojas, O.; Sosa-Gómez, G. Complexity reduction in statistical randomness tests using mutual information. Entropy 2023, 25, 1545. [Google Scholar] [CrossRef]
- Arik, S.Ö.; Pfister, T. TabNet: Attentive interpretable tabular learning. Proc. AAAI Conf. Artif. Intell. 2021, 35, 6679–6687. [Google Scholar] [CrossRef]
- Borisov, V.; Leemann, T.; Seßler, K.; Haug, J.; Pawelczyk, M.; Kasneci, G. Deep neural networks and tabular data: A survey. arXiv 2021, arXiv:2110.01889. [Google Scholar] [CrossRef]
- Fan, J.; Sun, L.; Chen, S.; Si, Y.; Ahmadi, M.; Pishgar, M. Development and validation of a CatBoost-based model for predicting significant creatinine elevation in ICU patients receiving vancomycin therapy. BioMedInformatics 2025, 5, 71. [Google Scholar] [CrossRef]
- Xia, Y.; Jiang, S.; Meng, L.; Ju, X. XGBoost-B-GHM: An ensemble model with feature selection and GHM loss function optimization for credit scoring. Systems 2024, 12, 254. [Google Scholar] [CrossRef]
- Nguyen, T.A.; Ha, C.K. A residual error correction hybrid CNN–LightGBM model for accurate short-term electric load forecasting. J. Robot. Control 2025, 6, 2666–2675. [Google Scholar]
- Sabzekar, M.; Hasheminejad, S.M.H. Robust regression using support vector regressions. Chaos Solitons Fractals 2021, 144, 110738. [Google Scholar] [CrossRef]
- Kocaoğlu, A. Efficient Optimization of a Support Vector Regression Model with Natural Logarithm of the Hyperbolic Cosine Loss Function for Broader Noise Distribution. Appl. Sci. 2024, 14, 3641. [Google Scholar] [CrossRef]
- Karal, Ö. Comparative performance analysis of epsilon-insensitive and pruning-based algorithms for sparse least squares support vector regression. Sigma J. Eng. Nat. Sci. 2024, 42, 578–589. [Google Scholar]
- Karal, Ö. Robust and optimal epsilon-insensitive kernel-based regression for general noise models. Eng. Appl. Artif. Intell. 2023, 120, 105841. [Google Scholar] [CrossRef]
- Du, K.-L.; Jiang, B.; Lu, J.; Hua, J.; Swamy, M.N.S. Exploring kernel machines and support vector machines: Principles, techniques, and future directions. Mathematics 2024, 12, 3935. [Google Scholar] [CrossRef]
- Mamun, O.; Taufique, M.F.N.; Wenzlick, M.; Hawk, J.; Devanathan, R. Uncertainty quantification for Bayesian active learning in rupture life prediction of ferritic steels. Sci. Rep. 2022, 12, 2083. [Google Scholar] [CrossRef] [PubMed]
- Chilenski, M.A.; Greenwald, M.; Marzouk, Y.; Howard, N.T.; White, A.E.; Rice, J.E.; Walk, J.R. Improved profile fitting and uncertainty quantification using Gaussian process regression. Nucl. Fusion 2015, 55, 023012. [Google Scholar] [CrossRef]
- Wang, H.; Li, J.; Zhao, Y.; Liu, B. Optimization of Gaussian process regression with intelligent algorithms for predicting compacted density of gravel–soil materials. Buildings 2025, 15, 3910. [Google Scholar] [CrossRef]
- Park, J.; Lechevalier, D.; Ak, R.; Ferguson, M.; Law, K.H.; Lee, Y.T.; Rachuri, S. Gaussian process regression representation in predictive model markup language. Smart Sustain. Manuf. Syst. 2017, 1, 121–141. [Google Scholar] [CrossRef] [PubMed]
- Artamonov, D.V.; Popova, P.I.; Korf, E.A.; Voitenko, N.G.; Chernysheva, A.A.; Avdonin, P.V.; Jenkins, R.O.; Goncharov, N.V. Interpretable Machine Learning with SHAP Identifies Key Biomarkers in a Multi-Factorial Spectrum of Age-Related Neurological and Metabolic Conditions. Int. J. Mol. Sci. 2026, 27, 1805. [Google Scholar] [CrossRef] [PubMed]
- Al-Sulaimi, I.N.; Nayak, J.K.; Alhimali, H.; Sana, A.; Al-Mamun, A. Effect of volatile fatty acids accumulation on biogas production and prediction of process parameters. Fermentation 2022, 8, 184. [Google Scholar] [CrossRef]
- Zhang, Y.; Chen, L.; Tian, Y. A Framework for Interpreting Machine Learning Models in Bond Default Risk Prediction Using LIME and SHAP. Risks 2026, 14, 23. [Google Scholar] [CrossRef]
- Cerón Chafla, P.; Kleerebezem, R.; Rabaey, K.; van Lier, J.B.; Lindeboom, R.E.F. Direct and indirect effects of increased CO2 partial pressure on the bioenergetics of syntrophic propionate and butyrate conversion. Environ. Sci. Technol. 2020, 54, 12583–12592. [Google Scholar] [CrossRef]
- Camacho Alvarez, D.G.; Chávez García, J.A.; Castillo Alvarez, Y.; Jiménez Borges, R. Sustainable Valorization of Bovine–Guinea Pig Waste: Co-Optimization of pH and EC in Biodigesters. Recycling 2025, 10, 190. [Google Scholar] [CrossRef]
- Ma, Z.; Wang, R.; Song, G.; Zhang, K.; Zhao, Z.; Wang, J. Interpretable ensemble prediction for anaerobic digestion performance of hydrothermal carbonization wastewater. Sci. Total Environ. 2023, 908, 168279. [Google Scholar] [CrossRef]
- Shwartz-Ziv, R.; Armon, A. Tabular data: Deep learning is not all you need. Inf. Fusion 2022, 81, 84–90. [Google Scholar] [CrossRef]
- Alibabaei, K.; Gaspar, P.D.; Lima, T.M.; Campos, R.M.; Girão, I.; Monteiro, J.; Lopes, C.M. A Review of the Challenges of Using Deep Learning Algorithms to Support Decision-Making in Agricultural Activities. Remote Sens. 2022, 14, 638. [Google Scholar] [CrossRef]
- Why do tree-based models still outperform deep learning on tabular data? arXiv 2022, arXiv:2207.08815. [CrossRef]


Disclaimer/Publisher’s Note: The statements, opinions and data contained in all publications are solely those of the individual author(s) and contributor(s) and not of MDPI and/or the editor(s). MDPI and/or the editor(s) disclaim responsibility for any injury to people or property resulting from any ideas, methods, instructions or products referred to in the content. |
© 2026 by the authors. Licensee MDPI, Basel, Switzerland. This article is an open access article distributed under the terms and conditions of the Creative Commons Attribution (CC BY) license.