Abstract
Earthquake predictability remains a central challenge in seismology. Are earthquakes inherently unpredictable phenomena, or can they be forecasted through advances in technology? Contemporary seismological research continues to pursue this scientific milestone, often referred to as the ‘Holy Grail’ of earthquake prediction. In the direction of earthquake prediction based on historical data, the Grammatical Evolution technique of GenClass demonstrated high predictive accuracy for earthquake magnitude. Similarly, our research team follows this line of reasoning, operating under the belief that nature provides a pattern that, with the appropriate tools, can be decoded. What is certain is that, over the past 30 years, scientists and researchers have made significant strides in the field of seismology, largely aided by the development and application of artificial intelligence techniques. Artificial Neural Networks (ANNs) were first applied in the domain of seismology in 1994. The introduction of deep neural networks (DNNs), characterized by architectures incorporating two hidden layers, followed in 2002. Subsequently, recurrent neural networks (RNNs) were implemented within seismological studies as early as 2007. Most recently, grammatical evolution (GE) has been introduced in seismological studies (2025). Despite continuous progress in the field, achieving the so-called “triple prediction”—the precise estimation of the time, location, and magnitude of an earthquake—remains elusive. Nevertheless, machine learning and soft computing approaches have long played a significant role in seismological research. Concerning these approaches, significant advancements have been achieved, both in mapping seismic patterns and in predicting seismic characteristics on a smaller geographical scale. In this way, our research analyzes historical seismic events from 2004 to 2011 within the latitude range of 21°–79° longitude range of 33°–176°. The data is categorized and classified, with the aim of employing grammatical evolution techniques to achieve more accurate and timely predictions of earthquake magnitudes. This paper presents a systematic effort to enhance magnitude prediction accuracy using GE, contributing to the broader goal of reliable earthquake forecasting. Subsequently, this paper presents the superiority of GenClass, a key element of the grammatical evolution techniques, with an average error of 19%, indicating an overall accuracy of 81%.
1. Introduction
Seismology was first established as an academic discipline in 1876 at the Imperial College of Engineering in Tokyo, when John Milne (1850–1913) was invited to teach there. In 1886, S. Sekiya (1855–1896) was appointed as the world’s first professor dedicated specifically to the field of seismology [1]. Nevertheless, the seismologists who left a lasting legacy lending their names to the classification of earthquakes were Charles Richter (1900–1985) and Giuseppe Mercalli (1850–1914). The former developed, in 1935, a scale measuring the magnitude of seismic events ranging from 1 to 9 [2], while the latter devised a scale that categorizes the destructive effects of an earthquake and it is shown in Table 1 ranging from levels 1 to 12 [3]. The introduction of the Richter scale marked a significant advancement in seismology by establishing a standardized method for quantifying earthquake magnitude. This standardization enabled consistent comparisons between seismic events, thereby enhancing the analysis, preparedness, and management of earthquake-related disasters [4]. On the other hand, the Mercalli scale assessed the effects of an earthquake using qualitative criteria based on observed impacts on buildings, infrastructure, and human perception.

Table 1.
The Modified Mercalli Intensity Scale (near the epicenter of the earthquake).
These measurements proved particularly applicable in urban environments, especially within Western societies, where systematic documentation of earthquake damage was feasible [5]. The classification of earthquakes has made it possible not only to develop seismic hazard maps but also to organize data systematically for the development of algorithms aimed at predicting seismic events. In Figure 1, hazard map issued by the Global Earthquake Model (https://www.globalquakemodel.org/ (accessed on 5 November 2025)) is outlined, indicating a 10% probability of being exceeded within 50 years.
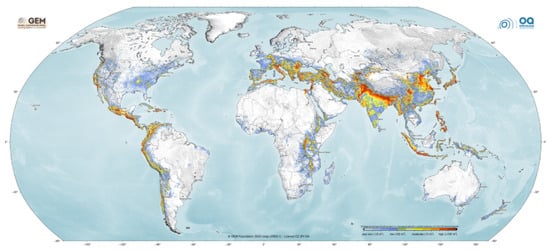
Figure 1.
Hazard map based on the Global Earthquake Model.
In this framework, researchers are increasingly employing artificial intelligence and other advanced methodologies to improve the timely prediction of earthquakes and other natural hazards, aiming ultimately to support communities in implementing protective actions and reducing potential impacts [6]. A series of machine learning techniques were applied on data gathered from earthquakes. For example, artificial neural networks (ANNs) [7] were first applied to the field of seismology in 1994, specifically through research focused on earthquake prediction using seismic electric signals [8]. A more advanced form of an artificial neural network (ANN) was employed in a related study [9]. Furthermore, Mousavi et al. [10] suggested an attentive deep-learning model for simultaneous earthquake detection. Moreover, researchers employed convolutional neural networks (CNNs) [11] trained on over 18 million manually annotated seismograms from Southern California to directly infer earthquake parameters from raw waveform data, thereby eliminating the need for manual feature extraction. The model demonstrated exceptional accuracy, achieving a standard deviation of just 0.023 s in arrival time estimation and a 95% success rate in polarity classification [12].
The earliest application of deep neural networks (DNNs) [13], incorporating two hidden layers, was introduced in 2002 [14]. Subsequently, a high-resolution earthquake catalog was generated through the application of deep neural network (DNN) techniques, providing valuable insights into the complexity and temporal characteristics of earthquake sequences, as well as their connections with recent nearby seismic events, as outlined in related studies [15]. Additionally, recurrent neural networks (RNNs) [16] within the field of seismology was introduced in 2007 [17]. Furthermore, a subsequent study regarding earthquake magnitude prediction using machine learning techniques was introduced recently [18], concentrated on forecasting earthquake magnitudes in the Hindukush region. Four machine learning approaches neural network-based pattern recognition, recurrent neural networks, random forests [19], and a linear programming boost ensemble classifier were individually applied to model the relationships between calculated seismic parameters and the likelihood of future earthquake occurrences. Additionally, a subsequent study showed that nearest-neighbor diagrams offer a straightforward yet effective method for distinguishing between different seismic patterns and evaluating the reliability of earthquake catalogs [20]. Another research team used the nearest neighbor method and determined that the Weibull model offered a more accurate fit for seismic data in California, showing a well-structured tail behavior. They further confirmed the model’s robustness by successfully applying it to independent datasets from Japan, Italy, and New Zealand [21].
Building on recent advancements, Rouet-Leduc et al. applied machine learning techniques to datasets obtained from shear laboratory experiments, with the objective of identifying previously undetected signals that could potentially precede seismic events [22]. In a subsequent study, the same research team applied a machine learning-based method, initially developed in the laboratory, to analyze large volumes of raw seismic data from Vancouver Island. This methodology enabled the differentiation of pertinent seismic signals from background noise and holds promise for evaluating whether, and under what conditions, a slow slip event might be associated with or evolve into a major earthquake [23]. Additionally, a recent study developed a predictive model capable of estimating both the location and magnitude of potential earthquakes for the following week. The model utilized seismic data from the current week and targeted seismogenic regions in southwestern China. It achieved a testing accuracy of 70%, with precision, recall, and F1 score values of 63.63%, 93.33%, and 75.66%, respectively [24]. Moreover, in another publication, the research team demonstrated that machine learning techniques can effectively predict the timing and magnitude of laboratory-induced earthquakes by reconstructing and interpreting the system’s complex spatiotemporal loading history [25].
Noteworthy is the study by Zhang et al., which offers new perspectives in the seismology field. Specifically, the authors succeeded in documenting the directionality of coseismic acoustic waves generated by a major earthquake and in elucidating the coupling between seismic activity, the ionosphere, and space weather. Their findings are presented in the study titled “Successively Equatorward Propagating Ionospheric Acoustic Waves and Possible Mechanisms Following the Mw7.5 Earthquake in Noto, Japan, on 1 January 2024” [26]. In contrast, the current work focuses primarily on the classification of earthquakes using grammatical evolution techniques.
In this paper, a technique based on grammatical evolution [27] is proposed for the efficient creation of classification rules on seismic data that are widely available on the internet. Grammatical evolution is a genetic algorithm [28] where the chromosomes are a series of production rules derived from a provided Backus–Naur form (BNF) grammar [29]. Among the numerous cases of application of grammatical evolution, one can find complications such as function approximation [30,31], economic problems [32], network security issues [33], water quality problems [34], medical problems [35], evolutionary computation [36], prediction of temperature in data centers [37], solving trigonometric problems [38], composing music [39], construction of neural networks [40,41], numerical problems [42], video games [43,44], energy issues [45], combinatorial optimization [46], security issues [47], evolution of decision trees [48], and problems that appear in electronics [49].
The main contributions of the current work are as follows:
- The proposed method investigates a wider geographical area than other related studies, incorporating 255 seismic regions out of the 708 regions identified worldwide.
- The current work utilized a classification method based on grammatical evolution to properly classify the seismic events in some predefined classes. The use of this technique has two clear advantages: on the one hand, it isolates those characteristics of a seismic event that are deemed necessary for its effective classification and on the other hand, it can discover, through the generation of complex rules, hidden linear and nonlinear correlations between the characteristics of the problem.
2. Materials and Methods
In this section, an extensive presentation of the seismic data used, their post-processing, as well as the computational rule construction method applied for the effective classification of earthquakes will be given.
2.1. The Dataset Employed
In this study, we utilized open data provided by the NSF Seismological Facility for the Earth Consortium (SAGE), specifically accessed through the Interactive Earthquake Browser (https://ds.iris.edu/ (accessed on 5 November 2025)). The choice of NSF data was motivated by its enhanced functionality and high accessibility. In particular, it allows for the download of up to 25,000 records per file, substantially accelerating the workflow and enhancing information retrieval. Additionally, the platform provides an interactive global map, enabling both data visualization and the extraction of datasets directly from the displayed geographical regions in real time. While the GEOFON program offers comparable information, it limits the maximum number of earthquakes retrievable per query to 1000 events, thereby constraining the temporal coverage of data extraction. This limitation is especially relevant, as nearly 1000 seismic events can occur globally within a single day. The NSF SAGE Facility is acknowledged as a reliable data repository, having been certified by the CoreTrustSeal Standards and Certification Board.
2.2. Dataset Description
We downloaded and analyzed 1,035,971 earthquake events from IEB between 1 April 2004 and 16 March 2011, totalling 2487 days. The dataset included the following variables: year, month, day, time, latitude (Lat), longitude (Lon), depth, magnitude, region, and timestamp. We utilized the coordinates between latitudes 21°–79° and longitudes 33°–176°, selected the magnitude measurements ranging from 1.0 to 10.0, and included all available depths by default for the depth range. From our dataset, the daily average number of earthquakes was 41,655; the minimum was 33 (2 March 2005), and the maximum was 2326 (11 March 2011) (Tohoku earthquake, 9.1 mag). The regions encompassed within these geographical coordinates number 255, while globally approximately 708 seismogenic zones have been recorded since 1970, based on data from the Interactive Earthquake Browser. The features of the original dataset are shown in Table 2.

Table 2.
The description of the original dataset.
We selected the specific time period for two main reasons. First, it allowed us to manage the exceptionally large volume of seismic data, amounting 1,035,971 records. Second, we observed a distinct pattern in the seismic data from 2015 to 2025 that did not align with the established seismic trends. More specifically, the number of recorded events rose to 46,400, a finding that prompted further consideration. Regarding the geographical region, we deliberately selected seismic zones with high activity, such as those in the Mediterranean, including Greece and Turkey, which share the same longitudinal range as Japan.
2.3. Pre-Processing Steps
The initial dataset was enhanced after processing the original data. An important role in this process was played by the distance, which will be used to determine when two earthquakes are close in distance. This process attempts to include critical information about seismic events that can potentially be extracted from seismic events that are relatively close in both kilometer distance and time. Hence, additional features were derived based on the critical distance to capture spatial-temporal proximity of events. The proposed value in the present implementation was 5 km. Based on the above distance, the following features were added to the datasets:
- Number of seismic events at a distance less than the that have occurred in a previous time.
- Average magnitude of seismic events at a distance less than , which have preceded the current seismic event in time.
- The greatest magnitude of a seismic event recorded in the past, at a distance of less than from the current seismic event.
- The time in seconds since the largest seismic event that has occurred in the past at a distance less than from the current seismic event.
- The distance in kilometers from the largest seismic event that has occurred in the past at a distance less than from the current seismic event.
In addition, the size of the seismic recordings was divided into two large classes:
- The first class contains all the events with a magnitude of ≤3
- The second class contains all the remaining events, with a magnitude of >3.
2.4. The Used Method
The method that constructs classification rules was initially presented in [50] and an implementation in C++ was suggested later by Anastasopoulos et al. [51]. The method can produce a series of classification rules in a human readable form in order to effectively classify patterns in predefined classes. This method does not require prior knowledge of the specifics of a dataset and can furthermore discover hidden correlations between the features of the dataset or even isolate only those features that play the most significant role in the successful classification of patterns. The method has been successfully applied in many cases, such as pollution detection [52] and network problems [53]. The main steps of this method are as follows:
- Initialization step.
- (a)
- Set the parameters of the genetic algorithm: is the number of chromosomes, is the number of allowed generations, is the selection rate, and is the mutation rate.
- (b)
- Perform the initialization of chromosomes . Every chromosome is considered as a set of randomly selected integers.
- (c)
- Set , the generation counter.
- Fitness calculation step.
- (a)
- For do
- Create a classification program for the associated chromosome . The construction of this program is performed using the BNF grammar of Figure 2.
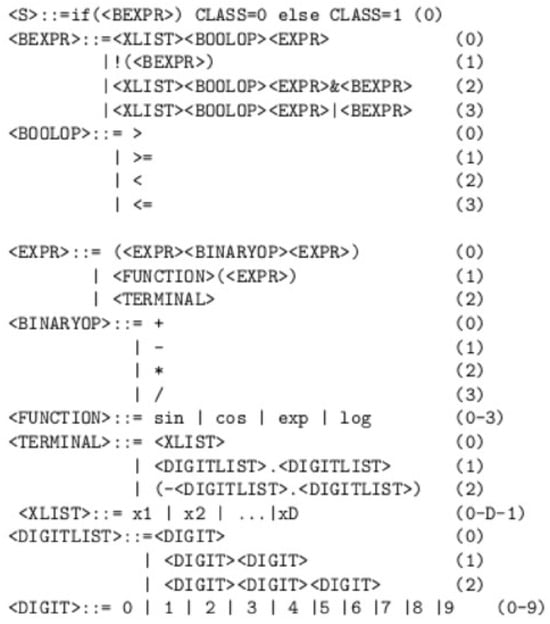 Figure 2. The Backus–Naur form grammar used to generate classification rules for seismic events. Every non terminal symbol is enclosed in and the symbol is used to denote a new production rule, that substitutes the left hand of the rule with the symbol sequence on the right hand. The numbers at the end of each production rule are the sequence numbers for the corresponding non-terminal symbol and are used by Grammatical Evolution during the creation of programs for that particular grammar.
 - The produced classification program is applied to the train set of the objective problem. Denote with (fitness value) the classification error for this program.
- (b)
- End For
- Application of genetic operations.
- (a)
- Selection: The chromosomes are ranked according to their fitness values. The chromosomes with the lowest fitness are carried over to the next generation without modification, while the remaining chromosomes are replaced by offspring generated through crossover and mutation.
- (b)
- Crossover: In this procedure, a series of offspring are produced through a process similar to biological crossover in nature. For every couple of produced offsprings, two chromosomes are selected from the current population, using tournament selection. Subsequently, these chromosomes will produce the set with the application of one-point crossover. A graphical example of the one-point crossover method is outlined in Figure 3.
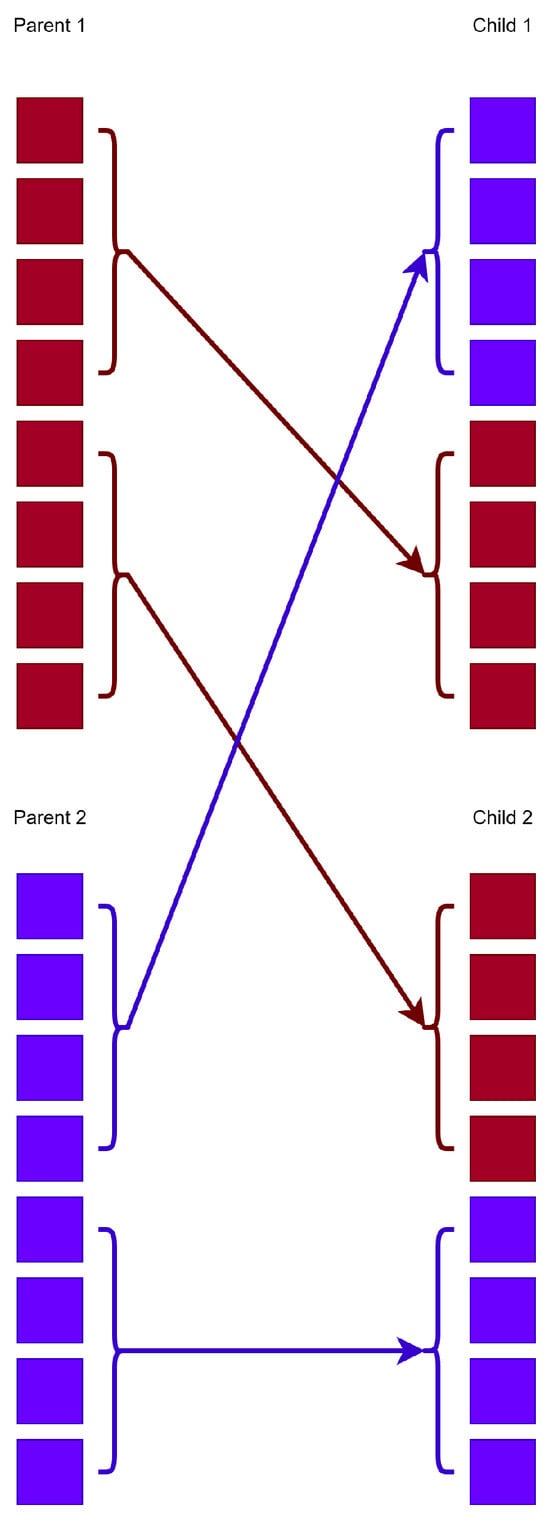 Figure 3. An example of the one-point crossover method. The red color is used to denote the first chromosome that participates in the crossover procedure and the blue color denotes the second chromosome. The arrows are used to represent the exchange of elements between the two chromosomes in order to produce offsprings.
 - (c)
- Mutation: During this procedure, a random number is chosen for every element of each chromosome . Subsequently, this element is altered randomly when .
- Termination check step.
- (a)
- Set
- (b)
- If go to the fitness calculation step or terminate.
3. Experiments
The code employed in the experiments was implemented using the C++ programming language, along with the freely available optimization tool [54], which can be downloaded from https://github.com/itsoulos/GlobalOptimus.git (accessed on 12 October 2025). Additionally, the WEKA programming tool [55] was utilized. C++ was chosen due to its high computational efficiency. Each experiment was repeated 30 times using a different random seed for each run, and the average classification error was reported. The experimental results were validated using the ten-fold cross-validation method. The parameter values for the employed methods are presented in Table 3.

Table 3.
The values for the experimental settings.
3.1. Experimental Results
The following machine learning methods were used in the conducted experiments as denoted in Table 4.

Table 4.
Experimental results on the obtained datasets with the incorporation of the mentioned machine learning methods. The acronyms are defined as follows: RBF (radial basis function networks), MLP (multilayer perception network), NNC (neural network construction).
- A radial basis function (RBF) network [56,57] with 10 weights.
- A multilayer perception (MLP) neural network [58,59] with 10 processing nodes. The neural network was trained using the BFGS optimization method [60].
- BAYES, where the naive Bayes method [61] was utilized on the dataset.
- The column BAYESNN denotes the results from the application of the Bayesian optimizer as implemented in the BayesOpt [62] library to train a neural network with processing nodes. The code can be downloaded from https://github.com/rmcantin/bayesopt (accessed on 12 October 2025).
- Neural network construction (NNC) method [63], which creates the architecture of neural networks using grammatical eEvolution.
- GENCLASS represents the application of the proposed method.
Also, the classification error for all methods per year is presented in Figure 4. Table 4 reports yearly classification error rates (2004–2011) for six machine learning models. The proposed GENCLASS method consistently ranks first every year, achieving the lowest average error of 19.00%, which corresponds to an overall accuracy of about 81%. The runner-up is NNC, with an average error of 23.54%, so GENCLASS reduces error by roughly 4.54 percentage points on average, about a 19% relative reduction versus the closest competitor. The annual margin of GENCLASS over NNC ranges from 3.20 to 7.32 points, peaking in 2006. Beyond accuracy, GENCLASS also shows the smallest across-year variability (standard deviation ≈ 1.16), indicating stable performance throughout the evaluation period. In contrast, MLP exhibits the highest mean error (28.80%) and the largest variability, with a pronounced deterioration in 2011. Overall, these results support the article’s claim that grammatical evolution is particularly effective for this seismic classification problem, as GENCLASS delivers both the lowest average error and the most consistent year-to-year behavior.
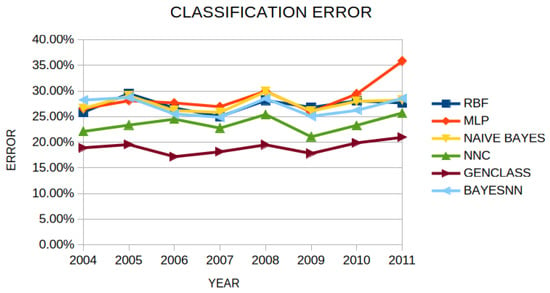
Figure 4.
The classification error of each machine learning method per year.
The R-based significance analysis reveals a clear overall difference among models (Friedman , very strong evidence), with pairwise tests indicating where these differences lie (Figure 5). GENCLASS outperforms MLP with (extremely significant) and BAYES with 6 (highly significant), and the comparison with RBF is also statistically significant at . In contrast, GENCLASS vs. BAYESNN () and GENCLASS vs. NNC () are not statistically significant at the threshold. Overall, while the omnibus test confirms marked differences across models, the superiority of the proposed method is clearly supported against MLP, BAYES, and RBF, whereas the contrasts with BAYESNN and NNC do not reach conventional significance.
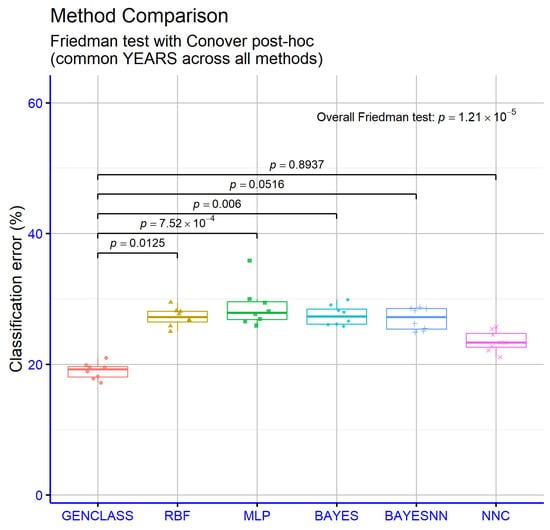
Figure 5.
Statistical tests performed on the experimental results using the variety of machine learning methods.
3.2. Experiments with the Critical Distance
The critical distance was used to generate the final datasets as the distance between seismic events. In order to determine the correlation of this parameter with the experimental results produced, another experiment was conducted where this distance ranged from 2 to 20 km. In this experiment, the proposed classification rule generation technique was used. The experimental results from this experiment are presented in Table 5. The results indicate that the critical distance influences performance, but the effect size is small. The average classification error decreases slightly as the distance increases: 19.08% for km, 19.00% for 5 km, 18.82% for 10 km, and 18.71% for 20 km. The gap between the worst and best settings is 0.37 percentage points, i.e., about a 1.9% relative error reduction, so the overall advantage of the 20 km setting is real but modest. Year by year, km achieved the lowest error in 4 out of 8 years (2004, 2005, 2009, 2010), km was the best in 2008, km in 2007, and km, indicating no monotonic or universally optimal choice across the years but a mild preference toward larger distances. Regarding stability, km showed the narrowest range over time (17.51–20.70%), whereas km exhibited the largest spread, mainly due to 2011 (16.97–21.78%). Overall, the method benefits marginally from increasing , with 20 km yielding the lowest average error, but the choice should also consider temporal stability and yearly idiosyncrasies, since the per-year optimum shifts across settings.

Table 5.
Experiments with the GENCLASS method and different values of critical distance .
The significance analysis across critical distance settings (dc) provides no statistical evidence of an effect on classification error (Figure 6). The omnibus Friedman test is non-significant (), indicating no systematic differences across levels. Pairwise contrasts corroborate this: km vs. 5 km (), 10 km (), and 20 km () are not significant, nor are km vs. 20 km () and km vs. 20 km (). The km vs. 10 km comparison returned , which typically reflects a degenerate post-hoc case (e.g., complete rank ties or identical values per block) and does not alter the overall conclusion. In sum, within the 2–20 km range, dc does not yield statistically significant performance differences for the proposed method, so this hyperparameter may be selected based on practical or stability considerations rather than expected accuracy gains.
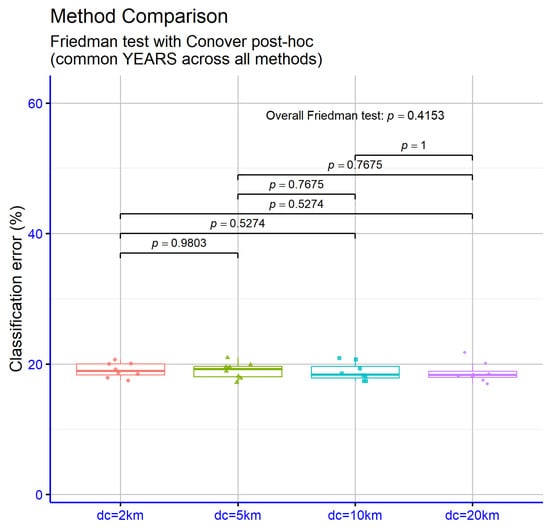
Figure 6.
Statistical comparison for the results obtained by the application of the GENCLASS method, using a variety of values for the critical distance .
3.3. Experiments with the Number of Generations
An additional experiment was conducted to verify the stability of the proposed classification rule generation technique. In this experiment, the maximum number of generations ranged from 200 to 2000, and the experimental results per year are presented in Table 6. In this table, the results show a clear downward trend in classification error as the maximum number of generations increases. The average error decreases from 20.20% to 19.58% , 19.25% and 19.00% , i.e., a total gain of 1.20 percentage points or roughly a 6% relative reduction compared to . Improvements exhibit diminishing returns: the largest drop was from 200 to 500 (−0.62), followed by 500 to 1000 (−0.33) and 1000 to 2000 (−0.25). On a per-year basis, was the best in six out of eight years (2006–2011, except 2004 and 2005), while in 2004–2005, the minimum error occured at . The 2005 value for is noticeably higher than the other settings, which may reflect stochastic variability or model over-specialization for that year’s data. The spread across years was broadly similar across settings, so the main benefit of increasing generations is a lower mean error rather than a dramatic change in variability. In practice, the 1000–2000 range offers the strongest performance, but comes very close to (0.25 points apart) and is attractive under tighter computational budgets; on the other hand, yields the lowest average error when runtime is not a constraint.

Table 6.
Experiments with the GENCLASS method and different values for the number of generations .
The significance levels in Figure 7 indicate that the maximum number of generations has an overall effect on performance, as evidenced by a strongly significant Friedman test . In pairwise terms, moving from to yields a statistically significant error reduction (), and the contrast between and is even more significant (), confirming that a low generation budget underperforms relative to higher budgets. By contrast, vs. is not significant (), nor are vs. () and vs. (), suggesting diminishing returns beyond roughly 1000 generations. The vs. comparison returned , typically due to a degenerate post-hoc scenario (e.g., complete rank ties or identical per-block values) and did not alter the main conclusion. Overall, increasing generations above 200 significantly improves performance, with gains saturating around 1000 generations and no clear statistical advantage of 2000 over 1000.
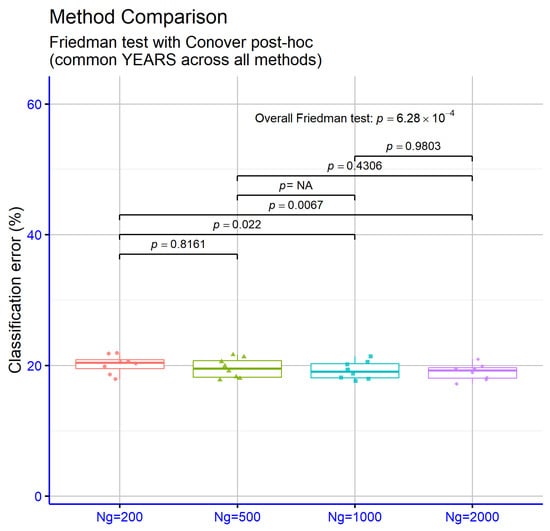
Figure 7.
Statistical comparison for the results obtained by the usage of the GENCLASS method, using different values for the maximum number of generations .
4. Conclusions
This study introduces an innovative methodology for earthquake classification employing various machine learning methods, including RBF, MLP, BAYES, and NNC, along with the proposed GENCLASS approach. The analysis covers seismic data recorded between 2004–2011 within the geographical bounds of latitudes 21°–79° and longitudes 33°–176°. Our first process involved classifying the size of the seismic events into two large classes: the first class contains all the events with a magnitude of ≤3, and the second class contains all the remaining events with magnitude of >3, followed by magnitude prediction based on the classified data.
To construct the final datasets, the critical distance , defined as the distance between seismic events, was applied. The results indicate that the proposed method benefits slightly from increasing , with a value of 20 km yielding the optimal average error. Also we Set as the number of chromosomes in the genetic population. Furthermore, an additional experiment was conducted to evaluate the stability of the proposed generations mechanism . In this test, the maximum number of generations varied between 200 and 2000, indicating that the maximum number of generations has an overall effect on performance. Among all evaluated methods, GENCLASS consistently achieved the best performance each year, attaining the lowest average error rate of 19%, corresponding to an overall classification accuracy of 81%.
The main challenges encountered in this research were related to the large volume of data (exceeding one million records) and the adaptation of such data into a reliable classification system. In general, seismology still keeps many of its secrets well guarded, but not indefinitely. With the rapid advancement of machine learning and artificial intelligence techniques, these enigmas are gradually being unraveled. Future work in this area of research should include recent seismic events as well as the use of other advanced computational intelligence techniques such as feature construction from existing ones [64]. Furthermore, since grammatical evolution is essentially a genetic algorithm, parallel computing techniques can be used to speed up this process, such as the OpenMP method [65] or the OpenMPI programming library [66].
Author Contributions
Conceptualization, C.K. and I.G.T.; methodology, C.K.; software, I.G.T.; validation, C.S. and V.C.; formal analysis, V.C.; investigation, C.K.; resources, C.S.; data curation, C.K.; writing original draft preparation, C.K.; writing review and editing, I.G.T.; visualization, V.C.; supervision, C.S.; project administration, C.S.; funding acquisition, C.S. All authors have read and agreed to the published version of the manuscript.
Funding
This research has been financed by the European Union: Next Generation EU through the Program Greece 2.0 National Recovery and Resilience Plan, under the call RESEARCH-CREATE-INNOVATE, project name “iCREW: Intelligent small craft simulator for advanced crew training using Virtual Reality techniques” (project code: TAEDK-06195).
Data Availability Statement
The original contributions presented in this study are included in the article. Further inquiries can be directed to the corresponding author.
Conflicts of Interest
The authors declare no conflicts of interest.
References
- Lee, W.H.; Jennings, P.; Kisslinger, C.; Kanamori, H. International Handbook of Earthquake and Engineering Seismology: Part A. Int. Geophys. Ser. 2002, 81, 237–265. [Google Scholar]
- Online Archive of California, Guide to the Papers of Charles F. Richter, 1839–1984. Available online: https://oac.cdlib.org/findaid/ark:/13030/kt787005jn/admin/ (accessed on 5 November 2025).
- Encyclopedia.com. Mercalli, Giuseppe. Available online: https://www.encyclopedia.com/people/science-and-technology/environmental-studies-biographies/giuseppe-mercalli#:~:text=Mercalli (accessed on 5 November 2025).
- GeoVera, A Journey Through Time: The History of the Richter Scale. 2023. Available online: https://geovera.com/2023/04/27/history-richter-scale/ (accessed on 5 November 2025).
- National Academies of Sciences, Engineering, and Medicine. Living on an Active Earth: Perspectives on Earthquake Science; The National Academies Press: Washington, DC, USA, 2003; Available online: https://nap.nationalacademies.org/read/10493/chapter/1#ii (accessed on 5 November 2025). [CrossRef]
- Allie, H. How Machine Learning Might Unlock Earthquake Prediction. 2023. MIT Technology Review. Available online: https://www.technologyreview.com/2023/12/29/1084699/machine-learning-earthquake-prediction-ai-artificial-intelligence/ (accessed on 5 November 2025).
- Zou, J.; Han, Y.; So, S.S. Overview of artificial neural networks. In Artificial Neural Networks: Methods and Applications; Humana Press: Totowa, NJ, USA, 2008; pp. 14–22. [Google Scholar]
- Lakkos, S.; Hadjiprocopis, A.; Comley, R.; Smith, P. A neural network scheme for earthquake prediction based on the seismic electric signals. In Proceedings of the IEEE Workshop on Neural Networks for Signal Processing, Ermioni, Greece, 6–8 September 1994; pp. 681–689. [Google Scholar]
- Mousavi, S.M.; Beroza, G.C. A machine-learning approach for earthquake magnitude estimation. Geophys. Res. Lett. 2020, 47, e2019GL085976. [Google Scholar] [CrossRef]
- Mousavi, S.M.; Ellsworth, W.L.; Zhu, W.; Chuang, L.Y.; Beroza, G.C. Earthquake transformer—An attentive deep-learning model for simultaneous earthquake detection and phase picking. Nat. Commun. 2020, 11, 3952. [Google Scholar] [CrossRef] [PubMed]
- Li, Z.; Liu, F.; Yang, W.; Peng, S.; Zhou, J. A survey of convolutional neural networks: Analysis, applications, and prospects. IEEE Trans. Neural Netw. Learn. Syst. 2021, 33, 6999–7019. [Google Scholar] [CrossRef] [PubMed]
- Ross, Z.E.; Meier, M.A.; Hauksson, E. P wave arrival picking and first-motion polarity determination with deep learning. J. Geophys. Res. Solid Earth 2018, 123, 5120–5129. [Google Scholar] [CrossRef]
- Sze, V.; Chen, Y.H.; Yang, T.J.; Emer, J.S. Efficient processing of deep neural networks: A tutorial and survey. Proc. IEEE 2017, 105, 2295–2329. [Google Scholar] [CrossRef]
- Negarestani, A.; Setayeshi, S.; Ghannadi-Maragheh, M.; Akashe, B. Layered neural networks based analysis of radon concentration and environmental parameters in earthquake prediction. J. Environ. Radioact. 2002, 62, 225–233. [Google Scholar] [CrossRef]
- Tan, Y.J.; Waldhauser, F.; Ellsworth, W.L.; Zhang, M.; Zhu, W.; Michele, M.; Chiaraluce, L.; Beroza, G.C.; Segou, M. Machine-learning-based high-resolution earthquake catalog reveals how complex fault structures were activated during the 2016–2017 central Italy sequence. Seism. Rec. 2021, 1, 11–19. [Google Scholar] [CrossRef]
- Caterini, A.L.; Chang, D.E. Recurrent neural networks. In Deep Neural Networks in a Mathematical Framework; Springer International Publishing: Cham, Switzerland, 2018; pp. 59–79. [Google Scholar]
- Panakkat, A.; Adeli, H. Neural network models for earthquake magnitude prediction using multiple seismicity indicators. Int. J. Neural Syst. 2007, 17, 13–33. [Google Scholar] [CrossRef]
- Asim, K.M.; Martínez-Álvarez, F.; Basit, A.; Iqbal, T. Earthquake magnitude prediction in Hindukush region using machine learning techniques. Nat. Hazards 2017, 85, 471–486. [Google Scholar] [CrossRef]
- Breiman, L. Random forests. Mach. Learn. 2001, 45, 5–32. [Google Scholar] [CrossRef]
- Hsu, Y.F.; Zaliapin, I.; Ben-Zion, Y. Informative modes of seismicity in nearest-neighbor earthquake proximities. J. Geophys. Res. Solid Earth 2024, 129, e2023JB027826. [Google Scholar] [CrossRef]
- Bayliss, K.; Naylor, M.; Main, I.G. Probabilistic identification of earthquake clusters using rescaled nearest neighbour distance networks. Geophys. J. Int. 2019, 217, 487–503. [Google Scholar] [CrossRef]
- Rouet-Leduc, B.; Hulbert, C.; Lubbers, N.; Barros, K.; Humphreys, C.J.; Johnson, P.A. Machine learning predicts laboratory earthquakes. Geophys. Res. Lett. 2017, 44, 9276–9282. [Google Scholar] [CrossRef]
- Rouet-Leduc, B.; Hulbert, C.; Johnson, P.A. Continuous chatter of the Cascadia subduction zone revealed by machine learning. Nat. Geosci. 2019, 12, 75–79. [Google Scholar] [CrossRef]
- Saad, O.M.; Chen, Y.; Savvaidis, A.; Fomel, S.; Jiang, X.; Huang, D.; Chen, Y. Earthquake forecasting using big data and artificial intelligence: A 30-week real-time case study in China. Bull. Seismol. Soc. Am. 2023, 113, 2461–2478. [Google Scholar] [CrossRef]
- Corbi, F.; Sandri, L.; Bedford, J.; Funiciello, F.; Brizzi, S.; Rosenau, M.; Lallemand, S. Machine learning can predict the timing and size of analog earthquakes. Geophys. Res. Lett. 2019, 46, 1303–1311. [Google Scholar] [CrossRef]
- Zhang, B.; Liu, T.; Feng, X.; Xu, G. Successively equatorward propagating ionospheric acoustic waves and possible mechanisms following the Mw 7.5 earthquake in Noto, Japan, on 1 January 2024. Space Weather 2025, 23, e2024SW003957. [Google Scholar] [CrossRef]
- O’Neill, M.; Ryan, C. Grammatical evolution. IEEE Trans. Evol. Comput. 2002, 5, 349–358. [Google Scholar] [CrossRef]
- Kramer, O. Genetic algorithms. In Genetic Algorithm Essentials; Springer International Publishing: Cham, Switzerland, 2017; pp. 11–19. [Google Scholar]
- Backus, J.W. The Syntax and Semantics of the Proposed International Algebraic Language of the Zurich ACM-GAMM Conference. In Proceedings of the International Conference on Information Processing; UNESCO: Paris, France, 1959; pp. 125–132. [Google Scholar]
- Ryan, C.; Collins, J.; O’Neill, M. Grammatical evolution: Evolving programs for an arbitrary language. In Genetic Programming; Banzhaf, W., Poli, R., Schoenauer, M., Fogarty, T.C., Eds.; EuroGP 1998, Lecture Notes in Computer Science; Springer: Berlin/Heidelberg, Germany, 1998; Volume 1391. [Google Scholar]
- O’Neill, M.; Ryan, M.C. Evolving Multi-line Compilable C Programs. In Genetic Programming; Poli, R., Nordin, P., Langdon, W.B., Fogarty, T.C., Eds.; EuroGP 1999, Lecture Notes in Computer Science; Springer: Berlin/Heidelberg, Germany, 1999; Volume 1598. [Google Scholar]
- Brabazon, A.; O’Neill, M. Credit classification using grammatical evolution. Informatica 2006, 30, 325–335. [Google Scholar]
- Şen, S.; Clark, J.A. A grammatical evolution approach to intrusion detection on mobile ad hoc networks. In Proceedings of the Second ACM Conference on Wireless Network Security, Zurich, Switzerland, 16–19 March 2009. [Google Scholar]
- Chen, L.; Tan, C.H.; Kao, S.J.; Wang, T.S. Improvement of remote monitoring on water quality in a subtropical reservoir by incorporating grammatical evolution with parallel genetic algorithms into satellite imagery. Water Res. 2008, 42, 296–306. [Google Scholar] [CrossRef]
- Hidalgo, J.I.; Colmenar, J.M.; Risco-Martin, J.L.; Cuesta-Infante, A.; Maqueda, E.; Botella, M.; Rubio, J.A. Modeling glycemia in humans by means of Grammatical Evolution. Appl. Soft Comput. 2014, 20, 40–53. [Google Scholar] [CrossRef]
- Tavares, J.; Pereira, F.B. Automatic Design of Ant Algorithms with Grammatical Evolution. In Genetic Programming; Moraglio, A., Silva, S., Krawiec, K., Machado, P., Cotta, C., Eds.; EuroGP 2012. Lecture Notes in Computer Science; Springer: Berlin/Heidelberg, Germany, 2012; Volume 7244. [Google Scholar]
- Zapater, M.; Risco-Martín, J.L.; Arroba, P.; Ayala, J.L.; Moya, J.M.; Hermida, R. Runtime data center temperature prediction using Grammatical Evolution techniques. Appl. Soft Comput. 2016, 49, 94–107. [Google Scholar] [CrossRef]
- Ryan, C.; O’Neill, M.; Collins, J.J. Grammatical evolution: Solving trigonometric identities. In Proceedings of Mendel; Technical University of Brno, Faculty of Mechanical Engineering: Brno, Czech Republic, 1998; Volume 98. [Google Scholar]
- Puente, A.O.; Alfonso, R.S.; Moreno, M.A. Automatic composition of music by means of grammatical evolution. In Proceedings of the APL ’02: Proceedings of the 2002 Conference on APL: Array Processing Languages: Lore, Problems, and Applications, Madrid, Spain, 22–25 July 2002; pp. 148–155. [Google Scholar]
- De Campos, L.M.L.; de Oliveira, R.C.L.; Roisenberg, M. Optimization of neural networks through grammatical evolution and a genetic algorithm. Expert Syst. Appl. 2016, 56, 368–384. [Google Scholar] [CrossRef]
- Soltanian, K.; Ebnenasir, A.; Afsharchi, M. Modular Grammatical Evolution for the Generation of Artificial Neural Networks. Evol. Comput. 2022, 30, 291–327. [Google Scholar] [CrossRef] [PubMed]
- Dempsey, I.; Neill, M.O.; Brabazon, A. Constant creation in grammatical evolution. Int. J. Innov. Comput. Appl. 2007, 1, 23–38. [Google Scholar] [CrossRef]
- Galván-López, E.; Swafford, J.M.; O’Neill, M.; Brabazon, A. Evolving a Ms. PacMan Controller Using Grammatical Evolution. In Applications of Evolutionary Computation; EvoApplications 2010, Lecture Notes in Computer Science; Springer: Berlin/Heidelberg, Germany, 2010; Volume 6024. [Google Scholar]
- Shaker, N.; Nicolau, M.; Yannakakis, G.N.; Togelius, J.; O’Neill, M. Evolving levels for Super Mario Bros using grammatical evolution. In Proceedings of the 2012 IEEE Conference on Computational Intelligence and Games (CIG), Granada, Spain, 11–14 September 2012; pp. 304–311. [Google Scholar]
- Martínez-Rodríguez, D.; Colmenar, J.M.; Hidalgo, J.I.; Micó, R.J.V.; Salcedo-Sanz, S. Particle swarm grammatical evolution for energy demand estimation. Energy Sci. Eng. 2020, 8, 1068–1079. [Google Scholar] [CrossRef]
- Sabar, N.R.; Ayob, M.; Kendall, G.; Qu, R. Grammatical Evolution Hyper-Heuristic for Combinatorial Optimization Problems. IEEE Trans. Evol. Comput. 2013, 17, 840–861. [Google Scholar] [CrossRef]
- Ryan, C.; Kshirsagar, M.; Vaidya, G.; Cunningham, A.; Sivaraman, R. Design of a cryptographically secure pseudo random number generator with grammatical evolution. Sci. Rep. 2022, 12, 8602. [Google Scholar] [CrossRef] [PubMed]
- Pereira, P.J.; Cortez, P.; Mendes, R. Multi-objective Grammatical Evolution of Decision Trees for Mobile Marketing user conversion prediction. Expert Syst. Appl. 2021, 168, 114287. [Google Scholar] [CrossRef]
- Castejón, F.; Carmona, E.J. Automatic design of analog electronic circuits using grammatical evolution. Appl. Soft Comput. 2018, 62, 1003–1018. [Google Scholar] [CrossRef]
- Tsoulos, I.G. Creating classification rules using grammatical evolution. Int. J. Comput. Intell. Stud. 2020, 9, 161–171. [Google Scholar] [PubMed]
- Anastasopoulos, N.; Tsoulos, I.G.; Tzallas, A. GenClass: A parallel tool for data classification based on Grammatical Evolution. SoftwareX 2021, 16, 100830. [Google Scholar] [CrossRef]
- Spyrou, E.D.; Stylios, C.; Tsoulos, I. Classification of CO Environmental Parameter for Air Pollution Monitoring with Grammatical Evolution. Algorithms 2023, 16, 300. [Google Scholar] [CrossRef]
- Margariti, S.V.; Tsoulos, I.G.; Kiousi, E.; Stergiou, E. Traffic Classification in Software-Defined Networking Using Genetic Programming Tools. Future Internet 2024, 16, 338. [Google Scholar] [CrossRef]
- Tsoulos, I.G.; Charilogis, V.; Kyrou, G.; Stavrou, V.N.; Tzallas, A. OPTIMUS: A Multidimensional Global Optimization Package. J. Open Source Softw. 2025, 10, 7584. [Google Scholar] [CrossRef]
- Hall, M.; Frank, F.; Holmes, G.; Pfahringer, B.; Reutemann, P.; Witten, I.H. The WEKA data mining software: An update. ACM SIGKDD Explor. Newsl. 2009, 11, 10–18. [Google Scholar] [CrossRef]
- Park, J.; Sandberg, I.W. Universal Approximation Using Radial-Basis-Function Networks. Neural Comput. 1991, 3, 246–257. [Google Scholar] [CrossRef]
- Montazer, G.A.; Giveki, D.; Karami, M.; Rastegar, H. Radial basis function neural networks: A review. Comput. Rev. J. 2018, 1, 52–74. [Google Scholar]
- Abiodun, O.I.; Jantan, A.; Omolara, A.E.; Dada, K.V.; Mohamed, N.A.; Arshad, H. State-of-the-art in artificial neural network applications: A survey. Heliyon 2018, 4, e00938. [Google Scholar] [CrossRef]
- Suryadevara, S.; Yanamala, A.K.Y. A Comprehensive Overview of Artificial Neural Networks: Evolution, Architectures, and Applications. Rev. Intel. Artif. Med. 2021, 12, 51–76. [Google Scholar]
- Powell, M.J.D. A Tolerant Algorithm for Linearly Constrained Optimization Calculations. Math. Program. 1989, 45, 547–566. [Google Scholar] [CrossRef]
- Webb, G.I.; Keogh, E.; Miikkulainen, R. Naïve Bayes. Encycl. Mach. Learn. 2010, 15, 713–714. [Google Scholar]
- Martinez-Cantin, R. BayesOpt: A Bayesian Optimization Library for Nonlinear Optimization, Experimental Design and Bandits. J. Mach. Learn. Res. 2014, 15, 3735–3739. [Google Scholar]
- Tsoulos, I.G.; Gavrilis, D.; Glavas, E. Neural network construction and training using grammatical evolution. Neurocomputing 2008, 72, 269–277. [Google Scholar] [CrossRef]
- Gavrilis, D.; Tsoulos, I.G.; Dermatas, E. Selecting and constructing features using grammatical evolution. Pattern Recognit. Lett. 2008, 29, 1358–1365. [Google Scholar] [CrossRef]
- Chandra, R. Parallel Programming in OpenMP; Morgan Kaufmann: Burlington, MA, USA, 2001. [Google Scholar]
- Graham, R.L.; Woodall, T.S.; Squyres, J.M. Open MPI: A flexible high performance MPI. In International Conference on Parallel Processing and Applied Mathematics; Springer: Berlin/Heidelberg, Germany, 2005; pp. 228–239. [Google Scholar]
Disclaimer/Publisher’s Note: The statements, opinions and data contained in all publications are solely those of the individual author(s) and contributor(s) and not of MDPI and/or the editor(s). MDPI and/or the editor(s) disclaim responsibility for any injury to people or property resulting from any ideas, methods, instructions or products referred to in the content. |
© 2025 by the authors. Licensee MDPI, Basel, Switzerland. This article is an open access article distributed under the terms and conditions of the Creative Commons Attribution (CC BY) license (https://creativecommons.org/licenses/by/4.0/).