Abstract
In complex process systems, accurate real-time anomaly detection is essential to ensure operational safety and reliability. This study proposes a novel detection method that combines information granulation with kernel principal component analysis (KPCA). Here, information granulation is introduced as a general framework, with the principle of justifiable granularity (PJG) adopted as the specific implementation. Time series data are first granulated using PJG to extract compact features that preserve local dynamics. The KPCA model, equipped with a radial basis function kernel, is then applied to capture nonlinear correlations and construct monitoring statistics including and SPE. Thresholds are derived from training data and used for online anomaly detection. The method is evaluated on the Tennessee Eastman process and Continuous Stirred Tank Reactor datasets, covering various types of faults. Experimental results demonstrate that the proposed method achieves a near-zero false alarm rate below 1% and maintains a missed detection rate under 6%, highlighting its effectiveness and robustness across different fault scenarios and industrial datasets.
1. Introduction
Complex process systems serve as the core foundation of modern manufacturing, with their operational efficiency and safety directly impacting a company’s economic performance and production risk. As automation and intelligent technologies continue to advance, the demands on the stability and reliability of complex process systems are also increasing [1]. At the same time, the rapid development of modern industry has led to increasingly complex and precise process systems [2], which are inherently more sensitive to disturbances and thus more prone to anomalies. In practical operation, factors such as equipment conditions, environmental changes, or control deviations may lead to process anomalies, which can in turn cause product quality fluctuations, production interruptions, or even serious safety incidents [3]. These anomalies not only reduce overall production efficiency but may also result in substantial economic losses and personnel hazards. Therefore, identifying and responding to abnormal states in complex process systems has become a critical issue for ensuring safe and efficient production.
Complex process systems generate large volumes of multivariate time series data during operation, capturing the dynamic evolution of key process parameters and reflecting complex process behaviors as well as inter-variable couplings. Under normal conditions, these time series typically exhibit stable and regular patterns [4]. However, when anomalies occur within the process, certain variables may experience abrupt changes, trend shifts, or disruptions in their inherent correlations. Therefore, by modeling and analyzing the time series data of complex process systems, anomaly detection can be effectively performed, contributing to improved efficiency and enhanced safety in industrial production [5].
In the field of anomaly detection for multivariate time series in complex process systems, principal component analysis and its variants have been widely applied for modeling data correlations and extracting features. As complex process systems become increasingly complex, anomaly detection tasks face dual challenges: the growing volume of time series data and the nonlinear interdependencies among variables. Simple principal component analysis (PCA)-based methods are no longer sufficient to meet the safety requirements of modern complex process systems. To address this, Arena et al. introduced a method that combines Monte Carlo-based preprocessing with PCA [6], enabling effective anomaly detection in photovoltaic cell production environments. Subsequently, to address the difficulty of interpreting distributed correlation structures in complex industrial systems, Theisen et al. proposed a decentralized monitoring framework based on sparse PCA [7], which significantly improves interpretability and reveals inter-variable relationships. Li et al. developed a dynamic reconstruction PCA method that preserves dynamic information in time series data [8], thereby enhancing the sensitivity and accuracy of anomaly detection and addressing the limitations of traditional PCA in capturing temporal dynamics. Meanwhile, Zhang et al. proposed a generalized Gaussian distribution-based interval PCA method that incorporates uncertainty in complex process systems [9], improving detection robustness under fluctuating conditions. Similarly, in response to uncertainty in industrial settings, Kini et al. combined multi-scale PCA with a Kantorovich distance-based scheme to further enhance fault detection performance [10]. These PCA-based improvements have significantly advanced the modeling of nonlinear dependencies and enhanced the robustness of fault detection in a complex industrial process.
Due to the strong coupling between variables in multivariate time series and the complexity of feature evolution, the difficulty of anomaly detection is significantly increased. To address such issues, Zhou et al. introduced the theory of information granulation and constructed a granular Markov model for multivariate time series anomaly detection by integrating fuzzy C-means clustering [11]. Subsequently, Liu et al. further combined fuzzy information granules with a Markov random walk strategy by constructing a fuzzy granular distance matrix and iteratively computing the stationary distribution to more effectively detect anomalies in multivariate time series [12]. Ouyang and Zhang proposed an anomaly detection method that integrates information granule reconstruction and fuzzy rule reasoning mechanisms [13], where the optimization of granular hierarchy and the enhancement of rule expression improved the accuracy of anomaly detection. To further explore the latent feature information in time series, Guo et al. proposed an interpretable time series anomaly pattern detection method based on granular computing [14]. This method constructs semantic time series through trend-based granulation and semantic abstraction to achieve anomaly detection. Du et al. proposed a time series anomaly detection method for the sintering process using rectangular information granules [15], which are constructed from the original series and its first-order difference to identify anomalies via granular similarity analysis. Other studies, such as the method proposed by Huang et al., extract time series information by constructing information granules through a sliding window and perform anomaly detection in complex process systems in combination with PCA [16]. These granulation-based methods provide a powerful means of capturing structural and semantic patterns in complex time series, thereby improving detection accuracy and interpretability.
In addition to statistical and granulation-based approaches, metaheuristic optimization algorithms, particularly particle swarm optimization (PSO), have attracted significant attention in the field of intelligent monitoring. PSO is a population-based optimization method inspired by the social behavior of birds and fishes. Rezaee Jordehi and Jasni [17] provided a comprehensive survey on parameter selection in PSO, emphasizing that its performance is highly dependent on the proper configuration of inertia weights, acceleration coefficients, and velocity limits. To enhance model generalization in safety-critical environments, Wang et al. [18] introduced a hybrid fault diagnosis framework that combines PSO with support vector machines, and successfully applied it to nuclear power plant fault detection. Beyond traditional classification models, Rezaee Jordehi [19] developed a mixed binary–continuous PSO algorithm for unit commitment in microgrids, demonstrating the versatility of PSO in handling uncertainty and nonlinear optimization problems. In the context of equipment fault diagnosis, Li et al. [20] applied a PSO-optimized SVM to mechanical fault detection of high-voltage circuit breakers, achieving higher diagnostic accuracy compared with standard support vector machine approaches. More recently, Yu et al. [21] integrated PSO with deep residual networks for vibration signal analysis in pipeline robots, showing that PSO can also be leveraged to tune deep learning architectures for anomaly detection. These studies collectively indicate that PSO not only plays a crucial role in parameter optimization, but also provides a powerful tool for improving anomaly detection performance in complex industrial systems.
The aforementioned studies indicate that PCA and its variants have demonstrated promising capabilities in anomaly detection for multivariate time series, especially by modeling correlations among variables and reducing noise through linear dimensionality reduction. These methods have been successfully applied in various industrial scenarios to identify abnormal behaviors and enhance detection accuracy. However, traditional PCA-based approaches are fundamentally limited by their global linear assumptions and often struggle to capture the underlying nonlinear dynamics and local variations in complex process systems. In parallel, information granulation methods have gained increasing attention for their ability to abstract raw time series data into meaningful granular representations. By capturing local trends, multi-scale structures, and uncertainty characteristics, granulation-based techniques have shown strong potential in enhancing the interpretability and robustness of anomaly detection. Despite these advantages, most existing granulation frameworks rely heavily on predefined rules or static clustering strategies, which restrict their flexibility and expressiveness in modeling global, nonlinear relationships embedded in high-dimensional and dynamic industrial datasets.
Traditional PCA has limited efficiency in compressing large-scale data, mainly due to its global linear assumption. On the other hand, information granulation provides compact local abstractions of time series but lacks the ability to capture nonlinear dependencies among variables. To overcome these complementary limitations, this study proposes a method that integrates information granulation with kernel principal component analysis (KPCA) for industrial process anomaly detection. In the proposed framework, information granulation is first applied to reduce dimensionality and preserve key local dynamics, after which KPCA with a radial basis function (RBF) kernel is used to extract nonlinear correlations in the high-dimensional space. This combination achieves a balanced trade-off: granulation ensures feature compactness and interpretability, while KPCA enhances nonlinear dependency modeling and robustness. As a result, the integration of the two approaches becomes both necessary and effective for anomaly detection in complex process systems.
As illustrated in Figure 1, the proposed method follows a two-phase workflow comprising offline modeling and online detection. In the offline modeling phase, historical process data are first processed through information granulation, which structurally abstracts raw time series into compact and meaningful representations. These granulated training data are then used to construct a KPCA model, where the RBF kernel enables the capture of nonlinear inter-variable dependencies in a high-dimensional feature space. Control thresholds are also computed based on the distribution of monitoring statistics derived from the training set. In the online monitoring phase, real-time data are continuously granulated in the same manner, and the granulated test data are projected onto the KPCA feature space using the pretrained model. Monitoring statistics are then computed and compared against the thresholds. If any statistical values exceed the thresholds, the process is flagged as an anomaly; otherwise, it is considered to be operating normally. The synergy between information granulation and KPCA not only achieves a balance between feature abstraction and structural preservation, but also enhances the model’s accuracy and adaptability in identifying diverse anomaly patterns and multivariate dependencies in a complex industrial process. The main contributions of this work are as follows:

Figure 1.
Process of detecting anomalies in industrial time series via information granulation and KPCA.
- (1)
- The principle of justifiable granularity (PJG) is applied to transform raw industrial time series into compact and interpretable granular features, effectively preserving local dynamic characteristics.
- (2)
- By introducing the nonlinear mapping capability of KPCA on PJG-based granular features, the method captures nonlinear correlations that cannot be represented by linear PCA, thereby overcoming the limitations of traditional PCA in modeling granulated features.
- (3)
- PJG enables structural compression, which effectively alleviates the susceptibility of KPCA to redundant features and noise when directly applied to raw high-dimensional data, thus improving interpretability, robustness, and detection performance.
2. Information Granulation Enhanced KPCA for Industrial Anomaly Detection
Complex process systems often generate high-dimensional and complex time series data, making anomaly detection challenging due to nonlinear variable interactions and redundant information. To address these issues, this study introduces an integrated approach combining information granulation and KPCA. The granulation process abstracts raw data into compact representations, while KPCA enables effective nonlinear feature extraction and anomaly detection.
2.1. Information Granulation Scheme
With the increasing structural complexity of modern industrial systems and the explosive growth of generated data, information granulation has emerged as an effective approach for data modeling and abstraction, enabling structural compression and simplification while preserving essential information features.
To begin with, a sliding window mechanism is introduced to segment the input sequence into local fragments. Each segment, denoted as , captures the short-term dynamic behaviors present in the data. This localized representation allows for more targeted granule construction. Let the subseries be defined as
where m is the starting index of the subseries, and n represents the window length. denotes the value at time t, and is a local segment consisting of n consecutive data points from the raw time series.
To generate an effective information granule from , two factors are considered: the number of elements within the granule interval and the compactness of that interval [22]. This is modeled by an objective function , as follows:
where denotes the candidate granule for the segment , bounded by the lower and upper boundaries and . The function represents the cardinality within the specified set. The term encourages inclusion of more points within the granule, while penalizes intervals with a wide range to ensure compactness.
To guide the granulation process, a statistical representative value of the segment , denoted as , is computed. Typically, refers to the median value of the segment, serving as a reference point to split the interval symmetrically or asymmetrically. The objective function , which balances the density of data points and the proximity to the representative value , is defined as
Subsequently, the particle swarm optimization (PSO) algorithm [23] is employed to search for the optimal lower and upper boundaries that maximize the objective function . PSO is selected because it offers high computational efficiency, fast convergence, and strong global search ability, which are particularly suitable for handling the nonlinear and potentially non-convex nature of . These characteristics ensure stable and reliable determination of granulation boundaries across different process conditions, as follows:
where and represent the optimal lower and upper bounds for the granule interval, respectively. Once the boundaries are obtained, they define the optimal interval granule for the segment . The complete process is illustrated in Figure 2.

Figure 2.
Information granulation.
2.2. KPCA Anomaly Detection Model
Following the granulation phase, each segmented subseries is transformed into a triplet of the form , which captures the local distribution characteristics of the raw signal. To facilitate nonlinear modeling using KPCA, each granule is further encoded into a compact numerical representation. Specifically, for each segment k, two quantities are extracted: the interval range , and the representative value . These jointly describe the span and central tendency of the segment in its local context.
Each segment is thus represented by a feature vector . By aggregating all such vectors, the entire sequence is transformed into a two-dimensional feature matrix , where K denotes the total number of granulated segments. To ensure consistency in scale, each row of Z is standardized to zero mean and unit variance, yielding the normalized matrix , which serves as the input to the KPCA model [24].
Although each segment is compactly represented by two parameters, the joint distribution of granulated features across different segments is often nonlinear due to process complexity, multivariate interactions, and varying operating conditions. Linear PCA tends to capture only global variance directions, which may overlook subtle but important nonlinear dependencies among these features. By contrast, KPCA equipped with the RBF kernel can project the compact feature set into a high-dimensional space, where nonlinear relations among granulated segments are more effectively separated and represented. This allows the model to preserve both the interpretability of information granulation and the nonlinear structural information essential for accurate anomaly detection.
These quantities are stacked column-wise to construct the matrix, as follows:
The standardization is then performed as
where and are the row-wise mean and standard deviation vectors, respectively. Each element in is obtained by subtracting the corresponding row mean and dividing by the row standard deviation, ensuring normalized feature scales.
Based on the standardized input, the RBF kernel matrix is computed as
where is the i-th column of , and is the kernel bandwidth parameter. The kernel matrix is then centered via
where is a matrix with all entries equal to .
Subsequently, KPCA is performed on the centered kernel matrix , and the top c components that explain at least a cumulative variance ratio are retained. Let denote the selected eigenvectors, with corresponding eigenvalues . The projection scores for each segment form a matrix , where .
In the proposed KPCA-based monitoring scheme, two statistics are computed for each segment k: Hotelling’s statistic and the squared prediction error (SPE). The statistic characterizes the variation of a segment within the retained kernel principal component subspace, while the SPE quantifies the residual reconstruction error outside this subspace in the kernel feature space. They are defined as
where denotes the score of the k-th segment on the j-th principal component, is the associated eigenvalue, and represents the kernel mapping of the segment. The reconstruction using the first c kernel principal components is obtained as
To establish the decision boundaries, control limits for both statistics are determined from the training set, as follows:
where and are the sample means, and are the corresponding standard deviations, and and are user-defined scaling factors. Alternatively, quantile-based or distribution-based strategies may be adopted for threshold estimation. A test segment is flagged as anomalous if it satisfies or .
To ensure reproducibility, the thresholds in this study are determined by the classical principle [25,26]. Specifically, both and are set to 3 so that the control limits are defined as the sample mean plus three times the standard deviation, which covers approximately 99.7% of normal samples under Gaussian assumptions. The anomaly detection procedure based on KPCA is illustrated in Figure 3.
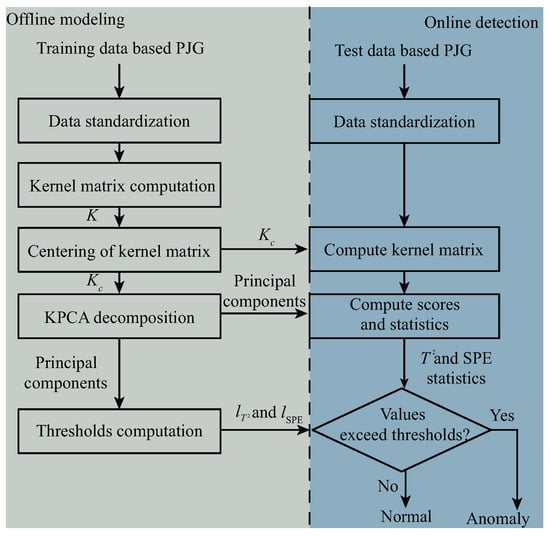
Figure 3.
KPCA-based anomaly detection.
3. Experiments and Results Analysis
To evaluate the effectiveness of the proposed method in industrial process monitoring, experiments are conducted on two widely used benchmark datasets: the Tennessee Eastman (TE) process [27] and the Continuous Stirred Tank Reactor (CSTR) [28]. Comparative studies are performed against two baseline approaches: standard PCA and an enhanced PCA variant that incorporates information granulation. This allows for a comprehensive assessment of the proposed model’s ability to detect anomalies under complex multivariate dynamics.
3.1. Experimental Dataset and Evaluation Metrics
To thoroughly evaluate the effectiveness of the proposed method, experiments were conducted using the datasets listed in Table 1. These datasets cover a range of fault types and process models, encompassing various operating conditions and fault characteristics. Specifically, the TE dataset (such as TE-4 and TE-7) includes step faults, which are used to assess the model’s ability to detect faults with sudden changes. Additionally, TE-8 represents random faults, challenging the model’s robustness when faced with noise or irregular variations. TE-12 and TE-17 represent unknown fault types, testing the model’s performance when encountering previously unseen fault scenarios. The CSTR dataset provides a chemical process fault scenario, with step faults included, to evaluate the method’s applicability in real complex process systems. By using these diverse datasets and fault types, this study aims to comprehensively assess the proposed method’s effectiveness and robustness under various complex conditions.

Table 1.
Types of dataset failures.
To evaluate the performance of the proposed anomaly detection method based on information granulation and KPCA, two comparative schemes are introduced: standard PCA and an enhanced PCA variant that incorporates information granulation. The comparison is carried out using two widely adopted indicators in the domain of process monitoring: the false alarm rate and the missed detection rate. These metrics are chosen as they effectively reflect the detection model’s ability to balance sensitivity and specificity. The false alarm rate characterizes the tendency to incorrectly flag normal samples as faulty, whereas the missed detection rate quantifies the proportion of actual anomalies that go undetected.
The corresponding evaluation metrics [29] are defined as follows:
where is the number of false positives, and is the number of true negatives, as follows:
where and represent the counts of false negatives and true positives, respectively. Together, these metrics offer a comprehensive perspective on the anomaly detection capability of the proposed method in comparison with the baselines.
3.2. Results Analysis
To evaluate the effectiveness of the proposed method, we compare its performance with baseline PCA and the method in [16] across multiple TE process faults and the CSTR dataset, focusing on two key statistical indices: and SPE. The evaluation metrics include and , which measure erroneous alarms on normal data and missed detections on faulty samples, respectively.
The detection performance of KPCA is sensitive to the choice of kernel bandwidth , as it directly controls the trade-off between local sensitivity and global smoothness in the feature space. To systematically evaluate this effect and ensure robustness across different scales, several candidate values were examined. In the experiments, the kernel bandwidth of KPCA was tested under four candidates: 25, 40, 70, and 100. As shown in Table 2, the results indicate that consistently achieves the best trade-off between false alarm and missed detection rates across different fault scenarios. Therefore, all subsequent analyses and discussions are based on the results obtained with . The proposed method demonstrates consistently superior detection capability. For TE-4, it achieves and for , and and for SPE. This significantly outperforms the method in [16], where both indices exhibit values exceeding 25%, and PCA, which suffers from high under .

Table 2.
Comparison of detection performances across different methods and faults.
In TE-7, the proposed method maintains and achieves for both statistics. The method in [16] performs notably worse with for , while PCA exhibits a relatively higher under SPE. These results highlight the stability and low-error nature of the proposed detection framework.
For TE-8, the proposed method yields , in , and similarly low values for SPE, demonstrating its high sensitivity and precision. The method in [16] reports modest improvements over PCA, but still trails behind the proposed method in all aspects.
Notably, in TE-12, the proposed method achieves perfect detection performance, with both and equal to zero under both indices. This ideal result is unmatched by the baselines: the method in [16] shows , and PCA also suffers from elevated in SPE, indicating its proneness to false alarms.
In TE-17, a more complex fault, the proposed method keeps and in , still significantly lower than the method in [16], which suffers from in SPE. PCA is again unreliable here, reaching .
The results on the CSTR dataset further validate the generalizability of the proposed method. It achieves and under both indices, outperforming the method in [16] and PCA by a clear margin.
Across all tested faults and datasets, the proposed method consistently achieves the lowest and values, validating its effectiveness in suppressing false alarms while maintaining high sensitivity to real anomalies. This balance is critical for industrial applications, where undetected faults can lead to costly failures, and excessive false alarms reduce system reliability. The superior results can be attributed to the nonlinear mapping capability of KPCA combined with the discriminative granulation-based feature construction, which collectively enhance the separability between normal and abnormal behaviors.
The anomaly detection performance of the proposed method under various fault scenarios from the TE and CSTR datasets is illustrated in Figure 4, Figure 5, Figure 6, Figure 7, Figure 8 and Figure 9, using both and statistics. As shown in each subfigure, the proposed method successfully distinguishes abnormal samples from normal ones, with the majority of anomaly points exceeding the detection thresholds shortly after the fault occurrence point. For instance, in the case of TE-4 and TE-7 (Figure 4 and Figure 5), which represent step-type faults, both statistics exhibit sharp deviations from the threshold, indicating timely fault detection. Similarly, TE-8 (Figure 6), a random fault, is also clearly identified, demonstrating the method’s robustness under uncertain fault dynamics. For more complex and unknown faults such as TE-12 and TE-17 (Figure 7 and Figure 8), the method still maintains high sensitivity, with nearly all anomaly points effectively captured by at least one of the two statistics. Moreover, the performance on the CSTR dataset (Figure 9) validates the generalization capability of the method to a different process domain, where both and curves distinctly separate faulty behavior from normal operation. These visual results confirm that the proposed method is capable of effective and consistent anomaly detection across multiple fault types and datasets.
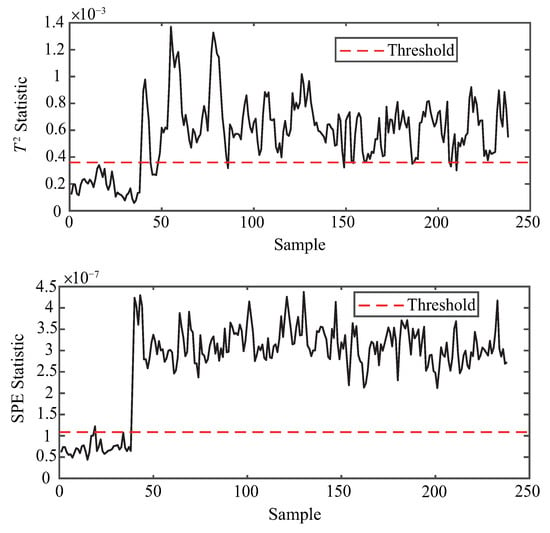
Figure 4.
Anomaly detection for TE-4.
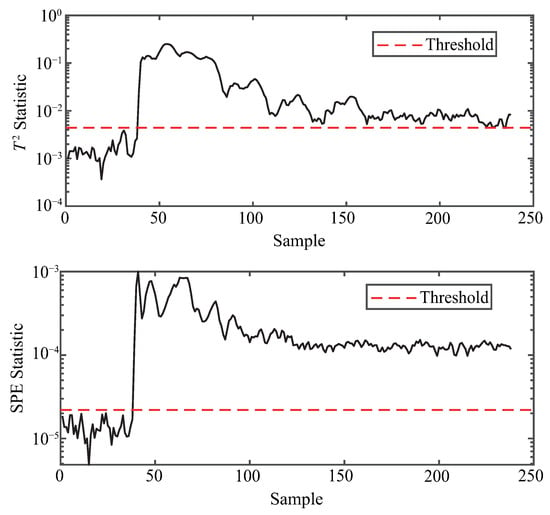
Figure 5.
Anomaly detection for TE-7.
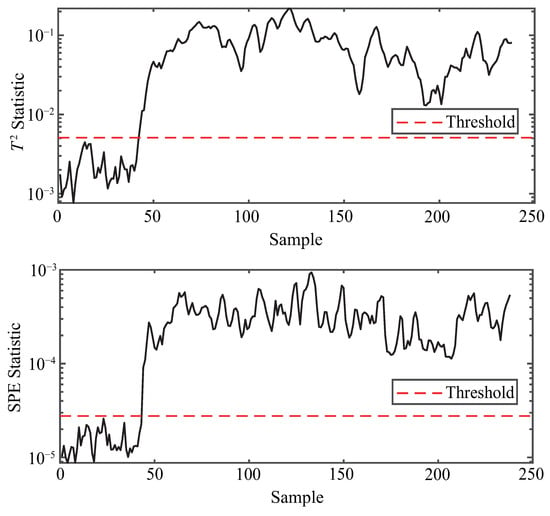
Figure 6.
Anomaly detection for TE-8.
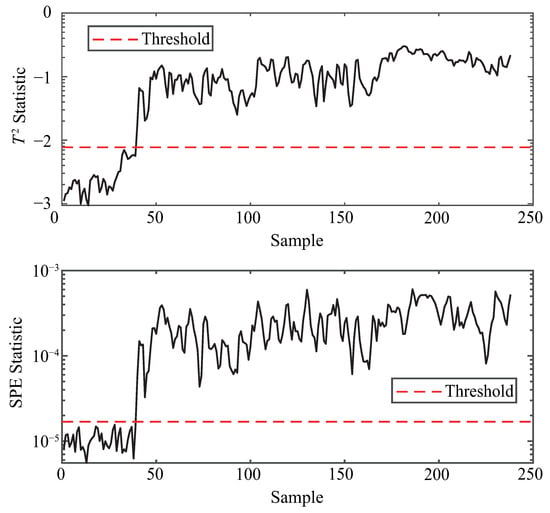
Figure 7.
Anomaly detection for TE-12.
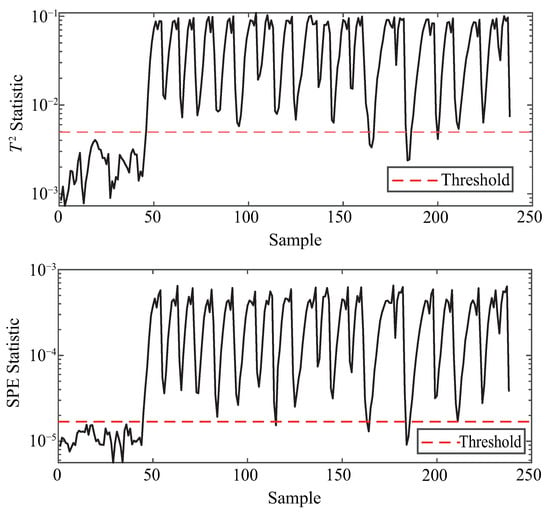
Figure 8.
Anomaly detection for TE-17.
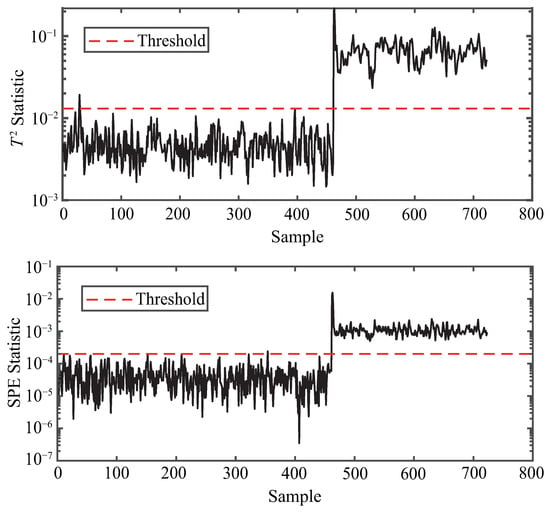
Figure 9.
Anomaly detection for CSTR.
Compared with the method in [16], which combines information granulation with standard PCA, the proposed approach achieves consistently lower false alarm and missed detection rates, particularly under nonlinear fault conditions such as TE-4 and TE-17. This improvement arises from the complementary roles of its two components: information granulation based on the PJG yields compact, interpretable features that retain local dynamics, while kernel PCA with the RBF kernel captures nonlinear dependencies in the high-dimensional space. Thus, KPCA effectively overcomes the limitations of linear PCA when applied after granulation, and the integrated framework combines structural parsimony with robustness. These characteristics explain why the proposed method outperforms the PCA-based granulation method in [16] and ensures reliable anomaly detection across diverse fault scenarios.
4. Conclusions
The analysis clarifies the scope and quality of the proposed method. The tested cases cover step-type faults (TE-4, TE-7, CSTR), random disturbances (TE-8), and more complex unknown faults (TE-12, TE-17). The method successfully detects all these failure modes with stable performance. In terms of sensitivity, it achieves extremely low missed detection rates, for instance, only in TE-8 and even in TE-12, demonstrating high responsiveness while suppressing false alarms. Regarding data applicability, the framework generalizes well across heterogeneous process datasets, confirming its suitability for diverse industrial scenarios. These results collectively indicate that the method balances sensitivity and reliability, ensuring its effectiveness in real-time monitoring applications. Nevertheless, while the method shows strong adaptability and sensitivity across the tested scenarios, its performance under extremely noisy or highly imbalanced datasets remains to be further explored in future work.
By integrating information granulation with KPCA, the proposed method effectively captures both local structural features and global nonlinear correlations in industrial time series. Experimental results on TE and CSTR datasets show consistently low false alarm and missed detection rates across various fault types. The approach demonstrates strong robustness, accuracy, and generalization, offering a practical solution for anomaly detection in complex process systems.
Nevertheless, it should be acknowledged that, when applied to extremely large-scale and high-frequency time series, the computational burden of KPCA and PSO can become significant, and the framework may be sensitive to parameters such as granulation window length and kernel bandwidth. These challenges may restrict its efficiency in real-time big-data scenarios. To mitigate this, future work will explore scalable extensions, including incremental KPCA for dynamic updates, adaptive parameter selection to enhance stability, and parallel optimization strategies to accelerate computation. Such improvements are expected to strengthen both robustness and practicality in broader industrial applications.
Author Contributions
Conceptualization, X.F. and Y.W.; methodology, X.F.; software, J.F.; validation, X.F., H.C. and J.F.; formal analysis, J.F.; investigation, X.F.; resources, H.C.; data curation, J.F.; writing—original draft preparation, X.F.; writing—review and editing, Y.W.; visualization, J.F.; supervision, Y.W.; project administration, Y.W.; funding acquisition, Y.W. All authors have read and agreed to the published version of the manuscript.
Funding
This work was supported in part by the National Natural Science Foundation of China under Grant No. 42074014.
Data Availability Statement
The original data presented in the study are openly available in [GitHub] at [https://github.com/camaramm/tennessee-eastman-profBraatz, accessed on 4 April 2025] for the Tennessee Eastman (TE) process dataset and in [MATLAB Central File Exchange] at [https://www.mathworks.com/matlabcentral/fileexchange/13556-continuously-stirred-tank-reactor-cstr, accessed on 4 April 2025] for the Continuous Stirred Tank Reactor (CSTR) dataset.
Conflicts of Interest
The authors declare no conflicts of interest.
References
- Ji, C.; Sun, W. A Review on Data-Driven Process Monitoring Methods: Characterization and Mining of Industrial Data. Processes 2022, 10, 335. [Google Scholar] [CrossRef]
- Qian, J.; Song, Z.; Yao, Y.; Zhu, Z.; Zhang, X. A Review on Autoencoder Based Representation Learning for Fault Detection and Diagnosis in Industrial Processes. Chemom. Intell. Lab. Syst. 2022, 231, 104711. [Google Scholar] [CrossRef]
- Soori, M.; Arezoo, B.; Dastres, R. Internet of Things for Smart Factories in Industry 4.0: A Review. Int. Things Cyber-Phys. Syst. 2023, 3, 192–204. [Google Scholar] [CrossRef]
- Cheng, C.; Liu, X.; Zhou, B.; Yuan, Y. Intelligent Fault Diagnosis with Noisy Labels via Semisupervised Learning on Industrial Time Series. IEEE Trans. Ind. Inform. 2023, 19, 7724–7732. [Google Scholar] [CrossRef]
- Garg, A.; Zhang, W.; Samaran, J.; Savitha, R.; Foo, C.-S. An Evaluation of Anomaly Detection and Diagnosis in Multivariate Time Series. IEEE Trans. Neural Netw. Learn. Syst. 2022, 33, 2508–2517. [Google Scholar] [CrossRef]
- Arena, E.; Corsini, A.; Ferulano, R.; Iuvara, D.A.; Miele, E.S.; Ricciardi Celsi, L.; Sulieman, N.A.; Villari, M. Anomaly detection in photovoltaic production factories via Monte Carlo pre-processed principal component analysis. Energies 2021, 14, 3951. [Google Scholar] [CrossRef]
- Theisen, M.; Dörgő, G.; Abonyi, J.; Palazoglu, A. Sparse PCA support exploration of process structures for decentralized fault detection. Ind. Eng. Chem. Res. 2021, 60, 8183–8195. [Google Scholar] [CrossRef]
- Li, H.; Jia, M.; Mao, Z. Dynamic reconstruction principal component analysis for process monitoring and fault detection in the cold rolling industry. J. Process Control 2023, 128, 103010. [Google Scholar] [CrossRef]
- Zhang, S.; Wang, S.; Dong, F. Generalized Gaussian Distribution-Based Interval Principal Component Analysis (GGD-IPCA) for Anomaly Detection of Processes with Uncertainty. IEEE Trans. Instrum. Meas. 2024, 73, 2516315. [Google Scholar] [CrossRef]
- Kini, K.R.; Madakyaru, M.; Harrou, F.; Vatti, A.K.; Sun, Y. Robust fault detection in monitoring chemical processes using multi-scale PCA with KD approach. ChemEngineering 2024, 8, 45. [Google Scholar] [CrossRef]
- Zhou, Y.; Ren, H.; Li, Z.; Pedrycz, W. Anomaly detection based on a granular Markov model. Expert Syst. Appl. 2022, 187, 115744. [Google Scholar] [CrossRef]
- Liu, C.; Yuan, Z.; Chen, B.; Chen, H.; Peng, D. Fuzzy granular anomaly detection using Markov random walk. Inf. Sci. 2023, 646, 119400. [Google Scholar] [CrossRef]
- Ouyang, T.; Zhang, X. Fuzzy rule-based anomaly detectors construction via information granulation. Inf. Sci. 2023, 622, 985–998. [Google Scholar] [CrossRef]
- Guo, H.; Mu, Y.; Wang, L.; Liu, X.; Pedrycz, W. Granular computing-based time series anomaly pattern detection with semantic interpretation. Appl. Soft Comput. 2024, 167, 112318. [Google Scholar] [CrossRef]
- Du, S.; Ma, X.; Wu, M.; Cao, W.; Pedrycz, W. Time Series Anomaly Detection via Rectangular Information Granulation for Sintering Process. IEEE Trans. Fuzzy Syst. 2024, 32, 4799–4804. [Google Scholar] [CrossRef]
- Huang, C.; Du, S.; Fan, H.; Wu, M.; Cao, W. Anomaly Detection Based on Information Granulation and Principal Component Analysis for Geological Drilling Process. In Proceedings of the 43rd Chinese Control Conference (CCC), Kunming, China, 17 September 2024; pp. 2750–2755. [Google Scholar]
- Rezaee Jordehi, A.; Jasni, J. Parameter selection in particle swarm optimisation: A survey. J. Exp. Theor. Artif. Intell. 2013, 25, 527–542. [Google Scholar] [CrossRef]
- Wang, H.; Peng, M.; Hines, J.W.; Zheng, G.; Liu, Y.; Upadhyaya, B.R. A hybrid fault diagnosis methodology with support vector machine and improved particle swarm optimization for nuclear power plants. ISA Trans. 2019, 95, 358–371. [Google Scholar] [CrossRef] [PubMed]
- Rezaee Jordehi, A. A mixed binary-continuous particle swarm optimisation algorithm for unit commitment in microgrids considering uncertainties and emissions. Int. Trans. Electr. Energy Syst. 2020, 30, e12581. [Google Scholar] [CrossRef]
- Li, X.; Wu, S.; Li, X.; Yuan, H.; Zhao, D. Particle swarm optimization-support vector machine model for machinery fault diagnoses in high-voltage circuit breakers. Chin. J. Mech. Eng. 2020, 33, 6. [Google Scholar] [CrossRef]
- Yu, Z.; Zhang, L.; Kim, J. The performance analysis of PSO-ResNet for the fault diagnosis of vibration signals based on the pipeline robot. Sensors 2023, 23, 4289. [Google Scholar] [CrossRef]
- Du, S.; Ma, X.; Li, X.; Wu, M.; Cao, W.; Pedrycz, W. Anomaly detection based on principle of justifiable granularity and probability density estimation. In Proceedings of the 2023 China Automation Congress (CAC), Chongqing, China, 17–19 November 2023; IEEE: New York, NY, USA, 2023; pp. 1364–1367. [Google Scholar]
- Marini, F.; Walczak, B. Particle swarm optimization (PSO): A tutorial. Chemom. Intell. Lab. Syst. 2015, 149, 153–165. [Google Scholar] [CrossRef]
- Simmini, F.; Rampazzo, M.; Peterle, F.; Susto, G.A.; Beghi, A. A Self-Tuning KPCA-Based Approach to Fault Detection in Chiller Systems. IEEE Trans. Control Syst. Technol. 2022, 30, 1359–1374. [Google Scholar] [CrossRef]
- Jackson, J.E. A User’s Guide to Principal Components, 2nd ed.; John Wiley & Sons: Hoboken, NJ, USA, 2005. [Google Scholar]
- Qin, S.J. Statistical process monitoring: Basics and beyond. J. Chemom. 2003, 17, 480–502. [Google Scholar] [CrossRef]
- Downs, J.J.; Vogel, E.F. A plant-wide industrial process control problem. Comput. Chem. Eng. 1993, 17, 245–255. [Google Scholar] [CrossRef]
- Klatt, K.-U.; Engell, S. Gain-scheduling trajectory control of a continuous stirred tank reactor. Comput. Chem. Eng. 1998, 22, 491–502. [Google Scholar] [CrossRef]
- Taheri-Kalani, J.; Latif-Shabgahi, G.; Aliyari Shoorehdeli, M. Optimizing multivariate alarm systems: A study on joint false alarm rate, and joint missed alarm rate using linear programming technique. Process Saf. Environ. Prot. 2024, 191, 1775–1783. [Google Scholar] [CrossRef]
Disclaimer/Publisher’s Note: The statements, opinions and data contained in all publications are solely those of the individual author(s) and contributor(s) and not of MDPI and/or the editor(s). MDPI and/or the editor(s) disclaim responsibility for any injury to people or property resulting from any ideas, methods, instructions or products referred to in the content. |
© 2025 by the authors. Licensee MDPI, Basel, Switzerland. This article is an open access article distributed under the terms and conditions of the Creative Commons Attribution (CC BY) license (https://creativecommons.org/licenses/by/4.0/).