Abstract
The global transition to a low-carbon energy system requires innovative solutions that integrate renewable energy production with storage and utilization technologies. The growth in energy demand, combined with the intermittency of these sources, highlights the need for advanced management models capable of ensuring system stability and efficiency. This paper presents the development of an optimized energy management system integrating renewable sources, with a focus on green hydrogen production via electrolysis, storage, and use through a fuel cell. The system aims to promote energy autonomy and support the transition to a low-carbon economy by reducing dependence on the conventional electricity grid. The proposed model enables flexible hourly energy flow optimization, considering solar availability, local consumption, hydrogen storage capacity, and grid interactions. Formulated as a Mixed-Integer Linear Programming (MILP) model, it supports strategic decision-making regarding hydrogen production, storage, and utilization, as well as energy trading with the grid. Simulations using production and consumption profiles assessed the effects of hydrogen storage capacity and electricity price variations. Results confirm the effectiveness of the model in optimizing system performance under different operational scenarios.
1. Introduction
Decarbonization stands as one of the greatest global challenges of the 21st century, driven by the sharp rise in carbon dioxide emissions, which have increased by 109% since 1975 [1], and by international commitments such as the Paris Agreement, which seeks to limit the rise in global average temperature to 1.5 °C by 2050 [2]. One particularly promising strategy to achieve this goal is the local production of hydrogen using renewable energy sources, such as solar or wind power. This approach enables the generation of renewable hydrogen with low or even zero CO2 emissions [3], while also mitigating the energy losses typically associated with transmission in centralized systems. In addition, the use of hydrogen as an energy vector contributes to the reduction of local air pollution, a particularly relevant benefit considering that 90% of EU countries currently exceed the air quality limits set by the World Health Organization, with serious consequences for public health [4].
Given the potential of hydrogen as a clean energy carrier, integrating it into decentralized systems becomes increasingly relevant. In this context, microgrids emerge as an ideal platform for coupling renewable hydrogen technologies with local energy management.
Microgrids (MGs) are autonomous power networks that can generate, store, and deliver electricity locally, all while coordinating with the main grid. Both emerging and industrialized regions are paying increasing attention to MGs, since they enhance resilience in areas with fragile infrastructure or high energy costs. By transferring asset management and operational decisions from central utilities to local actors, MGs disrupt the conventional top-down model and open a route to more democratic, adaptable, and sustainable energy systems [5]. Integrated control over generation and storage enables MGs to withstand grid disturbances, ease peak stress on network assets, and deliver ancillary functions such as black-start capability and frequency regulation. Such features make MGs a key element of the broader move toward smart grids, in which distributed resources and digital optimization supersede large central generation as the organizing principle [6].
Optimization plays a central role in the design and operation of microgrid systems, enabling the efficient coordination of renewable sources, storage technologies, and energy transactions with the main grid. Typically, these problems are formulated to balance economy, reliability, and sustainability under the uncertainty of renewable generation and load. Two main families of approaches are prevalent. On the one hand, mathematical programming methods, particularly mixed-integer linear programming (MILP), are widely applied to schedule resources and minimize operating costs. Recent studies have demonstrated their effectiveness in real-world contexts [7,8,9,10,11,12]. In [9], an MILP model is modeled to size a solar–wind hybrid system for the winemaking sector, demonstrating significant savings and reduced dependence on the power grid over a 25-year horizon. In [10], the MILP optimization model applied to optimize hybrid renewable configurations reported reductions of more than 60% in energy costs over 20 years. On the other hand, metaheuristic approaches—including genetic algorithms (GA), particle swarm optimization (PSO), differential evolution (DE) and their hybrids—are increasingly adopted to address large-scale, non-linear, and highly constrained formulations, where deterministic methods face computational limitations [13,14,15,16,17].
Portugal provides a notable national example. Between 1 January and 31 May 2025, renewables supplied roughly 81% of Portugal’s electricity, thanks to its longstanding hydro fleet, mature onshore wind, and rapidly growing photovoltaic parks [18]. The Portuguese National Energy and Climate Plan 2030 (PNEC 2030) fixes clear goals: renewables should cover 51% of gross final energy use and 96% of electricity generation by 2030 [19]. Realizing these targets demands heavy investment in flexibility assets—batteries, green hydrogen, and demand-side management—alongside policies that foster self-consumption and community energy initiatives. Within this context, microgrids emerge as appealing platforms for absorbing significant variable generation while benefiting local consumers, the broader grid, and the climate.
Although hydrogen is the universe’s most abundant element and appears on Earth only in compounds, it is gaining significant attention as a flexible energy carrier. With a gravimetric energy density far exceeding that of fossil fuels, hydrogen used in fuel cells or clean combustion produces only water as a direct by-product [20]. These traits suit hydrogen to long-duration energy storage, decarbonizing industrial feedstocks, and enabling low-carbon mobility.
Recent strategy papers underscore this role. At the European scale, the REPowerEU plan adopted in 2022 set a goal to generate 10 Mt of renewable hydrogen inside the EU and import another 10 Mt by 2030 [21]. Portugal’s PNEC 2030 reflects these ambitions by targeting 2.5 GW of domestic electrolysis capacity by 2030 and an initial 5% hydrogen blend in the natural-gas system [19]. In addition, the Recovery and Resilience Plan allocates €185 million to launch early projects and position the Sines Industrial Hub as a hydrogen-industry flagship [22].
A color-based nomenclature is commonly used to indicate production pathways and their life-cycle emissions.
Grey hydrogen is chiefly obtained via steam-methane reforming, a well-established and inexpensive method that releases 8.5–12 kg CO2 per kilogram of hydrogen [23,24,25]. It still represented about 60% of world production in 2023 [26]. Blue hydrogen adds carbon capture, utilization and storage to the same reforming process, cutting emissions relative to grey hydrogen; however, residual carbon and capture costs prevent full climate neutrality [27]. Green hydrogen comes from water electrolysis driven solely by renewable electricity. As the method emits no direct carbon, it holds significant promise for deep decarbonization [23]. Yet in 2023 green hydrogen made up under 1% of the 97 million t global output, chiefly because of high capital and electricity costs [26]. Even so, research activity is rising swiftly, indicating faster learning curves and growing commercial interest.
Although additional labels such as turquoise, pink, brown, black, and golden are used, grey, blue, and green dominate discussions [28,29,30].
Electrolyzers produce hydrogen and oxygen from water by driving an electric current through an electrolyte [31]. Four principal designs shape current research and commercial deployment.
Alkaline water electrolyzers (AWEs) operate with a liquid potassium- or sodium-hydroxide electrolyte at moderate temperatures. The technology is mature, comparatively cheap, and can last nearly 90,000 h, but it offers only moderate efficiency and limited dynamic response [32,33]. Proton-exchange membrane electrolyzers (PEMEs) rely on a solid polymer membrane, achieve high current densities, and track load rapidly, supplying hydrogen at 99.99% purity or better. Although noble-metal catalysts like platinum and iridium elevate capex, PEME units reach 70–80% efficiency and occupy less space than AWEs [34]. Under standard conditions (25 °C, 1 bar), the theoretical minimum energy required for water electrolysis is 32.9 kWh/kg H2, with 100% efficiency defined by the HHV of 39.4 kWh/kg [35]. Anion-exchange membrane electrolyzers (AEMEs) seek to blend the low catalyst expense of alkaline systems with the compactness of membrane cells. They use non-noble metals, yet membrane stability and ionic conductivity remain below commercial benchmarks, keeping the technology at the demonstration stage [36,37]. Solid-oxide electrolysis cells (SOECs) run at 500–1000 °C; providing part of the input energy as heat lifts efficiency up to 85% and cuts specific electricity usage, but creates challenges in sealing, materials durability, and cycling. As a result, SOECs is still mainly limited to labs and early pilots [38].
Fuel cells (FCs) generate electricity from hydrogen or hydrogen-rich fuels via electrochemical reactions whose by-products are water and heat with minimal pollutants [20]. Operating temperatures, electrolytes, and performance profiles vary widely, allowing different FC types to suit specific microgrid roles [39].
Direct methanol fuel cells (DMFCs) function at low temperatures with liquid methanol, which favors portable uses, yet efficiency is moderate because of fuel crossover [40]. Alkaline fuel cells (AFCs) deliver high electrical efficiency but are vulnerable to carbon-dioxide contamination, restricting deployment to controlled environments [39]. Phosphoric-acid fuel cells (PAFCs) operate at intermediate temperatures, accept reformate fuels, and therefore fit combined heat-and-power installations in small to medium buildings [39]. Molten-carbonate fuel cells (MCFCs) provide fuel flexibility and sound electrical efficiency at 600 °C, yet deal with material corrosion and relatively low power density [39]. Solid-oxide fuel cells (SOFCs) work at the highest temperatures, achieve electrical efficiencies up to 60%, and allow internal fuel reforming. They are viewed as promising for microgrid baseload supply and for coupling with electrolysis in reversible solid-oxide systems [41]. Proton-exchange membrane fuel cells (PEMFCs) feature rapid start-up, high power density, and zero local emissions when supplied with green hydrogen. They have reached commercial status in transport and stationary backup applications, although catalyst expense and membrane longevity still pose challenges [42,43]. The theoretical maximum output of a PEM fuel cell is 32.7 kWh/kg H2, corresponding to 83% efficiency based on the HHV under standard conditions [44,45].
A relevant line of research has demonstrated the importance of integrating the life cycle perspective into the development of energy management strategies for hybrid systems. In [46], a health-aware energy management system for fuel cells and batteries is proposed, with the aim of simultaneously minimizing hydrogen consumption and component degradation. The results revealed a 64.68% reduction in total costs compared to conventional control, mainly due to less degradation from inactivity and load variations in the stacks. This work shows that optimization models should consider not only short-term efficiency, but also the long-term sustainability and reliability of hydrogen-based systems.
Comparing the two technologies allows us to better contextualize the role of hydrogen in energy storage. Batteries offer high energy efficiency and competitive costs, making them a mature solution for short-term storage. However, they face limitations associated with degradation after multiple cycles and the intensive extraction of critical metals, with significant environmental impacts. Hydrogen, despite its lower efficiency (considering electrolysis, storage, and conversion into fuel cells), stands out for its medium and long-term storage capacity and its integration on a larger scale into microgrids. A life cycle perspective also shows that both technologies involve different environmental trade-offs: in batteries, the impacts are mainly concentrated in the production and recycling phase, while in hydrogen they are distributed throughout the entire cycle [47]. Thus, the choice between technologies should not be based solely on immediate efficiency, but also on criteria of flexibility, scalability, and long-term sustainability.
In this work, a mathematical model was developed to manage a hydrogen storage system powered by surplus renewable energy. The proposed approach aims to optimize system performance by simulating various operational scenarios, considering consumption profiles, the variability of renewable energy generation, and the interconnection with the electrical grid. The analysis is structured around three main objectives: firstly, to minimize operating costs; secondly, to contribute to grid stability; and thirdly, to maximize the utilization of surplus energy.
This work contributes directly to the United Nations Sustainable Development Goals (SDGs), specifically SDG 7 (Affordable and Clean Energy), by promoting renewable energy use and hydrogen-based storage; SDG 9 (Industry, Innovation and Infrastructure), by proposing innovative technological solutions for energy management in microgrids; and SDG 11 (Sustainable Cities and Communities), by supporting the development of more resilient, autonomous, and low-carbon urban systems [48].
This paper is organized as follows. Section 1 introduces the theme and provides a review of the literature. Section 2 presents a description of the proposed energy system. Section 3 presents the optimization model for the optimal sizing of the hybrid system and the optimal energy exchanges. Section 4 presents the case studies, complemented by the technical characterization of the components, and Section 5 is dedicated to the analysis of the results. Finally, Section 6 presents the main conclusions of the work and points to directions for future work.
2. System Description
The proposed system consists in a hybrid energy solution that integrates renewable production, the main grid, and a hydrogen storage system. As illustrated in Figure 1, it consists in six main blocks: renewable generation, the consumer building, an electrolyzer for hydrogen production, a hydrogen storage tank, a fuel cell, and the connection to grid.
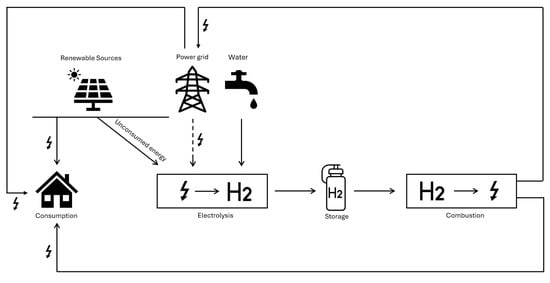
Figure 1.
Schematic of the hybrid PV–grid–hydrogen energy system considered in this study.
The photovoltaic system provides electricity that can be used immediately by the building, injected into the grid, or used to hydrogen production. When there is surplus solar production, it is used by the electrolyzer to generate hydrogen from water. This hydrogen is then stored in a tank, acting as a storage medium. Subsequently, when demand requires it, the stored hydrogen is converted back into electricity via a fuel cell. The connection to the grid allows electricity to be imported when renewable production is insufficient and exported when the building’s demand is met and it is not advantageous to use it for hydrogen production.
3. Optimization Model
The mathematical model developed in this work aims to optimize the energy production of a microgrid that integrates photovoltaic generation, hydrogen production and storage, and a fuel cell system. The formulation seeks to minimize operating costs while ensuring the reliability and sustainability of the system. The optimization approach is formulated as a mixed-integer linear programming (MILP) problem, allowing the definition of an optimal scheduling of energy flows: from renewable production, through electrical conversion to hydrogen via the electrolyzer, storage in a pressurized tank, and subsequent reconversion into electricity through the fuel cell. In addition, the model considers energy import and export flows with the grid, ensuring flexibility and security of supply. Four typical days are used, one for each season. Each day is subdivided into 24 hourly intervals of demand, renewable production, and electricity prices. Each day is replicated according to the number of days in the respective season, enabling analysis of the system’s energy flows throughout the year.
The sets, parameters, and decision variables employed in the model are summarized in Table 1, Table 2, and Table 3, respectively.

Table 1.
Sets used in the model.

Table 2.
Parameters used in the model.

Table 3.
Decision variables used in the model.
Objective Function
The objective function (1) minimizes the net annual expenditure on electricity costs, which is defined as the total cost of electricity purchased from the grid minus the revenue from electricity sales.
Constraints
In Constraint (2), for every hour , the sum of electricity sources (PV generation, grid imports, and fuel-cell output) must equal the sum of electricity sinks (load demand, electrolyzer consumption, and any power exported to the grid).
Constraint (3) ensures that the electrolyzer’s electricity consumption at any time step t does not exceed its rated maximum capacity .
Constraint (4) limits the fuel-cell’s electrical output at its rated maximum .
Constraint (5) sets the hydrogen inventory in the first hour of the year. At the beginning of the simulation, the hydrogen level is initialized with the starting stock . The net balance at the first time step accounts for the hydrogen produced and consumed .
Constraint (6) updates the hydrogen storage level for each time step . The balance is computed by carrying over the previous level, adding the hydrogen produced, and subtracting the hydrogen consumed.
Constraint (7) ensures the model never consumes more hydrogen than was available at the end of the previous hour.
Constraints (9) and (10) establish the logical relationship between grid imports to the binary variable . Specifically, when , Constraint (9) forces to zero, preventing electricity imports. Conversely, when , Constraint (10) ensures that the grid purchase is strictly positive (at least ), while Constraint (9) sets an upper bound through the parameter. Together, these constraints guarantee consistency between the binary activation variable and the continuous flow decision.
Constraints (11) and (12) link grid exports to the binary variable . When , they force to zero, preventing electricity sales. When , they restrict the export flow to lie between the minimum threshold and the upper bound .
Constraint (13) avoids simultaneous buying and selling of electricity with the grid in the same time step. The binary variables and ensure mutually exclusive decisions: if electricity is being purchased from the grid (), then selling is not allowed (), and vice versa.
Constraints (14) and (15) link the electrolyzer’s power draw to its binary status , ensuring it is zero when the unit is off and between a minimum threshold and the upper bound when on.
Constraint (18) guarantees that the electrolyzer and the fuel cell do not operate simultaneously within the same time period. Since the electrolyzer consumes electricity to produce hydrogen and the fuel cell consumes hydrogen to generate electricity, running both devices at the same time would be energetically inefficient. By enforcing exclusivity through the binary variables and , the model ensures operational coherence and avoids unnecessary cycling between the two technologies.
Constraints (19) guarantees that all energy and hydrogen-related decision variables remain physically meaningful. Negative values for purchases, sales, power usage, or tank levels are not allowed.
Constraints (20) specify the binary domain of the decision variables representing the on/off operational states of the electrolyser, fuel cell, and grid interactions.
4. Case Study
The energy supply in the system is provided by photovoltaic panels, a fuel cell, and an interconnection with the main electricity grid. The dataset used in this study includes electricity consumption, solar generation, and market price data for four representative days, each corresponding to one of the four seasons of the year. These profiles are then replicated across all days within the same season to capture annual variability. Consumption data were obtained from the Open Data portal of E-REDES, while photovoltaic generation profiles were derived from the sizing of a PV system carried out in a previous academic study.
For this study, the initial costs associated with acquiring and maintaining the equipment were not considered, since they are too high and would cause the model to avoid hydrogen production. This is because this technology currently has very high acquisition costs. The main objective is to analyze the impact that this technology will have on load feeding and energy flows within the system. The generation of energy is achieved through the integration of three distinct sources: photovoltaic solar panels, a fuel cell, and a connection to the conventional electricity grid.
4.1. System Components and Parameters
This section describes the equipment that makes up the hydrogen system, together with the respective technical specifications, considered as parameters in the execution of the optimization model.
4.1.1. Electrolyzer
The simulation was performed based on the technical characteristics of a commercially available electrolyzer, specifically the Cummins HyLyzer 200 model. The complete specifications of this equipment are presented in Table 4.

Table 4.
Technical specifications of the HyLyzer 200 electrolyzer [49].
This equipment was selected specifically for its PEM technology, which is particularly suited for this application. The PEM technology offers both rapid response to the inherent fluctuations of renewable energy sources and superior energy-to-hydrogen conversion efficiency compared to other electrolysis alternatives in this class. For this choice, the photovoltaic load and production diagrams were also considered.
4.1.2. Hydrogen Storage Tank
The hydrogen storage tank has a maximum capacity of 135 kg at 30 bar pressure, matching the electrolyzer’s output pressure. This storage capacity was specifically designed to ensure five days of fully autonomous building operation without requiring grid electricity.
4.1.3. Fuel Cell
The fuel cell selected for the simulation was the EH-TRACE 40 kW Power System, whose specifications are described in Table 5.

Table 5.
Technical specifications of the EH-TRACE 40 kW Power System [50].
The choice of this equipment is once again due to the ability of PEM technology to respond quickly to load fluctuations, a feature that makes it ideal for this type of application. In addition, it has low operating noise and reduced operating temperatures, factors that are particularly advantageous for installations in urban buildings. It demonstrates considerable efficiency for the context under study. In larger-scale applications, this technology offers even higher efficiency options.
5. Results and Discussion
The main aim of this study is to analyze the technical and economic feasibility of a microgrid equipped with a hydrogen storage system. This system uses surplus energy from renewable sources and, when economically advantageous, purchases energy for subsequent storage in the form of hydrogen. The mathematical optimization model implemented determines all the energy flows in the system, identifying the most economically favorable times for hydrogen production and storage, the optimal conditions for its use (both for internal consumption and for energy sales), as well as the most profitable strategies for buying and selling energy to the grid. The model was solved using FICO Xpress Workbench Optimization software (Xpress Optimizer Version 45.01.01) [51]. A comparative analysis of the two scenarios will facilitate an assessment of the economic impact of implementing the system, the respective environmental benefits, and the potential for improvement associated with future technological development in this area. Case Study I is based on the actual technical characteristics of equipment currently available on the market. Case Study II is a prospective scenario that assumes theoretically possible efficiency improvements, representing the evolutionary potential of hydrogen technologies.
5.1. Case Study I
Case Study I is based on the actual technical characteristics of equipment currently available on the market. The aim is to understand how the system would behave when operated with real parameters. Figure 2 shows the hourly distribution of energy consumption in Case Study I for the four seasons of the year. In all seasons, there is a strong dependence on energy purchased from the electricity grid, particularly in the early and late hours of the day, when there is no photovoltaic production. During the daytime, there is greater penetration of solar energy, especially in spring and summer, which allows for a reduction in the use of the grid during these periods.
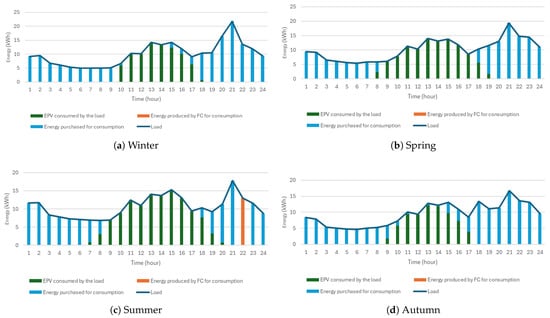
Figure 2.
Energy consumption distribution in Case Study I across the four seasons.
With regard to the fuel cell (FC), its use is quite limited throughout the year. Only in summer is the FC activated, specifically between 9 p.m. and 11 p.m., when solar production has ceased and energy demand remains high. This behavior is explained by the reduced surplus of renewable energy, which, although sufficient to supply the load for several hours of the day, does not generate a significant surplus for continuous hydrogen production. In this way, the model chooses to store the available hydrogen for use at specific times considered most advantageous from an economic point of view.
Furthermore, Figure 3 shows that no energy was purchased from the grid for hydrogen production, which is justified by the insufficient efficiency of the system components. Hydrogen is stored only through small surpluses from renewable production.
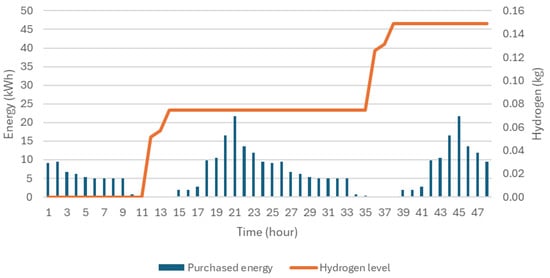
Figure 3.
Evolution of purchased energy and hydrogen level in Case Study I.
Figure 4 shows the total energy accumulated throughout the four seasons.
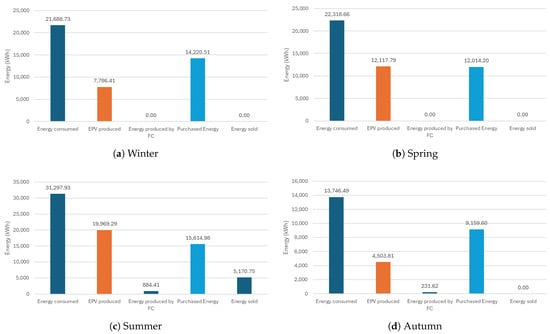
Figure 4.
Total energy accumulated across the four seasons, during the year, in Case Study I.
It can be observed in Figure 4 that total energy consumption is highest in summer and spring, followed by winter and, finally, autumn, with the lowest consumption. This variation may be associated with fluctuations in seasonal thermal or electrical load, such as the use of cooling in summer. Photovoltaic production (EPV) partially follows this variation.
With regard to fuel cells, their use is residual, being recorded only in summer and autumn. This suggests that hydrogen production from renewable surpluses was only possible on an ad hoc basis during these periods.
It is important to note that summer was the only season of the year in which energy was sold. In this season, the model considered it more advantageous to sell the surplus renewable energy rather than use it to produce more hydrogen, as can be seen in Figure 5. It can also be seen that it is in the summer that the highest consumption of hydrogen through the fuel cell occurs. This is due to the fact that, during the previous seasons, a sufficient amount of hydrogen was stored to power the load at specific times during this season.
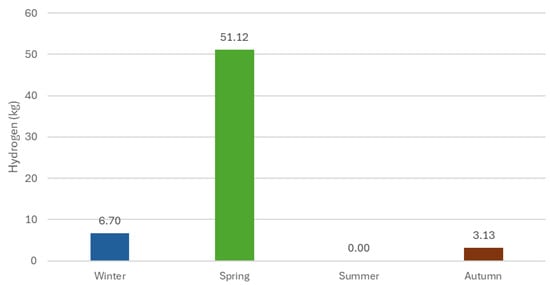
Figure 5.
Hydrogen production per season throughout the year in Case Study I.
5.2. Case Study II
Case Study II uses improved parameters, representing a significant evolution in equipment efficiency. This scenario allows us to see how the system might perform in the future, considering the availability of more efficient equipment. Figure 6 shows the hourly distribution of energy consumption throughout the four seasons of the year, in Case Study II.
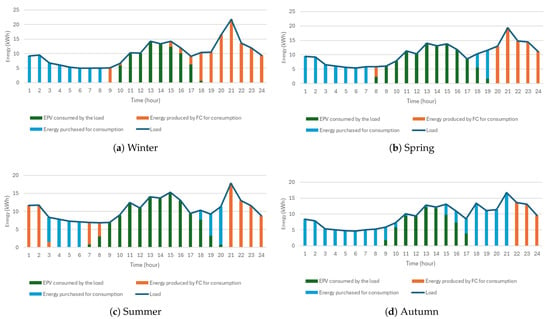
Figure 6.
Energy consumption distribution in Case Study II across the four seasons.
In all seasons, there is intensive use of photovoltaic energy during the daytime. Outside this period, the system uses fuel cells and the electricity grid to meet demand.
The fuel cell plays a key role in all seasonal periods, being activated predominantly at the end of the day (between 6 p.m. and 11 p.m.), when photovoltaic production has ceased and the load remains high. This strategy significantly reduces dependence on the electricity grid. Compared to Case Study I, hydrogen use is much more pronounced, since, with higher efficiencies, it becomes advantageous to purchase energy from the grid for hydrogen production and storage, as can be seen in Figure 7.
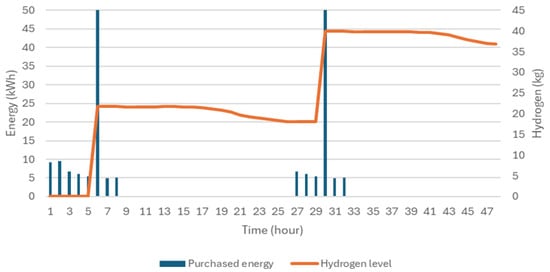
Figure 7.
Evolution of purchased energy and hydrogen level in Case Study II. Note: The left vertical axis limit has been reduced to improve the visibility of the blue columns, as one of the purchased energy values has a significantly higher peak.
Figure 8 shows the total energy accumulated throughout the year in Case Study II, by season.
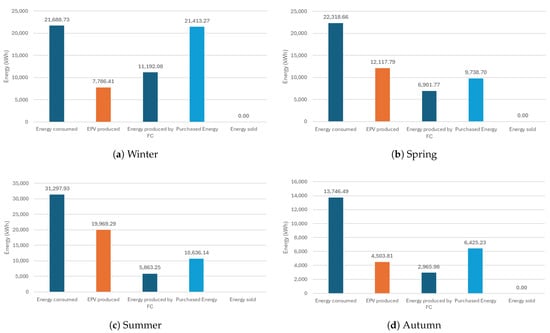
Figure 8.
Total energy accumulated across the four seasons, during the year, in Case Study II.
It should be noted that no energy was sold, since whenever there was a surplus of renewable production, it was used for hydrogen production. The presence of FC production throughout the year shows that, unlike Case Study I, in Case Study II, the accumulation of hydrogen is considered advantageous, even from energy acquired from the grid.
In Figure 9, it can be seen that in winter a large amount of hydrogen is produced, which is stored and subsequently consumed throughout the rest of the year.
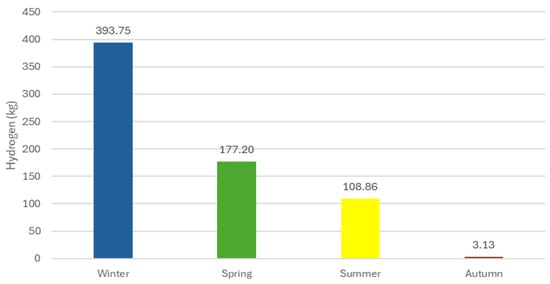
Figure 9.
Hydrogen production per season throughout the year in Case Study II.
5.3. Comparative Analysis
In order to highlight the economic impact of integrating the hydrogen system into the microgrid, the monetary savings at the end of one year were calculated. Table 6 shows the amounts of energy purchased in each case, as well as the respective annual cost associated with that energy consumption.

Table 6.
Annual energy cost by scenario.
In the case where the load is supplied exclusively by energy purchased from the grid, the annual cost amounts to €8950.03. The introduction of a photovoltaic system already allows for a significant reduction in grid consumption, resulting in savings of 40.7%.
With the integration of the hydrogen system, there is an additional reduction in energy costs. In Case I, the annual cost reduces by a further 1.4% compared to the case with only a photovoltaic system. In Case II, with improved hydrogen system efficiency, the savings are even higher, reaching 43.6%.
In addition to analyzing the annual cost associated with energy purchases, it is equally important to consider the environmental impact of the system. According to the Portuguese Environment Agency, the emission factor in mainland Portugal in 2023 was 0.092 t CO2eq./MWh (92 g/kWh) [52]. Based on this value, CO2 emissions corresponding to the different scenarios were estimated. Figure 10 shows the emission values associated with each of the case studies mentioned above.
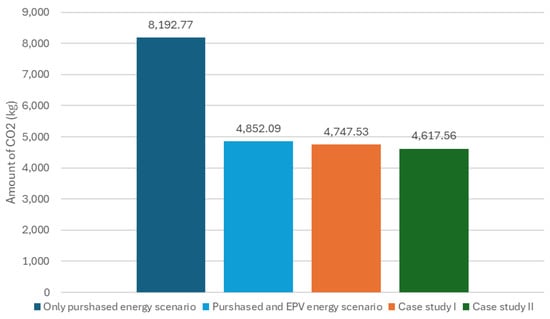
Figure 10.
CO2 emissions associated with purchased energy by scenario.
In the reference scenario, in which all energy consumed is purchased from the grid, annual emissions of approximately 8193 kg of CO2 are recorded. This value represents the worst environmental performance among the cases analyzed, given that all energy comes from a source with a positive emission factor.
With the introduction of photovoltaic production, there is a significant reduction in emissions, falling to around 4852 kg of CO2. This reduction results from the partial replacement of purchased energy with local renewable production.
In scenarios that integrate the hydrogen system, environmental performance is even more favorable. In Case Study I, emissions fall slightly to 4747 kg, while in Case Study II they reach their lowest value, with 4618 kg of CO2. This improvement stems from the system’s ability to store surplus renewable energy in the form of hydrogen and use it later through the fuel cell.
In both analyses, economic and environmental, there is a significant impact from the integration of renewable energy sources, with a significant reduction in both costs and emissions. However, with the introduction of the hydrogen production, storage, and consumption system, there is not such a marked difference, although there is a slight additional decrease in both indicators.
This limitation is related to the amount of surplus energy produced by the photovoltaic system. Since the system is not oversized, photovoltaic production is, in most hours, approximately equivalent to the load requirement during periods of maximum solar exposure. Thus, there is not enough surplus energy generated to take full advantage of the hydrogen system and, consequently, achieve more significant reductions in costs and emissions.
To complement the two previous case studies, the impact of the increase in photovoltaic production capacity was assessed in relation to the baseline scenario (Case I). The increase in solar production was directly reflected in hydrogen production, which rose from 60.9 kg in Case I to 256.3 kg with a 50% increase in photovoltaic capacity and 456.7 kg when that capacity was doubled. At the same time, there was a significant reduction in energy purchased from the grid, around 6.3 and 11.2 MWh in the respective scenarios, as well as a decrease in CO2 emissions of approximately 580 kg and 1 tonne, while the self-supply rate increased from 42.0% to 49.1% and 54.6%. Despite the overall improvements, the marginal gain between the 50% and 100% increases is less significant.
6. Conclusions
This study proposed and evaluated the implementation of an optimized energy management model in microgrids, integrating renewable energy sources, green hydrogen production by electrolysis, storage in pressurized reservoirs and subsequent consumption by fuel cells. The main objective was to analyze the economic and environmental benefits of incorporating these technologies in a representative annual scenario.
By comparing different scenarios, it was possible to verify that the simple introduction of photovoltaic production already allows for a significant reduction in annual energy costs (around 40.7%) and CO2 emissions (around 40.8%) when compared to a system that is totally dependent on the electricity grid.
The inclusion of the hydrogen system (production, storage, and use) brought additional, albeit more modest, benefits. In the scenario with real data, there was an additional reduction of 1.4% in cost and 2.2% in emissions. In the optimized scenario, with higher theoretical efficiencies, these reductions rose to 3.6% in cost and 4.8% in emissions, compared to the case with photovoltaics alone.
The main limitation to the greater impact of the hydrogen system is related to the reduced surplus production of the photovoltaic system. Without oversizing solar generation, the surplus available for electrolysis is limited, restricting the intensive use of hydrogen as a storage vector.
In addition, the developed mathematical model demonstrated highly satisfactory performance, proving to be both robust and adaptable. Its structure is readily scalable to larger systems and adaptable to alternative configurations, such as microgrids with hybrid systems integrating hydrogen and lithium batteries.
In future work, the study may be extended to long-term horizons of up to 20 years, incorporating degradation rates and the expected useful life of system components. This will enable more comprehensive techno-economic assessments, including indicators such as the Levelized Cost of Hydrogen (LCOH), stack lifetime and replacements, and compression/storage costs, providing a broader perspective on the competitiveness of the proposed system.
Author Contributions
Conceptualization, B.R., J.B. and A.C.; methodology, B.R., J.B. and A.C.; software, B.R., J.B. and A.C.; validation, B.R., J.B. and A.C.; formal analysis, B.R., J.B. and A.C.; investigation, B.R., J.B. and A.C.; resources, B.R., J.B. and A.C.; data curation, B.R., J.B. and A.C.; writing—original draft preparation, B.R., J.B. and A.C.; writing—review and editing, B.R., J.B. and A.C.; visualization, B.R., J.B. and A.C.; supervision, J.B. and A.C. All authors have read and agreed to the published version of the manuscript.
Funding
This research received no external funding.
Data Availability Statement
Data is contained within the article.
Conflicts of Interest
The authors declare no conflicts of interest.
Abbreviations
The following abbreviations are used in this manuscript:
| MG | Microgrid |
| PV/EPV | Photovoltaic Energy |
| ELY | Electrolyzer |
| FC | Fuel Cell |
| GA | Genetic Algorithms |
| PSO | Particle Swarm Optimization |
| DE | Differential Evolution |
| PEM | Proton Exchange Membrane |
| AWE | Alkaline Water Electrolyzer |
| PEME | Proton Exchange Membrane Electrolyzer |
| AEME | Anion Exchange Membrane Electrolyzer |
| SOEC | Solid Oxide Electrolysis Cell |
| DMFC | Direct Methanol Fuel Cell |
| AFC | Alkaline Fuel Cell |
| PAFC | Phosphoric Acid Fuel Cell |
| MCFC | Molten Carbonate Fuel Cell |
| SOFC | Solid Oxide Fuel Cell |
| PEMFC | Proton Exchange Membrane Fuel Cell |
| H2 | Hydrogen |
| CO2 | Carbon Dioxide |
| CO2 eq./MWh | Carbon Dioxide Equivalent Emissions per Megawatt-hour |
| PNEC 2030 | National Energy and Climate Plan 2030 (Portugal) |
| REPowerEU | European Energy Reinforcement Plan |
| PRR | Recovery and Resilience Plan (Portugal) |
| MILP | Mixed-Integer Linear Programming |
| kWh | Kilowatt-hour |
| €/kWh | Euro per kilowatt-hour |
| kg | Kilogram |
References
- David, M.; Ocampo-Martínez, C.; Sánchez-Peña, R. Advances in alkaline water electrolyzers: A review. J. Energy Storage 2019, 23, 392–403. [Google Scholar] [CrossRef]
- United Nations. Paris Agreement; United Nations: New York, NY, USA, 2015. [Google Scholar]
- Lee, J.Y.; An, S.; Cha, K.; Hur, T. Life cycle environmental and economic analyses of a hydrogen station with wind energy. Int. J. Hydrogen Energy 2010, 35, 2213–2225. [Google Scholar] [CrossRef]
- Publications Office of the European Union. Hydrogen Roadmap Europe – A Sustainable Pathway for the European Energy Transition; Publications Office of the European Union: Luxembourg, 2016. [Google Scholar] [CrossRef]
- Shahzad, S.; Abbasi, M.A.; Ali, H.; Iqbal, M.; Munir, R.; Kilic, H. Possibilities, Challenges, and Future Opportunities of Microgrids: A Review. Sustainability 2023, 15, 6366. [Google Scholar] [CrossRef]
- Saeed, M.H.; Fangzong, W.; Kalwar, B.A.; Iqbal, S. A Review on Microgrids’ Challenges & Perspectives. IEEE Access 2021, 9, 166502–166517. [Google Scholar] [CrossRef]
- Akkaş, Ö.P.; Çam, E. Optimal operation of virtual power plant in a day ahead market. In Proceedings of the 2019 3rd International Symposium on Multidisciplinary Studies and Innovative Technologies (ISMSIT), Ankara, Turkey, 11–13 October 2019; pp. 1–4. [Google Scholar]
- Aoun, A.; Adda, M.; Ilinca, A.; Ghandour, M.; Ibrahim, H. Optimizing virtual power plant management: A novel MILP algorithm to minimize levelized cost of energy, technical losses, and greenhouse gas emissions. Energies 2024, 17, 4075. [Google Scholar] [CrossRef]
- Teixeira, R.; Cerveira, A.; Silva, A.; Baptista, J. Hybrid renewable energy system optimisation for application in the winemaking sector. In Proceedings of the 2024 IEEE 22nd Mediterranean Electrotechnical Conference (MELECON), Porto, Portugal, 25–27 June 2024; pp. 272–277. [Google Scholar] [CrossRef]
- Jesus, B.; Cerveira, A.; Santos, E.; Baptista, J. The Impact of Optimizing Hybrid Renewable Energy System on Wine Industry Sustainability. In Proceedings of the 2024 IEEE 22nd Mediterranean Electrotechnical Conference (MELECON), Porto, Portugal, 25–27 June 2024; pp. 278–283. [Google Scholar] [CrossRef]
- Araújo, I.; Cerveira, A.; Baptista, J. Energy Flows Optimization in a Renewable Energy Community with Storage Systems Integration. Renew. Energy Power Qual. J. 2023, 21, 184–189. [Google Scholar] [CrossRef]
- Teixeira, R.; Cerveira, A.; Baptista, J. Optimized management of Renewable Energy Sources in Smart Grids in a VPP context. In Proceedings of the 2021 International Conference on Electrical, Computer and Energy Technologies (ICECET), Cape Town, South Africa, 9–10 December 2021. [Google Scholar] [CrossRef]
- García Vera, Y.E.; Dufo-López, R.; Bernal-Agustín, J.L. Energy Management in Microgrids with Renewable Energy Sources: A Literature Review. Appl. Sci. 2019, 9, 3854. [Google Scholar] [CrossRef]
- Mquqwana, M.A.; Krishnamurthy, S. Particle Swarm Optimization for an Optimal Hybrid Renewable Energy Microgrid System under Uncertainty. Energies 2024, 17, 422. [Google Scholar] [CrossRef]
- Bade, S.O.; Tomomewo, O.S.; Meenakshisundaram, A.; Dey, M.; Alamooti, M.; Halwany, N. Multi-Criteria Optimization of a Hybrid Renewable Energy System Using Particle Swarm Optimization for Optimal Sizing and Performance Evaluation. Clean Technol. 2025, 7, 23. [Google Scholar] [CrossRef]
- Jarso, A.K.; Jin, G.; Ahn, J. Hybrid Genetic Algorithm-Based Optimal Sizing of a PV–Wind–Diesel–Battery Microgrid: A Case Study for the ICT Center, Ethiopia. Mathematics 2025, 13, 985. [Google Scholar] [CrossRef]
- Garcia-Guarin, J.; Rodriguez, D.; Alvarez, D.; Rivera, S.; Cortes, C.; Guzman, A.; Bretas, A.; Aguero, J.R.; Bretas, N. Smart Microgrids Operation Considering a Variable Neighborhood Search: The Differential Evolutionary Particle Swarm Optimization Algorithm. Energies 2019, 12, 3149. [Google Scholar] [CrossRef]
- APREN—Associação Portuguesa de Energias Renováveis. Produção de Energias Renováveis. 2025. Available online: https://www.apren.pt/pt/energias-renovaveis/producao (accessed on 9 June 2025).
- República Portuguesa. Plano Nacional Energia e Clima 2030 (PNEC 2030). Agência Portuguesa do Ambiente (APA). Available online: https://apambiente.pt/sites/default/files/_Clima/Planeamento/20241030_pnec2030_maen.pdf (accessed on 16 October 2025).
- Osman, A.I.; Mehta, N.; Elgarahy, A.M.; Hefny, M.; Al-Hinai, A.; Al-Muhtaseb, A.H.; Rooney, D.W. Hydrogen production, storage, utilisation and environmental impacts: A review. Environ. Chem. Lett. 2022, 20, 153–188. [Google Scholar] [CrossRef]
- Comissão Europeia. REPowerEU; Comissão Europeia: Brussels, Belgium, 2022. [Google Scholar]
- Governo de Portugal. Plano de Recuperação e Resiliência de Portugal (PRR). Available online: https://recuperarportugal.gov.pt/wp-content/uploads/2024/04/PRR.pdf (accessed on 16 October 2025).
- Arcos, J.M.M.; Santos, D.M.F. The Hydrogen Color Spectrum: Techno-Economic Analysis of the Available Technologies for Hydrogen Production. Gases 2023, 3, 25–46. [Google Scholar] [CrossRef]
- Hermesmann, M.; Müller, T. Green, Turquoise, Blue, or Grey? Environmentally friendly Hydrogen Production in Transforming Energy Systems. Prog. Energy Combust. Sci. 2022, 90, 100996. [Google Scholar] [CrossRef]
- Singla, M.K.; Gupta, J.; Beryozkina, S.; Safaraliev, M.; Singh, M. The colorful economics of hydrogen: Assessing the costs and viability of different hydrogen production methods—A review. Int. J. Hydrogen Energy 2024, 61, 664–677. [Google Scholar] [CrossRef]
- International Energy Agency. Global Hydrogen Review 2024; IEA: Paris, France, 2024; Available online: https://www.iea.org/reports/global-hydrogen-review-2024 (accessed on 16 October 2025).
- Dawood, F.; Anda, M.; Shafiullah, G. Hydrogen production for energy: An overview. Int. J. Hydrogen Energy 2020, 45, 3847–3869. [Google Scholar] [CrossRef]
- Incer-Valverde, J.; Korayem, A.; Tsatsaronis, G.; Morosuk, T. “Colors” of hydrogen: Definitions and carbon intensity. Energy Convers. Manag. 2023, 291, 117294. [Google Scholar] [CrossRef]
- Mohamed Elshafei, A.; Mansour, R. Green Hydrogen as a Potential Solution for Reducing Carbon Emissions: A Review. J. Energy Res. Rev. 2023, 13, 1–10. [Google Scholar] [CrossRef]
- Majewski, P.; Salehi, F.; Xing, K. Green hydrogen. AIMS Energy 2023, 11, 878–895. [Google Scholar] [CrossRef]
- Shih, A.J.; Monteiro, M.C.O.; Dattila, F.; Pavesi, D.; Philips, M.; da Silva, A.H.M.; Vos, R.E.; Ojha, K.; Park, S.; van der Heijden, O.; et al. Water Electrolysis. Nat. Rev. Methods Prim. 2022, 2, 84. [Google Scholar] [CrossRef]
- Haoran, C.; Xia, Y.; Wei, W.; Yongzhi, Z.; Bo, Z.; Leiqi, Z. Safety and efficiency problems of hydrogen production from alkaline water electrolyzers driven by renewable energy sources. Int. J. Hydrogen Energy 2024, 54, 700–712. [Google Scholar] [CrossRef]
- Angelico, R.; Giametta, F.; Bianchi, B.; Catalano, P. Green Hydrogen for Energy Transition: A Critical Perspective. Energies 2025, 18, 404. [Google Scholar] [CrossRef]
- Agrawal, D.; Mahajan, N.; Singh, S.A.; Sreedhar, I. Green hydrogen production pathways for sustainable future with net zero emissions. Fuel 2024, 359, 130131. [Google Scholar] [CrossRef]
- Kanz, O.; Bittkau, K.; Ding, K.; Rau, U.; Reinders, A. Review and Harmonization of the Life-Cycle Global Warming Impact of PV-Powered Hydrogen Production by Electrolysis. Front. Electron. 2021, 2, 3. [Google Scholar] [CrossRef]
- Xu, Q.; Zhang, L.; Zhang, J.; Wang, J.; Hu, Y.; Jiang, H.; Li, C. Anion Exchange Membrane Water Electrolyzer: Electrode Design, Lab-Scaled Testing System and Performance Evaluation. EnergyChem 2022, 4, 100087. [Google Scholar] [CrossRef]
- Li, Q.; Molina Villarino, A.; Peltier, C.R.; Macbeth, A.J.; Yang, Y.; Kim, M.J.; Shi, Z.; Krumov, M.R.; Lei, C.; Rodríguez-Calero, G.G.; et al. Anion Exchange Membrane Water Electrolysis: The Future of Green Hydrogen. J. Phys. Chem. C 2023, 127, 7901–7912. [Google Scholar] [CrossRef]
- Li, H.; Guo, J.; Li, Z.; Wang, J. Research Progress of Hydrogen Production Technology and Related Catalysts by Electrolysis of Water. Molecules 2023, 28, 5010. [Google Scholar] [CrossRef]
- Qasem, N.A.A.; Abdulrahman, G.A.Q. A Recent Comprehensive Review of Fuel Cells: History, Types, and Applications. Int. J. Energy Res. 2024, 2024, 7271748. [Google Scholar] [CrossRef]
- Romagnoli, M.; Testa, V. Perspective Chapter: Methanol as a Fuel for Direct Methanol Fuel Cells (DMFCs)—Principles and Performance; IntechOpen: London, UK, 2023. [Google Scholar] [CrossRef]
- Ramasamy, P.; Muruganantham, B.; Rajasekaran, S.; Babu, B.D.; Ramkumar, R.; Marthanda, A.V.A.; Mohan, S. A comprehensive review on different types of fuel cell and its applications. Bull. Electr. Eng. Inform. 2024, 13, 774–780. [Google Scholar] [CrossRef]
- Baroutaji, A.; Carton, J.; Sajjia, M.; Olabi, A. Materials in PEM Fuel Cells. In Reference Module in Materials Science and Materials Engineering; Elsevier: Amsterdam, The Netherlands, 2016. [Google Scholar] [CrossRef]
- Tawalbeh, M.; Alarab, S.; Al-Othman, A.; Javed, R.M.N. The Operating Parameters, Structural Composition, and Fuel Sustainability Aspects of PEM Fuel Cells: A Mini Review. Fuels 2022, 3, 449–474. [Google Scholar] [CrossRef]
- Datta, A. PEM Fuel Cell Model for Conceptual Design of Hydrogen eVTOL Aircraft; Technical Report NASA/CR—20210000284; NASA: Washington, DC, USA, 2021; NASA Contractor Report. [Google Scholar]
- Pan, G.; Bai, Y.; Song, H.; Qu, Y.; Wang, Y.; Wang, X. Hydrogen Fuel Cell Power System—Development Perspectives for Hybrid Topologies. Energies 2023, 16, 2680. [Google Scholar] [CrossRef]
- Shi, J.; Aarsnes, U.J.F.; Tao, S.; Wang, R.; Nærheim, D.; Moura, S. Health-aware energy management for multiple stack hydrogen fuel cell and battery hybrid systems. Appl. Energy 2025, 397, 126257. [Google Scholar] [CrossRef]
- Osman, A.I.; Nasr, M.; Mohamed, A.R.; Abdelhaleem, A.; Ayati, A.; Farghali, M.; Al-Muhtaseb, A.H.; Al-Fatesh, A.S.; Rooney, D.W. Life cycle assessment of hydrogen production, storage, and utilization toward sustainability. WIREs Energy Environ. 2024, 13, e526. [Google Scholar] [CrossRef]
- United Nations. Transforming Our World: The 2030 Agenda for Sustainable Development. 2015. Available online: https://sdgs.un.org/2030agenda (accessed on 29 July 2025).
- Cummins Inc. HyLYZER 200 Hydrogen Electrolyzer—Technical Datasheet; Cummins Inc.: Columbus, IN, USA, 2021. [Google Scholar]
- EH Group. Fuel Cell Systems; EH Group: Nyon, Switzerland, 2025. [Google Scholar]
- FICO. FICO Xpress Optimization. Available online: https://www.fico.com/en/products/fico-xpress-optimization (accessed on 29 July 2025).
- Agência Portuguesa do Ambiente. Fator de Emissão da Eletricidade 2025; Technical Report; Agência Portuguesa do Ambiente: Amadora, Portugal, 2025. [Google Scholar]
Disclaimer/Publisher’s Note: The statements, opinions and data contained in all publications are solely those of the individual author(s) and contributor(s) and not of MDPI and/or the editor(s). MDPI and/or the editor(s) disclaim responsibility for any injury to people or property resulting from any ideas, methods, instructions or products referred to in the content. |
© 2025 by the authors. Licensee MDPI, Basel, Switzerland. This article is an open access article distributed under the terms and conditions of the Creative Commons Attribution (CC BY) license (https://creativecommons.org/licenses/by/4.0/).