Abstract
This study evaluates the impact of an educational intervention aimed at improving the management of benign paroxysmal positional vertigo (BPPV) in a clinical setting. Interrupted Time Series (ITS) analysis was used to assess changes in the use of key diagnostic maneuvers—Dix–Hallpike and Supine Roll—as well as the treatment maneuver, Canalith Repositioning Maneuvers (CRM), and the use of CT scans. The intervention aimed to promote evidence-based practices and minimize unnecessary imaging. ITS models accounted for confounders such as history of BPPV and dizziness. The results showed significant improvements in the use of the Supine Roll and CRM maneuvers, with both immediate increases and sustained upward trends following the intervention. For the Dix–Hallpike maneuver, an initial increase was observed after the intervention; however, this effect was no longer statistically significant after adjusting for confounders, suggesting that the observed change may have been influenced by shifts in the patient population rather than the intervention itself. A positive long-term trend persisted. No significant reduction in CT scan usage was found. These findings demonstrate the intervention’s effectiveness in enhancing adherence to recommended diagnostic and treatment practices for BPPV. However, they also suggest that reducing unnecessary imaging may require additional strategies beyond provider education.
1. Introduction
Benign Paroxysmal Positional Vertigo (BPPV) is the most common peripheral vestibular disorder and a significant contributor to vertigo-related healthcare visits. Despite the availability of well-established diagnostic tests and effective treatment maneuvers, BPPV is frequently underdiagnosed or mismanaged in clinical settings. Improving the adherence of healthcare providers to evidence-based BPPV practices remains an important challenge.
This study evaluates the impact of an educational intervention on the use of BPPV diagnostic and treatment practices using Interrupted Time Series (ITS) analysis. The intervention was implemented across multiple healthcare settings and aimed to promote the use of positional maneuvers and reduce unnecessary imaging, particularly CT scans. To situate this work, we review the clinical background of BPPV, evidence on educational interventions in vertigo management, and the relevance of ITS methods in healthcare research.
1.1. Clinical Background on BPPV
BPPV is characterized by brief episodes of vertigo triggered by specific head movements, typically due to the displacement of otoconia into the semicircular canals [1,2]. The posterior canal is most commonly involved, though horizontal canal cases also occur. Diagnosis is made through bedside positional maneuvers such as the Dix–Hallpike test for posterior canal BPPV and the Supine Roll test for horizontal canal variants [3,4]. Treatment primarily involves canalith repositioning maneuvers (CRMs), including the Epley and Semont maneuvers, which have demonstrated high effectiveness [5].
Despite their simplicity and proven efficacy, these diagnostic and therapeutic techniques are underutilized in clinical practice. Instead, patients frequently undergo neuroimaging, especially head CT scans, which offer limited diagnostic value for BPPV but contribute to increased healthcare costs and radiation exposure [6]. This diagnostic gap highlights the need for provider-level interventions to align practice with established guidelines.
1.2. Interrupted Time Series in Healthcare Research
Interrupted Time Series (ITS) analysis is a quasi-experimental design well suited for evaluating the longitudinal impact of policy or practice interventions where randomized controlled trials are impractical. ITS uses segmented regression to estimate level and trend changes before and after an intervention, accounting for pre-existing trends and temporal structure [7,8].
ITS has been widely applied in healthcare settings to assess the effects of guideline implementation, public health campaigns, regulatory changes, and quality improvement initiatives [9,10,11]. Turner et al. and Ewusie et al. have highlighted the utility of ITS in detecting both immediate and gradual effects of complex interventions and emphasized the importance of model diagnostics such as autocorrelation, stationarity, and heteroscedasticity [12,13].
1.3. Prior ITS Applications to BPPV Management
Efforts to improve adherence to evidence-based protocols for BPPV have begun to emerge in clinical settings. A prominent example is the Emergency VESTibular Algorithm (EVESTA), developed by Neely et al. to standardize the diagnosis and management of BPPV in emergency departments [6]. Evaluated using an interrupted time series design, the intervention led to marked improvements in clinical practice, including a 27% increase in Dix–Hallpike testing, a 33% increase in repositioning maneuvers, a 30% reduction in vestibular suppressant use, and a 16% decrease in neuroimaging. Additionally, a sustained decline in BPPV-related admissions highlighted the program’s broader clinical impact.
These findings underscore the value of structured implementation strategies and emphasize the importance of evaluating such interventions through rigorous longitudinal designs, such as interrupted time series analysis, which can assess both immediate and sustained effects across diverse clinical outcomes.
1.4. Study Rationale and Objectives
Building on this context, the present study investigates the effects of a real-world, multi-site intervention designed to improve BPPV management practices.
BPPV is a common yet frequently underdiagnosed cause of dizziness in emergency settings. Despite the availability of effective bedside assessments and repositioning maneuvers, clinical practices often rely on less effective or unnecessary diagnostic tools, such as head CT scans, contributing to delays, increased healthcare costs, and potential harm. Previous efforts to improve BPPV management have shown that structured clinical pathways can enhance the use of positional testing and treatments. However, most of these evaluations have been conducted in single centers with limited temporal scope and lack rigorous methodological designs.
This study aims to evaluate the impact of a structured educational intervention implemented across multiple hospital sites to improve adherence to evidence-based BPPV management.
To rigorously assess both the short- and long-term effects of this intervention, Interrupted Time Series (ITS) analysis was chosen as the evaluation framework. ITS is particularly well suited for detecting immediate changes while accounting for pre-existing trends, and for assessing whether improvements are sustained over time.
The study addresses the following objectives:
- Assess changes in the frequency of positional tests such as the Dix–Hallpike maneuver and Supine Roll test, and canalith repositioning maneuvers (CRMs);
- Examine trends in the use of computed tomography (CT) scans for patients presenting with vertigo;
- Apply segmented regression ITS models with appropriate statistical diagnostics to evaluate the immediate and sustained effects of the intervention.
By examining both behavioral and system-level outcomes using a robust quasi-experimental design, this research contributes to the evidence base on implementing sustainable practice change in emergency care for BPPV.
2. Materials and Methods
2.1. Study Design
This study employed an Interrupted Time Series (ITS) design to evaluate the impact of an educational intervention on the diagnosis and management of BPPV. ITS is a robust quasi-experimental method well-suited for situations where randomized controlled trials are not feasible. It allows for the assessment of both immediate and long-term intervention effects by analyzing outcome trends before and after implementation [10,11].
2.2. Setting and Data Sources
Data were obtained from three hospitals in Ontario, Canada: Health Sciences North (Sudbury), The Ottawa Hospital (Ottawa), and Thunder Bay Regional Health Sciences Centre (Thunder Bay). The dataset included 2015 patient records from emergency department visits between April 2018 and December 2022, spanning both pre-intervention (April 2018 to October 2021) and post-intervention (October 2021 to December 2022) periods. Each record comprised over 300 variables, including patient demographics, presenting symptoms, diagnostic procedures, treatment interventions, and discharge outcomes.
2.3. Educational Intervention
The intervention introduced a structured, guideline-based diagnostic and treatment algorithm aimed at improving adherence to best practices in BPPV management. It consisted of the following components:
- Educational Program: Comprehensive training sessions were delivered to emergency department providers. These sessions covered BPPV pathophysiology, diagnostic maneuvers (e.g., Dix–Hallpike and Supine Roll), and treatment techniques (e.g., Canalith Repositioning Maneuvers, CRMs).
- Algorithm Implementation: A standardized clinical pathway was introduced to encourage evidence-based diagnosis and treatment, reduce unnecessary CT imaging, and minimize inappropriate referrals.
- Support and Monitoring: Research assistants supported implementation across sites and conducted periodic audits to monitor adherence and address barriers.
2.4. Key Variables
2.4.1. Outcome Variables
The following binary indicators were assessed for each patient encounter:
- Dix-Hallpike Performed;
- Supine Roll Performed;
- Canalith Repositioning Maneuver (CRM) Performed;
- CT Scan Performed.
2.4.2. Time and Intervention Variables
- Date of Visit: Used to track time over the study period.
- Intervention Indicator: A binary variable distinguishing the pre- and post-intervention periods, with October 2021 as the start of the intervention.
2.4.3. Confounding Variables
Potential confounders included patient demographics and clinical characteristics such as age, sex, prior BPPV, symptoms (e.g., vertigo, dizziness, vomiting, unsteadiness), blood pressure, and relevant comorbidities (e.g., migraine, stroke). These were assessed using stepwise multivariable modeling and backward elimination.
2.5. Data Preprocessing
2.5.1. Merging and Cleaning
Data from pre- and post-intervention periods were merged. Variable formats were standardized, and missing values were interpreted as procedures not performed.
2.5.2. Standardization
Diagnostic test result values were harmonized (“positive”/“yes” treated as performed; “negative”/“no” still counted as performed). New binary outcome variables were created to indicate whether each maneuver or test was performed.
2.5.3. Handling Missing Data
Missing or blank values for CRM and CT variables were set to “no.” For Dix–Hallpike and Supine Roll, performance was inferred from the presence of any result entry.
2.6. Sample Size and Time Aggregation
To enhance statistical power and account for temporal variability, outcome data were aggregated into bi-weekly intervals for analysis. This granularity balanced detail with model stability and avoided excessive noise from daily fluctuations.
Aggregation choices were informed by diagnostic comparisons across multiple configurations (e.g., weekly, bi-weekly, monthly; raw counts vs. proportions). Bi-weekly counts provided optimal fit based on criteria such as R-squared, Durbin–Watson statistics, Augmented Dickey–Fuller (ADF) stationarity tests, and White’s test for heteroscedasticity.
Sample sizes were sufficient for ITS modeling, with a minimum of 12 intervals both pre- and post-intervention per outcome. Aggregated values reflected the number of procedures performed per interval (e.g., Dix–Hallpike, CRM, CT scan).
2.7. Statistical Analysis
Segmented regression models were used to estimate both level and slope changes in outcomes associated with the intervention [10,11]. The model was specified as:
where Yt is the outcome at time t; β0 is the baseline level; β1 reflects the pre-intervention trend; β2 captures the immediate post-intervention change; β3 denotes trend change post-intervention; and et is the error term.
Yt = β0 + β1 × timet + β2 × interventiont +β3 × time_after_interventiont + et
Data were analyzed at the bi-weekly level, as described in Section 2.6. A comprehensive set of diagnostic tests was conducted to ensure model validity, including tests for autocorrelation (Durbin–Watson, Breusch–Godfrey), stationarity (ADF), seasonality (STL decomposition), heteroscedasticity (Breusch–Pagan, White), residual normality (Shapiro–Wilk), and influential observations (Cook’s Distance). Newey–West standard errors were applied where assumptions were violated [14,15,16].
2.8. Confounder Identification and Adjustment
To account for potential confounding factors, a stepwise regression strategy was applied during model development. The process involved:
- Baseline model: Included only the time and intervention indicators.
- Multivariable model: Incorporated all candidate confounders identified in Section 2.4.3 (e.g., age, sex, clinical symptoms, prior BPPV diagnosis).
- Backward elimination: Backward elimination was used to remove variables with limited predictive value, retaining only those with statistically significant associations at the 0.05 level [17].
This approach ensured that the final ITS models adequately adjusted for relevant clinical and demographic characteristics while avoiding overfitting.
3. Results
3.1. Overview
This section presents findings from the Interrupted Time Series (ITS) analysis, evaluating the impact of an educational intervention on key diagnostic and treatment practices for BPPV, including Dix–Hallpike and Supine Roll tests, Canalith Repositioning Maneuvers (CRM), and CT scan usage. The section integrates descriptive statistics, inferential ITS modeling results, box plots, and model diagnostics.
3.2. Descriptive Statistics and Boxplots
To understand baseline and post-intervention patterns in clinical practice, descriptive statistics were calculated for each outcome measure, and boxplots were constructed to visualize changes in central tendency and variability. The results below summarize shifts in test usage and imaging rates across the two study periods.
3.2.1. Dix–Hallpike Test
The average number of Dix–Hallpike maneuvers declined notably after the intervention. Pre-intervention values showed a mean of 27.58 (SD = 16.62, Median = 27), which dropped to a post-intervention mean of 10.53 (SD = 4.12, Median = 10). Figure 1 displays a boxplot including jittered bi-weekly data points illustrating this reduction in both frequency and variability.
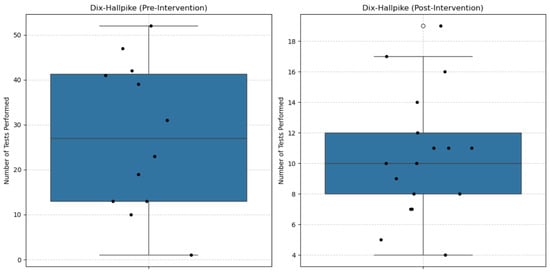
Figure 1.
Boxplot of Dix–Hallpike maneuvers before and after the intervention. A notable reduction in both test frequency and variability was observed post-intervention.
3.2.2. Supine Roll Test
Use of the Supine Roll test decreased substantially post-intervention. The mean fell from 19.67 (SD = 17.97) before the intervention to 5.75 (SD = 2.35) afterward. Figure 2 shows the corresponding boxplot, which includes jittered bi-weekly data points to illustrate the distribution and highlights lower post-intervention usage.
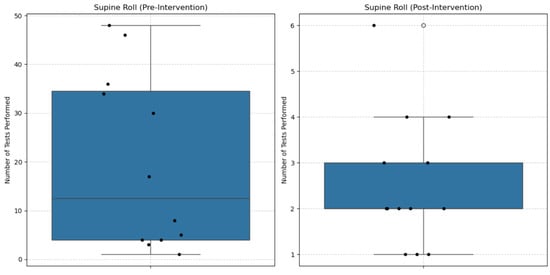
Figure 2.
Boxplot of Supine Roll tests before and after the intervention. The test was used less frequently and with more consistency following the intervention.
3.2.3. Canalith Repositioning Maneuvers (CRM)
CRM usage remained relatively stable but showed a slight post-intervention increase. The mean rose from 7.17 (SD = 6.28) to 8.15 (SD = 5.03). Figure 3 presents the boxplot, including jittered bi-weekly data points, comparing pre- and post-intervention frequencies.
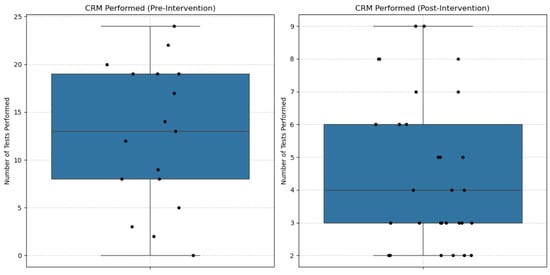
Figure 3.
Boxplot of Canalith Repositioning Maneuvers (CRM) before and after the intervention. A slight increase in CRM usage was noted after the intervention.
3.2.4. CT Scan Utilization
CT scan use dropped marginally following the intervention, with the mean declining from 54.25 (SD = 17.10) to 51.62 (SD = 10.82). Figure 4 illustrates this modest change in imaging frequency using a boxplot that includes jittered bi-weekly data points.
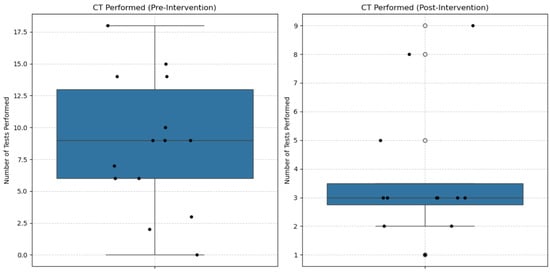
Figure 4.
Boxplot of CT Scan utilization before and after the intervention. CT scan usage declined modestly in the post-intervention period.
3.3. ITS Modeling Results
Interrupted Time Series (ITS) analysis was used to estimate baseline trends (β1), immediate post-intervention level changes (β2), and changes in slope following the intervention (β3) for each outcome.
3.3.1. Dix–Hallpike Performed
As shown in Table 1, a significant negative baseline trend was observed for Dix–Hallpike maneuvers (β1 = −4.34, p < 0.001), followed by a significant immediate increase in test frequency post-intervention (β2 = 14.35, p = 0.001), and a positive change in slope (β3 = 3.94, p < 0.001). Figure 5 presents the corresponding interrupted time series plot.

Table 1.
Segmented regression results for Dix–Hallpike performed.
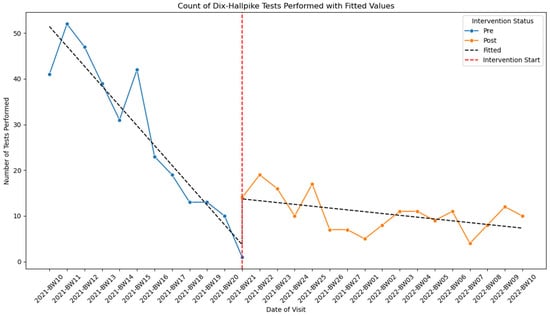
Figure 5.
Interrupted time series plot showing the count of Dix–Hallpike maneuvers performed before and after the intervention.
3.3.2. Supine Roll Performed
The baseline trend was significantly negative (β1 = –4.58, p < 0.001), followed by a significant level increase (β2 = 13.90, p = 0.003) and a positive slope post-intervention (β3 = 4.37, p < 0.001). Figure 6 illustrates these changes.
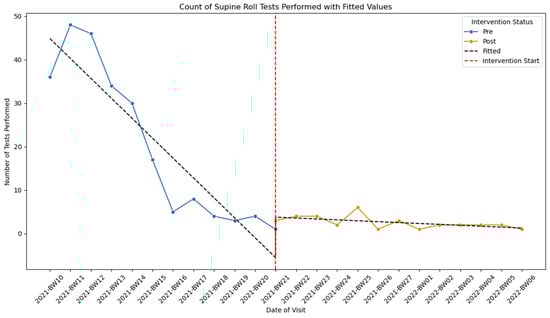
Figure 6.
Interrupted time series plot showing the count of Supine Roll test performed before and after the intervention.
3.3.3. CRM Performed
CRM use declined slightly before the intervention (β1 = −1.30, p < 0.001) but showed a significant immediate increase (β2 = 4.58, p = 0.012) and a rising post-intervention trend (β3 = 1.23, p < 0.001). Figure 7 presents the corresponding time series plot.
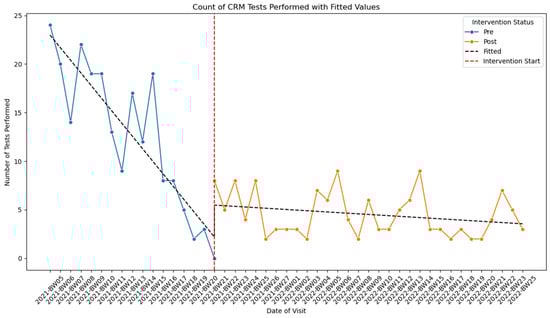
Figure 7.
Interrupted time series plot showing the count of Canalith Repositioning Maneuvers (CRM) performed before and after the intervention.
3.3.4. CT Scan Performed
CT usage decreased pre-intervention (β1 = −1.02, p < 0.001), but the immediate change post-intervention was not statistically significant (β2 = 3.48, p = 0.136). However, a small upward trend was observed post-intervention (β3 = 0.87, p = 0.001). Figure 8 illustrates the time series pattern.
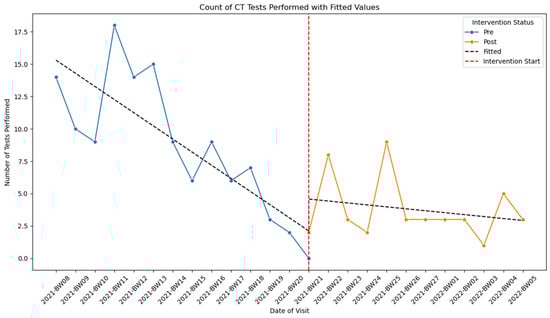
Figure 8.
Interrupted time series plot showing the count of CT scans performed before and after the intervention.
3.4. Confounder Analysis
Potential confounding factors—including history of BPPV, dizziness, vomiting, and unsteadiness—were evaluated using multivariable regression models. The key findings are summarized below:
- Dix–Hallpike Performed: Adjustment rendered the immediate effect non-significant (β2 adj. p = 0.215), although the post-intervention trend remained significant (β3 adj. = 1.75, p < 0.001).
- Supine Roll Performed: All adjusted coefficients remained statistically significant (β2 adj. = 19.81, p < 0.001; β3 adj. = 5.11, p < 0.001).
- CRM Performed: Significance persisted after adjusting for vertigo (β2 adj. = 4.67, p = 0.006; β3 adj. = 0.77, p = 0.004).
- CT Scan Performed: After adjusting for dizziness and BPPV history, all effects became non-significant.
Table 2 presents a comparison of unadjusted and adjusted segmented regression coefficients and p-values for each outcome.
Table 2.
Comparison of unadjusted and adjusted coefficients (β) and p-values for each outcome.
3.5. Model Diagnostics
Key regression assumptions—including autocorrelation, stationarity, seasonality, heteroscedasticity, linearity, normality of residuals, influential observations, and model specification—were evaluated using standard diagnostic tests. All models met these assumptions, with the exception of the CRM model, where heteroscedasticity was detected and addressed using Newey–West standard errors. Table 3 summarizes the diagnostic tests applied for each assumption.
Table 3.
Diagnostic tests used to assess segmented regression model assumptions.
4. Discussion
This study assessed the impact of an educational intervention on the diagnosis and treatment of BPPV using Interrupted Time Series (ITS) analysis. The findings offer important insights into the effectiveness of the intervention in improving adherence to key diagnostic maneuvers, including the Dix–Hallpike, Supine Roll, and Canalith Repositioning Maneuver (CRM). The ITS results demonstrated both immediate and sustained changes in practice patterns, indicating that the intervention was successful in promoting better alignment with clinical guidelines for BPPV management.
In interpreting these findings, it is also important to recognize that positional nystagmus (PN) can occur in healthy individuals without representing a pathological process. Studies have shown that PN is highly prevalent among asymptomatic adults, with reported rates of approximately 70% [18] and 88% [19]. Nelson et al. [20] proposed that nystagmus with a slow-phase velocity (SPV) ≤ 4°/s observed in ≤4 head positions is likely physiologic, particularly in the absence of vertigo. Domínguez-Durán et al. [21] further demonstrated that about 65% of healthy participants exhibit endpoint nystagmus during eccentric gaze without symptoms. Bisdorff et al. [22] also described upbeat PN in healthy subjects under dark conditions. These findings underscore the importance of not relying on nystagmus alone to diagnose BPPV. Instead, clinicians should consider the presence of vertigo during maneuvers, torsional eye movement components, fatigability of the response, and whether the SPV exceeds normative thresholds (e.g., >5°/s for horizontal, >6.5°/s for vertical PN). Over-diagnosis based solely on PN without accompanying clinical features should be avoided to prevent inappropriate treatment.
Although the intervention led to improvements in the use of diagnostic and treatment maneuvers, it did not result in a meaningful reduction in the use of CT scans. Even after adjusting for relevant confounders such as a history of BPPV and dizziness, no statistically significant decline in CT usage was observed. This suggests that while educational efforts can positively influence provider behavior for bedside practices, they may not be sufficient to alter decisions involving imaging, which are likely shaped by additional clinical, institutional, or medicolegal factors.
These findings underscore the complexity of changing imaging behaviors in clinical settings. Addressing the overuse of neuroimaging may require a combination of strategies, including decision support tools, institutional policies, audit and feedback mechanisms, or system-level changes in diagnostic pathways.
4.1. Interpretation of Key Findings
The analysis revealed that the Supine Roll test showed the most pronounced and sustained improvement following the intervention, with both immediate and long-term increases in usage.
In contrast, although the Dix–Hallpike maneuver showed a significant immediate increase in the unadjusted model, this effect became statistically non-significant after adjusting for patient-level confounders (β2 adj. p = 0.215). This suggests that the initial post-intervention increase may have been influenced by shifts in patient characteristics—such as symptom presentation or prior BPPV history—rather than by the intervention alone. However, a statistically significant and positive long-term trend (β3 adj. = 1.75, p < 0.001) remained, indicating a gradual improvement in adherence over time.
These findings emphasize the importance of confounder adjustment in real-world evaluations and suggest that while the intervention did not produce an immediate effect on Dix–Hallpike usage, it may have facilitated sustained behavior change.
Similarly, the use of the CRM treatment maneuver showed both an immediate increase and a sustained upward trend, reflecting improved treatment delivery in line with best practice guidelines. In contrast, CT scan utilization did not exhibit meaningful change after the intervention. Although a slight increase was noted in the unadjusted model, this effect disappeared after adjusting for clinical history variables. This suggests that factors beyond provider education—such as diagnostic uncertainty in atypical or complex cases, institutional norms favoring imaging for liability protection, and medicolegal concerns regarding missed diagnoses—may continue to drive CT use. Additionally, the lack of integrated clinical decision support tools or system-level feedback may limit providers’ ability to change imaging behavior based on education alone.
4.2. Comparison with Existing Literature
Our findings are consistent with prior studies that report educational interventions can lead to improvements in diagnostic accuracy and clinical practice adherence. For example, Neely et al. [6] used ITS analysis to evaluate interventions in emergency settings and found similar improvements in diagnostic behaviors. However, unlike their study, we did not observe a significant decrease in neuroimaging use, suggesting that imaging practices may be more resistant to change and influenced by local factors, such as institutional policies or clinician habits.
This difference highlights the importance of context when interpreting the impact of educational interventions. It also raises the need for further investigation into complementary strategies that might be more effective at curbing unnecessary imaging.
4.3. Strengths and Limitations
A major strength of this study is the use of ITS analysis, which offers a robust method for evaluating intervention effects over time. The application of Newey-West standard errors further strengthened the analysis by addressing heteroscedasticity where detected. Adjusting for relevant clinical confounders enhanced the internal validity of the findings.
Nonetheless, several limitations should be acknowledged. The study was limited to three healthcare institutions within Ontario, potentially affecting generalizability. The use of retrospective data may have introduced unmeasured confounding. Additionally, while bi-weekly aggregation was chosen to balance temporal resolution and statistical stability, different interval choices could yield slightly different estimates and should be considered in future studies.
5. Conclusions
This study applied Interrupted Time Series analysis to evaluate the effect of an educational intervention on the management of benign paroxysmal positional vertigo. The intervention was associated with increased use of diagnostic maneuvers, including Dix–Hallpike and Supine Roll, and with improved use of the CRM treatment technique. These findings support the value of educational programs in enhancing guideline-adherent care for BPPV.
However, the intervention did not lead to a significant reduction in CT scan usage, even after adjusting for relevant clinical confounders. This outcome highlights the challenges in altering imaging practices and suggests that education alone may be insufficient to drive such changes. Future efforts to reduce unnecessary imaging may require the integration of decision support systems, institutional policies, or provider feedback mechanisms.
Further research is needed to identify and evaluate multifaceted interventions that can address both clinical behavior and systemic factors influencing diagnostic decision-making.
Author Contributions
Conceptualization, E.A. and K.P.; methodology, E.A. and K.P.; software, E.A.; validation, E.A. and K.P.; formal analysis, E.A.; investigation, E.A.; resources, E.A. and R.O.; data curation, E.A. and R.O.; writing—original draft preparation, E.A. and K.P.; writing—review and editing, E.A.; visualization, E.A.; supervision, K.P. and R.O.; project administration, K.P. and R.O. All authors have read and agreed to the published version of the manuscript.
Funding
This research received no external funding.
Data Availability Statement
The datasets presented in this article are not readily available because the data has been acquired from the hospital in Sudbury, ON, Canada. Requests to access the datasets should be directed to the authors.
Conflicts of Interest
The authors declare no conflict of interest.
References
- Von Brevern, M.; Radtke, A.; Lezius, F.; Feldmann, M.; Ziese, T.; Lempert, T.; Neuhauser, H. Epidemiology of benign paroxysmal positional vertigo: A population based study. J. Neurol. Neurosurg. Psychiatry 2006, 78, 710–715. [Google Scholar] [CrossRef] [PubMed]
- Hu, Y.; Lu, Y.; Wang, S.; Quan, X.; Ren, Y.; Rong, K.; Pan, S.; Lu, X.; Chen, L.; Tian, C.; et al. Global research trends in benign paroxysmal positional vertigo: A bibliometric analysis. Front. Neurol. 2023, 14, 1204038. [Google Scholar] [CrossRef] [PubMed]
- Hornibrook, J. Benign Paroxysmal Positional Vertigo (BPPV): History, pathophysiology, office treatment and future directions. Int. J. Otolaryngol. 2011, 2011, 835671. [Google Scholar] [CrossRef] [PubMed]
- Cole, S.R.; Honaker, J.A. Benign paroxysmal positional vertigo: Effective diagnosis and treatment. Clevel. Clin. J. Med. 2022, 89, 653–662. [Google Scholar]
- Lee, S.-H.; Kim, J.S. Benign paroxysmal positional vertigo. J. Clin. Neurol. 2010, 6, 51. [Google Scholar] [CrossRef] [PubMed]
- Neely, P.; Patel, H.; McTaggart, J.; Bright, S.; Wellings, T. EVESTA: Emergency VESTIBULAR Algorithm and its impact on the acute management of benign paroxysmal positional vertigo. Emerg. Med. Australas. 2023, 35, 312–318. [Google Scholar] [CrossRef] [PubMed]
- Self, W.H.; Speroff, T.; Grijalva, C.G.; McNaughton, C.D.; Ashburn, J.; Liu, D.; Arbogast, P.G.; Russ, S.; Storrow, A.B.; Talbot, T.R. Reducing blood culture contamination in the emergency department: An interrupted time series quality improvement study. Acad. Emerg. Med. 2013, 20, 89–97. [Google Scholar] [CrossRef] [PubMed]
- Hudson, J.; Fielding, S.; Ramsay, C.R. Methodology and reporting characteristics of studies using interrupted time series design in healthcare. BMC Med. Res. Methodol. 2019, 19, 137. [Google Scholar] [CrossRef] [PubMed]
- Turner, S.L.; Karahalios, A.; Forbes, A.B.; Taljaard, M.; Grimshaw, J.M.; Cheng, A.C.; Bero, L.; McKenzie, J.E. Design characteristics and statistical methods used in interrupted time series studies evaluating public health interventions: A review. J. Clin. Epidemiol. 2020, 122, 1–11. [Google Scholar] [CrossRef] [PubMed]
- Wagner, A.K.; Soumerai, S.B.; Zhang, F.; Ross-Degnan, D. Segmented regression analysis of interrupted time series studies in medication use research. J. Clin. Pharm. Ther. 2002, 27, 299–309. [Google Scholar] [CrossRef] [PubMed]
- Lopez Bernal, J.; Cummins, S.; Gasparrini, A. Interrupted time series regression for the evaluation of public health interventions: A tutorial. Int. J. Epidemiol. 2016, 45, dyw098. [Google Scholar] [CrossRef] [PubMed]
- Turner, S.L.; Karahalios, A.; Forbes, A.B.; Taljaard, M.; Grimshaw, J.M.; McKenzie, J.E. Comparison of six statistical methods for interrupted time series studies: Empirical evaluation of 190 published series. BMC Med. Res. Methodol. 2021, 21, 134. [Google Scholar] [CrossRef] [PubMed]
- Ewusie, J.E.; Soobiah, C.; Blondal, E.; Beyene, J.; Thabane, L.; Hamid, J.S. Methods, applications and challenges in the analysis of interrupted time series data: A scoping review. J. Multidiscip. Healthc. 2020, 13, 411–423. [Google Scholar] [CrossRef] [PubMed]
- Wooldridge, J.M. Introductory Econometrics: A Modern Approach, 5th ed.; South-Western Cengage Learning: Mason, OH, USA, 2013. [Google Scholar]
- Box, G.E.P.; Jenkins, G.M.; Reinsel, G.C.; Ljung, G.M. Time Series Analysis: Forecasting and Control, 5th ed.; Wiley Series in Probability and Statistics; John Wiley & Sons, Inc.: Hoboken, NJ, USA, 2016. [Google Scholar]
- Montgomery, D.C.; Peck, E.A.; Vining, G.G. Introduction to Linear Regression Analysis, 5th ed.; Wiley Series in Probability and Statistics; John Wiley & Sons, Inc.: Hoboken, NJ, USA, 2012. [Google Scholar]
- Lilja, D.J. Linear Regression Using R: An Introduction to Data Modeling, 1st ed.; University of Minnesota Libraries Publishing: Minneapolis, MN, USA, 2016. [Google Scholar] [CrossRef]
- Rasmussen, M.B.; Sørensen, R.; Hougaard, D.D. Positional nystagmus is observed in the vast majority of healthy individuals. Eur. Arch. Otorhinolaryngol. 2024, 281, 3499–3507. [Google Scholar] [CrossRef] [PubMed]
- Martens, C.; Goplen, F.K.; Nordfalk, K.F.; Aasen, T.; Nordahl, S.H.G. Prevalence and characteristics of positional nystagmus in normal subjects. Otolaryngol. Head Neck Surg. 2016, 154, 861–867. [Google Scholar] [CrossRef] [PubMed]
- Nelson, M.D.; Mann, L.; Nicholson, C.; Lehman, M. Static positional nystagmus in the healthy vestibular system. J. Am. Acad. Audiol. 2019, 30, 883–895. [Google Scholar] [CrossRef] [PubMed]
- Domínguez-Durán, E.; Prieto-Sanchez-de-Puerta, L.; Martín-Jiménez, D.I.; Sanchez-Gomez, S. Positional end-point nystagmus during positional testing: Prevalence, characteristics and differences with benign paroxysmal positional vertigo. J. Clin. Med. 2023, 12, 393. [Google Scholar] [CrossRef] [PubMed]
- Bisdorff, A.R.; Sancovic, S.; Debatisse, D.; Bentley, C.; Gresty, M.A.; Bronstein, A.M. Positional nystagmus in the dark in normal subjects. Neuro-Ophthalmology 2000, 24, 283–290. [Google Scholar] [CrossRef]


Disclaimer/Publisher’s Note: The statements, opinions and data contained in all publications are solely those of the individual author(s) and contributor(s) and not of MDPI and/or the editor(s). MDPI and/or the editor(s) disclaim responsibility for any injury to people or property resulting from any ideas, methods, instructions or products referred to in the content. |
© 2025 by the authors. Licensee MDPI, Basel, Switzerland. This article is an open access article distributed under the terms and conditions of the Creative Commons Attribution (CC BY) license (https://creativecommons.org/licenses/by/4.0/).