SAIN: Search-And-INfer, a Mathematical and Computational Framework for Personalised Multimodal Data Modelling with Applications in Healthcare
Abstract
1. Introduction
2. Mathematical Description
2.1. Database
- objects (samples) ;
- Each object () is defined by criteria (variables) with values in linearly ordered domains with and ; if some value (, ) is either missing or uncertain, then its value is recorded as ∞;
- weights in with , where each () quantifies the importance of the criterion ; if for all , then all criteria are equally important; a criterion is ignored if .
2.2. Distance Metrics
- Logical Boolean domain: , where .
- Logical non-Boolean domain: , where and .
- Numerical domain with natural values: , where .
- Numerical domain with rational values: , where .
- Binary code: , where the domain consists of all binary strings of length n, and for all , , ,
2.3. Tasks Specification
- Task 1: Calculate the distance (or similarity metric) between the new object and each object in Table 2. If the distance corresponding to is , then
- Task 2: Given a threshold , calculate all objects at a distance at most to x.
- Task 3: Calculate the probability of a new object belonging to a labelled class (e.g., low risk vs. high risk) using a threshold and Table 2.
- Task 4: Rank the criteria in Table 2 and calculate the marker or markers criterion/criteria that are the most important/ones.
- Task 5: Assign alternative weights to criteria.
- Task 6: Test the data accuracy and method for Task 4.
2.4. Tasks Solutions
- Compute the distances between each object in Table 2 and , so obtain a vector with n non-negative real components .
- For each , compute the distances taking into consideration all criteria in Table 2 except : obtain the vector .
- Compute the distances between , using the formulaand sort them in increasing order. The criterion is a marker if , for every .
2.5. An Example
- : real number , e.g., age, weight, BMI etc.;
- : Boolean value , e.g., gender;
- : integer number , e.g., gene expression;
- : categorical {small, med, large }, e.g., size of tumour, body size, keywords;
- : colour {red, yellow, white, black}, e.g., colour of a spot on the body, on the heart;
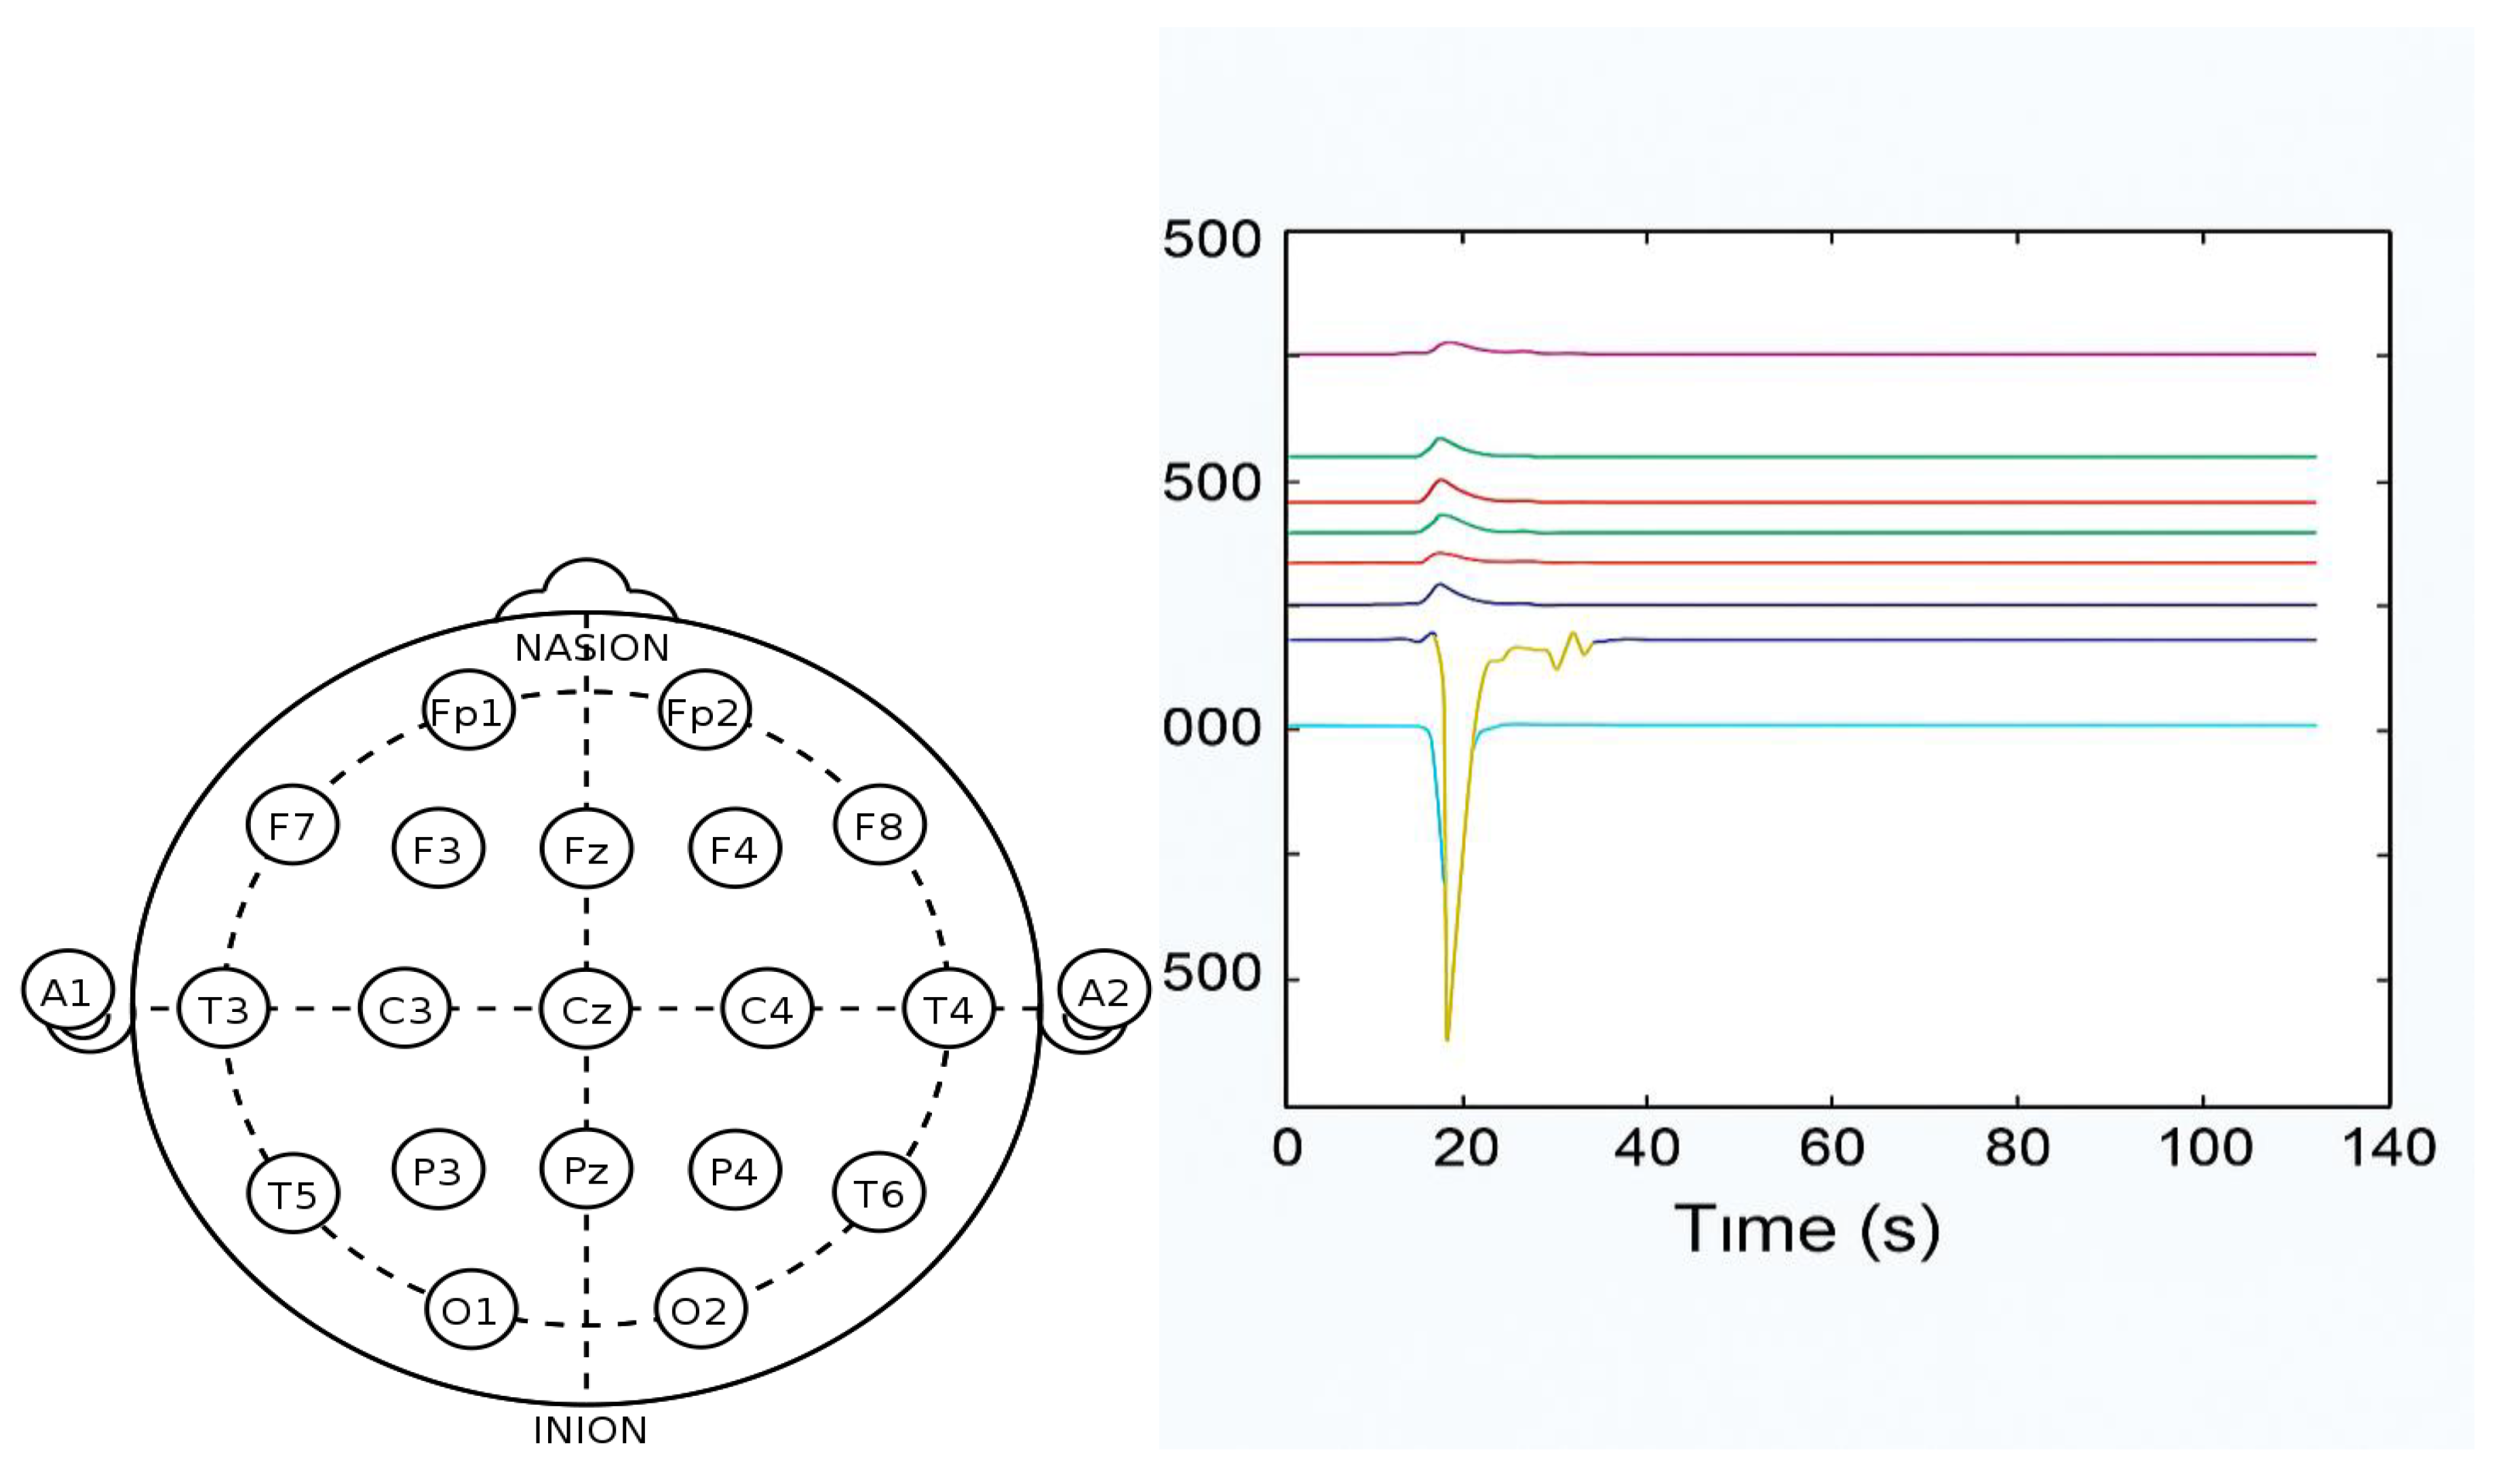
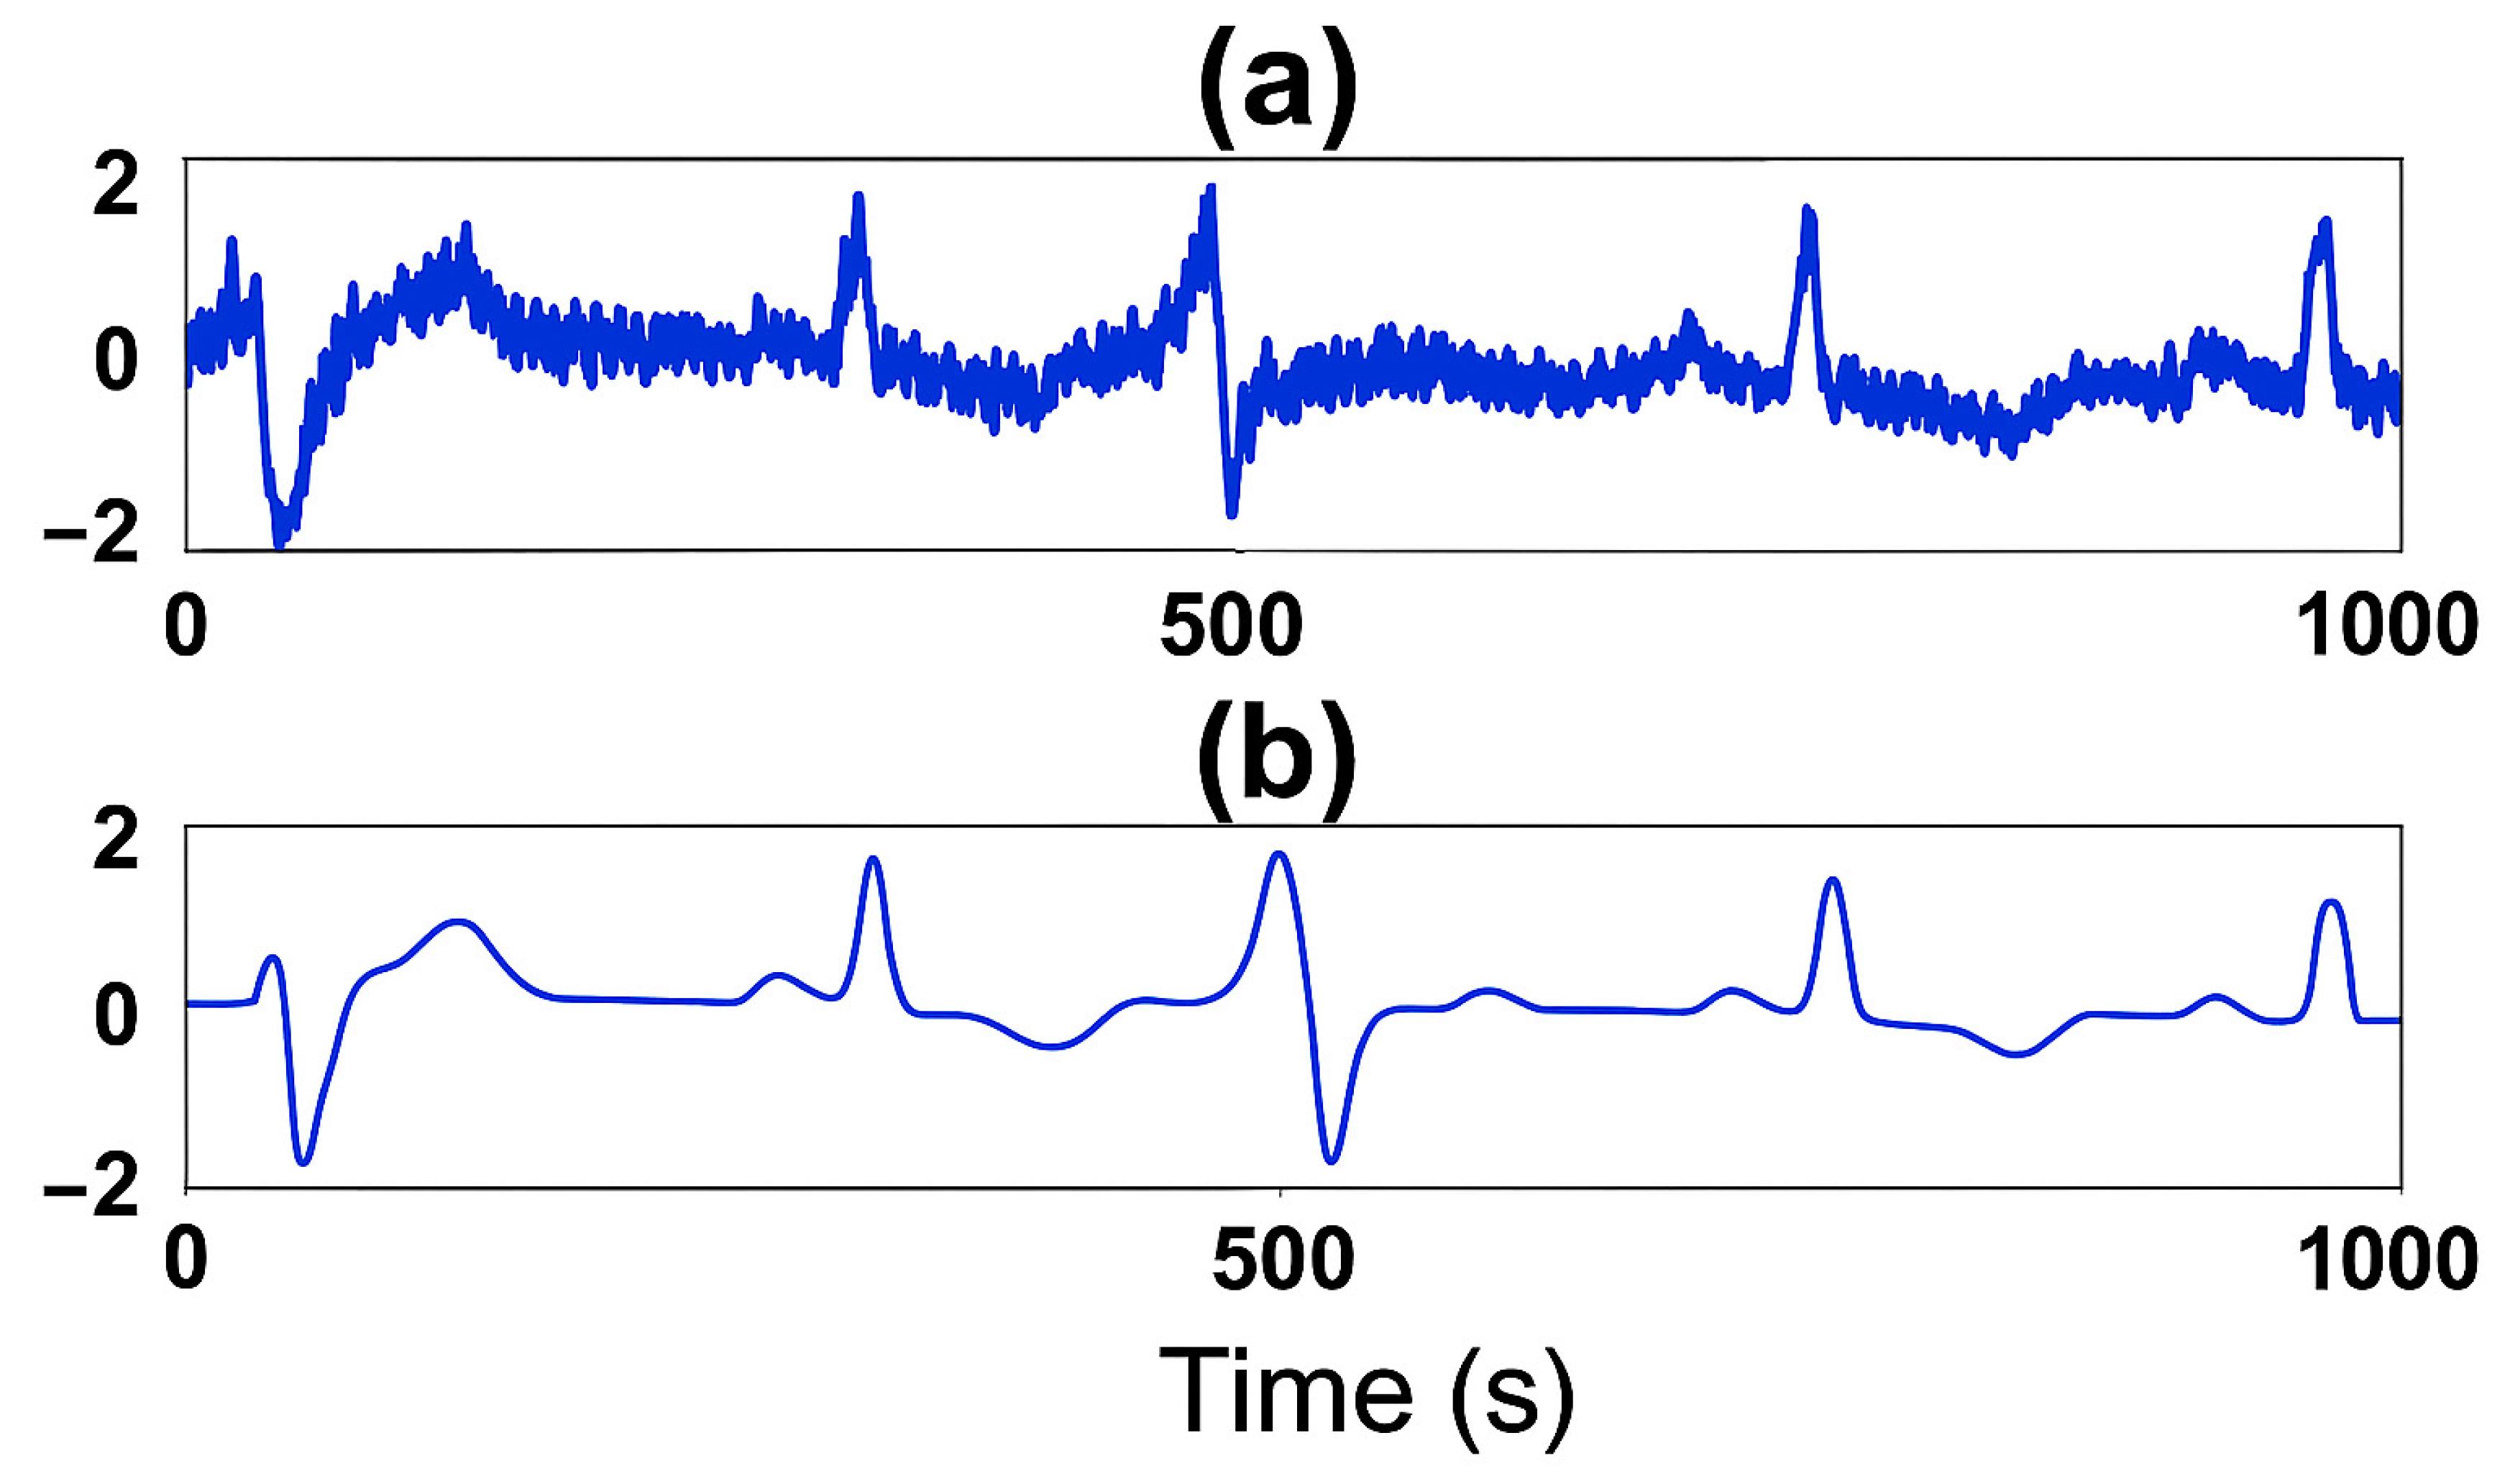
- : spike sequence of e.g., encoded EEG, ECG;
- : black and white image, e.g., MRI, face image.
| 68.2 | 0 | 6789 | small | red | 0, 1, −1, −1, 1,1, 0, 0, 1, −1 | 1, 1, 0 | 1 |
| 0, 0, 1 | |||||||
| 0, 0, 1 | |||||||
| 93 | 1 | 98,000 | medium | yellow | 0, −1, −1, −1, −1, 0, 0, 1, −1, 1 | 1, 0, 0 | 1 |
| 0, 0, 1 | |||||||
| 0, 0, 1 | |||||||
| 44.5 | 1 | 5600 | large | red | 0, 1, −1, 1, −1, 1, 0, 0, 1, −1 | 1, 1, 0 | 1 |
| 1, 0, 1 | |||||||
| 1, 1, 1 | |||||||
| 56.8 | 0 | 89 | small | white | 1, −1, −1, −1, −1, 1, 0, 0, 1, −1 | 1, 1, 0 | 1 |
| 0, 1, 1 | |||||||
| 1, 0, 1 | |||||||
| 26.3 | 0 | 9456 | large | black | 1, −1, −1, −1, 0,1, 0, 0, 1, −1 | 1, 1, 0 | 2 |
| 1, 1, 1 | |||||||
| 1, 0, 1 | |||||||
| 81.5 | 1 | 78, 955 | medium | red | 0, 1, −1, 1, −1, −1, 0, 0, 1, −1 | 1, 1, 0 | 2 |
| 0, 0, 1 | |||||||
| 1, 1, 1 | |||||||
| 56.7 | 1 | 68, 900 | small | black | 1, −1, −1, 1, −1, 1, 0, 0, 1, 1 | 1, 1,1 | 2 |
| 0, 0,1 | |||||||
| 1, 1,1 | |||||||
| 20 | 0 | 7833 | large | yellow | 1, 1, −1, −1, 1,1, 0, −1, −1, 1 | 1, 0, 0 | 2 |
| 0, 0, 1 | |||||||
| 1, 1, 1 | |||||||
| 20 | 0 | 7833 | ∞ | yellow | 1, 1, −1, −1, 1,1, 0, −1, −1, 1 | 1, 0, 0 | 2 |
| 0, 0, 1 | |||||||
| 1, 1, 1 |
| 48.5 | 1 | 45,679 | large | red | 1, 0, 0, −1, 1, −1, 1, 0, 0, 1 | 1, 1, 0 |
| 0, 0, 1 | ||||||
| 1, 0, 1 |
2.6. Complexity Estimation of the SAIN Method
3. Survival Analysis in SAIN
3.1. Data and Tasks
- 1.
- Table 17, in which the first column lists the patients treated for the same disease with the same method under strict conditions, and wherein the last column records the times until the patients’ deaths.
- 2.
- Table 18, which includes the record of the new patient p.
- 3.
- A threshold which defines the acceptable similarity between p and the relevant ’s in the Survival database (i.e., ).
3.2. Tasks Solutions
- 1.
- For Task 1,
- (a)
- Compute the set of patients that are similar up to to p:
- (b)
- Using , compute the probability that p will survive the time :
- (c)
- Compute the life expectancy of p using the formula:
- 2.
- For Task 2, calculate the probability that the life expectancy of p is at least time T:
3.3. An Example
- 1.
- For , , that is the entire database. Then,
- (a)
- ,
- (b)
- i.
- ,
- ii.
- ,
- iii.
- ,
- iv.
- ,
- v.
- ,
- vi.
- ,
- vii.
- ,
- viii.
- .
- (c)
- i.
- ,
- ii.
- ,
- iii.
- ,
- iv.
- ,
- v.
- ,
- vi.
- ,
- vii.
- ,
- viii.
- ,
- We can calculate other probabilities; for example, .
- 2.
- For , . Then,
- (a)
- ,
- (b)
- i.
- ,
- ii.
- ,
- iii.
- ,
- iv.
- ,
- v.
- ,
- (c)
- i.
- ,
- ii.
- ,
- iii.
- ,
- iv.
- ,
- v.
- .
- Similarly, we can calculate the probabilities , .
4. SAIN: A Modular Diagram and Functional Information Flow
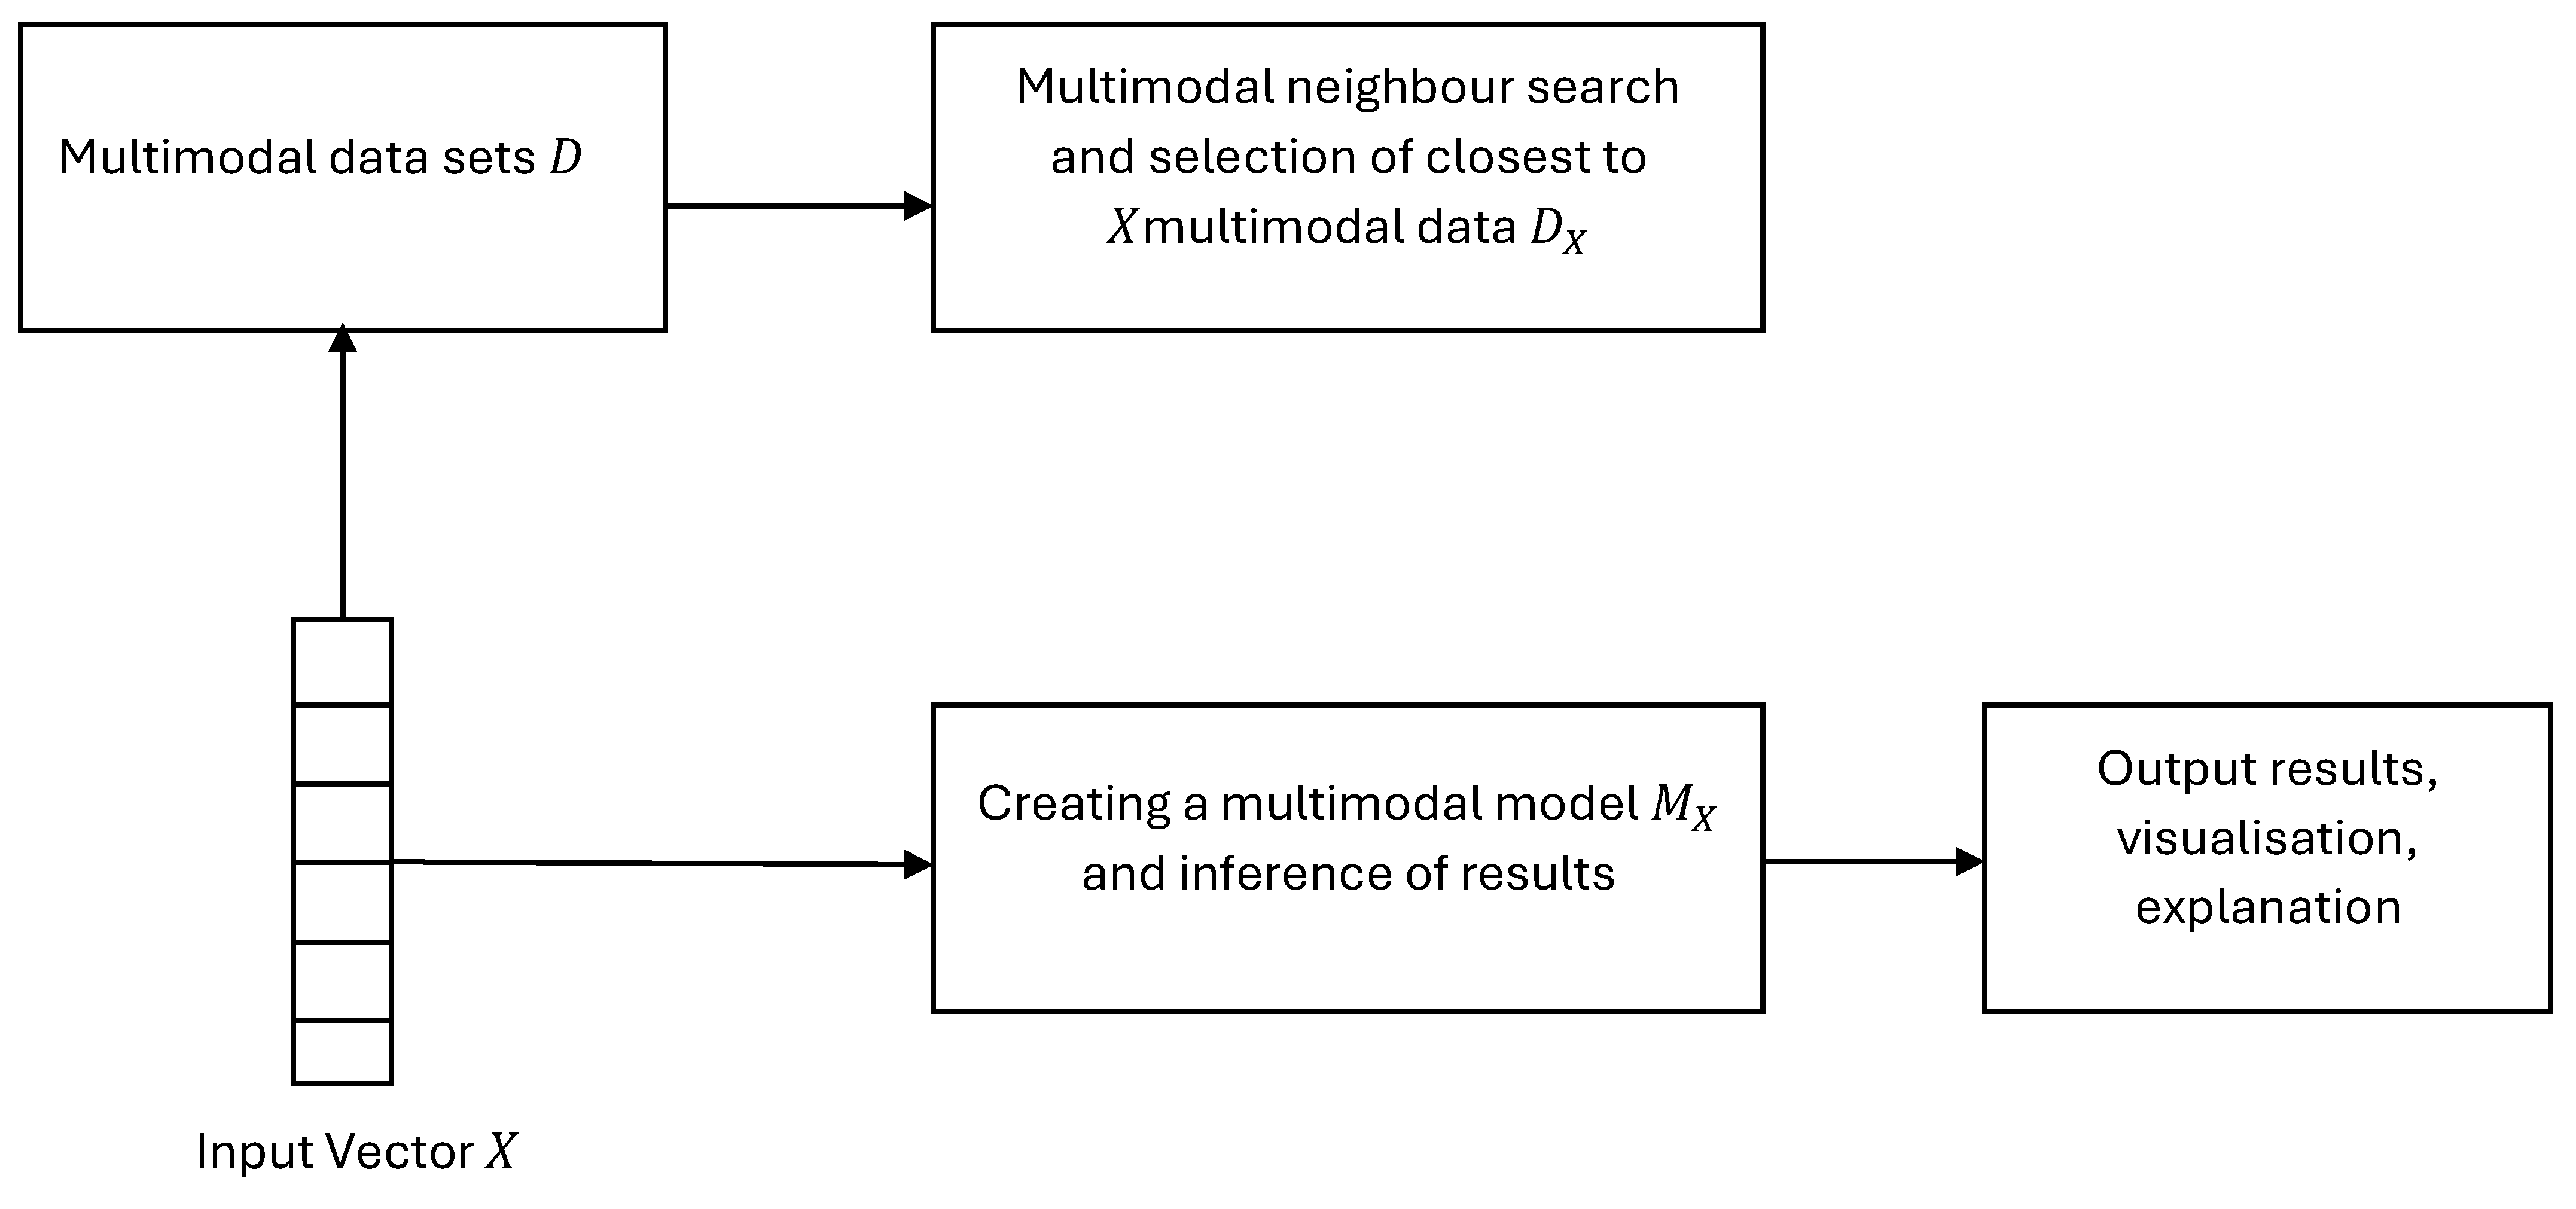
- 1.
- Multimodal data of a new object X.
- 2.
- An existing repository D of multimodal data of many objects, labelled with their outcome.
- 3.
- A module of algorithms for searching in the database D and based on the distance between X and each object in D.
- 4.
- Defining a subset from D, so that X is closer to the objects in based on a given threshold.
- 5.
- A module of algorithms for building a model in .
- 6.
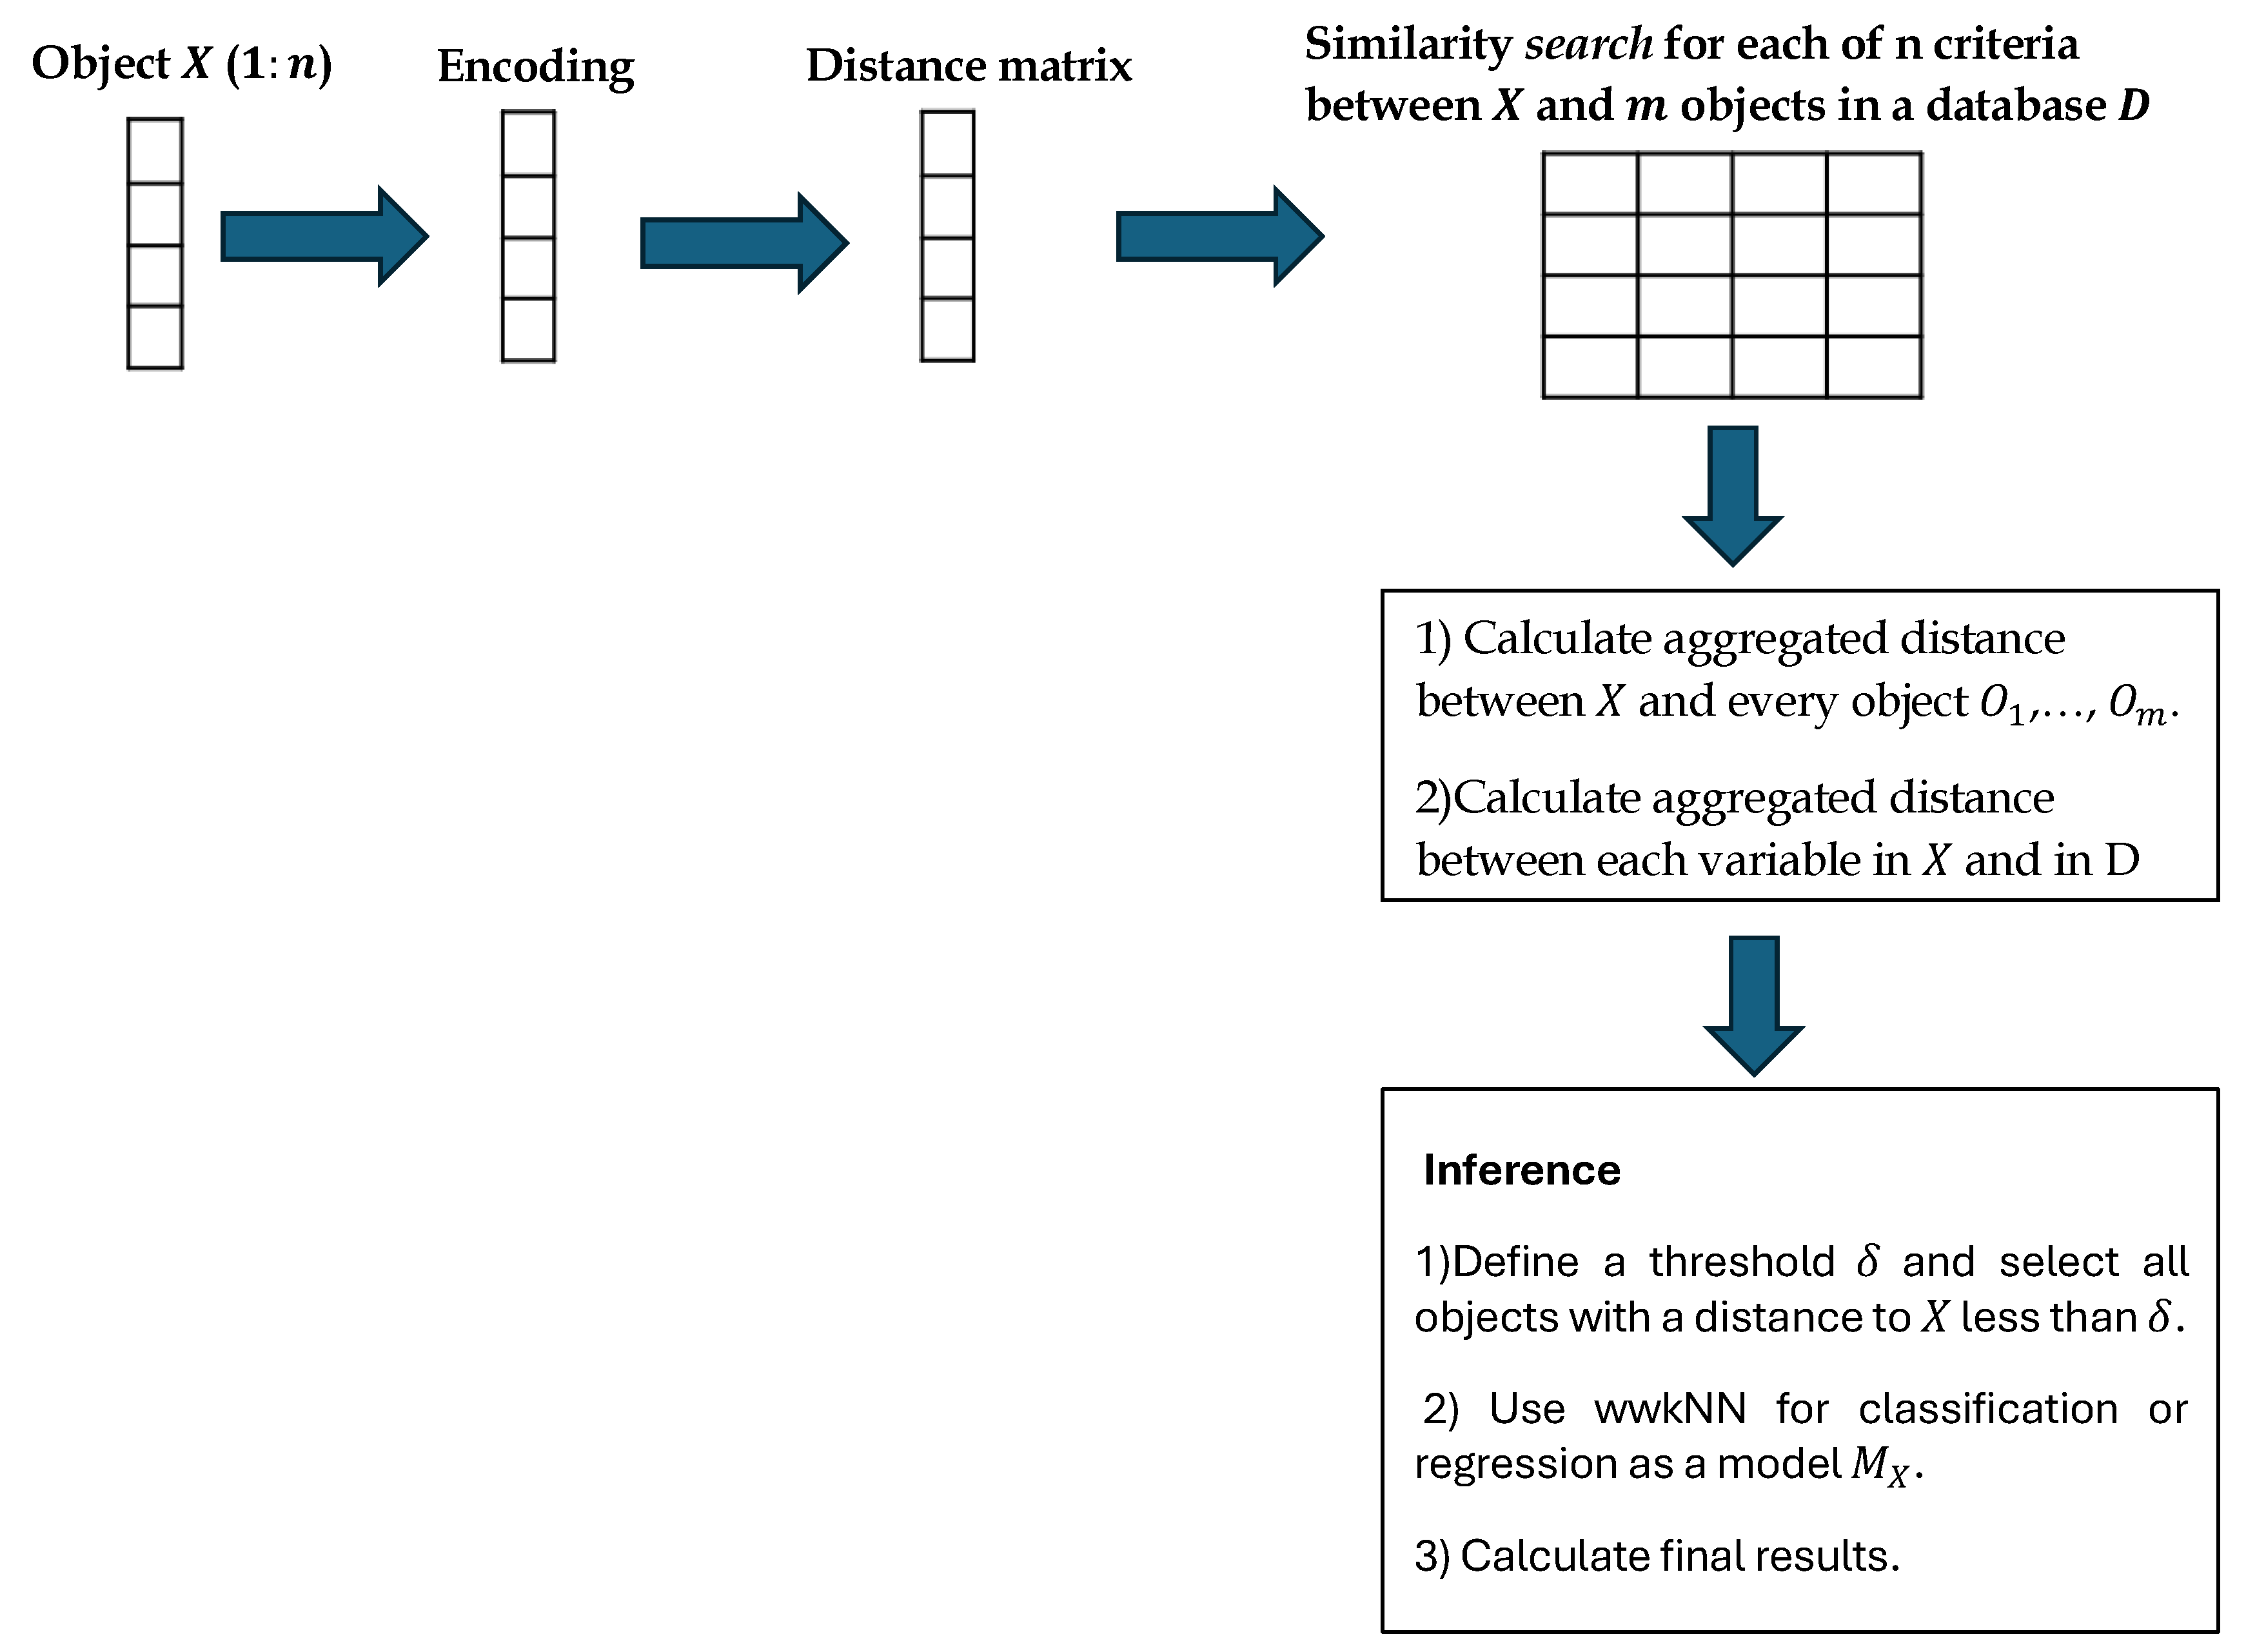
- An inference algorithm to derive the output for X from the model and to visualise it for explanation purposes. Figure 1 gives a modular view of the SAIN framework and Figure 2 shows the information processing flow:
- (a)
- Encoding the multimodal data of X and D.
- (b)
- Choosing a distance matrix and similarity search in the dataset D.
- (c)
- Calculating the aggregated difference between the new data vector X and the closest vectors in .
- (d)
- Creating a model in .
- (e)
- Applying inference by calculating the for each class (or output value), using the wwkNN method in [5].
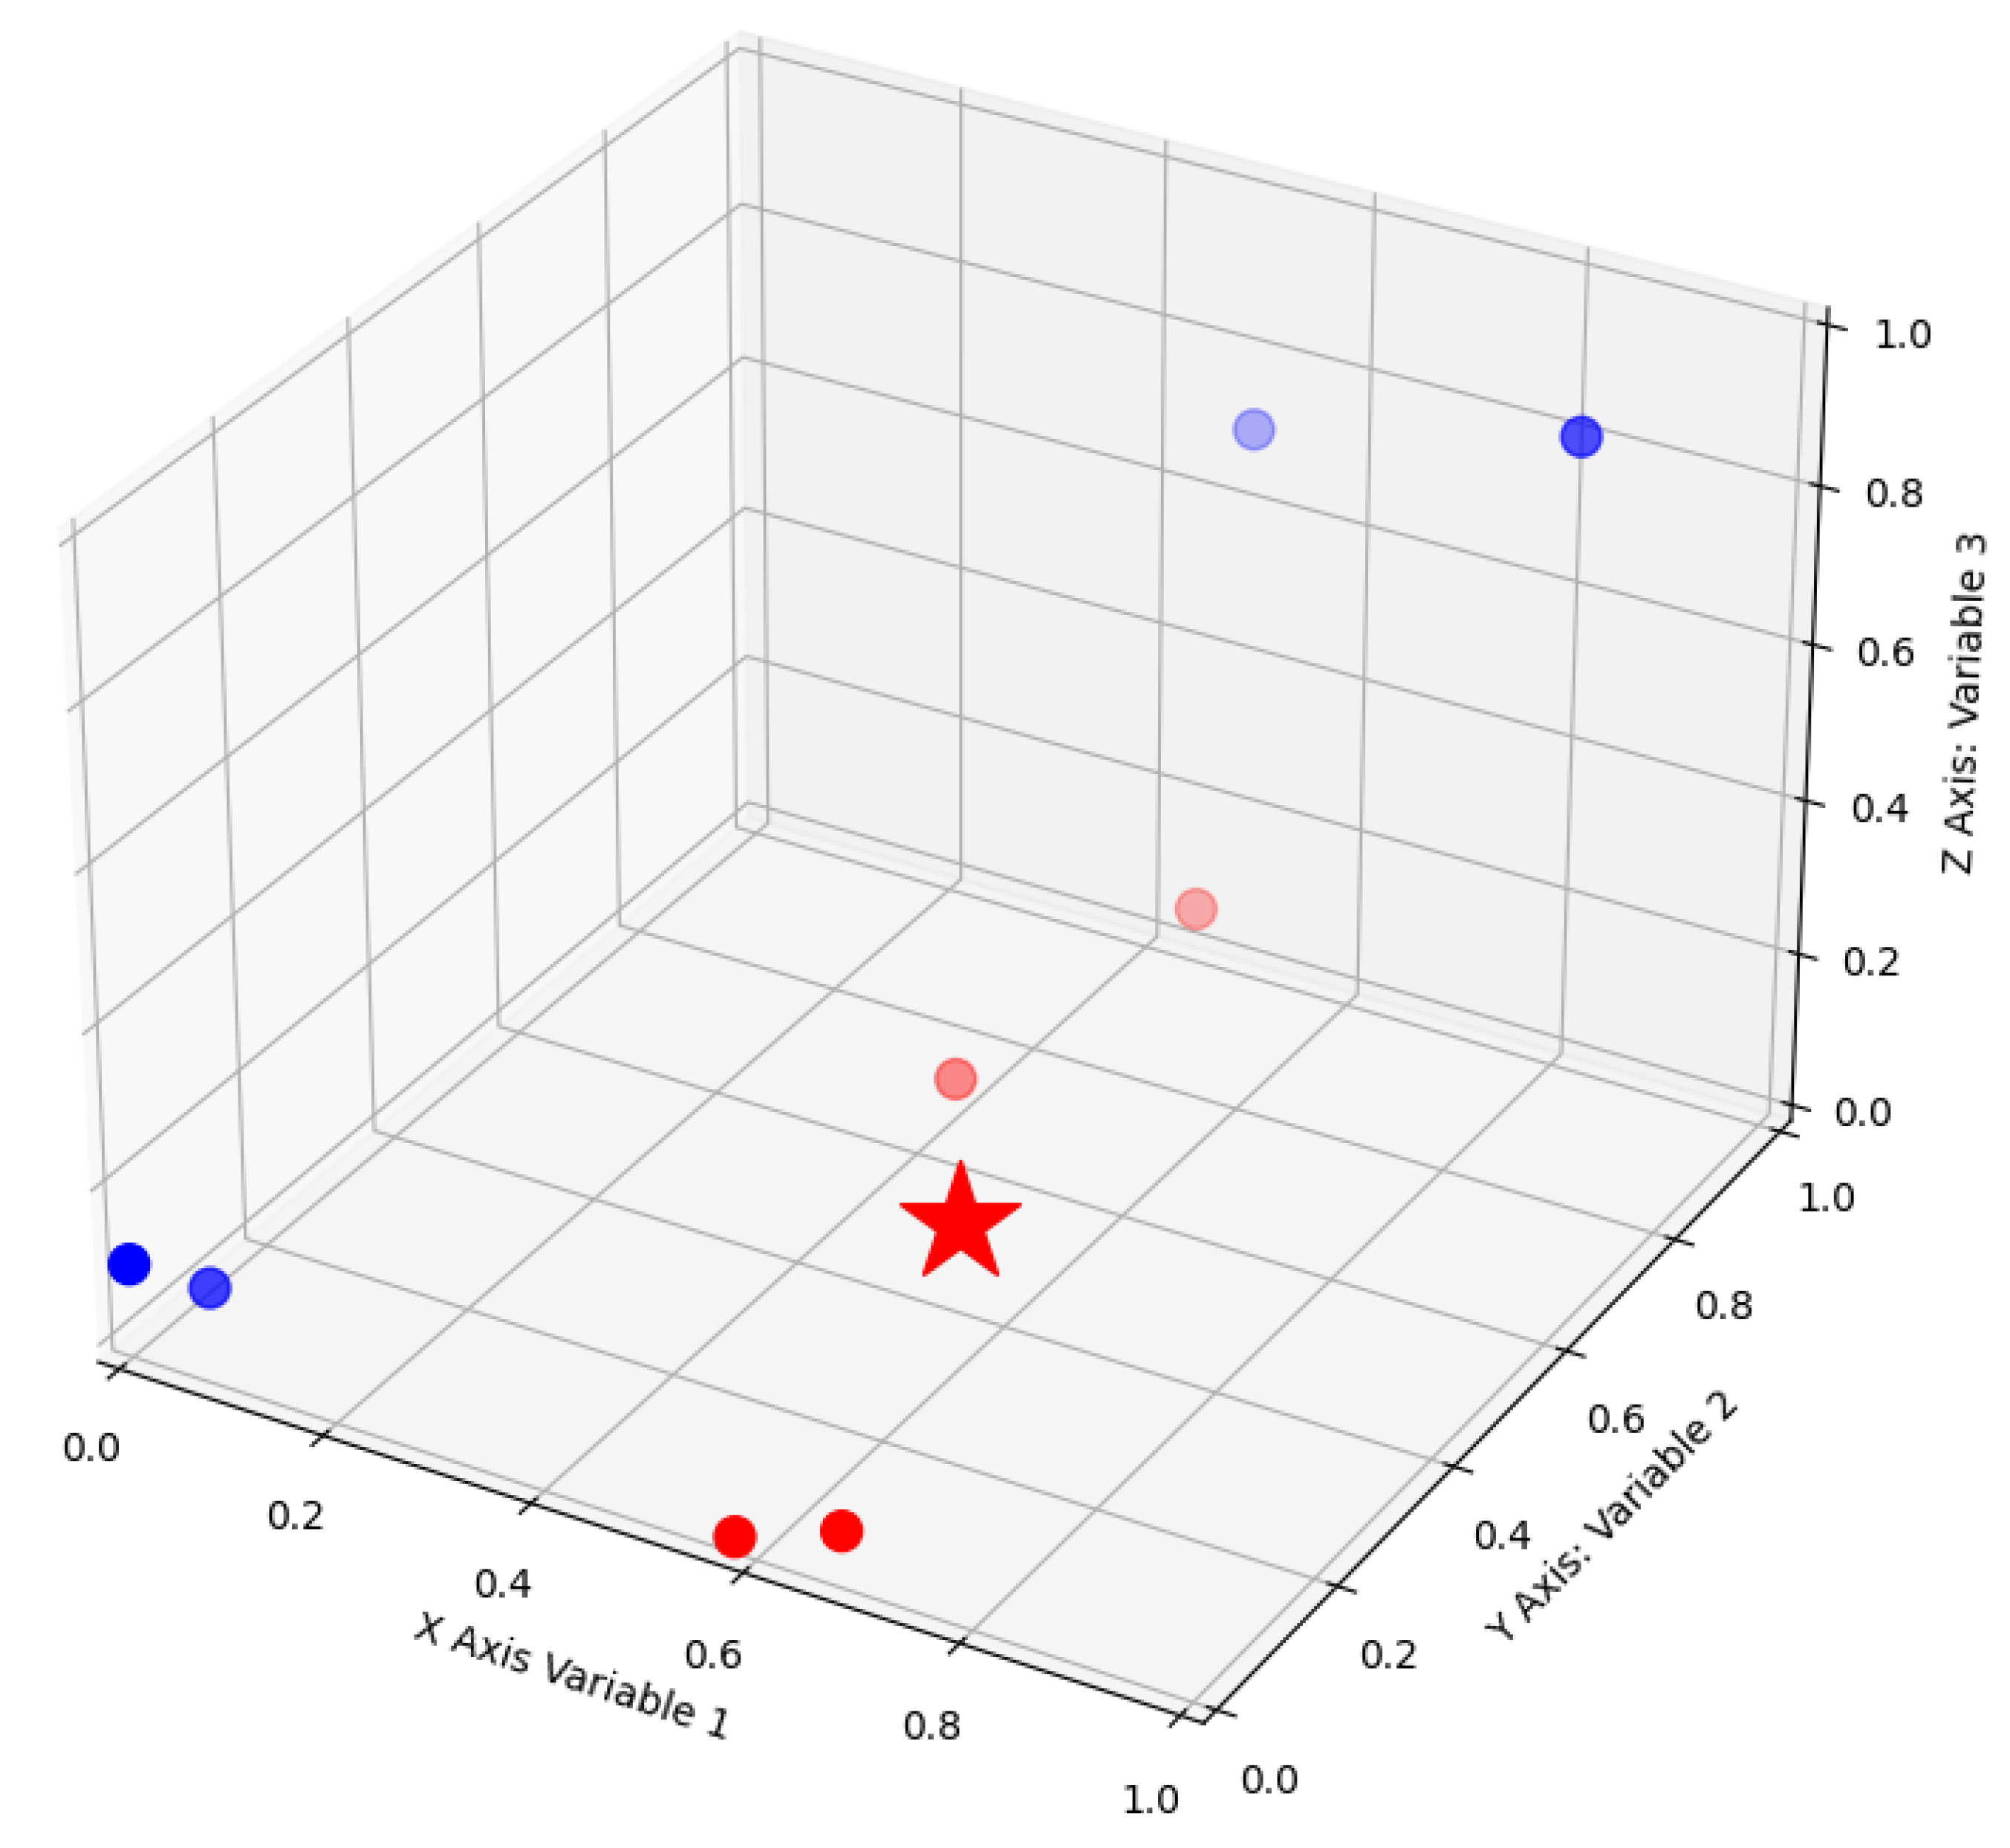
- (f)
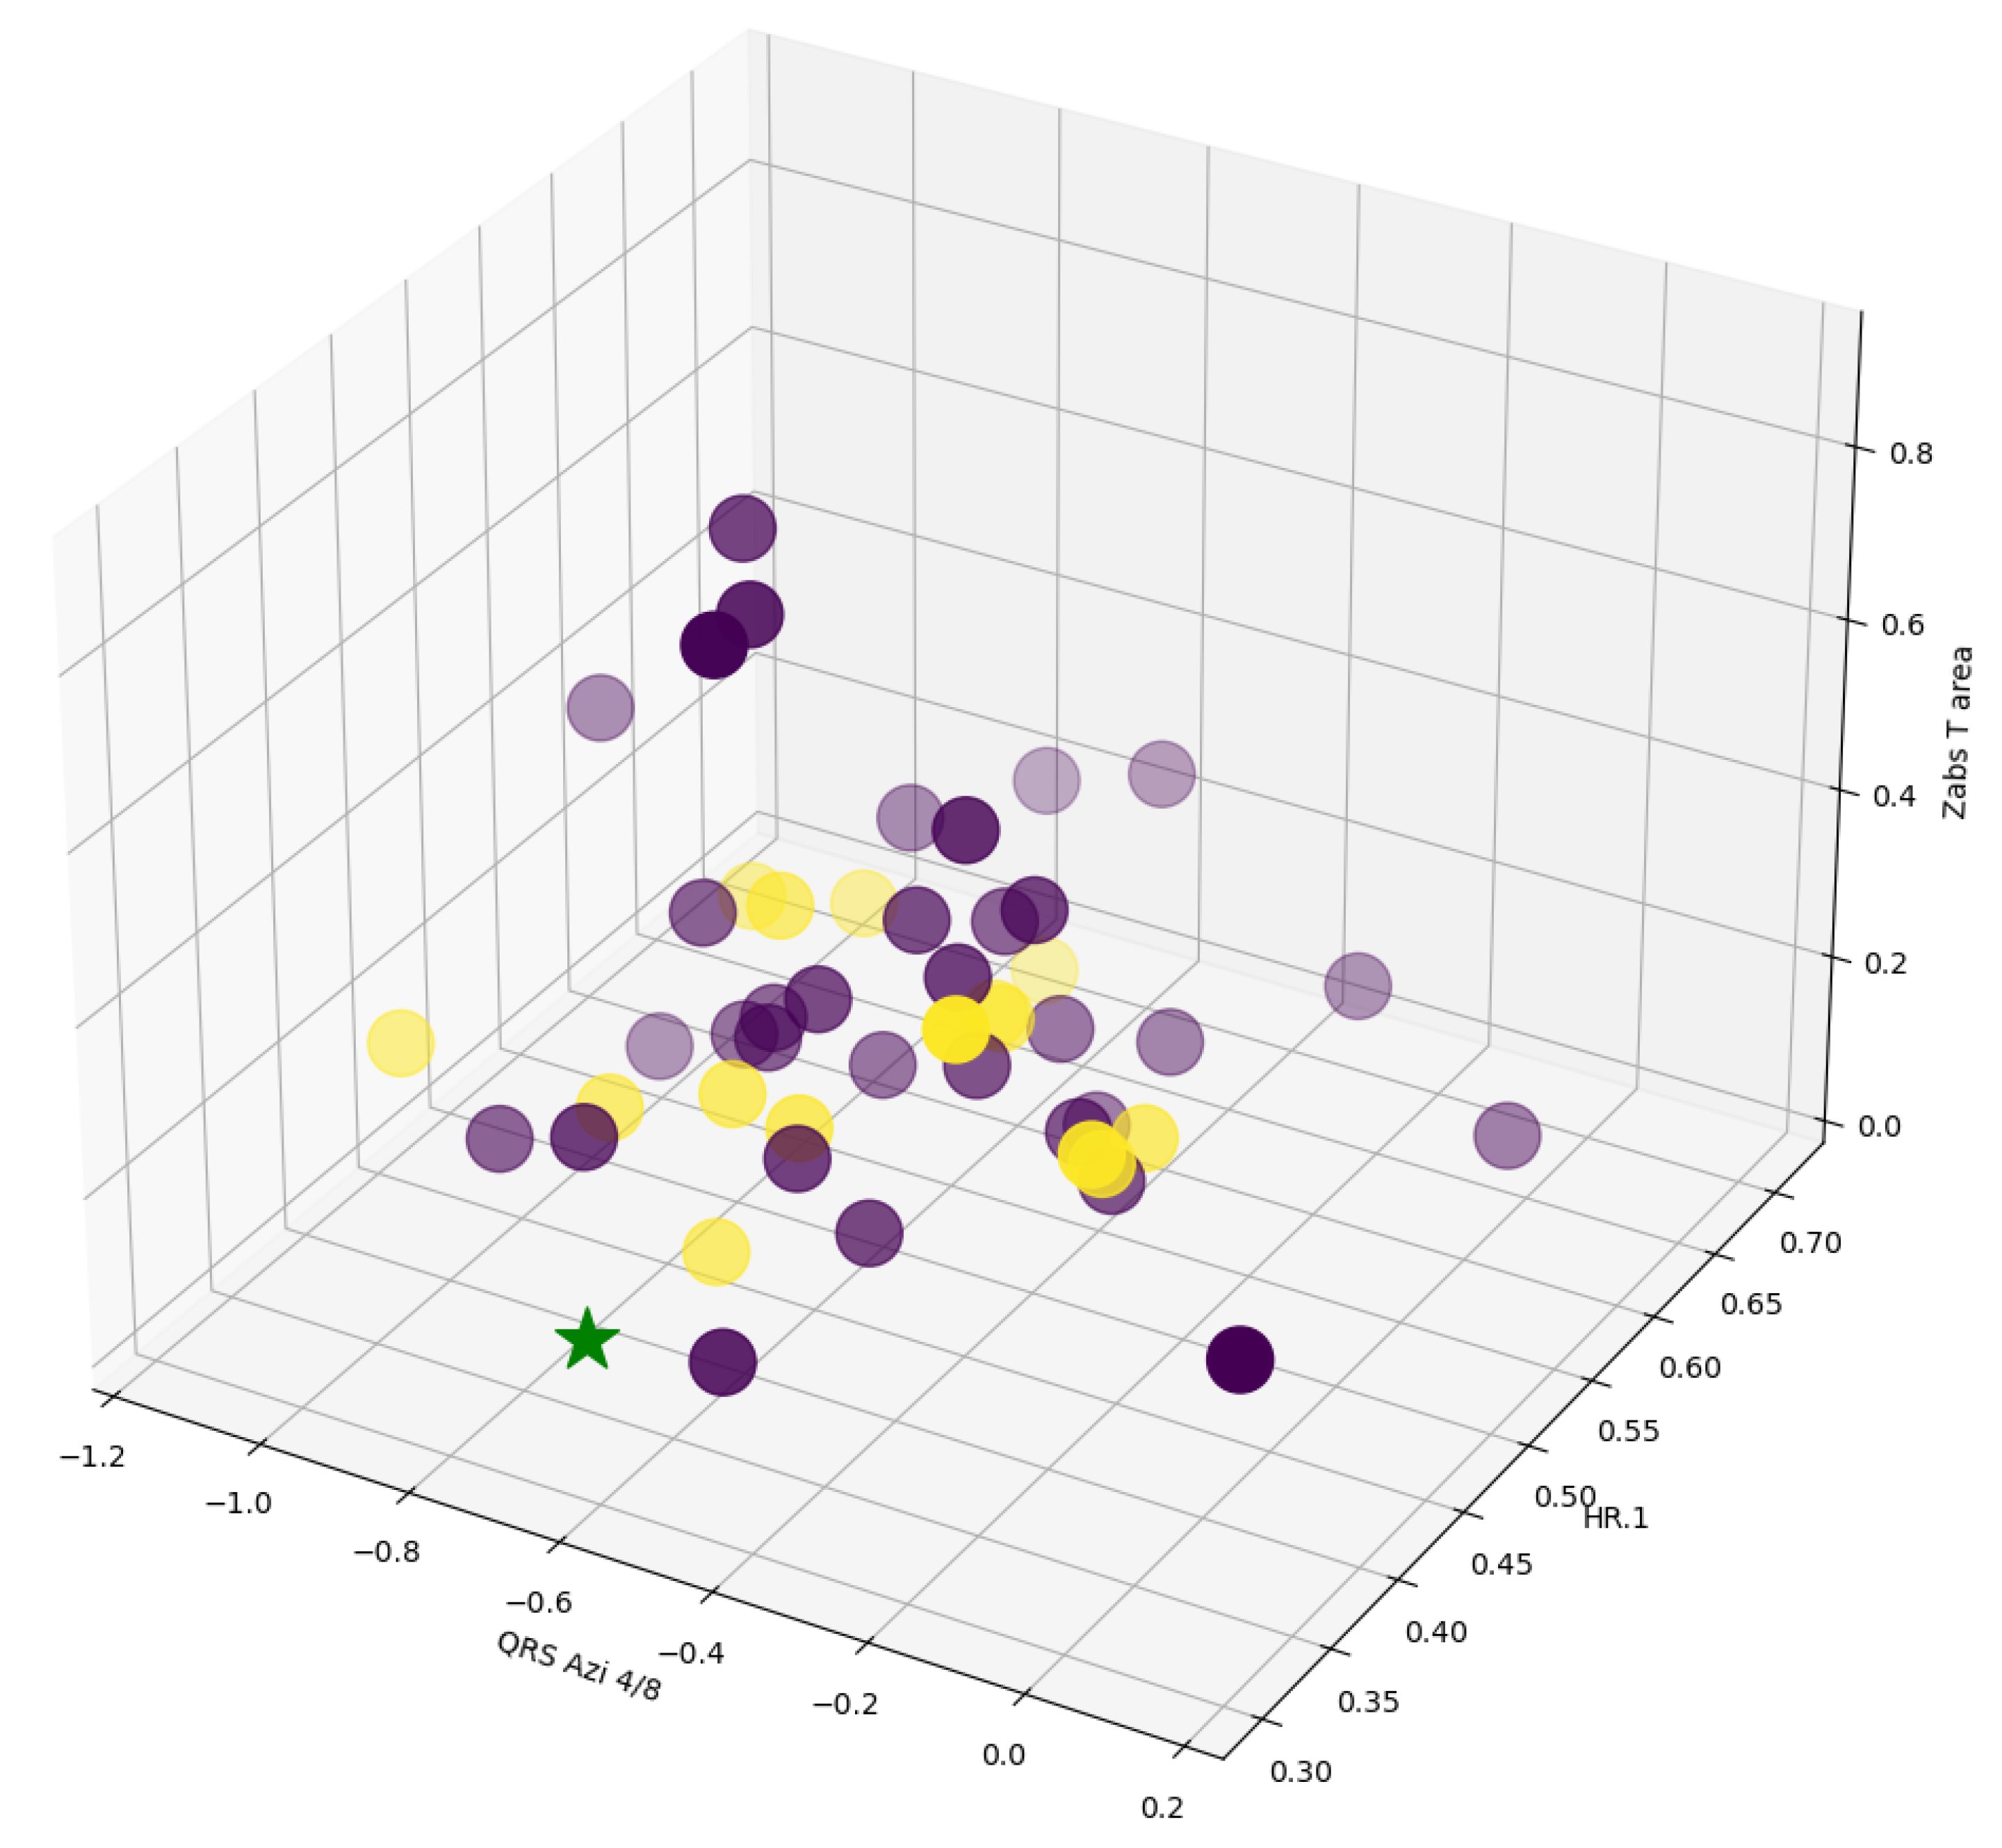
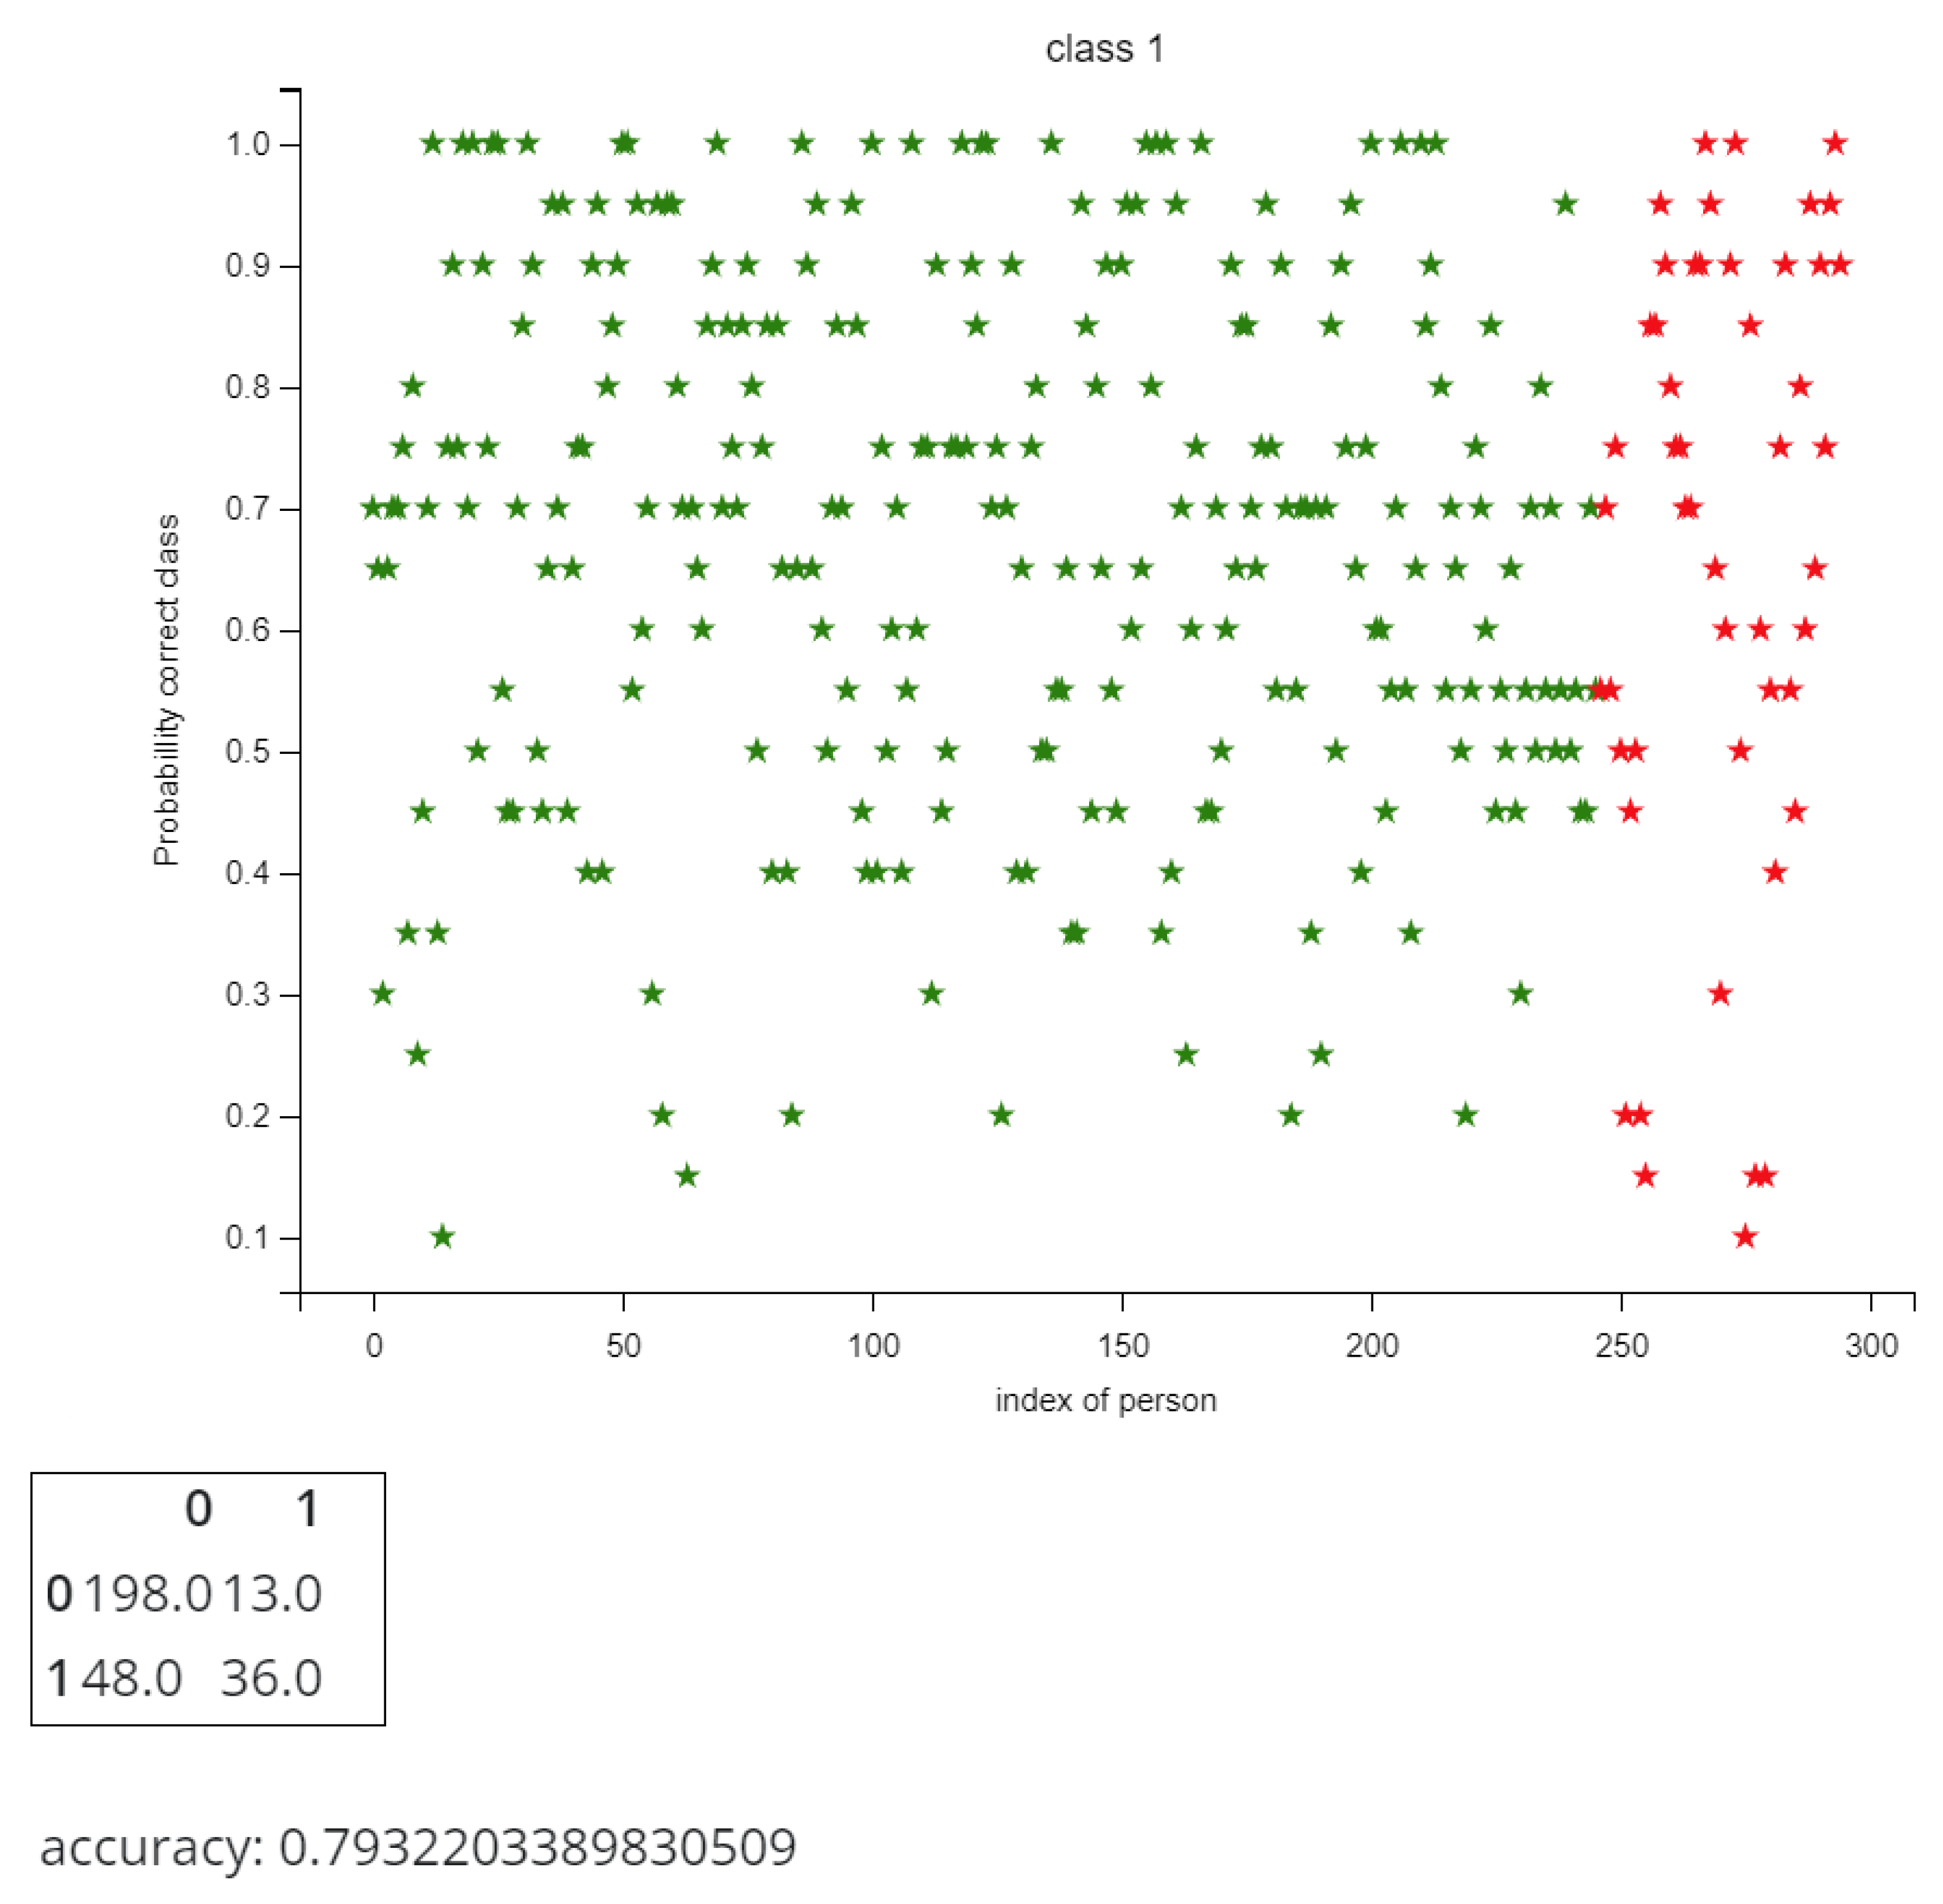
- Reporting and visualisation of results of the individual model Mx. This is illustrated in Figure 3.
5. Case Studies for Medical Diagnosis and Prognosis
5.1. Heart Disease Diagnosis
5.2. Time Series Classification
5.3. Predicting Longevity in Cardiac Patients
- Demographics, risk factors, disease states, medication, and deprivation scores;
- Echocardiography, cardiac ultrasound measurements;
- Advanced ECG measurements.
6. Discussion
7. Conclusions
- The method is suitable for multimodal data searches in heterogeneous datasets, e.g., numbers, text, images, sound, categorical data.
- It is suitable for personalised model creation to classify or predict specific outcomes based on multimodal and heterogeneous data.
- It uses a similarity measure based on multicriteria metrics. In this way, inaccurate measurement of similarity on a large number of heterogeneous variables is avoided.
- Its search is fast even on large datasets and includes advanced personalised searches with multiple parameters and features.
- It facilitates multiple solutions with corresponding probabilities.
- It is suitable for unsupervised clustering in multimodal heterogeneous data.
Author Contributions
Funding
Data Availability Statement
Acknowledgments
Conflicts of Interest
References
- Budhraja, S.; Singh, B.; Doborjeh, M.; Doborjeh, Z.; Tan, S.; Lai, E.; Goh, W.; Kasabov, N. Mosaic LSM: A Liquid State Machine Approach for Multimodal Longitudinal Data Analysis. In Proceedings of the 2023 International Joint Conference on Neural Networks (IJCNN), Gold Coast, QLD, Australia, 18–22 June 2023; IEEE: New York, NY, USA, 2023; pp. 1–8. [Google Scholar] [CrossRef]
- AbouHassan, I.; Kasabov, N.K.; Jagtap, V.; Kulkarni, P. Spiking neural networks for predictive and explainable modelling of multimodal streaming data with a case study on financial time series and online news. Sci. Rep. 2023, 13, 18367. [Google Scholar] [CrossRef] [PubMed]
- Rodrigues, F.; Markou, I.; Pereira, F.C. Combining time-series and textual data for taxi demand prediction in event areas: A deep learning approach. Inf. Fusion 2019, 49, 120–129. [Google Scholar] [CrossRef]
- Li, J.; Liu, J.; Zhou, S.; Zhang, Q.; Kasabov, N.K. GeSeNet: A General Semantic-Guided Network With Couple Mask Ensemble for Medical Image Fusion. IEEE Trans. Neural Netw. Learn. Syst. 2024, 35, 16248–16261. [Google Scholar] [CrossRef]
- Doborjeh, Z.; Doborjeh, M.; Sumich, A.; Singh, B.; Merkin, A.; Budhraja, S.; Goh, W.; Lai, E.M.; Williams, M.; Tan, S.; et al. Investigation of social and cognitive predictors in non-transition ultra-high-risk’individuals for psychosis using spiking neural networks. Schizophrenia 2023, 9, 10. [Google Scholar] [CrossRef]
- Kasabov, N.K. NeuCube: A spiking neural network architecture for mapping, learning and understanding of spatio-temporal brain data. Neural Netw. 2014, 52, 62–76. [Google Scholar] [CrossRef]
- Kasabov, N. Global, local and personalised modeling and pattern discovery in bioinformatics: An integrated approach. Pattern Recognit. Lett. 2007, 28, 673–685. [Google Scholar] [CrossRef]
- Kasabov, N. Data Analysis and Predictive Systems and Related Methodologies. U.S. Patent 9,002,682 B2, 7 April 2015. [Google Scholar]
- Doborjeh, M.; Doborjeh, Z.; Merkin, A.; Bahrami, H.; Sumich, A.; Krishnamurthi, R.; Medvedev, O.N.; Crook-Rumsey, M.; Morgan, C.; Kirk, I.; et al. Personalised predictive modelling with brain-inspired spiking neural networks of longitudinal MRI neuroimaging data and the case study of dementia. Neural Netw. 2021, 144, 522–539. [Google Scholar] [CrossRef]
- Kasabov, N.K. Evolving Connectionist Systems, 2nd ed.; Springer: London, UK, 2007. [Google Scholar]
- Kasabov, N.K. Time-Space, Spiking Neural Networks and Brain-Inspired Artificial Intelligence; Springer: Berlin/Heidelberg, Germany, 2019; Volume 750. [Google Scholar]
- Santomauro, D.F.; Herrera, A.M.M.; Shadid, J.; Zheng, P.; Ashbaugh, C.; Pigott, D.M.; Abbafati, C.; Adolph, C.; Amlag, J.O.; Aravkin, A.Y.; et al. Global prevalence and burden of depressive and anxiety disorders in 204 countries and territories in 2020 due to the COVID-19 pandemic Global prevalence and burden of depressive and anxiety disorders in 204 countries and territories in 2020 due to the COVID-19 pandemic. Lancet 2021, 398, 1700–1712. [Google Scholar]
- Swaddiwudhipong, N.; Whiteside, D.J.; Hezemans, F.H.; Street, D.; Rowe, J.B.; Rittman, T. Pre-diagnostic cognitive and functional impairment in multiple sporadic neurodegenerative diseases. bioRxiv 2022. [Google Scholar] [CrossRef]
- Kasabov, N.K.; Hou, Z.; Feigin, V.; Chen, Y. Improved Method and System for Predicting Outcomes Based on Spatio/Spectro-Temporal Data. 2015. Available online: https://patents.google.com/patent/WO2015030606A2/en (accessed on 20 December 2015).
- Paprotny, D.; Morales-Nápoles, O.; Worm, D.T.; Ragno, E. BANSHEE—A MATLAB toolbox for non-parametric Bayesian networks. SoftwareX 2020, 12, 100588. [Google Scholar] [CrossRef]
- Koot, P.; Mendoza-Lugo, M.A.; Paprotny, D.; Morales-Nápoles, O.; Ragno, E.; Worm, D.T. PyBanshee version (1.0): A Python implementation of the MATLAB toolbox BANSHEE for Non-Parametric Bayesian Networks with updated features. SoftwareX 2023, 21, 101279. [Google Scholar] [CrossRef]
- Mendoza-Lugo, M.A.; Morales-Nápoles, O. Version 1.3-BANSHEE—A MATLAB toolbox for Non-Parametric Bayesian Networks. SoftwareX 2023, 23, 101479. [Google Scholar] [CrossRef]
- Calude, C.; Calude, E. A metrical method for multicriteria decision making. St. Cerc. Mat 1982, 34, 223–234. [Google Scholar]
- Calude, C. A simple non-uniform operation. Bull. Eur. Assoc. Theor. Comput. Sci. 1983, 20, 40–46. [Google Scholar]
- Akhtarzada, A.; Calude, C.S.; Hosking, J. A Multi-Criteria Metric Algorithm for Recommender Systems. Fundam. Informaticae 2011, 110, 1–11. [Google Scholar] [CrossRef]
- Kahramanli, H.; Allahverdi, N. Design of a hybrid system for the diabetes and heart diseases. Expert Syst. Appl. 2008, 35, 82–89. [Google Scholar] [CrossRef]
- Gleeson, S.; Liao, Y.W.; Dugo, C.; Cave, A.; Zhou, L.; Ayar, Z.; Christiansen, J.; Scott, T.; Dawson, L.; Gavin, A.; et al. ECG-derived spatial QRS-T angle is associated with ICD implantation, mortality and heart failure admissions in patients with LV systolic dysfunction. PLoS ONE 2017, 12, e0171069. [Google Scholar] [CrossRef]
- Song, Q.; Kasabov, N. TWNFI–a transductive neuro-fuzzy inference system with weighted data normalization for personalized modeling. Neural Netw. 2006, 19, 1591–1596. [Google Scholar] [CrossRef]
- Song, Q.; Kasabov, N.K. NFI: A neuro-fuzzy inference method for transductive reasoning. IEEE Trans. Fuzzy Syst. 2005, 13, 799–808. [Google Scholar] [CrossRef]
- Sengupta, N.; McNabb, C.B.; Kasabov, N.; Russell, B.R. Integrating space, time, and orientation in spiking neural networks: A case study on multimodal brain data modeling. IEEE Trans. Neural Netw. Learn. Syst. 2018, 29, 5249–5263. [Google Scholar] [CrossRef]
- Kasabov, N. NeuCube EvoSpike Architecture for Spatio-temporal Modelling and Pattern Recognition of Brain Signals. In Artificial Neural Networks in Pattern Recognition; Springer: Berlin/Heidelberg, Germany, 2012; pp. 225–243. [Google Scholar] [CrossRef]
- Kumarasinghe, K.; Kasabov, N.; Taylor, D. Deep learning and deep knowledge representation in Spiking Neural Networks for Brain-Computer Interfaces. Neural Netw. 2020, 121, 169–185. [Google Scholar] [CrossRef]
- Futschik, M.; Kasabov, N. Fuzzy clustering of gene expression data. In Proceedings of the 2002 IEEE World Congress on Computational Intelligence, 2002 IEEE International Conference on Fuzzy Systems. FUZZ-IEEE’02. Proceedings (Cat. No.02CH37291), Honolulu, HI, USA, 12–17 May 2002; pp. 414–419. [Google Scholar] [CrossRef]

| Objects/Criteria | ... | ... | ||||
|---|---|---|---|---|---|---|
| ... | ... | |||||
| ⋮ | ⋮ | ⋮ | ... | ⋮ | ... | ⋮ |
| ... | ... | |||||
| ⋮ | ⋮ | ⋮ | ... | ⋮ | ... | ⋮ |
| ... | ... | |||||
| w | ... | ... |
| Objects/Criteria | ... | ... | Class Label | ||||
|---|---|---|---|---|---|---|---|
| ... | ... | ||||||
| ⋮ | ⋮ | ⋮ | ... | ⋮ | ... | ⋮ | ⋮ |
| ... | ... | ||||||
| ⋮ | ⋮ | ⋮ | ... | ⋮ | ... | ⋮ | ⋮ |
| ... | ... |
| Criteria Weights | ... | ... | ||||
|---|---|---|---|---|---|---|
| w | ... | ... |
| Object/Criteria | ... | ... | ||||
|---|---|---|---|---|---|---|
| x | ... | ... |
| Object/Criteria | ... | ... | Class Label | ||||
|---|---|---|---|---|---|---|---|
| ... | ... |
| 68.2 | 0 | 6789 | 0 | FF0000 | 0122110012 | 110001001 | 1 | |
| 111111110000000000000000 | ||||||||
| 93 | 0 | 98,000 | 1 | FFFF00 | 0222200121 | 110001001 | 1 | |
| 111111111111111100000000 | ||||||||
| 44.5 | 1 | 5600 | 2 | FF0000 | 0121210012 | 110101111 | 1 | |
| 111111110000000000000000 | ||||||||
| 56.8 | 0 | 89 | 0 | FFFFFF | 1222210012 | 110011101 | 1 | |
| 111111111111111111111111 | ||||||||
| 26.3 | 0 | 9456 | 2 | 000000 | 1222010012 | 110111101 | 2 | |
| 000000000000000000000000 | ||||||||
| 81.5 | 1 | 78,955 | 1 | FF0000 | 0121220012 | 110001111 | 2 | |
| 111111110000000000000000 | ||||||||
| 56.7 | 1 | 68,900 | 0 | 000000 | 1221210011 | 111001111 | 2 | |
| 000000000000000000000000 | ||||||||
| 20 | 0 | 7833 | 2 | FFFF00 | 1122110221 | 100001111 | 2 | |
| 111111111111111100000000 | ||||||||
| 20 | 0 | 7833 | ∞ | FFFF00 | 1122110221 | 100001111 | 2 | |
| 111111111111111100000000 | ||||||||
| x | 48.5 | 1 | 45,679 | 2 | FF0000 | 1002121001 | 110001101 |
| 111111110000000000000000 | |||||||
| 0.682 | 0 | 0.06789 | 0 | 0.2 | 0.0122110012 | 0.110001001 | |
| 0.93 | 1 | 0.98 | 0.5 | 0.6 | 0.0222200121 | 0.100001001 | |
| 0.445 | 1 | 0.056 | 1 | 0.2 | 0.0121210012 | 0.110101111 | |
| 0.568 | 0 | 0.00089 | 0 | 1 | 0.1222210012 | 0.110011101 | |
| 0.263 | 0 | 0.09456 | 1 | 0 | 0.1222010012 | 0.110111101 | |
| 0.815 | 1 | 0.78955 | 0.5 | 0.2 | 0.0121220012 | 0.110001111 | |
| 0.567 | 1 | 0.689 | 0 | 0 | 0.1221210011 | 0.111001111 | |
| 0.2 | 0 | 0.07833 | 1 | 0.6 | 0.1122110221 | 0.100001111 | |
| 0.2 | 0 | 0.07833 | ∞ | 0.6 | 0.1122110221 | 0.100001111 |
| x | 0.485 | 1 | 0.45679 | 1 | 0.2 | 0.1002121001 | 0.110001101 |
| 0.197 | 1 | 0.3889 | 1 | 0 | 0.4 | 0.11111111 | 3.09701111 | |
| 0.445 | 0 | 0.52321 | 0.5 | 0.33333333 | 0.6 | 0.22222222 | 2.62376556 | |
| 0.04 | 0 | 0.40079 | 0 | 0 | 0.5 | 0.22222222 | 1.16301222 | |
| 0.083 | 1 | 0.4559 | 1 | 0.66666667 | 0.45 | 0.11111111 | 3.76667778 | |
| 0.222 | 1 | 0.36223 | 0 | 0.33333333 | 0.45 | 0.22222222 | 2.58978556 | |
| 0.33 | 0 | 0.33276 | 0.5 | 0 | 0.45 | 0.11111111 | 1.72387111 | |
| 0.082 | 0 | 0.23221 | 1 | 0.33333333 | 0.45 | 0.22222222 | 2.31976556 | |
| 0.285 | 1 | 0.37846 | 0 | 0.33333333 | 0.45 | 0.22222222 | 2.66901556 | |
| 0.285 | 1 | 0.37846 | 1 | 0.33333333 | 0.45 | 0.22222222 | 3.66901556 |
| 0.04 | 0 | 0.40079 | 0 | 0 | 0.5 | 0.22222222 | 1.16301222 | |
| 0.33 | 0 | 0.33276 | 0.5 | 0 | 0.45 | 0.11111111 | 1.72387111 | |
| 0.082 | 0 | 0.23221 | 1 | 0.33333333 | 0.45 | 0.22222222 | 2.31976556 | |
| 0.222 | 1 | 0.36223 | 0 | 0.33333333 | 0.45 | 0.22222222 | 2.58978556 | |
| 0.445 | 0 | 0.52321 | 0.5 | 0.33333333 | 0.6 | 0.22222222 | 2.62376556 | |
| 0.285 | 1 | 0.37846 | 0 | 0.33333333 | 0.45 | 0.22222222 | 2.66901556 | |
| 0.197 | 1 | 0.3889 | 1 | 0 | 0.4 | 0.11111111 | 3.09701111 | |
| 0.285 | 1 | 0.37846 | 1 | 0.33333333 | 0.45 | 0.22222222 | 3.66901556 | |
| 0.083 | 1 | 0.4559 | 1 | 0.66666667 | 0.45 | 0.11111111 | 3.76667778 |
| 0.2 | 0 | 0.00089 | 0 | 1 | 0.1222210012 | 0.100001001 |
| 1.469 | 0.987 | 1.469 | 1.402 | 1.469 | 0.669 | 1.359 | 1.459 |
| 3.709 | 2.979 | 2.709 | 2.730 | 3.209 | 3.309 | 3.609 | 3.709 |
| 3.220 | 2.975 | 2.220 | 3.165 | 2.220 | 2.420 | 3.110 | 3.210 |
| 0.378 | 0.010 | 0.378 | 0.378 | 0.378 | 0.378 | 0.378 | 0.368 |
| 2.167 | 2.104 | 2.167 | 2.073 | 1.167 | 1.167 | 2.167 | 2.157 |
| 3.824 | 3.209 | 2.824 | 3.035 | 3.324 | 3.024 | 3.714 | 3.814 |
| 3.066 | 2.699 | 2.066 | 2.378 | 3.066 | 2.066 | 3.066 | 3.055 |
| 1.487 | 1.487 | 1.487 | 1.410 | 0.487 | 1.087 | 1.477 | 1.487 |
| 1.487 | 1.487 | 1.487 | 1.410 | 0.487 | 1.087 | 1.477 | 1.487 |
| Distances | 2.870 | 4.00 | 2.826 | 5.00 | 5.60 | 0.450 | 0.061 |
| Weights | 0.137 | 0.192 | 0.135 | 0.240 | 0.269 | 0.021 | 0.002 |
| Patients/Criteria | ... | ... | Units of Time | ||||
|---|---|---|---|---|---|---|---|
| ... | ... | ||||||
| ⋮ | ⋮ | ⋮ | ... | ⋮ | ... | ⋮ | ⋮ |
| ... | ... | ||||||
| ⋮ | ⋮ | ⋮ | ... | ⋮ | ... | ⋮ | ⋮ |
| ... | ... |
| Patient/Criteria | ... | ... | ||||
|---|---|---|---|---|---|---|
| p | ... | ... |
| Patients | Units of Time | |||||||
| 0.682 | 0 | 0.06789 | 0 | 0.2 | 0.012211001 | 0.110001001 | 12.3 | |
| 0.93 | 1 | 0.98 | 0.5 | 0.6 | 0.022220012 | 0.100001001 | 15 | |
| 0.445 | 1 | 0.056 | 1 | 0.2 | 0.012121001 | 0.110101111 | 68 | |
| 0.568 | 0 | 0.00089 | 0 | 1 | 0.122221001 | 0.110011101 | 1.4 | |
| 0.263 | 0 | 0.09456 | 1 | 0 | 0.122201001 | 0.110111101 | 40.5 | |
| 0.815 | 1 | 0.78955 | 0.5 | 0.2 | 0.012122001 | 0.110001111 | 97.2 | |
| 0.567 | 1 | 0.689 | 0 | 0 | 0.122121001 | 0.111001111 | 97.2 | |
| 0.2 | 0 | 0.07833 | 1 | 0.6 | 0.112211022 | 0.100001111 | 55.7 | |
| 0.2 | 0 | 0.07833 | ∞ | 0.6 | 0.112211022 | 0.100001111 | 63.7 |
| 0.485 | 1 | 0.45679 | 1 | 0.2 | 0.1002121001 | 0.110001101 |
| Distance d | ||||||||
|---|---|---|---|---|---|---|---|---|
| 0.1970 | 1 | 0.388900 | 1.0 | 0.0 | 0.08800109890 | 0.000000100 | 2.67390119890 | |
| 0.4450 | 0 | 0.523210 | 0.5 | 0.4 | 0.07799208800 | 0.010000100 | 1.95620218800 | |
| 0.0400 | 0 | 0.400790 | 0.0 | 0.0 | 0.08809109890 | 0.000100010 | 0.52898110890 | |
| 0.0830 | 1 | 0.455900 | 1.0 | 0.8 | 0.02200890110 | 0.000010000 | 3.36091890110 | |
| 0.2220 | 1 | 0.362230 | 0.0 | 0.2 | 0.02198890110 | 0.000110000 | 1.80632890110 | |
| 0.3300 | 0 | 0.332760 | 0.5 | 0.0 | 0.08809009890 | 0.000000010 | 1.25085010890 | |
| 0.0820 | 0 | 0.232210 | 1.0 | 0.2 | 0.02190890100 | 0.001000010 | 1.53711891100 | |
| 0.2850 | 1 | 0.378460 | 0.0 | 0.4 | 0.01199892200 | 0.009999990 | 2.08545891200 | |
| 0.2850 | 1 | 0.378460 | 1.0 | 0.4 | 0.01199892200 | 0.009999990 | 3.08545891200 |
| Name | Data Type | Definition |
|---|---|---|
| age | integer | age in years |
| sex | binary | sex |
| cp | {1,2,3,4} | chest pain type |
| trestbps | integer | resting blood pressure |
| chol | integer | serum cholesterol in mg/dL |
| fbs | binary | fasting blood sugar > 120 mg/d |
| restecg | {0,1,2} | resting electrocardiographic results |
| thalach | integer | maximum heart rate achieved |
| exang | binary | exercise-induced angina |
| oldpeak | float | ST depression induced by exercise relative to rest |
| slope | {1,2,3} | the slope of the peak exercise ST segment |
| ca | {0,1,2,3 } | number of major vessels colored by flourosopy |
| thal | {3,6,7} | heart status |
| num | {0,1,2,3,4} | diagnosis of heart disease |
| Record | Channel 1 | Channel 2 | Channel 3 | Label |
|---|---|---|---|---|
| R1 | (1, 1, −1, 0, 1) | (0, 1, 1, 1, −1) | (1, 1, −1, −1, 0) | 1 |
| R2 | (1, 0, −1, 0, 1) | ( 0, 1, 1, 1, −1) | (1, 0, −1, −1, 1 ) | 1 |
| R3 | (1, 1, −1, 0, 1) | (0, −1, 1, 1, −1) | (1, 1, −1, 0, 1) | 2 |
| R4 | (1, 1, −1, 0, 1) | (0, −1, 1, 0, −1) | (1, 1, −1, 0, 1) | 2 |
| R5 | (1, 1, −1, 0, 0) | (0, −1, 0, 1, −1) | (1, 1, −1, 1, 1) | 3 |
| R6 | (1, −1, −1, 0, 1) | (0, −1, 1, 0, −1) | (1, 1, −1, 0, 1) | 3 |
| Source | Number of Modalities | Number of Metrics | Types of Data Sets | Type of Integration Explainability | Explainability | Machine Learning Method |
|---|---|---|---|---|---|---|
| [1] | 3 | 1 | Longitudinal time series data | Late | No | Liquid Sate Machine |
| [2] | 2 | 1 | Time series; on-line text | Early | Reveals the impact of news on time series | SNN |
| [3] | 2 | 1 | Time series; on-line text | Late | No | DeepNN |
| [4] | 3 | 1 | Brain images – pixel values | Early | Moderate | Deep NN |
| [5] | 2 | 1 | Social and cognitive data as numbers | Early | Feature interaction network | SNN |
| [6] | 2 | 1 | Time and space | Early | Feature interaction network. | SNN |
| [9,14] | 3 | 1 | Personalised vector data of numbers; Time and space | Preliminary selection | Reveals feature interaction over time | SNN |
| [23,24] | 1 | 1 | Numerical vector-based data | No integration | Extracted fuzzy rules | Fuzzy neural networks |
| [25] | 3 | 1 | Time, space and direction: fMRI + DTI data | Early | Feature interaction network | SNN |
| This paper—SAIN | Multiple, practically unlimited | Multiple, multicriteria metrics | Multiple, practically unlimited | Early | Visualisation and interpretation of personalised model | Statistical: search and inference using wwkNN |
Disclaimer/Publisher’s Note: The statements, opinions and data contained in all publications are solely those of the individual author(s) and contributor(s) and not of MDPI and/or the editor(s). MDPI and/or the editor(s) disclaim responsibility for any injury to people or property resulting from any ideas, methods, instructions or products referred to in the content. |
© 2025 by the authors. Licensee MDPI, Basel, Switzerland. This article is an open access article distributed under the terms and conditions of the Creative Commons Attribution (CC BY) license (https://creativecommons.org/licenses/by/4.0/).
Share and Cite
Calude, C.S.; Gladding, P.; Henderson, A.; Kasabov, N. SAIN: Search-And-INfer, a Mathematical and Computational Framework for Personalised Multimodal Data Modelling with Applications in Healthcare. Algorithms 2025, 18, 605. https://doi.org/10.3390/a18100605
Calude CS, Gladding P, Henderson A, Kasabov N. SAIN: Search-And-INfer, a Mathematical and Computational Framework for Personalised Multimodal Data Modelling with Applications in Healthcare. Algorithms. 2025; 18(10):605. https://doi.org/10.3390/a18100605
Chicago/Turabian StyleCalude, Cristian S., Patrick Gladding, Alec Henderson, and Nikola Kasabov. 2025. "SAIN: Search-And-INfer, a Mathematical and Computational Framework for Personalised Multimodal Data Modelling with Applications in Healthcare" Algorithms 18, no. 10: 605. https://doi.org/10.3390/a18100605
APA StyleCalude, C. S., Gladding, P., Henderson, A., & Kasabov, N. (2025). SAIN: Search-And-INfer, a Mathematical and Computational Framework for Personalised Multimodal Data Modelling with Applications in Healthcare. Algorithms, 18(10), 605. https://doi.org/10.3390/a18100605


