1. Introduction
With the acceleration of urbanization, the construction of buildings in coastal and lake areas has also increased. The excavated soil from the foundation pit during new construction projects in the areas around the lake is usually classified as waste soft clay [
1,
2]. This type of soil is often gray in color, has a high moisture content, usually exceeding 40%, and a void ratio generally between 1.0 and 2.0. Due to its characteristics of high moisture content and large void ratio, the mechanical properties of soft clay exhibit significant features of low strength and high compressibility [
3]. More than 80% of the waste soil in our country is disposed of by stacking, a method that not only occupies a large amount of land resources but may also lead to environmental issues, such as groundwater pollution or damage to surface vegetation [
4]. In this context, the treatment of soft clay is particularly necessary in order to achieve the goal of its reuse.
In both domestic and international contexts, the reuse of soft clay in engineering construction has achieved certain results. For soft clay that has not been contaminated by harmful foreign ions (e.g., lead), it usually only contains organic matter (e.g., humic acid) that affects the properties of the soft clay. When the organic matter content is below 5% [
5], prefabricated piles can be made for foundation reinforcement by mixing soft clay with curing agents (e.g., cement, quicklime, ground granulated blast-furnace slag, and silica fume), using stirring equipment [
6]. For soft clay with organic matter content higher than 5%, it is necessary to use more effective curing agents (such as calcareous fly ash, silica fume, pozzolanic additives, and NaOH) and mix the curing agents with the clay, using deep mixing equipment to form deep mixing piles, thereby achieving their effective application in engineering construction [
7]. These practical applications show that the performance of road subgrade can be effectively enhanced by combining curing agents with the soft clay to provide better engineering characteristics.
Traditionally, ordinary Portland cement (OPC) has been mixed with soft clay to increase the overall strength of the mixture [
8,
9]. In the process of producing cement, a large amount of greenhouse gas carbon dioxide is emitted, with nearly 900 kg of carbon dioxide emitted for every 1000 kg of cement produced [
10]. In 2023, China’s industrial solid waste generation reached 4.28 billion tons, with a comprehensive utilization amount of 2.57 billion tons, resulting in a utilization rate of only 60% [
11]. Therefore, it is particularly necessary to conduct research on the resource utilization of waste clay and industrial solid waste. Industrial by-products such as fly ash, silica fume, and granulated blast furnace slag (GBFS) can be used as environmentally friendly materials to replace OPC in soil-stabilization projects [
7]. GBFS is a by-product generated during the iron-making process in a blast furnace [
12]. Its primary chemical composition includes calcium oxide, silicon dioxide, and aluminum oxide, which closely resemble the oxide composition of OPC.
To improve the utilization of GBFS, research shows that activating GBFS in an alkali environment can effectively enhance its performance as a binding material. This alkali activation not only promotes the hydration reaction of GBFS but also improves its application effects in soil improvement [
13,
14]. OPC [
15,
16], alkali slag [
17], and lime [
18,
19] can be used as effective activators for GBFS. These alkaline substances can stimulate the activity of the GBFS, generating gel substances that bond soil particles and provide structural support for the clay, thereby significantly enhancing the overall strength of the clay. Active magnesium oxide (MgO) releases hydroxide ions (OH
−) during the hydration process to increase the environmental alkalinity, which promotes the hydration reaction of GBFS and enhances its bond performance [
20,
21]. The production process of cement and lime is accompanied by the emission of carbon dioxide, which has adverse effects on the environment [
15,
18]. Industrial by-product alkali slag has a high pH value (usually above 12), and the combination of alkali slag with GBFS used to treat clay can lead to an increase in the alkalinity of the clay environment [
17]. The pH value of industrial magnesium oxide was usually 10.56, which was the result of laboratory measurements. Therefore, from the perspective of environmental impact, the selection of magnesium oxide as the alkaline exciter of GBFS among OPC, alkali slag, lime, and MgO can effectively reduce the negative impact on the environment. Adding different curing materials to the clay leads to differences in the performance of the solidified clay, which remains to be further explored.
To improve the compressive strength and deformation characteristics of solidified clay, adjusting the amount of curing materials and increasing the reinforcement material is considered an effective method [
5]. On the one hand, the curing materials composed of two or more types of materials are used to solidify clay, and their mass usually accounts for 15% of the dry soil mass [
22]. An insufficient quantity of curing materials results in low strength of the solidified clay, whereas an excessive amount can lead to a susceptibility to brittle failure [
23,
24]. On the other hand, adding an appropriate amount of fibers to stabilized soil can effectively improve its brittle failure characteristics and inhibit the further development of shear failure cracks [
25,
26]. Basalt fiber (BF) is a filamentous mineral mixture made from natural basalt ores at high temperatures. Compared with other synthetic fibers, it has high surface roughness, tensile strength, and deformation modulus, as well as a certain degree of degradation [
27]. BF is recognized as a high-performance reinforcement material and has been increasingly utilized in the field of soil reinforcement [
28]. However, there is limited research on the use of BF as a reinforcement material, as well as on the application of GBFS and MgO as bonding materials for the solidification of soft clay. If curing materials consisting of GBFS, MgO, and BF are used to stabilize clay, what differences in mechanical properties are exhibited compared to using cement alone as a curing material? To fully utilize the roles of BF, GBFS, and MgO in the curing materials, it is crucial to optimize their quality ratios using scientific methods.
This study proposes the use of GBFS and MgO as curing materials and BF as reinforcement material to jointly solidify soft clay. The experimental design was carried out using the central composite design in response surface methodology, optimizing the mass ratio of GBFS, MgO, and BF, resulting in a curing material named GMBF. The unconfined compressive strength (UCS) test, water stability test, freeze–thaw cycle test, X-ray diffraction (XRD) test, and scanning electron microscopy (SEM) test were performed on GMBF solidified clay. These tests aim to clarify the mechanical properties, durability, and hydration products of GMBF solidified clay. This study optimized the ratio of GBFS, MgO, and BF to provide solutions for treating soft clay and reusing GBFS.
2. Experimental Materials and Methods
2.1. Experimental Materials
2.1.1. Soft Clay and Curing Materials
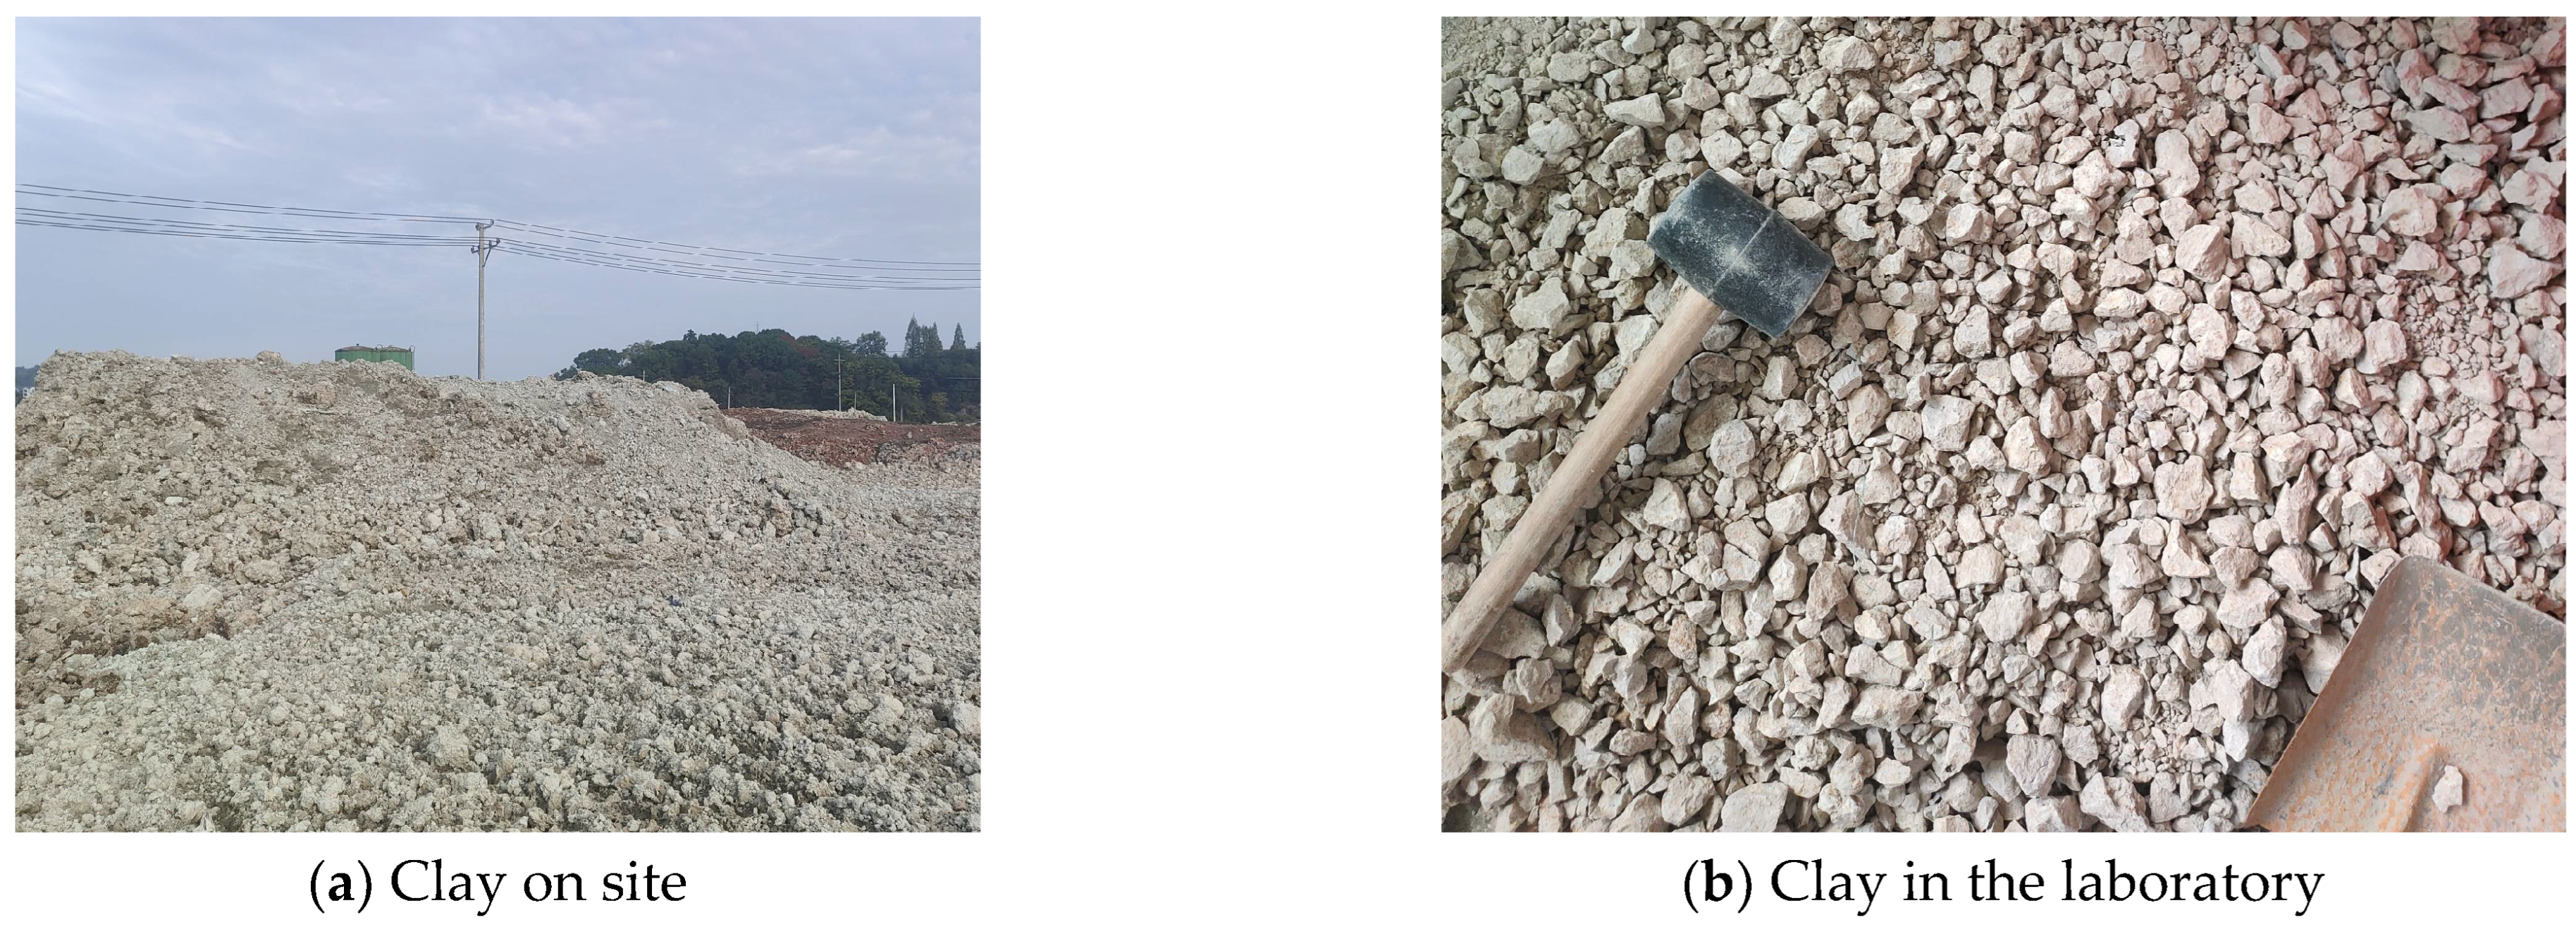
The soft clay (SC) used in this study was obtained from the excavated soil of a foundation pit in Hangzhou, Zhejiang Province, China, as shown in
Figure 1. The basic physical indexes of this clay are shown in
Table 1. According to the Chinese Standard for GB/T 50123-2019 standard [
29], the natural density (
p) of the clay was determined by the ring knife method; the plastic limits (
wP) and liquid limit (
wL) of the clay were determined by the liquid and plastic limit water content joint measurement method; the optimum moisture content and maximum dry density were obtained by a heavy compaction test; and the specific gravity (
Gs) of the clay was determined using the specific gravity bottle method. The plasticity index (
Ip) was the difference between the
wL and the
wP, and
Ip was 19.9. The clay used in this study was defined as low-liquid-limit clay (CL) because the
wL was less than 50% and the
Ip was greater than 0.73 × (
wL − 20) [
30]. The void ratio of clay is calculated by Equation (1). The void ratio of the clay was 1.47, and clay with a void ratio greater than 1 was considered to be highly compressible clay. According to ASTM D2974-14 [
31], the loss on ignition (LOI) of the soft clay was measured to be 4.6%, which can be used to characterize the organic matter content.
where
e is the void ratio of clay,
Gs is the specific gravity of clay,
pw is the density of water,
w is the natural moisture content of clay, and
p is the natural density of clay.
GBFS and MgO were purchased from Lingshou County Shiyun Mining Products Co., Ltd., which is located in Shijiazhuang City, Hebei Province, China. The 42.5# OPC was purchased from the Building Materials Market, which is located in Xi’an, Shaanxi Province, China. The appearance of SC, GBFS, MgO, and OPC, as well as their microscopic morphology taken by scanning electron microscopy, is shown in
Figure 2. As shown in
Figure 2a, the appearances of SC, GBFS, MgO, and OPC were light yellow particles, light gray particles, white particles, and dark gray particles, respectively. As illustrated in
Figure 2b, SC particles exhibited irregular polygonal shapes, and their surfaces were rough; GBFS particles exhibited an irregular shape yet possessed a smooth surface; MgO particles exhibited an oval shape characterized by an uneven and rough surface; and OPC particles exhibited irregular shapes with rougher surface characteristics. SC, GBFS, MgO, and OPC were present in particulate form, and no linkages were formed between the particles. It is worth noting that the grade of GBFS belongs to S105, which meets the Chinese standard GB/T 18046-2017 [
32]. Active MgO is of industrial grade, with a purity of 98%. The OPC meets the requirements of Chinese test standard GB 175-2023 [
33], as illustrated in
Table 2. The test data indicate that this OPC fully meets national standards, providing reliable data support for its use as a control-group material. The chemical composition and content of the SC, GBFS, MgO, and OPC were measured by an X-ray fluorescence (XRF) spectrometer, as presented in
Table 3. The chemical composition of the SC included Al
2O
3 and SiO
2, while GBFS was predominantly composed of CaO, which released Ca
2+. Additionally, MgO primarily released OH
− through hydrolysis (MgO + H
2O → Mg
2+ + 2OH
−). These ions interact in hydration reactions, leading to the formation of gel substances [
15,
20]. The CaO content in OPC reached as high as 64.55%. The Al
2O
3 content of GBFS was significantly higher than that of OPC, while the CaO content of OPC was significantly higher than that of GBFS.
The mineral compositions of SC, GBFS, MgO, and OPC tested by X-ray diffraction (XRD) are illustrated in
Figure 3. The XRD pattern of the GBFS reveals the presence of a complex calcium silicate mineral with the chemical formula Ca
4Si
2O
6(CO
3)(OH)
2. The XRD pattern of the clay reveals the presence of SiO
2, Al
2O
3, and montmorillonite. Montmorillonite exhibits the property of expanding in volume when exposed to water. The strong and sharp peak at 2
θ = 42.9° indicates the high crystallinity of the MgO phase. The XRD pattern of the OPC reveals the presence of C
3S (3CaO·SiO
2), C
2S (2CaO·SiO
2), and C
3A (3CaO·Al
2O
3). These minerals play a crucial role in the hydration and setting behavior of OPC. The particle size distributions of SC, GBFS, MgO, and OPC were measured with a Bettersize 2000LD laser particle size distribution meter, as shown in
Figure 4. In the clay, the content of the fraction of clay (less than 2 µm), silt (2 µm~50 µm), and sand (50 µm~2000 µm) was 21.9%, 74.95%, and 3.14%, respectively [
30]. Particle size analysis indicated that 49.35% of the particles in OPC were distributed within the range from 50 to 2000 µm, whereas the particles in GBFS and MgO were primarily concentrated within the range from 2 to 50 µm, accounting for 79.3% and 76.54%, respectively. The smaller particle size not only effectively fills the pores between the clay particles, but its larger specific surface area also significantly promotes the hydration reaction [
20,
21]. We conducted a particle size analysis on the SC, GBFS, MgO, and OPC to determine the particle size distribution range and the dimensions of the materials utilized in the experiment. The laser particle size distribution meter used in this study is manufactured by Dandong Baite Instrument Co., Ltd., which is located in Dandong City, Dandong, Liaoning Province, China.
2.1.2. Reinforcing Material
Relevant studies indicated that BF was widely utilized in alkaline environments. Some researchers noted that BF demonstrated superior alkali resistance at room temperature compared to glass and carbon fibers [
34,
35,
36]. To mitigate the effects of a strong alkaline environment on the performance of BF, this study selected the alkali-resistant BF produced by Henan Ruison Basalt Fiber Co., Ltd., as shown in
Figure 5. The company is located in Zhengzhou, Henan Province, China. The performance parameters of alkali-resistant basalt fiber are detailed in
Table 4.
2.2. Experimental Design
2.2.1. Preliminarily Determine the Content Range of the Curing Materials
In the alkali-activated slag solidified soil system, active magnesium oxide, carbide slag, and quicklime can be used as effective alkaline activators for the slag, respectively, with a total dosage (slag and activators) typically controlled at 10–20% of the dry soil mass [
37,
38,
39,
40]. When these alkaline exciters are used in the appropriate proportion to the slag, the cured soil achieves optimum compressive strength [
22,
37,
38,
39,
41].
The central composite design (CCD) within response surface methodology (RSM) is utilized to explore the relationship between the mass ratios of GBFS, MgO, and BF and the experimental index of UCS. The CCD requires that the experimental ranges for each factor be predetermined. In the preliminary experiment, the mixing ranges of GBFS, MgO, and BF were established at 9–13.5%, 1.5–6%, and 0–0.8% of the dry clay mass, respectively. It should be noted that the range of selected curing materials is based on the approximate range determined by existing research results, while the range of curing materials more specific and applicable to CCD testing is further determined by actual testing.
2.2.2. Central Composite Design
Figure 6 illustrates the distribution of test points for the three-factor, five-level CCD. In the preliminary test results of
Section 2.2.1, it was determined that the content of GBFS accounts for 10.5~13.5% of the dry clay mass, the content of MgO accounts for 1.5~4.5% of the clay soil mass, and the content of BF accounts for 0.2~0.8% of the dry clay mass. The content range of these three curing materials is suitable for CCD. The encoding conversion can be determined using Equation (2). Based on the obtained design area, a CCD scheme was developed using the response surface design methodology. The independent variables and their coding levels for the rotating center combination design are shown in
Table 5. In
Table 5, −1 (10.5) corresponds to the coded and actual values of the materials in the curing materials, respectively. The total number of tests for CCD was given by the formula 2
K + 2
K +
Mo, where 2
K represents the cube points,
2K denotes the axial points,
K is the number of experimental factors, and
Mo indicates the central points. In the equation, the number of tests at the central points was set to six. The independent variables in the experiment included GBFS, MgO, and BF, resulting in a total of three independent variables. Therefore, the total number of tests required was 2
K + 2
K +
Mo = 2
3 + 2 × 3 + 6 = 20. The central points were represented as zero; the coordinates of the cube points were represented as ±1; and the axial points were represented as ±α, where α was defined as α = 2
k/4 = 2
3/4 = 1.682. In the axial points,
k represented the number of independent experimental variables [
42], which was set to three in this case. According to Equation (2), the CCD experimental ranges for GBFS, MgO, and BF were 9.48%~14.52%, 0.48%~5.52%, and 0%~1.00454% of the dry clay mass, respectively.
where
Xi is the coded value,
xi is the true value of the impact factor,
x0 is the true value of the center level of the impact factor, and Δ
xi is the step size of the change in the impact factor.
A multiple quadratic regression equation (see Equation (3)) is employed to fit the functional relationship between the influencing factors and the response values. The UCS of 7, 28, and 91 days was used as the response value. According to the UCS values of the solidified clay on the 7th, 28th, and 91st days, the optimal mix ratio of the curing materials was determined through variance analysis, model fitting, validation analysis, and parameter optimization.
where
Y is the response value,
b0 is the intercept,
bi is the linear coefficient,
bii is the squared coefficient,
bij is the interaction coefficient, and
Xi is the influencing factor.
2.3. Sample Preparation
The mixture comprised water, SC, GBFS, MgO, and BF. A critical aspect of preparing this mixture was ensuring the uniform dispersion of BF throughout the soil. If BF bundles were directly mixed and stirred with the curing materials and clay, it could have led to uneven dispersion, resulting in the formation of clumps or spherical structures. In this case, the moisture content of the clay was set to be the same as the natural moisture content (70%). Even if the soft clay had good fluidity, it was still difficult to achieve uniform dispersion of BF. In this context, the preparation process of solidified clay is as follows:
(a) The clay was dried in an oven at 50 °C for 48 h. After completion of drying, it was crushed and passed through a sieve of 2 mm in diameter.
(b) First, the BF was mixed with the dry soil and mixed thoroughly for 5 min using a mixing device. Next, the GBFS and MgO were added and, again, mixed well for 5 min, using a mixing device. Finally, the mass of water required was calculated to be 70% of the mass of dry soil, which was then mixed with SC, GBFS, MgO, and BF, using mixing equipment, for a duration of 5 min. The mixing equipment was a handheld mixer, model BDL-9006. The mixing device used in this study is manufactured by Yongkang City Light Speed Industry and Trade Co., Ltd., which is located in Yongkang City, Zhejiang Province, China.
(c) PVC cylindrical molds with an inner diameter of 39.1 mm and a height of 80 mm were used for the UCS test. The mixture paste was filled into the PVC cylindrical mold in 5 or 6 layers. After adding each layer of the mixture in the mold, a vibrating device was used to vibrate for 5 min to remove bubbles from the sample. Then, the next layer was added until the mold was completely filled. The model number of the electric vibration equipment is HZJ-A. The electric vibration equipment used in this study is manufactured by Beijing Zhongjiao Jianyi Technology Development Co., Ltd., which is located in Beijing, China.
(d) After the mixture paste fills the mold, the top surface of the mold should be covered with plastic wrap and then placed in a curing box for 24 h before demolding. The samples, after demolding, should be sealed in plastic bags and placed in the curing box until they reach the required curing time. In the curing box, the temperature should be controlled at 20 ± 2 °C, and the humidity should be maintained at over 96%.
2.4. Testing Method
2.4.1. Test Method for Unconfined Compressive Strength
The test method for UCS was based on the T0805-2024 standard of JTG 3441-2024 [
43]. A WDW-100D electronic universal testing machine was utilized, featuring a maximum loading capacity of 20 kN. The WDW-100D electronic universal testing machine used in this study is manufactured by Shenzhen Sunway Technology Co., Ltd., which is located in Shenzhen, Guangdong Province, China. The strain-controlled loading rate was set at 1 mm/min. The equation used to calculate the unconfined compressive strength (
Rc) is provided below:
where
Rc is the unconfined compressive strength (MPa);
A is the cross-sectional area of the sample (mm
2);
P is the maximum pressure when the sample is damaged (N); and
D is the diameter of the sample (mm), taking the value of 39.1 mm. Each group consisted of three sample replicates, and the final unconfined compressive strength was determined from the average strength of these three samples.
The stress–strain curve represents the relationship between stress (
σ) and strain (
ε) of the soil during the loading process. Stress is the internal force per unit area within a material (see Equation (5)). Strain is the relative amount of deformation of a material under stress (see Equation (6)).
where
σ is the stress of the sample (MPa),
F is the applied force on the sample (N), and
A is the cross-sectional area of the sample (mm
2).
where
ε is the stress of the sample (dimensionless); △
L is the difference in height of the sample before and after compression (mm); and
L0 is the original height of the sample (mm), taking the value of 80 mm.
2.4.2. Test Method for Water Stability
The water stability test was conducted following the CJ/T 486-2015 [
44]. The solidified clay samples were soaked in a water bath environment at 20 °C for one day, ensuring that the water level remained 2 cm–3 cm above the top of the samples. Upon completion of the water bath, excess water on the surface of the samples was absorbed using a dry cloth, followed by the proceed of the UCS test. Based on the test results, the water stability coefficient of the solidified clay was calculated, defined as the ratio of the UCS of the soaked sample to that of the non-soaked sample (see Equation (7)).
where
K is the water stability coefficient of the solidified clay;
Ywater is the soaking treatment of the sample one day before reaching the required curing time, with a soaking time of 24 h, and the unconfined compressive strength of the sample is measured at the end of the soaking (MPa); and
Y is the unconfined compressive strength of the sample measured after curing to the required time (MPa).
2.4.3. Test Method for Freeze–Thaw Cycle
The freeze–thaw cycle test method was conducted according to the T0858-2009 standard, which was derived from JTG 3441-2024 [
43]. Specifically, (I) clay mixed with GMBF to form GMBF solidified clay, clay mixed with OPC to form OPC solidified clay, and solidified clay were subjected to a freeze–thaw cycle test after 91 days of standard curing. (II) During the freeze–thaw cycle, the sample was placed in a device set to −18 °C for 18 h and then transferred to a room at 20 °C to thaw for 6 h, which constitutes one freeze–thaw cycle. (III) The freeze–thaw cycles were conducted for 1, 3, 5, 7, and 10 times. After the freeze–thaw cycles, the mass loss rate and volume were first measured, and the mass loss rate is calculated as shown in Equation (8). (IV) UCS tests were conducted on solidified clay to determine the UCS of the freeze–thaw sample, and then their moisture content was measured.
where
Wn is the mass loss rate of the specimen after
n freeze–thaw cycles,
m0 is the mass of the sample before freeze–thaw cycles (g), and
mn is the mass of the sample in the
n-th freeze–thaw cycle (g).
2.4.4. Test Methods for Minerals and Microscopic Morphology
Before analyzing the microscopic morphology and mineral phases, representative fragments from UCS test samples were soaked in anhydrous ethanol for 24 h. After soaking, it was dried at a temperature of 50 °C for 48 h. To investigate the mineralogical composition, the freeze-dried fragments were ground and sieved through a 200-mesh sieve (0.074 mm) prior to scanning for 20 min, using a Rigaku SmartLab SE X-ray diffractometer (XRD) equipped with a Cu Kα source, covering a range from 15° to 75°, with a step size of 0.02°. The Rigaku SmartLab SE X-ray diffractometer used in this study is manufactured by Rigaku Corporation, which is located in Tokyo Metropolis, Japan. By analyzing the diffraction patterns, the diffraction peaks were identified and analyzed using the software Jade 6 to determine the presence of various mineral phases in the sample. The dried fragments were coated with a thin layer of gold and then analyzed using a Sigma 300 instrument to identify the hydrated phases and microscopic morphology. The Sigma 300 instrument used in this study is manufactured by Carl Zeiss AG, which is located in Oberkochen, Germany.
In summary, the CCD test can identify the optimal mass ratio among GBFS, MgO, and BF. The combination of GMBF and clay results in the formation of GMBF solidified clay. An equivalent amount of OPC was used, resulting in the formation of OPC solidified clay when combined with the clay. The comparative test scheme for both is shown in
Table 6. The mechanical properties, durability, and microstructure of the solidified clay were investigated using the UCS test, water stability test, XRD test, and SEM test, respectively. In
Table 6, the values 7(6), 14(13), 28(27), 60(59), and 91(90) refer to solidified clay that was soaked in water for one day after standard curing for 6, 13, 27, 59, and 90 days, respectively.
6. Conclusions
In this study, a curing material named GMBF was developed based on CCD in RSM and mixed with clay to form GMBF solidified clay. Through a series of laboratory tests, the mechanical properties, durability, and micro-morphology of the GMBF solidified clay were obtained, and the contribution of basalt fibers in the solidified clay was further clarified. The main conclusions are as follows:
(1) A quadratic regression model of UCS was developed for 7, 28, and 91 days, and analysis of variance and experimental validation showed that the model was well fitted and accurately predicted to obtain the optimal mix ratio. Based on the parameter optimization, the optimum mass ratio of GBFS, MgO, and BF in GMBF was 13.35:4.47:0.26.
(2) The UCS values of GMBF solidified clay after 7 days, 28 days, and 91 days were 1.08 MPa, 2.05 MPa, and 2.85 MPa, respectively. At curing times of 7 days and 91 days, the UCS of GMBF solidified clay increased by 45.9% and 33.8% compared to OPC solidified clay, respectively.
(3) The water stability coefficient of GMBF solidified clay after 7 days, 28 days, and 91 days was 84%, 89%, and 93%, respectively. The water stability coefficient of GMBF solidified clay was improved by 2.44%, 5.95%, and 4.49% compared to that of OPC solidified clay. The GMBF solidified clay experienced ten freeze–thaw cycles, which resulted in a decrease of less than 50% compared to zero freeze–thaw cycles, with a specific decrease of 44.2%. In contrast, the decline of OPC solidified clay exceeded 50%.
(4) The hydration products of GMBF solidified clay primarily consisted of C-S-H gel and Ht. The contribution of basalt fibers to GMBF solidified clay was explained by the interaction of the fibers with particles or hydration products, including bonding and bridging effects. This also led to good overall properties of GMBF solidified clay, resulting in better mechanical and durability properties.


