Abstract
The article presents an analysis of the outcomes for AA2519 aluminum alloy exposed to variable loads. The variable loads were implemented with a strain control program consisting of incremental steps and increasing/decreasing multiple steps. Tests were conducted at higher and lower strain ranges and yielded lower (LFL test) and higher (HFL test) fatigue life, respectively. The values of plastic strain, cyclic modulus, cyclic yield strength, and fractography were analyzed. Based on the analysis of the test results, a criterion was established for the division of the tested fatigue properties into two parts for which the strength coefficient and strain hardening exponent were determined. An analytical description of the cyclic stress–strain curve for the entire range of results obtained from the LFL and HFL tests was proposed. Compared to other available models describing material properties, good compliance was obtained with the experimental results for both the LFL and HFL tests.
1. Introduction
Due to their relatively high strength, good fracture toughness, and relatively low density, AA2519 alloys are used in ballistic structures as well as in lightweight military [,], aviation [], and space [] structures. The above-mentioned structures are very often exposed to time-varying loads, thus the knowledge of the behavior of this type of material under time-varying conditions becomes indispensable when designing such structures.
Available studies on fatigue tests of the AA2519 alloy are very scarce. The study [] analyzed the effect of rolling direction on static and fatigue properties and demonstrated that rolling direction does not significantly affect fatigue properties. Another study, ref. [] compared the fatigue life results of the AA2519 alloy with those of other 2000-series alloys. Most of the studies on fatigue testing of AA1519 alloy involve tests where the alloy is joined with another material, mainly by explosive welding [,,]. Results of the aforementioned studies are mainly related to normative tests [,] at constant-amplitude loads with the exception of studies [] where tests were carried out using an incremental-step method. Those studies highlighted that the AA 2519 alloy is cyclically unstable and subject to cyclic hardening.
Normative studies [,] are costly and labor-intensive. Methods for the determination of cyclic properties with improved cost- and time-efficiency have been introduced in recent years. These are methods based on single specimens [,], for which similar test results are obtained (e.g., []) compared to those obtained using standard methods. Moreover, study results [] are available, which prove that in the case of estimating fatigue life of randomly loaded structural elements, the method of determining cyclic material properties using the single specimen method makes it possible to obtain more reliable fatigue life results.
Geometric notches of such structures, which are caused, among other things, by changes in cross-section or by mounting holes, trigger stress/strain concentrations. The strain/stress values at the bottom of the notch of a structural member are determined using different types of constitutive model of cyclic properties of the material [,]. Nevertheless, in engineering practice, the most commonly used model for representing the cyclic stress–strain curve (CSS) is the Ramberg–Osgood (R–O) model [,], which consists of the elastic and the plastic parts.
Research on the development of material models that will better describe results of experimental tests are still ongoing. Thus, the R–O model has undergone several modifications, which, depending on the type of material, provide better or worse compliance with experimental results. The elastic part of the R–O model itself, described by Young’s modulus, becomes debatable. There are at least three types of moduli for static tests: Young’s Modulus, Tangent Modulus, and Chord Modulus []. In addition, researchers specify an effective Young’s modulus [] as the slope of the first elastic response in the stress–strain diagram. Others introduce cyclic moduli defined for the increasing loop branch and for the descending loop branch, and a cyclic modulus defined as the slope of a straight line connecting the loop corners [,].
Such a large number of moduli raises the question of which modulus is the most appropriate for use in cyclic properties. Some argue that the cyclic modulus should be determined within the elastic limit of the first quarter of the hysteresis loop [], others that the mean value of cyclic moduli determined from the increasing and descending branches of the hysteresis loop should be used [,], but some of them [] limit the range of averaging the cyclic modulus to a certain value of the strain, thus obtaining good results.
Some researchers, when describing the experimental results of the cyclic stress–strain curves introduce additional material constants that fit the model to the experimental results of a particular material [], obtaining very good results. Others propose two-stage Ramberg–Osgood models [,], achieving better model fit to experimental results.
Descriptions of full-range stress–strain curves have also appeared in recent years, but not all of them describe the entire range of the stress–strain diagram using a single formula. In the study [] the range has been divided into two parts and the description was based on conventional parameters of the Ramberg–Osgood model and ultimate tensile strength (Su) and strain (εu). In [], full-range stress–strain curves are divided into two parts. There is also a model that divides the stress–strain curve into three stages [], and the determination of all necessary parameters is based on four basic data (initial elastic modulus, 0.2% proof stress, ultimate stress, and total strain of ultimate point). This model is based on a modification of the Hradil model []. In [], full-range stress–strain curves were described by one comprehensive formula which is based on conventional R–O parameters and two additional material parameters, A and B, were introduced. A slight modification of this model was proposed in [] to describe the monotonic properties in individual zones of the laser weld of duplex steel. Good compliance with experimental results was obtained here.
The slight modification of the model describing the entire range of the stress–strain curve proposed in [] did not include a criterion for dividing the experimental data for which n1, K1, n2, and K2 constants were determined. The division of these experimental data was carried out intuitively. This paper proposes a criterion for dividing experimental tests based on the intersection points of linear correlations describing cyclic moduli as a function of plastic strain amplitude and linear correlations of control strain amplitude as a function of plastic strain amplitude. Based on this criterion, the cyclic material properties of AA2519 alloy were described using a modified model describing the full-range stress–strain curve. A very good level of compliance between the proposed model and experimental results of the LFL and HFL test for AA2519 aluminum alloy subjected to time-varying loads was obtained using the above criterion.
2. Materials and Methods
Research on selected cyclic material properties and microstructure was carried out on the relatively new aluminum alloy AA2519. Prior to tests, the prepared specimens were subjected to heat treatment involving soaking at a temperature of 530–550 °C for 2 h, cooling in water with rate > 150 °C/s (in the range of 500–300 °C), and aging at 165 °C for 10 h (heat treatment state T62). The heat treatment was intended to improve mechanical properties of the tested alloy. Chemical composition of this alloy and properties obtained from the static tensile test are presented in Table 1.

Table 1.
Chemical composition and mechanical properties of AA2519 aluminum alloy [,].
Tests of main fatigue properties were carried out for specimens taken from a 10 mm thick sheet metal plate. Specimens were cut parallel to the rolling direction using the WEDM method. Dimensions of specimens are shown in Figure 1.

Figure 1.
Dimensions of the specimen (in mm) for testing cyclic fatigue properties.
Tests of fatigue properties were performed in low-frequency range of cycles using the INSTRON 8502 testing machine (Bydgoszcz University of Science and Technology, Bydgoszcz, Poland). The fatigue test was controlled by the strain value. The tests were carried out using an extensometer with a 10 mm measuring base and a measuring range of +/−1 mm. The tests were carried out at a frequency of 0.2 Hz and a cycle asymmetry ratio of R = −1.
The loading program was designed as a strain control program consisting of incremental steps and increasing/decreasing multiple steps described in []. The load was imposed by controlling the strain by alternating multiple steps with increasing strain (step I, III, and V—Figure 2) and multiple steps with decreasing strain (step II and IV—Figure 2). Thus several strain levels were implemented in each block by performing five cycles at each strain level.
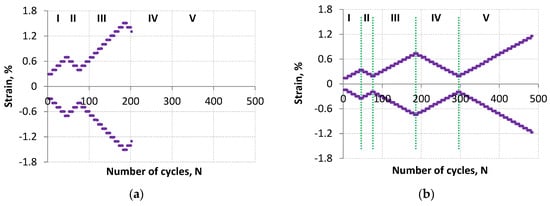
Figure 2.
Specimen loading program for lower fatigue life (LFL) (a) and for higher fatigue life (HFL) (b).
This combination of the programs was chosen because the stress–strain curves obtained from the incremental step test provide the best strain/stress response to random loading occurring in objects made of the tested material. Combining the incremental step with the multiple step (e.g., using five cycles at a given level) provides a greater chance for the material to stabilize at a given level, thus obtaining closed hysteresis loops, which improves data processing for stress–strain curves.
The tests were carried out using two specimens for two different loading programs. These programs were of the same nature but differed in the strain range values. For example, the first loading program—step I (Figure 2a) started with a strain range of Δε = 0.6% and ended with Δε = 1.4%, while the second loading program—step I (Figure 2b) started with a strain range of Δε = 0.3% and ended with Δε = 0.7%. Thus, it should be noted that the second loading program was characterized by half the smaller control strain ranges Δε compared to the ranges of the first loading program. Reduction in the strain range increased the fatigue life of the test specimen.
Throughout the tests, the outcomes in the form of points of the hysteresis loop were recorded. Tests were conducted up to complete fatigue fracture, obtaining different fatigue lives of the tested items. After the fatigue tests, photographs of fatigue fractures were taken with the SEM and analyzed. An analytical description of material properties was also proposed on the basis of the developed results.
3. Results and Discussion
3.1. Cyclic Stress Response
Fatigue test control with the strain value (Figure 2) made it possible, among other things, to record the response in the form of maximum and minimum stress values (Figure 3). Regardless of the fatigue life obtained, the amplitude of stress preceding the total fracture of the specimens was similar. For LFL, this amplitude was 482 MPa (for a maximum value of 490 MPa and a minimum value of −474 MPa), while for the higher fatigue life it was 488 MPa (for a maximum value of 472 MPa and a minimum value of −504 MPa).
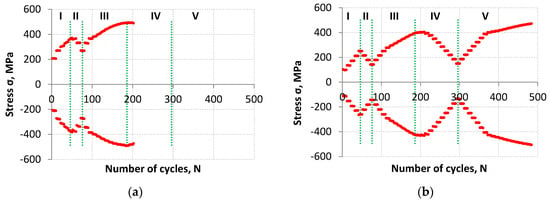
Figure 3.
The maximum and minimum stress values as a function of cycles for the lower fatigue life (a) and for the higher fatigue life (b).
The highest value of the stress amplitude was achieved for the LFL specimen in the 186th cycle and it amounted to σa_max_LFL = 491 MPa while for the HFL specimen in the 484th cycle and it amounted to σa_max_HFL = 488 MPa. In both cases, these values were recorded at the same control strain amplitude value of εa = 1.5%. Both σa_max values are higher than the material strength Su = 475 MPa obtained in the tensile test by about 3.4% and 2.8%, respectively. Higher stress amplitude values in cyclic tests than the material strength indicate cyclic hardening of the material.
In order to analyze the behavior of the material at given levels of control strain values, the values of stress amplitudes as a function of the number of cycles were compared. The number of cycles was assumed from 1–5, since the control strain changed every five cycles. The results for LFL are summarized in Figure 4a, while those for HFL are shown in Figure 4b. Moreover, the up arrow indicates multiple steps with increasing strain while the down arrow indicates multiple steps with decreasing strain.
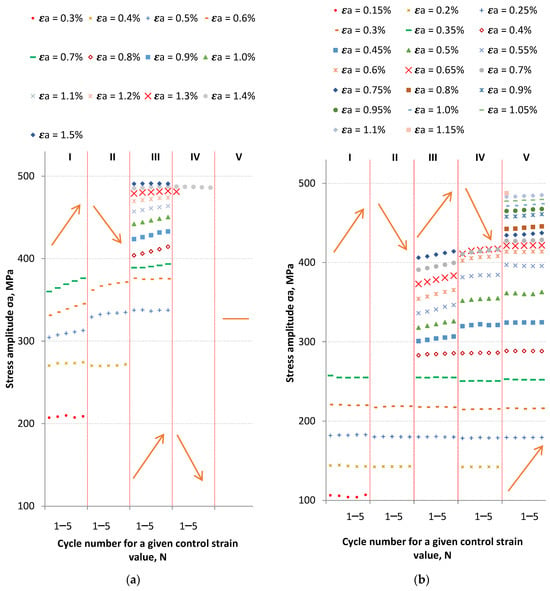
Figure 4.
The graph of Δσ/2 as a function of the number of cycles for LFL (a) and HFL (b).
At the lowest levels of control strain (εa = 0.3–0.4% for LFL and εa = 0.15–0.35% for HFL), the material was relatively stable. A slight weakening can be observed for LFL for εa = 0.4 at the turn of step I and step II, while for HFL the weakening progressed gradually and was virtually invisible in graph 5b. For example, at a strain of εa = 0.25%, the stress amplitude σa for the first cycle at step I was 181.9 MPa, and for the last cycle at step V, 179.36 MPa. While at a control strain of εa = 0.3%, the stress amplitude was 220.84 and 216.23 MPa, respectively.
For both LFL and HFL, starting from the control strain value of εa ≈ 0.45–0.5%, the material began to harden. For LFL, the greatest hardening was observed for control amplitude of εa = 0.6%. For this loading level, a stress amplitude of 331.37 MPa was recorded for the first cycle of step I. While for the first cycle of step III, the stress reached 375.59 MPa. The hardening observed for a control strain of εa = 0.6% was thus approximately 13%. At a comparable control strain of εa = 0.55%, higher hardening was observed for the HFL test results. For the first cycle of step III, the stress amplitude was 336.18 MPa, while a stress of 397.21 MPa was recorded for the first cycle of step V. The hardening was therefore over 15%. After this first cycle of the stress amplitude in step V, there was a slight weakening of the material for the same value of control strain. This weakening of the material was also evident in subsequent loading cycles, when the control strain of εa = 0.55% in Step V progressed to subsequent levels of 0.6, 0.65, and 0.7%.
When analyzing the available test results obtained with strain control under constant-amplitude conditions, hardening (if any) is noticeable mainly in the initial steps of fatigue life. In the last step of fatigue life, the material usually weakens, which was also observed for the LFL tests (V, εa = 1.4%). However, the behavior of the material in the last step of fatigue life during the HFL test may be debatable. In this case, material hardening occurs virtually until complete fracture.
3.2. Mean Stress Relaxation
The behavior of mean stress values was also analyzed. Graphs of mean stress and stress amplitude as a function of the number of cycles are shown in Figure 5. A change in the value of mean stress as a function of the number of cycles is observed for both LFL and HFL. These changes ranged from −10.39 to 7.97 MPa for LFL and from −17.57 to 8.04 MPa for HFL. Broader range of mean stress changes for HFL reveals the occurrence of more extensive damage mechanisms under the influence of increasing numbers of cycles, which had a positive effect on the hardening of the material virtually until the last cycle before the failure of the specimen.
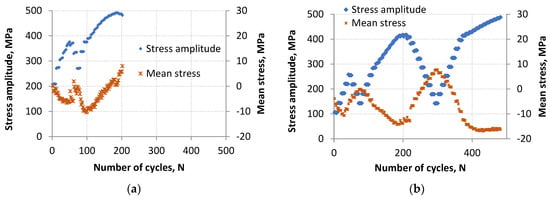
Figure 5.
The curve of σa and σm as a function of the number of cycles for LFL (a) and HFL (b).
When analyzing the nature of changes in mean stresses, it should be noted that during most of the fatigue life period, an increase in the value of maximum stress causes a decrease in mean stress values. However, while the maximum stress values decrease, the mean stress values increase. This regularity is observed for both cases (Figure 5a,b). The change in this behavior begins to be observed before exceeding the hundredth loading cycle for LFL and after exceeding the four hundredth cycle for HFL. At that point, the mean stress value began to increase from −10.39 to 7.97 MPa for LFL and from −17.57 to −16.43 MPa for HFL regardless of whether successive load cycles were increasing (as observed for HFL) or decreasing (as observed for LFL). After passing the four hundredth cycle for HFL, the increase in the mean stress value was negligible and amounted to more than 1 MPa while for LFL the change was significant and amounted to as much as 18.36 MPa.
The change in the behavior of mean stress values at the end of fatigue life (LFL test), causing the mean value to shift toward larger values, can be caused by the appearance of large stress concentrations in the areas of developing micro- and macro-cracks, accompanied by large strain necessary to achieve forced control strain. These processes can decrease compression strength of the material and increase its tension strength. Such phenomena are not observed at constant-amplitude loads. On the other hand, the stabilization of mean values (HFL test) may indicate that cyclic equilibrium has been reached in the material in which stresses and microstructure have stabilized.
However, when analyzing the mean stress as a function of strain amplitude, it can be observed that up to a certain strain value, the mean stress decreases with increasing strain. This situation is observed up to a strain value of about 0.7–0.9% for both tests performed (LFL and HFL). For the tested material subjected to variable loads, the specified strain may turn out to be a threshold value for which the relaxation direction reverses. The change in direction sense was particularly evident for tests with a large strain range, i.e., for LFL tests (Figure 6). Due to the similar nature of the behavior of the results of the mean stress value as a function of strain amplitude for both LFL and HFL, they were approximated by a single quadratic function equation (Figure 6).
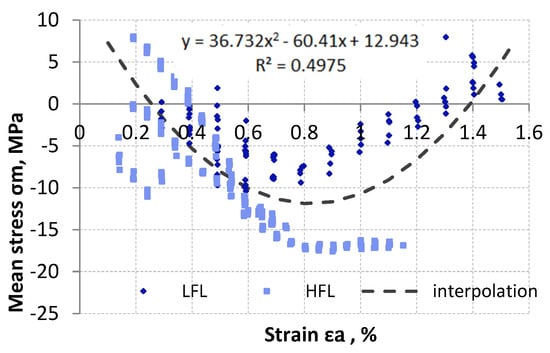
Figure 6.
The curve of the mean stress relaxation as a function of the amplitude control strain.
3.3. Analysis of Hysteresis Loop Parameters
Plastic and elastic strain curves determined from hysteresis loops as a function of increasing number of cycles were analyzed (Figure 7). A distinct plastic strain (a value of about 0.01%) appeared at a control strain amplitude of εa ≈ 0.39%. For LFL, the value of this plastic strain appeared at the first step of loading, while for HFL at the third step of loading, as it was only in the third step that the stress amplitude exceeded the yield stress value.
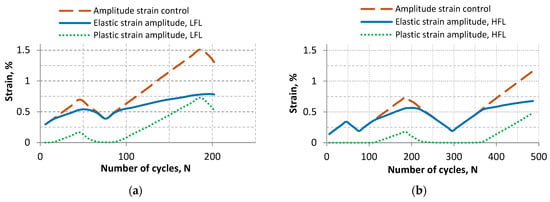
Figure 7.
Summary of plastic and elastic strain as a function of the number of cycles: (a) LFL and (b) HFL.
Once the stress amplitude corresponding to the yield stress (step II for LFL and step IV for HFL) is exceeded, distinct plastic strain (a value of about 0.01%) was recorded for a decreasing cycle only at a control variable of 0.45% for LFL and 0.49% for HFL. Subsequent increasing cycle resulted in the appearance of distinct plastic strain at an even higher control variable. Distinct plastic strain appeared at a control variable of 0.5% for LFL and 0.54% for HFL. The plastic strain mechanisms occurring during both increasing and decreasing cycles, once the value of the stress amplitude equivalent to the yield stress is exceeded, affect the cyclic hardening of this material.
The graph showing the dependence of the control strain amplitude as a function of the plastic strain amplitude (Figure 8) is divided into two parts—the left and the right one. The left parts of Figure 8 are described by the straight line εa1 = a·εapl + b, while the right parts of the graph are described by the straight line εa2 = a·εap2 + b. It is observed that the slopes of the straight lines εa1 and εa2 for LFL and HFL have similar values. The intersection of these straight lines is described by the point Xε (εap, εa). The coordinates of these points are also similar and are (0.3135, 0.9612) and (0.2676, 0.8944) for LFL and HFL, respectively. Thus, taking into account the entire life of the tested items and looking at the formulas of the obtained straight lines, it can be concluded that, independent of the fatigue life result (which depends mainly on the value of the control amplitude), the selected value of the control variable will correspond to a specific plastic strain value comparable for the LFL and HFL tests.
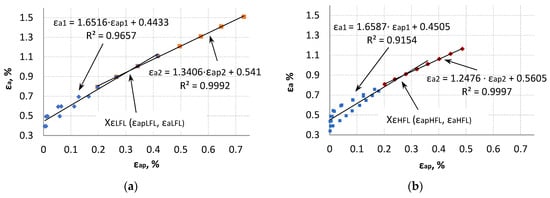
Figure 8.
The control strain amplitude as a function of the plastic strain amplitude at LFL (a) and in HFL (b).
The left side of the graphs corresponds to the results of tests with increasing/decreasing steps, while the right side corresponds mainly to the increasing step, which ended with the fracture of specimens. Experimental points to the left of point Xε and under the straight line εa1 are mainly from the first loading steps, while those above straight line εa1 are from subsequent loading steps. Subsequent loading cycles enforced by the control strain result in the fact that for the same values of the control variable εa, the values of plastic strain εap are smaller, which confirms the hardening of the material under cyclic loading.
3.4. Cyclic Modulus
The cyclic modulus for tension loop branch (ER) and the compression loop branch (EU) was analyzed for the LFL and HFL tests. The cyclic module determined for the straight line connecting the edges of the hysteresis loop (ES) was also analyzed. The cyclic moduli were determined in accordance with the diagram shown in Figure 9. On the other hand, Figure 10 presents the summary of cyclic moduli as a function of the increasing number of cycles N. For comparison, Figure 10 also presents the Young’s modulus E as the mean value of the modulus obtained from the monotonic tensile test for the AA2519 alloy, derived from three publications [,,].
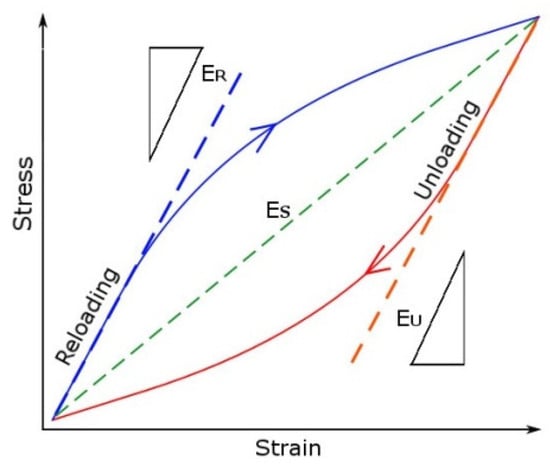
Figure 9.
The diagram for determining cyclic moduli [].
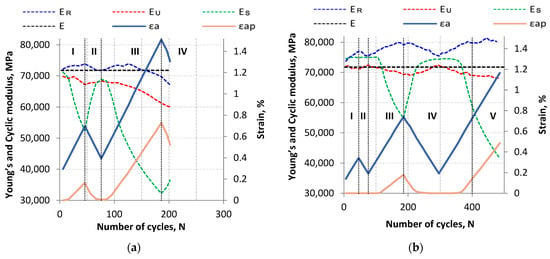
Figure 10.
Summary of E, ER, EU, and ES moduli values as a function of increasing number of cycles for (a) LFL and (b) HFL.
In the first cycles of fatigue loading, especially when the yield stress point has not been exceeded, the cyclic modulus ES should be characterized by a similar value to Young’s modulus E. Such a pattern is observed for the LFL test, while in the case of the HLF test, the cyclic modulus ES is literally several percent higher than the modulus E. This difference, however, is at an acceptable level and may be related to the difference in material properties of the specimens as well as measurement errors.
The cyclic modulus ES tends to decrease during a cyclically increasing value of the control strain. In case the control strain cyclically decreases, ES modulus cyclically increases (Figure 10). Exceptions to this are life periods where the plastic strain value is close to (less than 0.01%) or equal to zero. In this situation, ES modulus is relatively stable (at the beginning of fatigue life and the transition from step II to step III for LFL, and at step I, II, the beginning of step III, and the middle part of step IV for HFL). However, it should be noted that ES value for LFL after increasing and decreasing cycles decreased from 71,188 MPa to 68,892 MPa, i.e., more than 3%, while for HFL it decreased from 75,120 MPa to 74,598 MPa, or less than 0.7%.
The nature of the change in the other cyclic moduli (ER and EU) as a function of the number of cycles is similar for both LFL and HFL tests. In general, the ER module increases when the control value increases cyclically, while it decreases when the control value decreases. For the EU module, the situation is opposite. Such behavior of cyclic moduli, especially the ER modulus, is observed until a certain period of fatigue life. In the case of the LFL test, this is about 126 cycles while for the HFL test it is about 446 cycles. The ER modulus begins to decrease after this number of cycles. It is generally believed that the value of the classic Young’s modulus tends to decrease under the influence of cyclic loading. This is due to the fact that cyclic loading induces fatigue processes in the material, which in the initial steps lead, among other things, to microscale damage (cracks, internal structure changes) and thus to a decrease in the stiffness of the tested items. Such fatigue phenomena change the nature of the ER modulus behavior causing a cyclic decrease in its value from a certain fatigue life value until complete failure of a specimen.
The dependence of cyclic moduli (ER and EU) as a function of plastic strain amplitude εap was presented in the following analysis (Figure 11). The results of each cyclic modulus were described by two linear regressions, and the intersection of these regression lines was denoted by the XELFL/HFL (εap_, ER/U) point. For the LFL test, the intersection points for ER and EU were XELFL_R (0.2794%, 73,668.1 MPa) and XELFL_U (0.3599%, 66,131.1 MPa), respectively. While for the HFL test, the intersection points for ER and EU were XEHFL_R (0.2970%, 81,042.6 MPa) and XEHFL_U (0.2124%, 69,058.2 MPa), respectively.
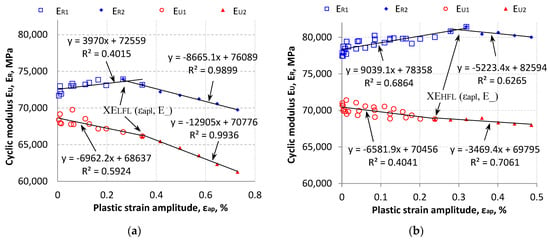
Figure 11.
Summary of cyclic moduli ER and EU as a function of plastic strain amplitude εap: (a) for LFL and (b) for HFL.
XELFL/HFL points marked in Figure 11 are indicative of the change in material properties under cyclic loading. To the left of points XE_, the values of the cyclic moduli ER1 for the conducted tests increase with increasing plastic strain εap. Then, after passing the characteristic XE_ points, the values of cyclic moduli ER2 decrease with the increase in plastic strain εap, while cyclic moduli EU (both to the left and to the right of the XE_ points) tend to decrease throughout the entire tested period.
In order to use the cyclic modulus in the following part of the paper to analytically describe cyclic material properties, the mean values of cyclic moduli were calculated. The mean value was calculated for the values of cyclic moduli to the left of the XELFL and XEHFL points. It was noted that these values resulted in the best fit of the analytical model to the obtained study. Mean values were determined for the results of moduli ER1 (by determining ER1m) and EU1 (by determining EU1m) separately for the LFL and HFL test. Then the mean cyclic modulus Em_ = (ER1m + EU1m)/2 was determined. The average values of Em_LFL for LFL and Em_HFL for HFL were 70,478 MPa and 74,298 MPa, respectively. These values are presented in Table 2.

Table 2.
Cyclic stress–strain curve parameters.
3.5. Cyclic Yield Strength
The cyclic yield strength (SYC) was calculated for the increasing (SYC,R) branch loop and decreasing (SYC,U) branch loop. The SYC was calculated for the offset value of 0.2%. The SYC was calculated for hysteresis loops with plastic strain amplitude equal to and greater than 30% of the offset value (εap ≥ 0.06%). The values of SYC,R and SYC,U for LFL and HFL, as a function of plastic strain amplitude εap, are shown in Figure 12a for the LFL test and Figure 12b for the HFL test.
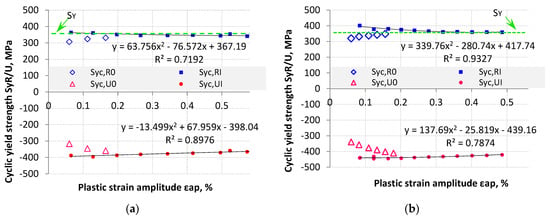
Figure 12.
Summary of SYC (SYC,R and SYC,U) as a function of plastic strain amplitude εap: (a) for LFL and (b) for HFL.
The results of SYC from the first loading blocks were marked with the subscript “0” (SYC,R0 and SYC,U0), while those from blocks where the SYC value stabilized with “I” (SYC,RI and SYC,UI). Lower absolute SYC values were recorded for the first loading blocks as compared to the later loading blocks. This proves that for this type of material SYC limit tends to harden cyclically. The hardening reached almost 30% over the lowest cyclic yield strength. SYC results from the first loading blocks were discarded in the statistical analysis. The results from subsequent loading blocks SYC,RI and SYC,UI were described by a quadratic polynomial regression function, which yielded a coefficient of determination (R2) of 0.71−0.93.
The stabilized absolute SYC value for both the LFL test (Figure 12a) and HFL test (Figure 12b) results decreased with increasing plastic strain amplitude εap. The differences in the determined SYC value as a function of plastic strain amplitude were not significant and were at most about 10%. The absolute mean values of the stabilized SYC were SYC,R = 322 MPa and SYC,U = 344 MPa for the LFL test, and SYC,R = 373 MPa and SYC,U = 434 MPa for the HFL test. The mean value of cyclic tensile yield strength (SYC,R) was lower than the mean value of cyclic compressive yield strength.
The mean value of cyclic tensile yield strength (SYC,R) was also determined for all previously analyzed points for both the LFL test and HFL test. This value was 354 MPa. It should be noted that this value is comparable to the yield strength calculated for the monotonic tensile test SY = 353 MPa. The SY is also plotted in Figure 12 to illustrate the results.
3.6. Fatigue Fracture Surface
A scanning electron microscope (SEM) was used to take photographs of specimen fractures, taking a series of photos at various magnifications. Several characteristic fracture zones were identified in the photos taken. Three zones were identified for the LFL test fracture (Figure 13a) and four zones were identified for the HFL test fracture (Figure 13b). It should be noted that the number of distinct zones depends on the image filtering method (SEM, SEI, REF).
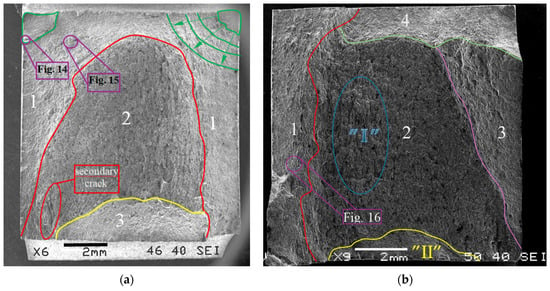
Figure 13.
Marked fracture zones for test specimens from (a) LFL and (b) HFL tests.
Two main fracture foci were identified for the LFL test fracture (marked green in Figure 13a). A detailed analysis of one of them made it possible to identify the crack initiation point, which formed the river marks structure during propagation, as shown in Figure 14. This fracture is topographically complex. One of the most characteristic features of the fracture is a large secondary crack, a detail of which is shown in Figure 15.
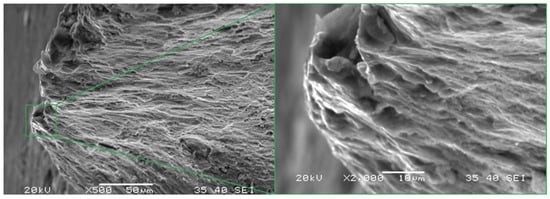
Figure 14.
Marked part of the LFL test specimen in which the crack focus was found.
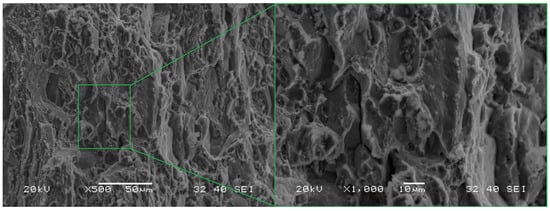
Figure 15.
Marked part of the LFL test specimen with a visible secondary crack.
No distinct fracture foci are visible in the HFL test fracture (Figure 13b). The cracking process most likely began at the edge, which in the photograph shown is the lower edge of the specimen (marked “II”). The relatively complex nature of the crack is observed in the area “I” (forming part of zone 2), which is the result of intercrystalline cracks propagating in multiple directions of which the main direction was from the lower to the upper edge of the specimen propagating in the direction of the load. As a result, the direction of the main crack was neither parallel nor perpendicular to the plate rolling direction. The characteristic jagged structure is the result of exactly this propagation.
The fracture of the selected fragment of the HFL test specimen (Figure 16) is of transcrystalline plastic character with sparse intercrystalline cracks present. A feature common to the analyzed fracture in this area is the occurrence of characteristic faults penetrating deep into the material. They most likely occur between individual layers of the rolled plate. Facets are visible on the walls of these cracks, and (at slightly higher magnifications) voids and micro-cracks are discernible. Particles of undissolved θ-phase are visible at the bottom of the dimples, as evidenced by the result of the chemical composition analysis of the fragment containing the said particles, the spectrum of which is shown in Figure 17. Some of them have kept their original spherical shape, while some have cracked (Figure 17).
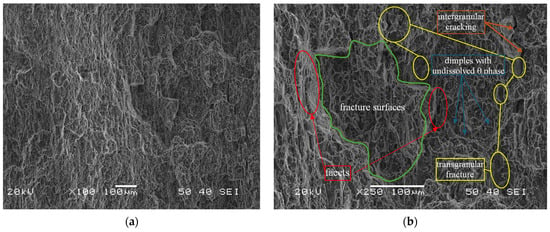
Figure 16.
A characteristic part of the specimen fracture from the HFL test (a) and a description of this part at a higher magnification (b).
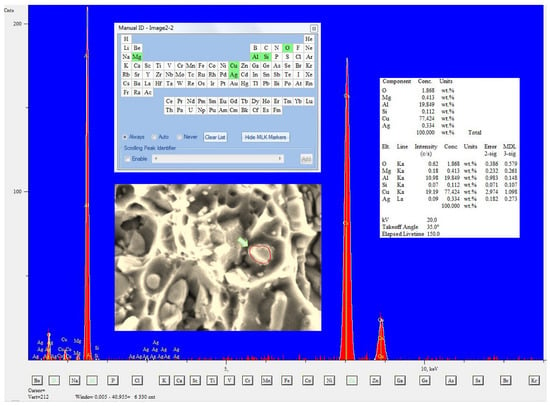
Figure 17.
Chemical composition measured at the bottom of the dimple transverse to the spherical undissolved theta phase particle with marked area where the chemical composition analysis was performed.
3.7. Cyclic Stress–Strain Curve (CSS)
As demonstrated in the above analysis, the tested material has cyclically unstable material properties. At lower levels of the control variable, periods of cyclic material weakening prevail, while at higher levels of the control variable, periods of cyclic hardening predominate. Due to this, describing the material properties through conventional analytical equations such as the Ramberg–Osgood model using n’ and K’ [,] becomes significantly more difficult or impossible. Material data developed in this way in order to describe material properties may lead to differences between actual material properties. Figure 18 shows an attempt to describe experimental data from the LFL test (Figure 18a) and the HFL test (Figure 18b) with a straight line as a function of logσa of the variable logεap.
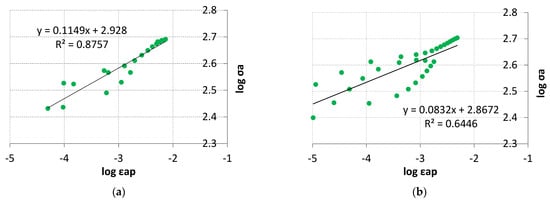
Figure 18.
Stress amplitude logarithms versus plastic strain amplitude logarithms for (a) LFL and (b) HFL.
The description of the experimental results with a linear regression function (Figure 18) results in a relatively high coefficient of linear determination R2 = 0.8757 especially when it comes to the linear correlation of the LFL test results. A much worse coefficient of linear determination, R2 = 0.6446, was obtained for the linear correlation of the HFL test results. The n′ and K′ coefficients were determined for the LFL and HFL test results, which are summarized in Table 2.
An attempt was also made to describe the test results using two linear correlations. The value of εapX calculated from the mean value derived from the intersection points of XεLFL/HFL, XELFL/HFL_R, and XELFL/HFL_U was used as a criterion for dividing the experimental test results. These values amounted to εapXLFL = 0.2382% for the LFL test and εapXHFL = 0.1943% for the HFL test, respectively.
For the criterion adopted in such a way, the experimental results were divided into two parts: stage 1 and stage 2 (Figure 19). A very high coefficient of determination was obtained for stage 2. Such a high coefficient of determination was not obtained for the results in the first part of the chart (stage 1). This is due to the fact that the test results in the first part of the chart (stage I) come from both increasing and decreasing steps, which, with cyclically unstable materials, affects their scattering. The coefficients n1′, n2′, K1′, and K2′ were determined for the stage 1 and stage 2 test results. The values of these factors are summarized in Table 2.
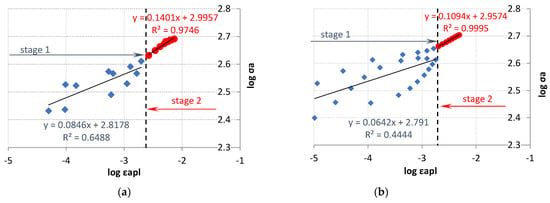
Figure 19.
Stress amplitude logarithms versus plastic strain amplitude logarithms for (a) LFL and (b) HFL after splitting the test results into two parts.
A formula shown in [], used to describe the tensile curve, was also proposed for the analytical description of the presented test results. The present formula 1 is a slight modification of that originally proposed in []. This formula takes into account A and B constants, described by Equation (1). The coefficients n1′ and K1′ were used to determine plastic strain amplitude εap1, while the coefficients n2′ and K2′, listed in Table 2, were used to determine εap2. A graphical interpretation of the results obtained from Equation (1) is shown in Figure 20. Material parameters A and B are summarized in Table 2. A high coefficient of determination was obtained for the analyzed results, the value of which exceeded 0.75 in both cases.
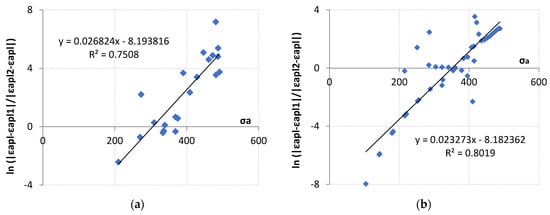
Figure 20.
Graphical interpretation of the determination of the material parameters A and B for (a) LFL test and (b) HFL test.
The parameters summarized in Table 2 allowed to describe the obtained test results using three analytical models. The first description was based on the Ramberg–Osgood Equation (2), where the cyclic mean modulus Em was used instead of the standard Young’s modulus. On the other hand, the second description was based on division of the Ramberg–Osgood curve into two parts (Equation (3)) according to the idea of determining K1′, K2′, n1′, and n2′ coefficients. For the last description, Soltysiak’s proposal 4 [], based on a slight modification of the formula originally introduced by Li [], was applied. This description was previously used to describe monotonic properties. Graphical interpretation of these descriptions is shown in Figure 21.
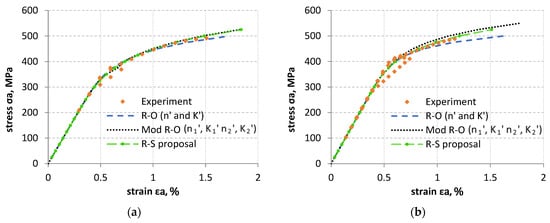
Figure 21.
Graphical interpretation of the mathematical description of the LFL (a) and HFL (b) test results using the Ramberg–Osgood (R–O) model, the R–O modification (Mod R–O) and Soltysiak’s proposal (R–S proposal).
When analyzing Figure 21, it is difficult to identify the model that best describes the experimental tests. In order to compare the models presented, the formula (5) was used to determine the percentage difference from the experimental results (PD, %). For several experimental points for a given value of experimental strain, the value of stress σa and strain εa were determined as the mean value. A perfect fit of the model to the experimental results means PD = 0%. Its graphical interpretation is shown in Figure 22.
where εai—total strain amplitude determined from individual R–O, Mod R–O, R–S proposal models, respectively.
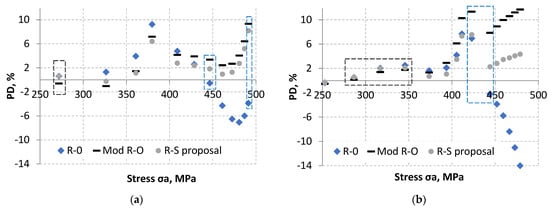
Figure 22.
Graphical interpretation of the percentage strain difference determined from analytical models in relation to experimental strain results for the LFL test (a) and HFL test (b).
The best model fit to experimental results for both the LFL and HFL test was obtained for the R–S proposal model. However, not all experimental points were better fitted using the R–S model. These points are marked in Figure 22 with black and blue rectangles. The black rectangles indicate data for which the experimental points were slightly better described by the R–O modification. The blue rectangles indicate data for which the experimental points were slightly better described by the R–O model.
4. Conclusions
The article presents an analysis of the outcomes for AA2519 aluminum alloy exposed to variable loads. The variable loads were implemented with a strain control program. One test was carried out with higher strain control resulting in lower fatigue life (LFL test), while the other involved testing at lower strain values, resulting in higher fatigue life (HFL test). The test results obtained were described by several analytical models. As a result of the analysis, the following conclusions have been reached.
The tested material is characterized by cyclic hardening, which was evident at individual levels of the control variable εa, especially in the strain range of 0.5–1.3%, where a cyclic increase in the stress amplitude predominated. This is also evidenced by the maximum values of stress amplitude recorded for LFL and HFL tests, which are 3.4% and 2.8% higher than the ultimate strength of the tested material, respectively.
A change in the direction of mean stress relaxation as a function of the control strain was observed. When the control strain amplitude increased to approximately 0.8%, the mean stress value decreases, but above this value, it begins to increase again. The relaxation of the mean value towards a positive value at such high strain values may be caused by the appearance of cracks visible in certain areas of fractures, which are large stress concentrators and are accompanied by large strain necessary to achieve forced control strain. These processes can decrease the compression strength of the material and increase its tension strength (harden it).
The intersection points of linear correlations describing cyclic moduli as a function of the plastic strain amplitude and linear correlations of the control strain amplitude as a function of the plastic strain amplitude can become a criterion describing the change in material properties for selected cyclically unstable materials and such materials that are not loaded using multiple steps with increasing/decreasing strain.
Analysis of the fractures of the LFL and HFL test specimens showed that they were similar, although differences were also found. The similarities include the complex topographic structure of the fracture. In both cases, the fractures included a zone of the crack at the ultimate tensile strength. The differences, on the other hand, included primary cracks and one visible secondary crack within the entire volume of the material, found in the fracture of the LFL test specimen. It should also be stressed that when analyzing the fracture of the LFL test specimen, the dimples were more difficult to see than in the HFL test specimen. The set of fracture features indicates that the LFL test specimen was subjected to higher plastic load virtually until the end of the fatigue life and may have temporarily weakened during the experiment due to a reduction in cohesion forces within the material resulting from secondary cracks. The HFL test specimen, on the other hand, did not show this feature, which indicates that in the final phase of the experiment the material reached cyclic equilibrium.
The mean value of cyclic yield strength for tensile cycles is comparable to that of tensile yield strength. Therefore, it can be assumed that the yield strength value derived from the monotonic tensile test does not introduce significant error into the characterization of cyclic properties. However, it should be noted that the mean value of cyclic tensile yield strength is lower than the mean value of cyclic compressive yield strength, which may be related to mean stress relaxation.
The proposed material model, which is based on material constants A and B to describe cyclic properties of the material and the cyclic modulus Em calculated from the first stage demonstrates good compliance with experimental results. Moreover, the proposed model enables the description of material properties using a single equation which facilitates its application in engineering analyses.
Author Contributions
Conceptualization, R.S.; methodology, R.S.; validation, R.S.; formal analysis, R.S.; investigation, M.K., R.S. and J.M.; writing—original draft preparation, R.S. and M.K. (Section 3.6); writing—review and editing, R.S. and J.M.; visualization, R.S. and M.K.; supervision, R.S.; project administration, R.S. All authors have read and agreed to the published version of the manuscript.
Funding
This research received no external funding.
Data Availability Statement
The data supporting the findings of this study are contained within the article. Further inquiries can be directed to the corresponding author.
Conflicts of Interest
The authors declare no conflicts of interest.
References
- Kosturek, R.; Śnieżek, L.; Torzewski, J.; Wachowski, M. Microstructure and Fatigue Properties of AA2519-O Friction Stir Welded Joint. Mater. Today Proc. 2020, 28, 1064–1067. [Google Scholar] [CrossRef]
- Szachogluchowicz, I.; Sniezek, L.; Slezak, T.; Kluczyński, J.; Grzelak, K.; Torzewski, J.; Fras, T. Mechanical Properties Analysis of the AA2519-AA1050-Ti6Al4V Explosive Welded Laminate. Materials 2020, 13, 4348. [Google Scholar] [CrossRef] [PubMed]
- Owolabi, G.M.; Thom, M.; Ajide, O.; Kumar, N.; Azimi, A.; Whitworth, H.; Warner, G. Fatigue Responses of Three AA 2000 Series Aluminum Alloys. J. Mater. Sci. Chem. Eng. 2019, 7, 32–48. [Google Scholar] [CrossRef]
- Boroński, D.; Kotyk, M.; Maćkowiak, P.; Śnieżek, L. Mechanical Properties of Explosively Welded AA2519-AA1050-Ti6Al4V Layered Material at Ambient and Cryogenic Conditions. Mater. Des. 2017, 133, 390–403. [Google Scholar] [CrossRef]
- Pejkowski, Ł.; Kotyk, M. Strain-Controlled Uniaxial Fatigue of an AA2519 Aluminium Alloy Sheet. Bull. Pol. Acad. Sci. Tech. Sci. 2025, 73, 154271. [Google Scholar] [CrossRef]
- Boroński, D. Local Mechanical Properties of Explosively Welded AA2519-AA1050-Ti6Al4V Layered Material. Weld. World 2020, 64, 2083–2099. [Google Scholar] [CrossRef]
- Sniezek, L.; Szachogluchowicz, I.; Wachowski, M.; Torzewski, J.; Mierzynski, J. High Cycle Fatigue Properties of Explosively Welded Laminate AA2519/AA1050/Ti6Al4V. Procedia Struct. Integr. 2017, 5, 422–429. [Google Scholar] [CrossRef]
- Szachogluchowicz, I.; Sniezek, L.; Hutsaylyuk, V. Low Cycle Fatigue Properties Laminate AA2519-TI6AL4V. Procedia Eng. 2015, 114, 26–33. [Google Scholar] [CrossRef]
- PN-H-04334:1984; Badania Niskocyklowego Zmęczenia Metali. Polski Komitet Normalizacyjny: Warszawa, Poland, 1984.
- ASTM E606/E606M-12; Standard Test Method for Strain-Controlled Fatigue Testing. ASTM International: West Conshohocken, PA, USA, 2021.
- Landgraf, R.; Morrow, J.; Endo, T. Determination of Cyclic Stress-Strain Curve. J. Mater. 1969, 4, 176–188. [Google Scholar]
- Jones, A.; Hudd, R.C. Cyclic Stress-Strain Curves Generated from Random Cyclic Strain Amplitude Tests. Int. J. Fatigue 1999, 21, 521–530. [Google Scholar] [CrossRef]
- Polák, J.; Hajek, M. Cyclic Stress-Strain Curve Evaluation Using Incremental Step Test Procedure. Int. J. Fatigue 1991, 13, 216–222. [Google Scholar] [CrossRef]
- Klesnil, M.; Lukáš, P. Fatigue of Metallic Materials; Elsevier: Amsterdam, The Netherlands, 1992; ISBN 978-0-444-98723-5. [Google Scholar]
- Shojaei, A.R.; Eslami, M.; Mahbadi, H. Cyclic Loading of Beams Based on the Chaboche Model. Int. J. Mech. Mater. Des. 2010, 6, 217–228. [Google Scholar] [CrossRef]
- Chaboche, J.L. A Review of Some Plasticity and Viscoplasticity Constitutive Theories. Int. J. Plast. 2008, 24, 1642–1693. [Google Scholar] [CrossRef]
- Ramberg, W.; Osgood, W.R. Description of Stress-Strain Curves by Three Parameters; Technical note; National Advisory Committee for Aeronautics: Washington, DC, USA, 1943. [Google Scholar]
- Walat, K.; Łagoda, T.; Karolczuk, A. Fatigue Life According to Cyclic Strain Characteristics Determined from Variable-Amplitude Loading. Mater. Test. 2009, 51, 286–290. [Google Scholar] [CrossRef]
- ASTM E111; Standard Test Method for Young’s Modulus, Tangent Modulus, and Chord Modulus. ASTM International: West Conshohocken, PA, USA, 2017.
- Maletta, C.; Sgambitterra, E.; Furgiuele, F.; Casati, R.; Tuissi, A. Fatigue Properties of a Pseudoelastic NiTi Alloy: Strain Ratcheting and Hysteresis under Cyclic Tensile Loading. Int. J. Fatigue 2014, 66, 78–85. [Google Scholar] [CrossRef]
- Bönisch, M.; Calin, M.; van Humbeeck, J.; Skrotzki, W.; Eckert, J. Factors Influencing the Elastic Moduli, Reversible Strains and Hysteresis Loops in Martensitic Ti–Nb Alloys. Mater. Sci. Eng. C 2015, 48, 511–520. [Google Scholar] [CrossRef]
- Sołtysiak, R. Effect of the Load Character and Cryogenic Temperature on Elastic Properties of Ti-6Al-4V Titanium Alloy. In Proceedings of the 24th International Conference on Engineering Mechanics 2018, Svratka, Czech Republic, 14 May 2018; pp. 789–792. [Google Scholar]
- Hales, R.; Holdsworth, S.R.; O’Donnel, M.P.; Perrin, I.J.; Skelton, R.P. A Code of Practice for the Determination of Cyclic Stress-Strain Data. Mater. High Temp. 1993, 19, 165–185. [Google Scholar] [CrossRef]
- Sołtysiak, R.; Małecka, J. The Analysis of Cyclic Properties of Ti-6Al-4V Titanium Alloy at Room and Liquid Nitrogen Temperature. Mater. Sci. Eng. A 2018, 734, 476–484. [Google Scholar] [CrossRef]
- Stoica, L.; Radu, V.; Nitu, A.; Ionescu, V.; Toma, D. A New Approach to Obtain Ramberg-Osgood Constitutive Equation for Materials Used in Structural Components of Nuclear Reactors. J. Nucl. Res. Dev. 2021, 20, 65–68. [Google Scholar]
- Ye, J.; Yang, R.; Liu, Y.; Quan, G.; Wang, Z.; Zhao, Y. Stress-Strain Characterization of Wire and Arc Additively Manufactured Aluminium Alloys Using the Ramberg-Osgood Model. J. Build. Eng. 2025, 105, 112519. [Google Scholar] [CrossRef]
- Rasmussen, K.J.R. Full-Range Stress–Strain Curves for Stainless Steel Alloys. J. Constr. Steel Res. 2003, 59, 47–61. [Google Scholar] [CrossRef]
- Abdella, K. Inversion of a Full-Range Stress–Strain Relation for Stainless Steel Alloys. Int. J. Non-Linear Mech. 2006, 41, 456–463. [Google Scholar] [CrossRef]
- Kang, L.; Zhang, C.; Bradford, M.A.; Liu, X. Full-Range Stress–Strain Relationship and Fracture Model for Laser Cladding Additively Manufactured 316L Stainless Steel Sheets. Eng. Struct. 2023, 297, 116997. [Google Scholar] [CrossRef]
- Hradil, P.; Talja, A.; Real, E.; Mirambell, E.; Rossi, B. Generalized Multistage Mechanical Model for Nonlinear Metallic Materials. Thin-Walled Struct. 2013, 63, 63–69. [Google Scholar] [CrossRef]
- Li, T.; Zheng, J.; Chen, Z. Description of Full-Range Strain Hardening Behavior of Steels. SpringerPlus 2016, 5, 1316. [Google Scholar] [CrossRef] [PubMed]
- Sołtysiak, R. Analysis of Structure and Material Properties in Individual Zones of Welded Joint. J. Constr. Steel Res. 2021, 187, 106978. [Google Scholar] [CrossRef]
- Boroński, D.; Dzioba, I.; Kotyk, M.; Krampikowska, A.; Pała, R. Investigation of the Fracture Process of Explosively Welded AA2519–AA1050–Ti6Al4V Layered Material. Materials 2020, 13, 2226. [Google Scholar] [CrossRef]
- Kotyk, M. Analytic Model of Maximal Experimental Value of Stress Intensity Factor KQ for AA2519–AA1050–Ti6Al4V Layered Material. Materials 2020, 13, 4439. [Google Scholar] [CrossRef]
- Kosturek, R.; Śnieżek, L.; Torzewski, J.; Ślęzak, T.; Wachowski, M.; Szachogłuchowicz, I. Research on the Properties and Low Cycle Fatigue of Sc-Modified AA2519-T62 FSW Joint. Materials 2020, 13, 5226. [Google Scholar] [CrossRef]
- Kumar, N. Tensile Properties and Fractography of Three AA 2000 Series Aluminum Alloys Used for Aerospace Applications. Trans. Indian Inst. Met. 2019, 72, 2623–2630. [Google Scholar] [CrossRef]
Disclaimer/Publisher’s Note: The statements, opinions and data contained in all publications are solely those of the individual author(s) and contributor(s) and not of MDPI and/or the editor(s). MDPI and/or the editor(s) disclaim responsibility for any injury to people or property resulting from any ideas, methods, instructions or products referred to in the content. |
© 2025 by the authors. Licensee MDPI, Basel, Switzerland. This article is an open access article distributed under the terms and conditions of the Creative Commons Attribution (CC BY) license (https://creativecommons.org/licenses/by/4.0/).