
Fatigue Failure Criteria of Asphalt Binders and Asphalt Mixtures: A Comprehensive Review


 ,
,
Abstract
1. Introduction
2. Fatigue Test Methods


| Loading Mode/Test Method | Schematic Diagram | Material Type | References |
|---|---|---|---|
| Uniaxial compression/tension (UT/UC) | 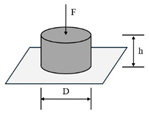 | AC | [26,33,52,53] |
| Beam bending (BB) | 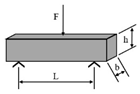 Three-point bending (3PB) | AC | [54,55] |
 Four-point bending (4PB) | [34,35] | ||
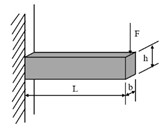 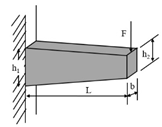 Two-point bending (2PB) | [56,57,58,59] | ||
| Indirect tensile (IDT) |  | AC | [60,61,62,63] |
| Dynamic shearing (DS) | 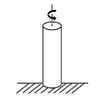 | AC | [64,65,66] |
| Semi-circular bending (SCB) | 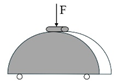 | AC | [41,67] |
| Dynamic mechanical analyzer (DMA) | 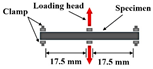 | FAM | [51,68] |
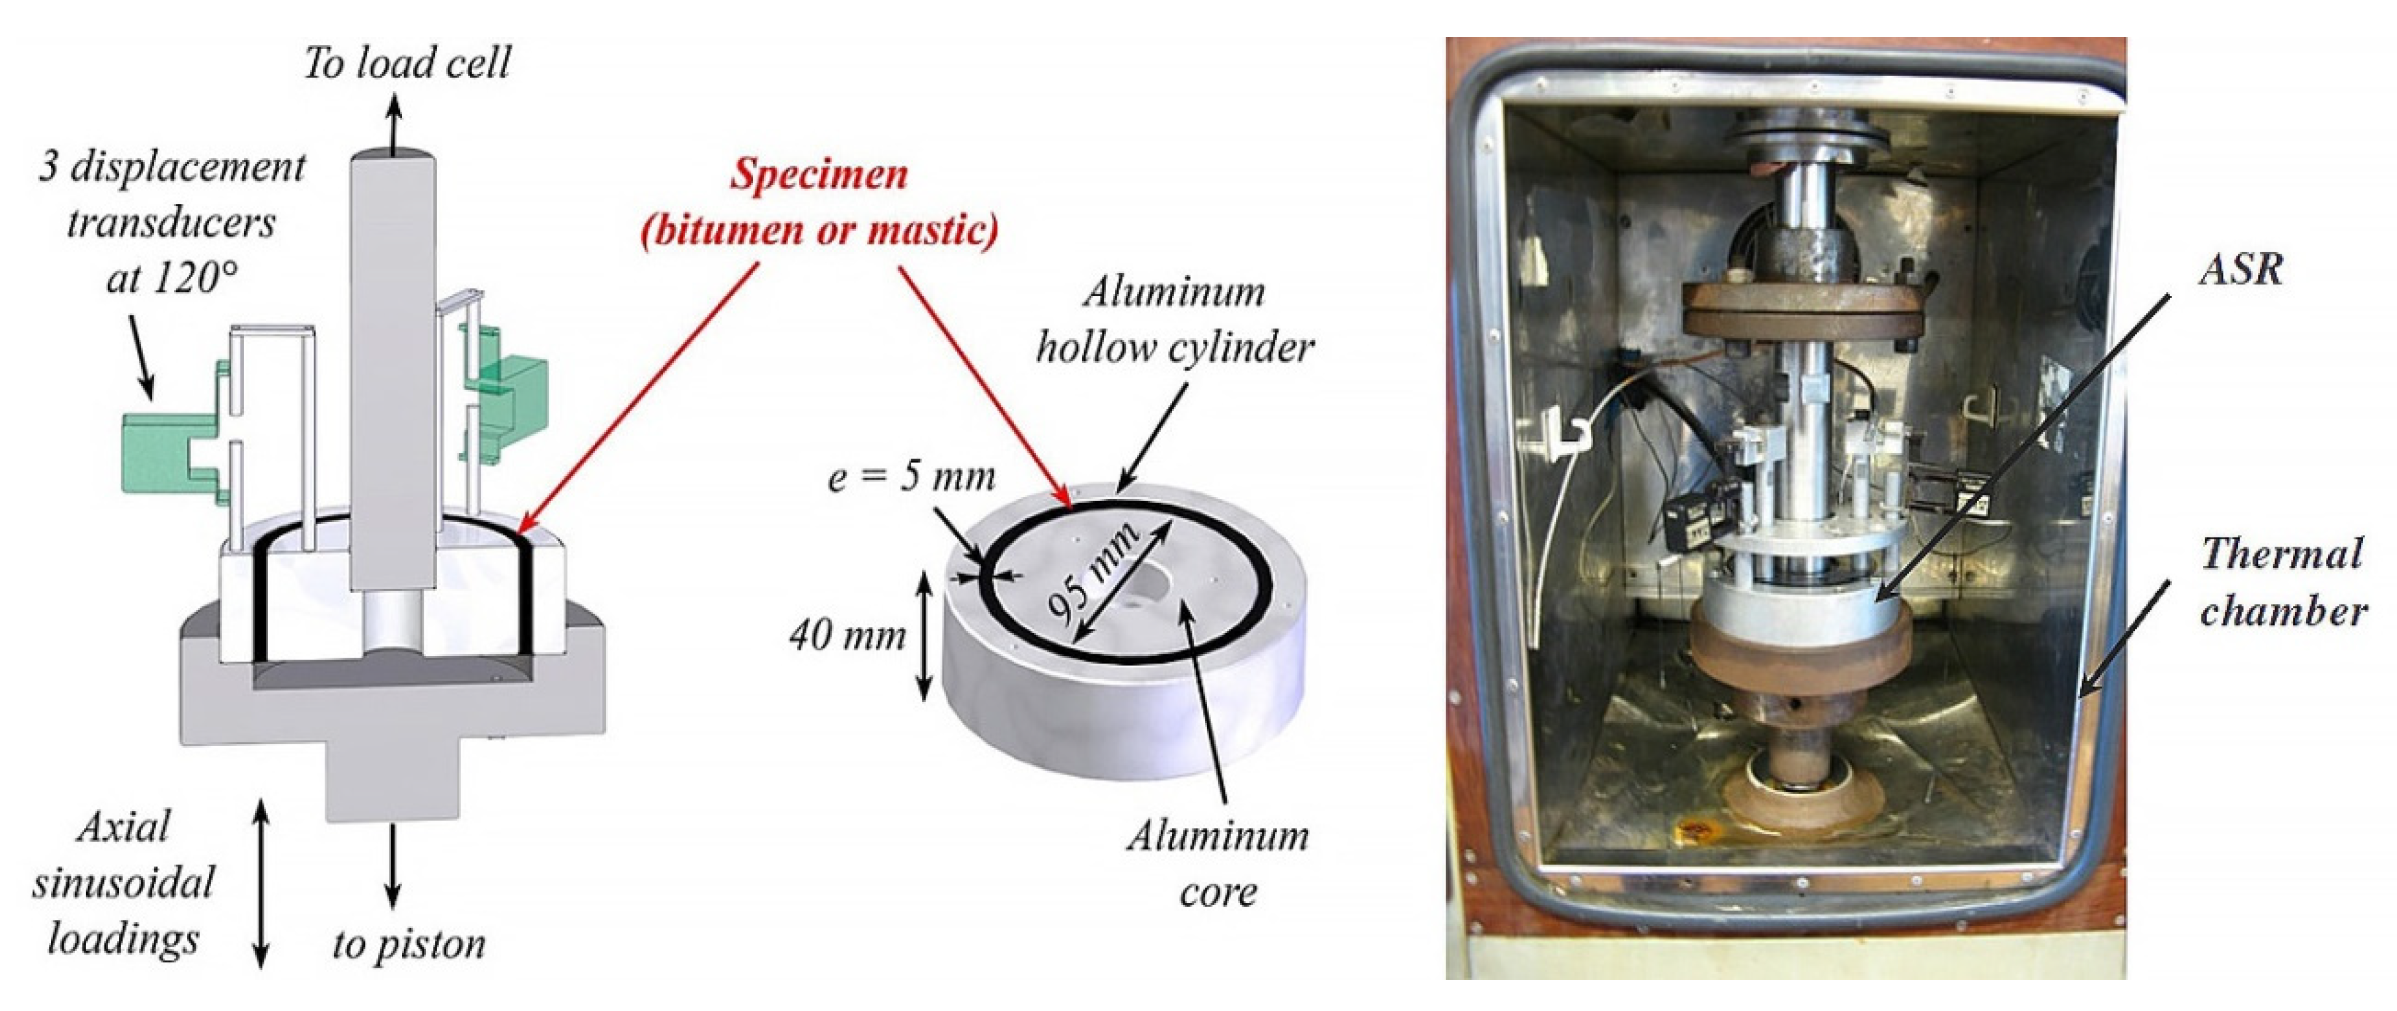
| Annular shear rheometer (ASR) |  | Asphalt or mastic | [49,69,70] |
| Linear Amplitude Sweep (LAS) | 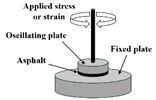 | Asphalt | [71,72] |
3. Failure Criteria for Fatigue Approaches
3.1. Phenomenological Approaches
3.1.1. Failure Criteria of Basic Fatigue Models
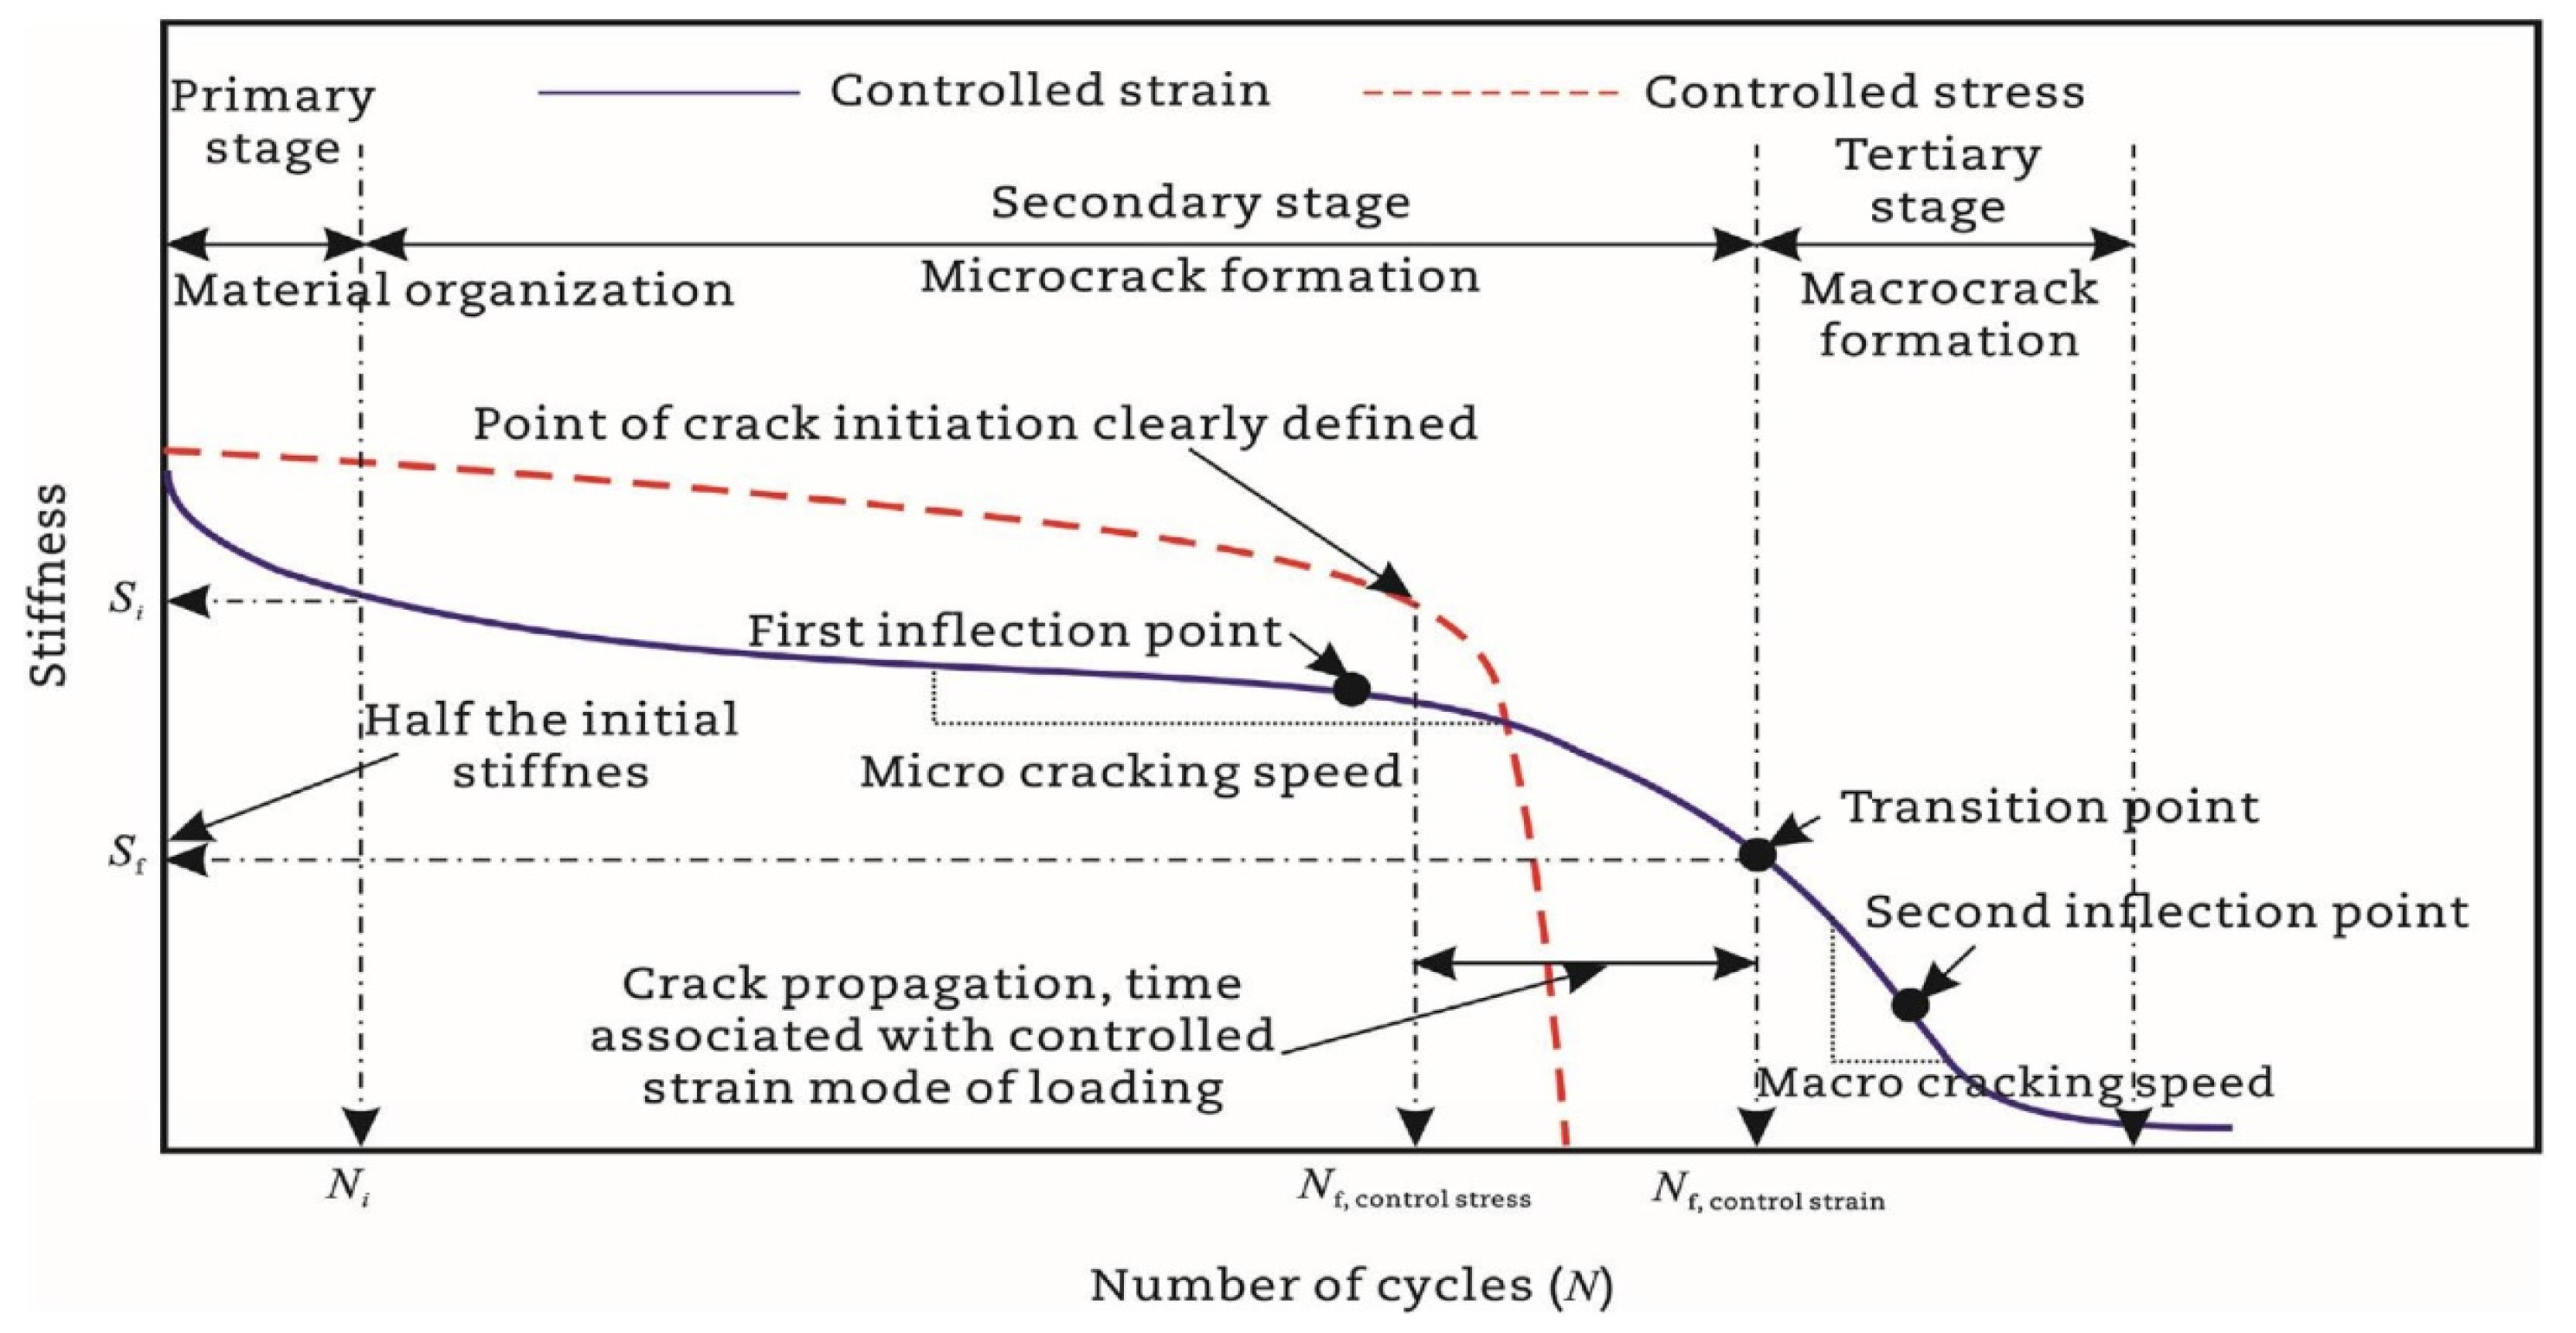
- Phase I (adaptation) exhibits rapid stiffness degradation. The two biasing phenomena, including heating caused by energy dissipation and binder thixotropy, can be interpreted for the sudden loss in stiffness [52]. When the test is paused at this stage, this loss of stiffness can be easily recovered;
- Phase II (quasi-stationary) exhibits progressive quasi-linear stiffness decay. Concurrently, microcrack nucleation emerges as the defining fatigue mechanism during this stage;
- Phase III (failure) is characterized by the catastrophic propagation of coalescence-induced macro-cracks beyond a critical damage threshold. The fatigue test cannot be considered homogenous anymore.

| Criteria | Indicator | Schematic Diagram | References |
|---|---|---|---|
| Stiffness modulus reduction criteria | Stiffness modulus | 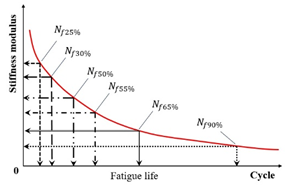 | [28,31,111,112] |
| Pseudo stiffness | 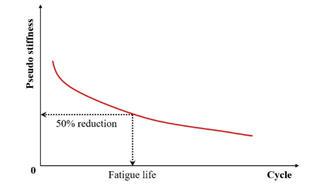 | [114,115] | |
| Local modulus |  | [123] | |
| Complete fracture | 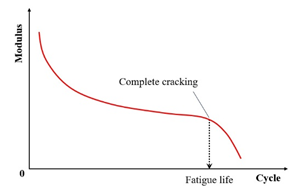 | [31] | |
| Strain | 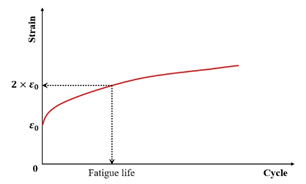 | [98] | |
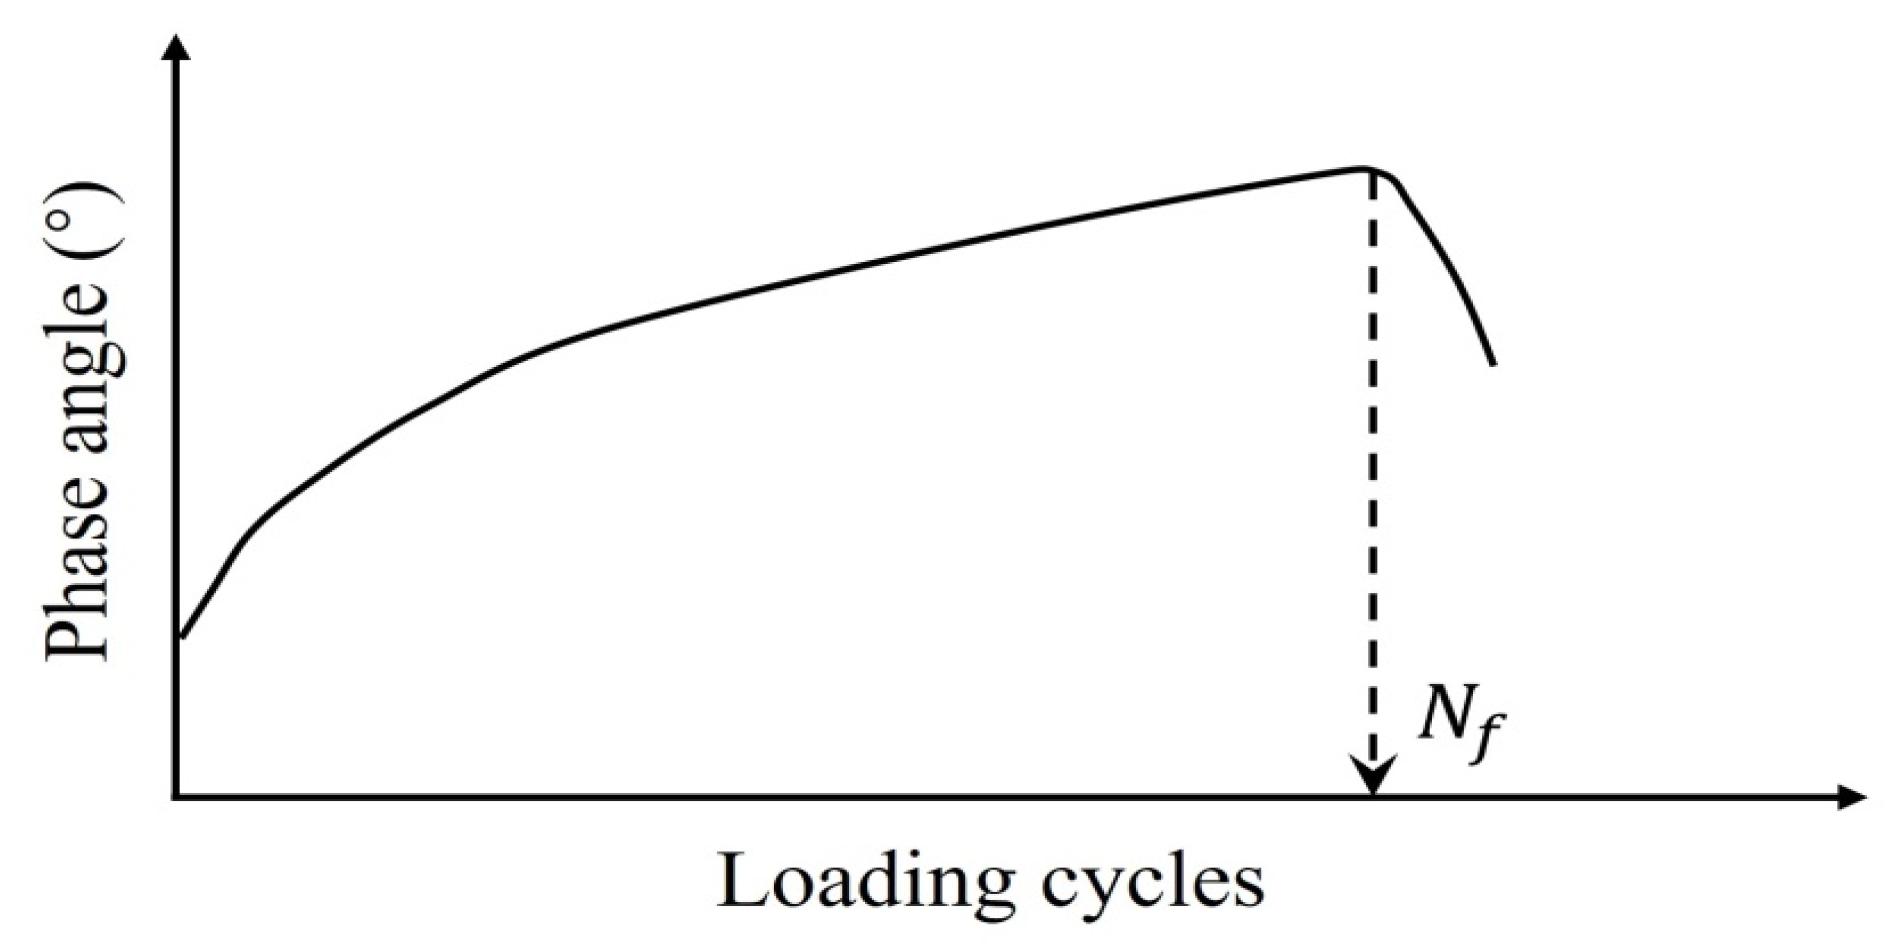
| Phase angle criterion | Phase angle |  | [19,31,132] |
| Fitting change point criterion | value/se value | 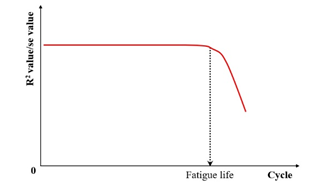 | [134,137] |
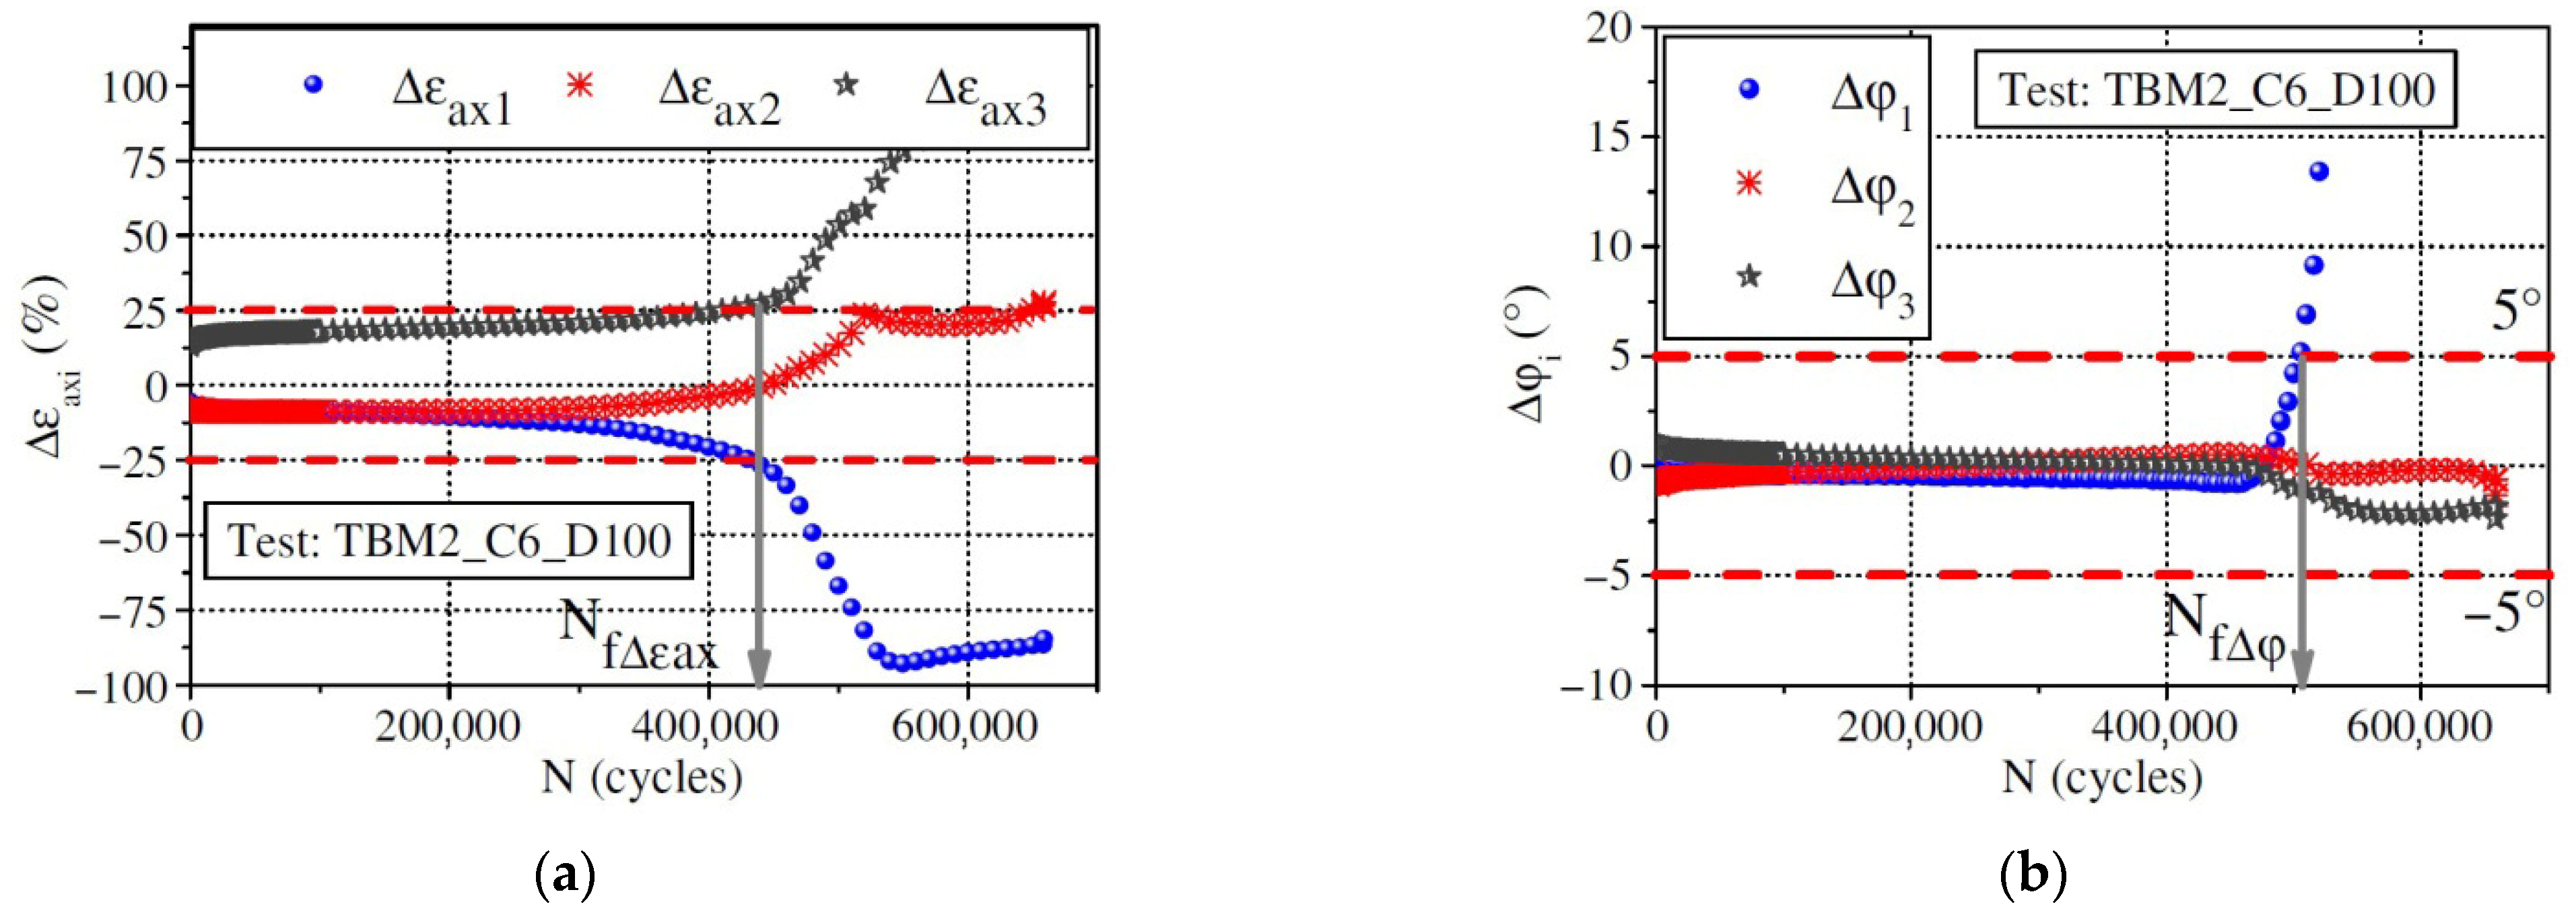
| Specimen homogeneity criterion | Axial strain amplitude differences ( ) | 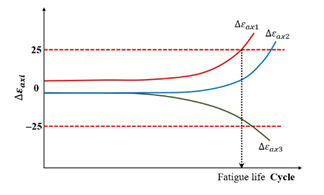 | [135,136] |
| Phase angle axial displacement differences ( ) | 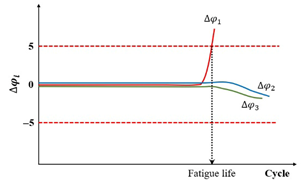 |
3.1.2. Failure Criteria of Energy-Based Models

3.2. Mechanistic Approaches
3.2.1. Fracture Mechanics Models
3.2.2. Viscoelastic Continuum Damage (VECD) Model
3.3. Recommendations for Fatigue Failure Criteria
4. Discussion and Conclusions
- The academic community currently lacks a consensus regarding the standardized definition of fatigue failure criteria for asphalt binders and mixtures. These criteria are employed to establish a critical failure point, corresponding to a specific number of loading cycles (), which represents an equivalent damage state at the conclusion of fatigue testing. An effective criterion must demonstrate robustness across diverse experimental conditions, including variations in loading modes (e.g., stress- vs. strain-controlled), temperature regimes, applied strain or stress amplitudes, and testing protocols;
- The determination of fatigue failure criteria is intrinsically contingent upon the specific analytical framework employed (e.g., dissipated energy theory, continuum damage mechanics). Consequently, the selection of an appropriate criterion necessitates rigorous methodological justification, as no universal criterion possesses sufficient generalizability to encompass all modeling paradigms;
- Phenomenological models demonstrate statistically comparable fatigue life predictions ( values) under identical experimental conditions. The widespread adoption of the stress degradation ratio criterion in such frameworks stems from its operational merits: (1) simplified instrumentation requirements enabling robust measurement, (2) accelerated testing protocols through early failure state identification, and (3) critical compatibility with macro-crack propagation scenarios where fracture planes develop beyond the detection range of axial strain sensors;
- While the phase angle criterion lacks predictive capacity for fatigue failure progression, it operationally defines failure thresholds through post hoc experimental determination, thus falling under an empirically derived classification. Conversely, the failure criteria developed within viscoelastic continuum damage (VECD) modeling frameworks constitute theoretically derived classifications, as they emerge from mechanistic analyses of damage accumulation processes. Furthermore, the standard implementation criteria presented in the existing specification (AASHTO) need to be given greater emphasis and integrated into pavement design software for improved implementation;
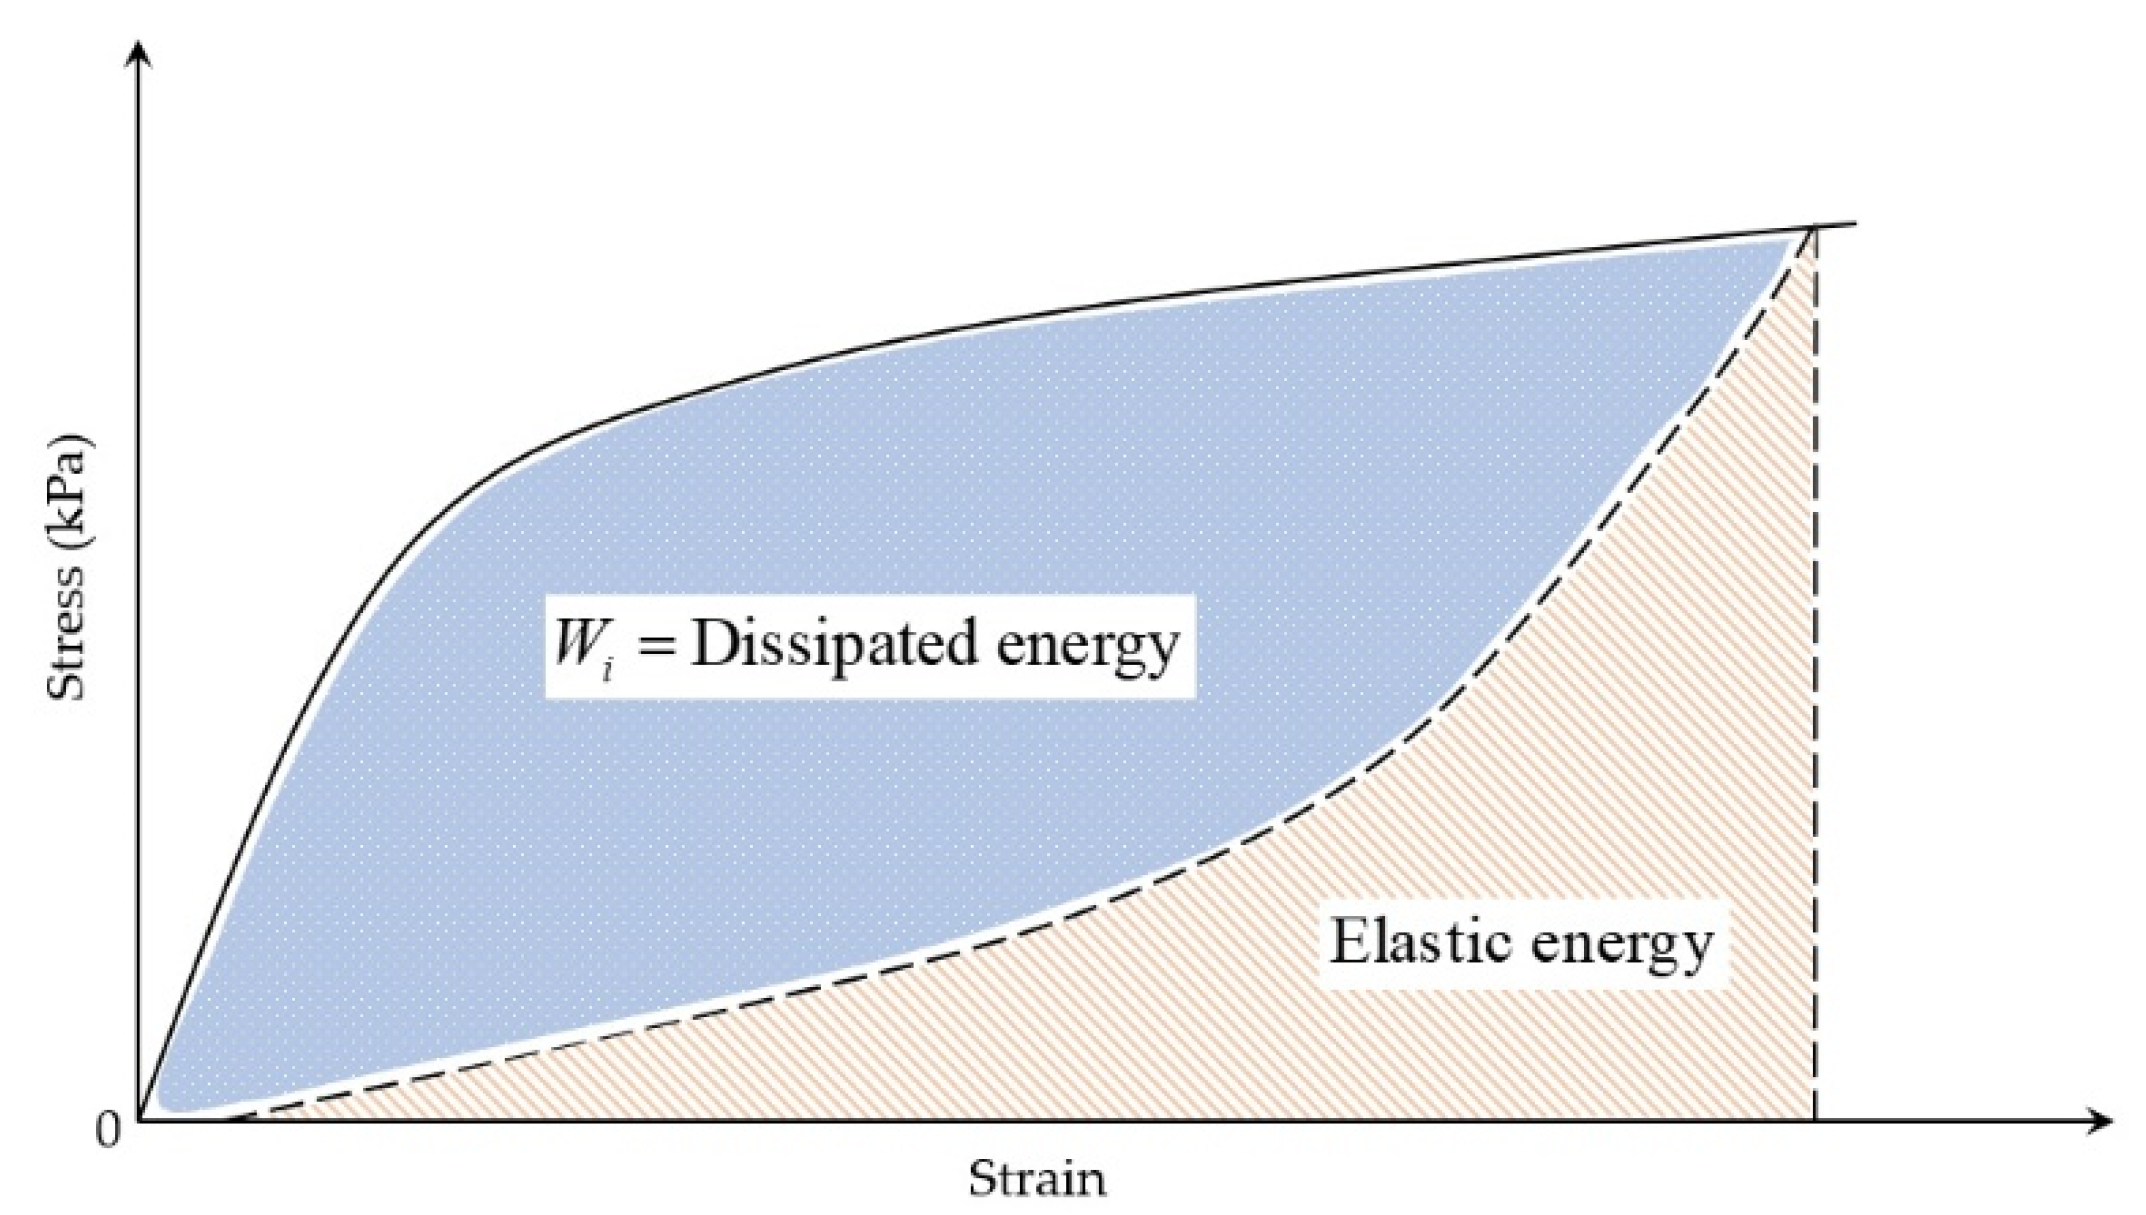
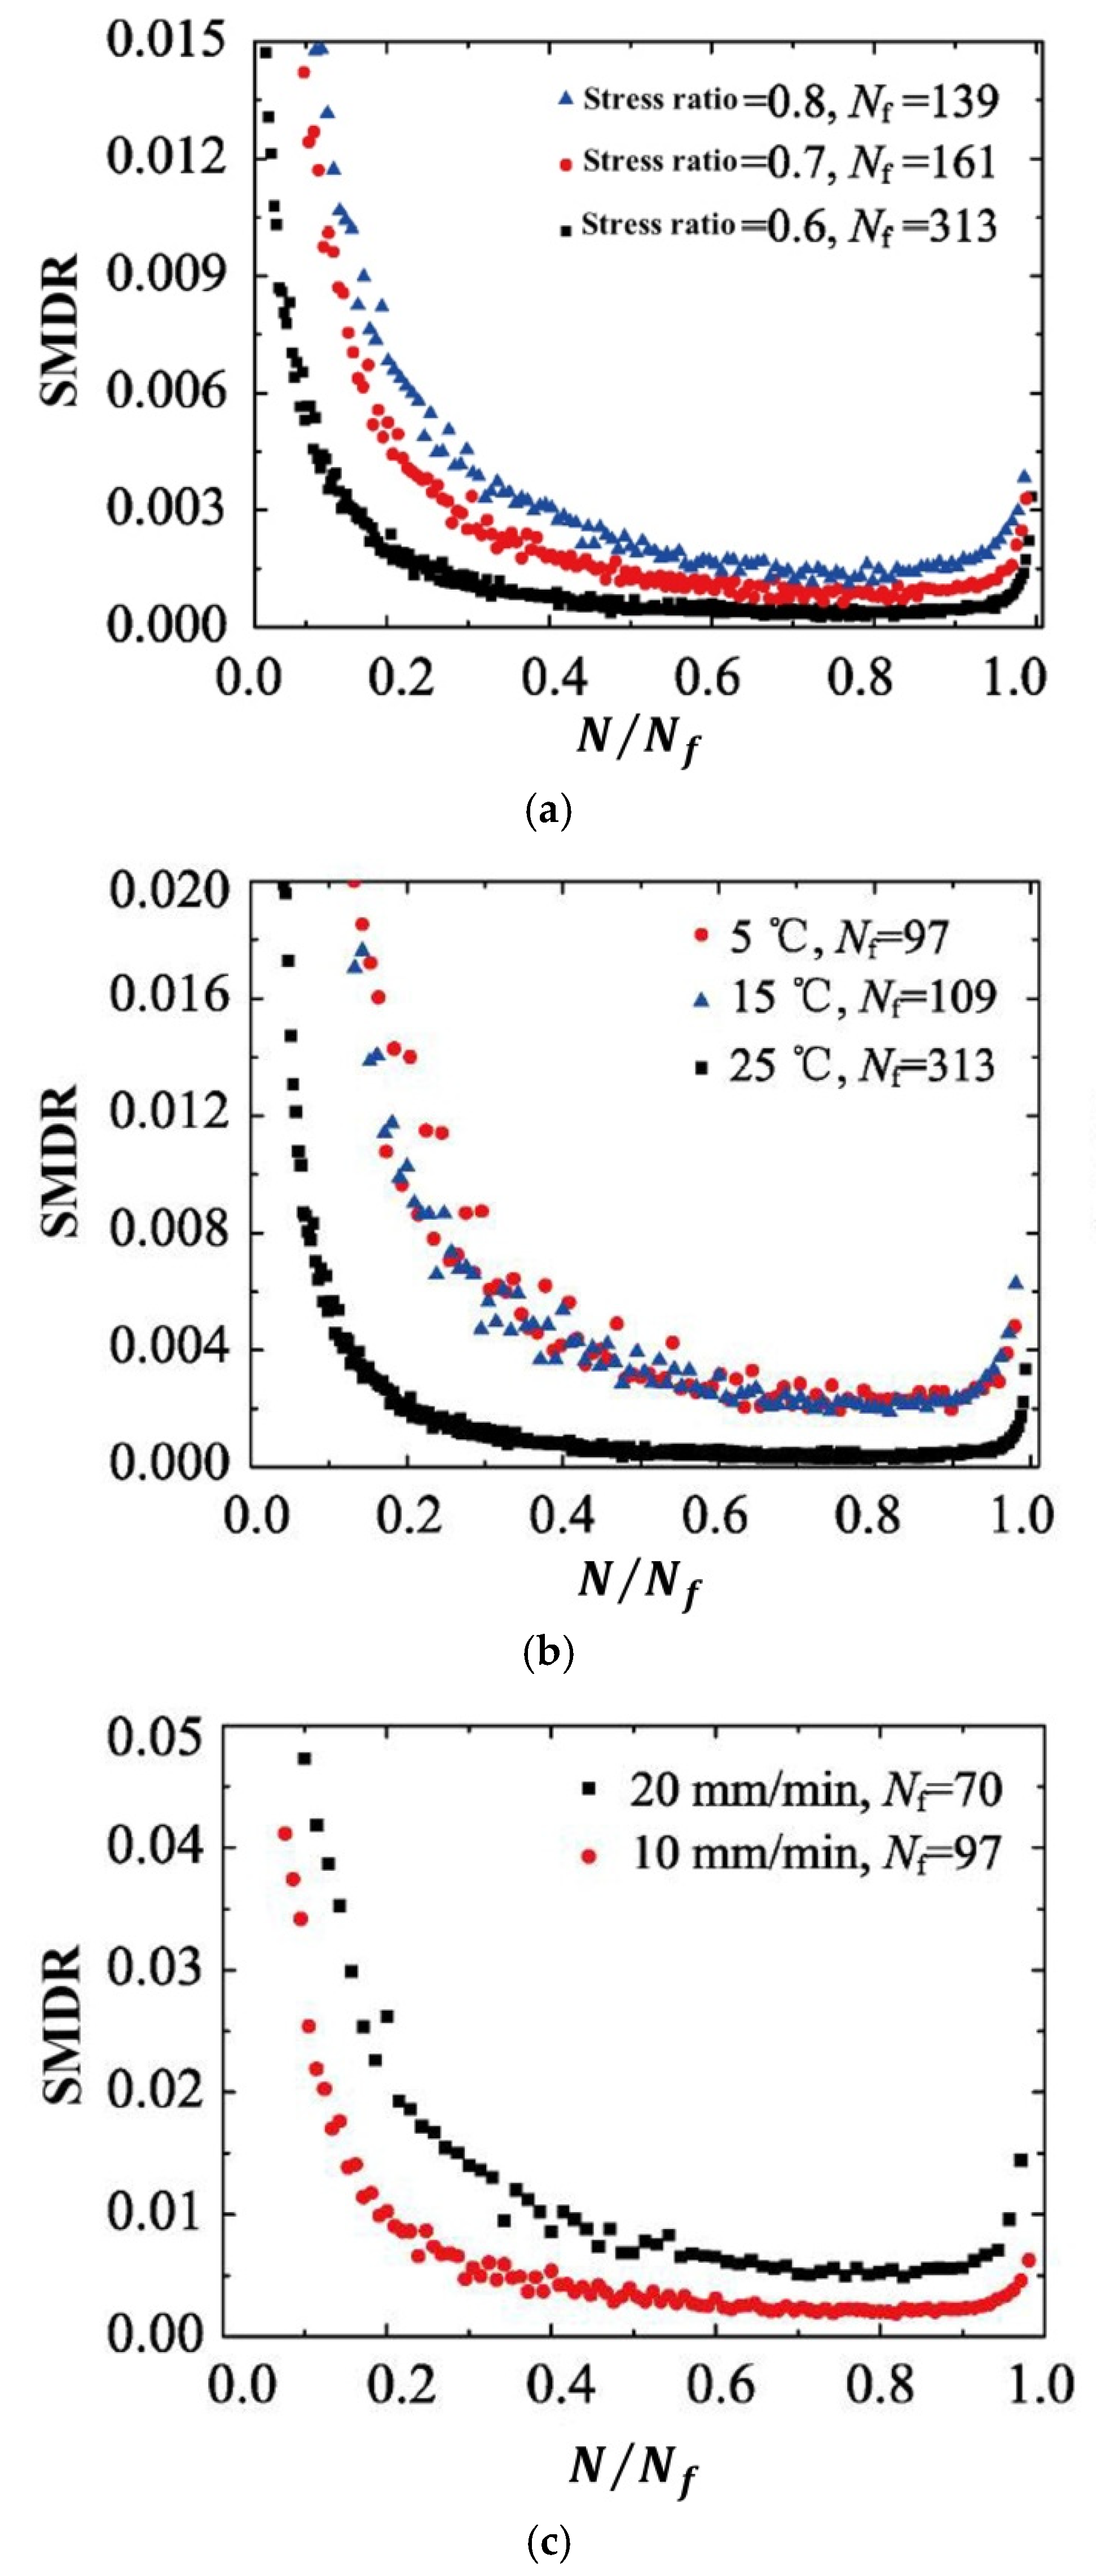
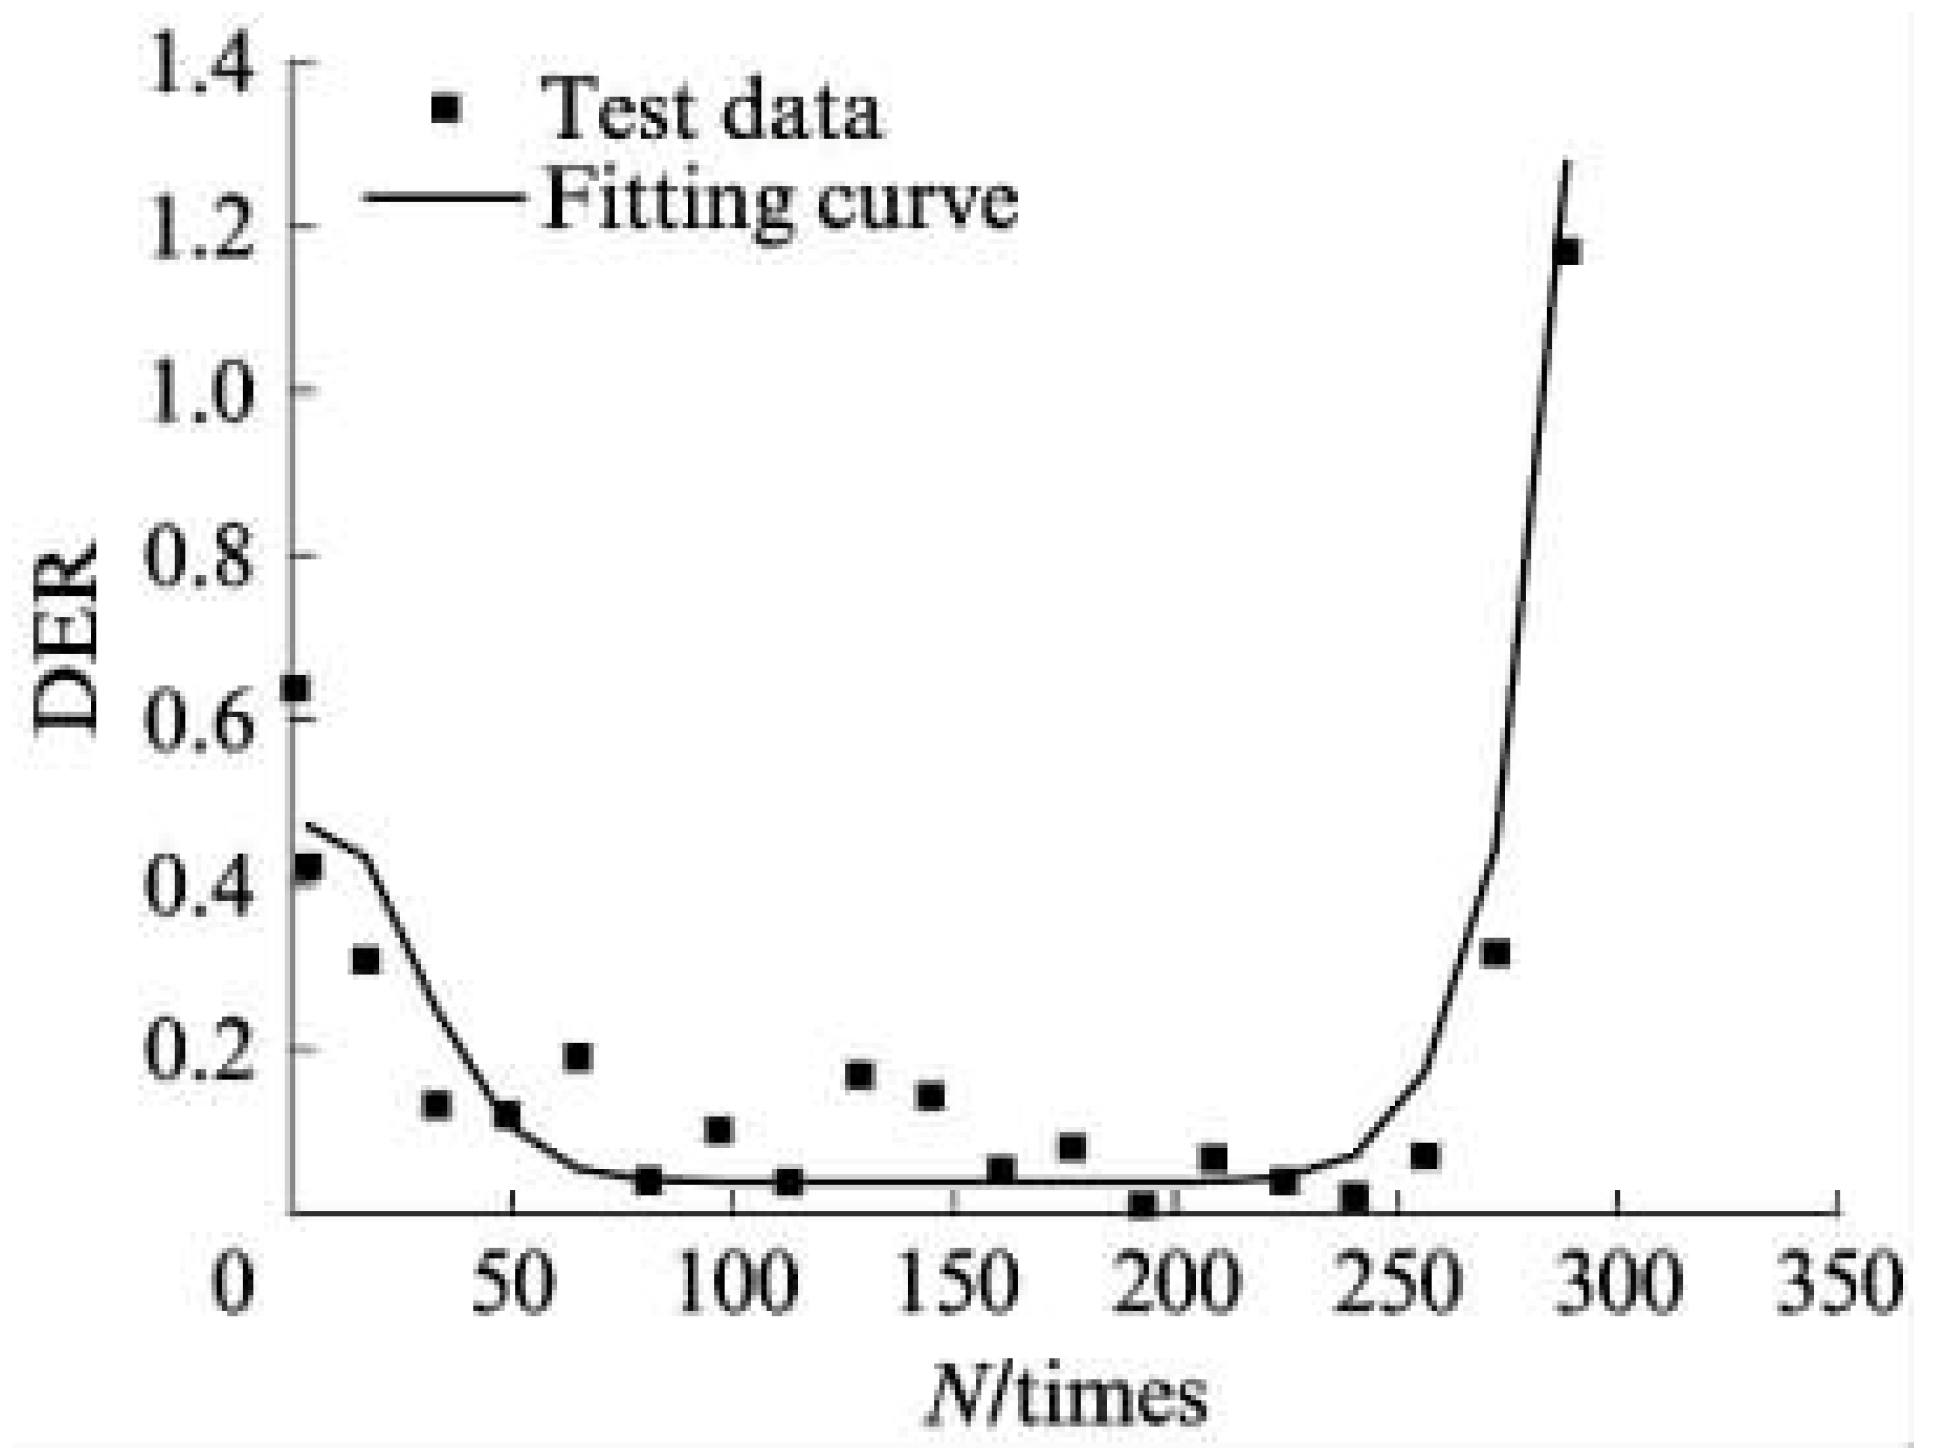
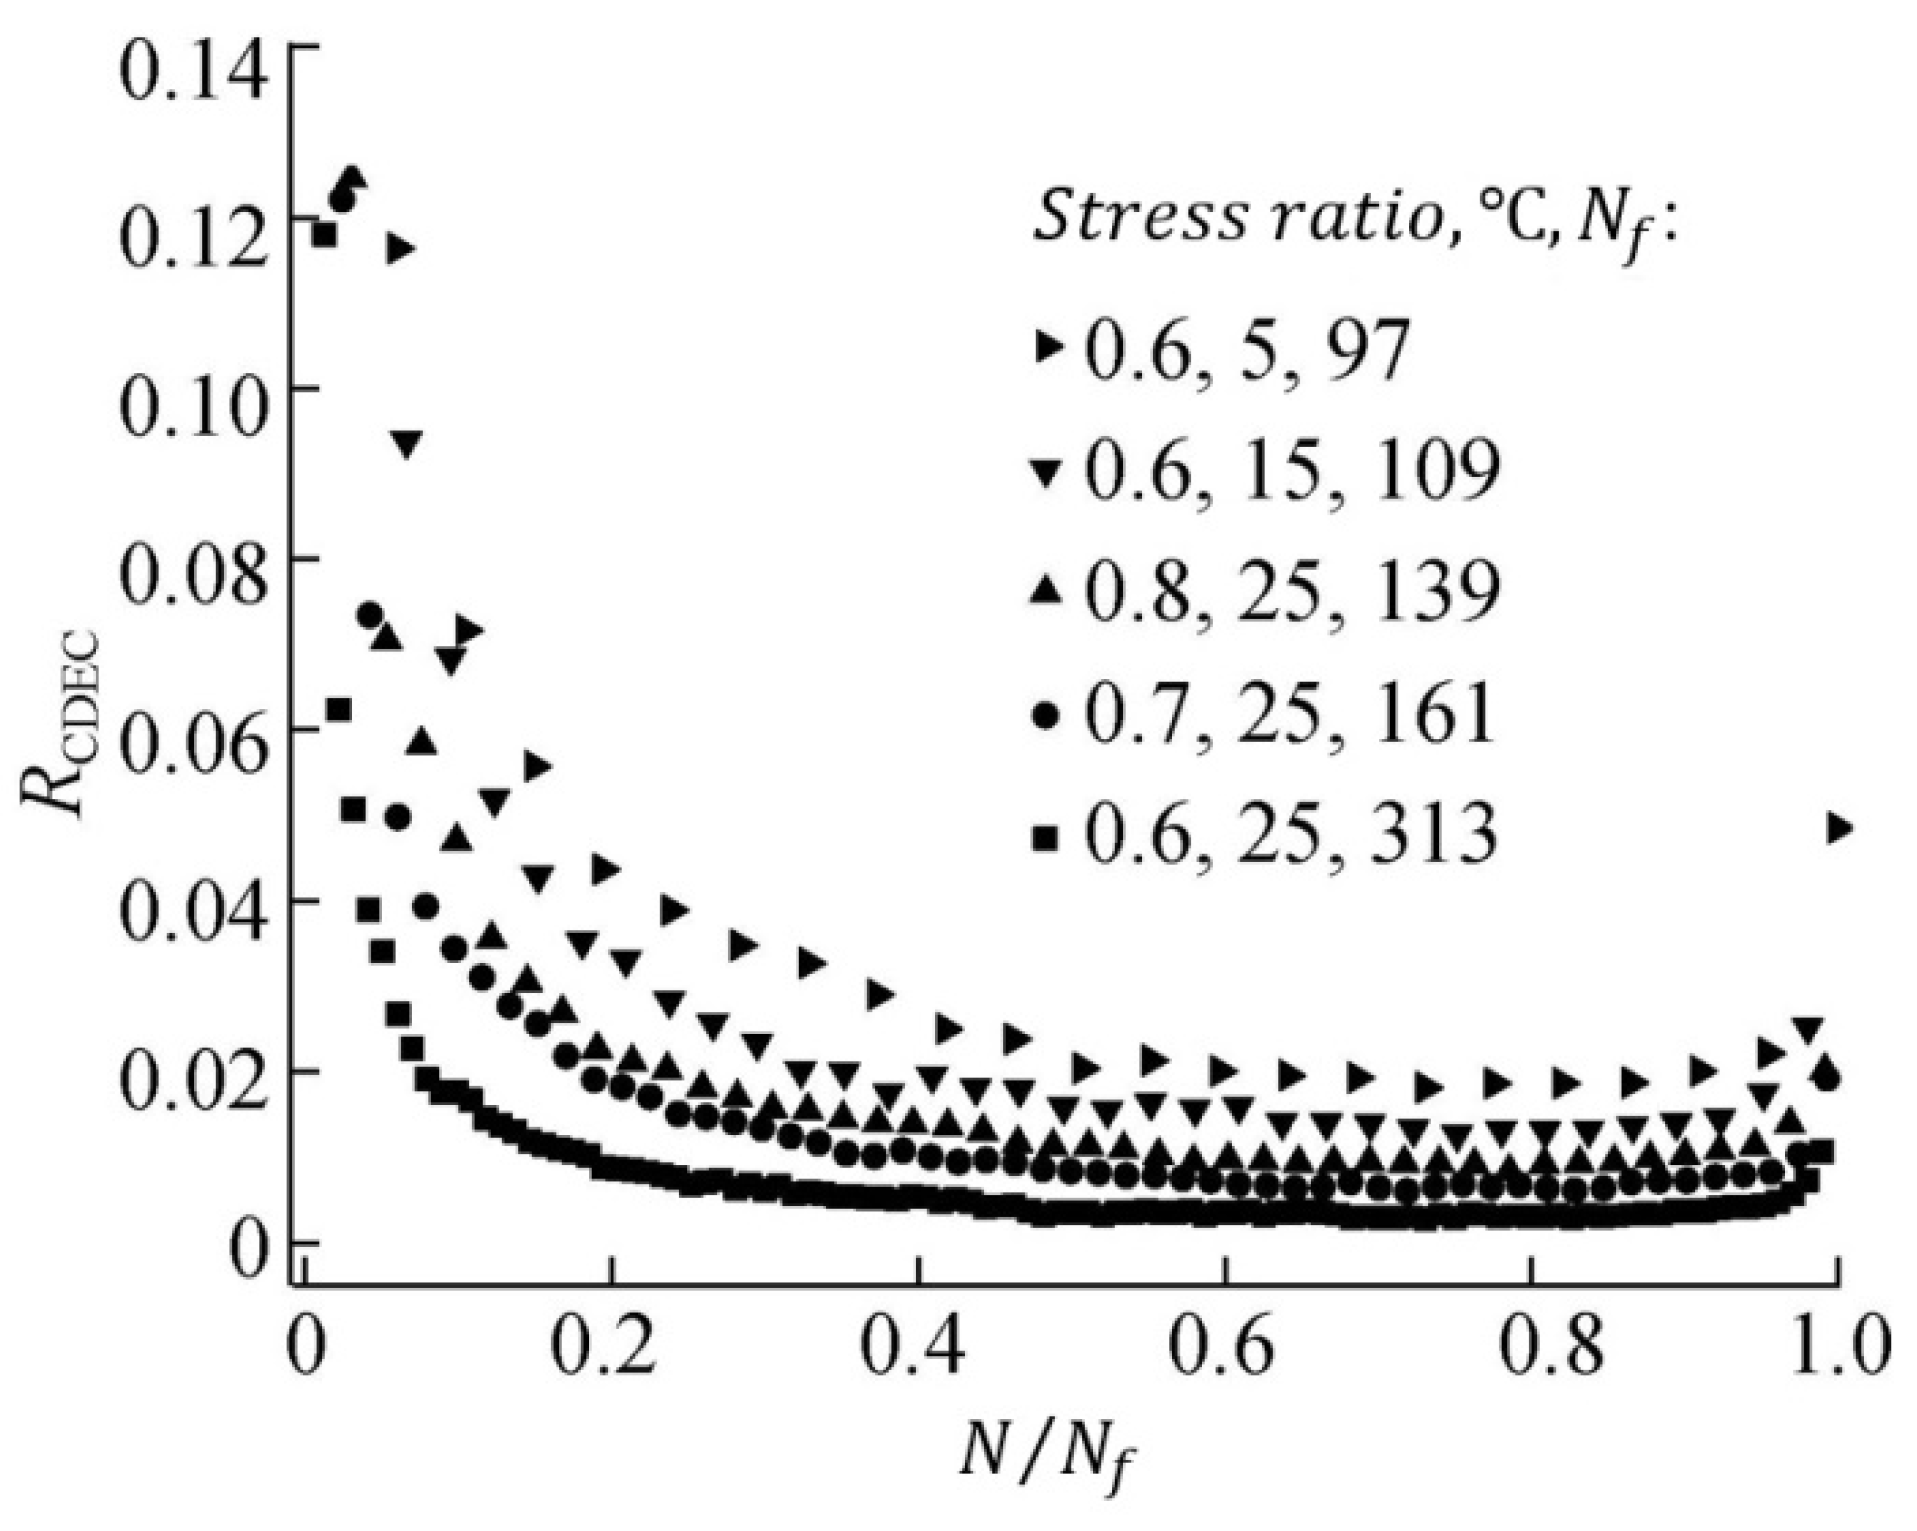
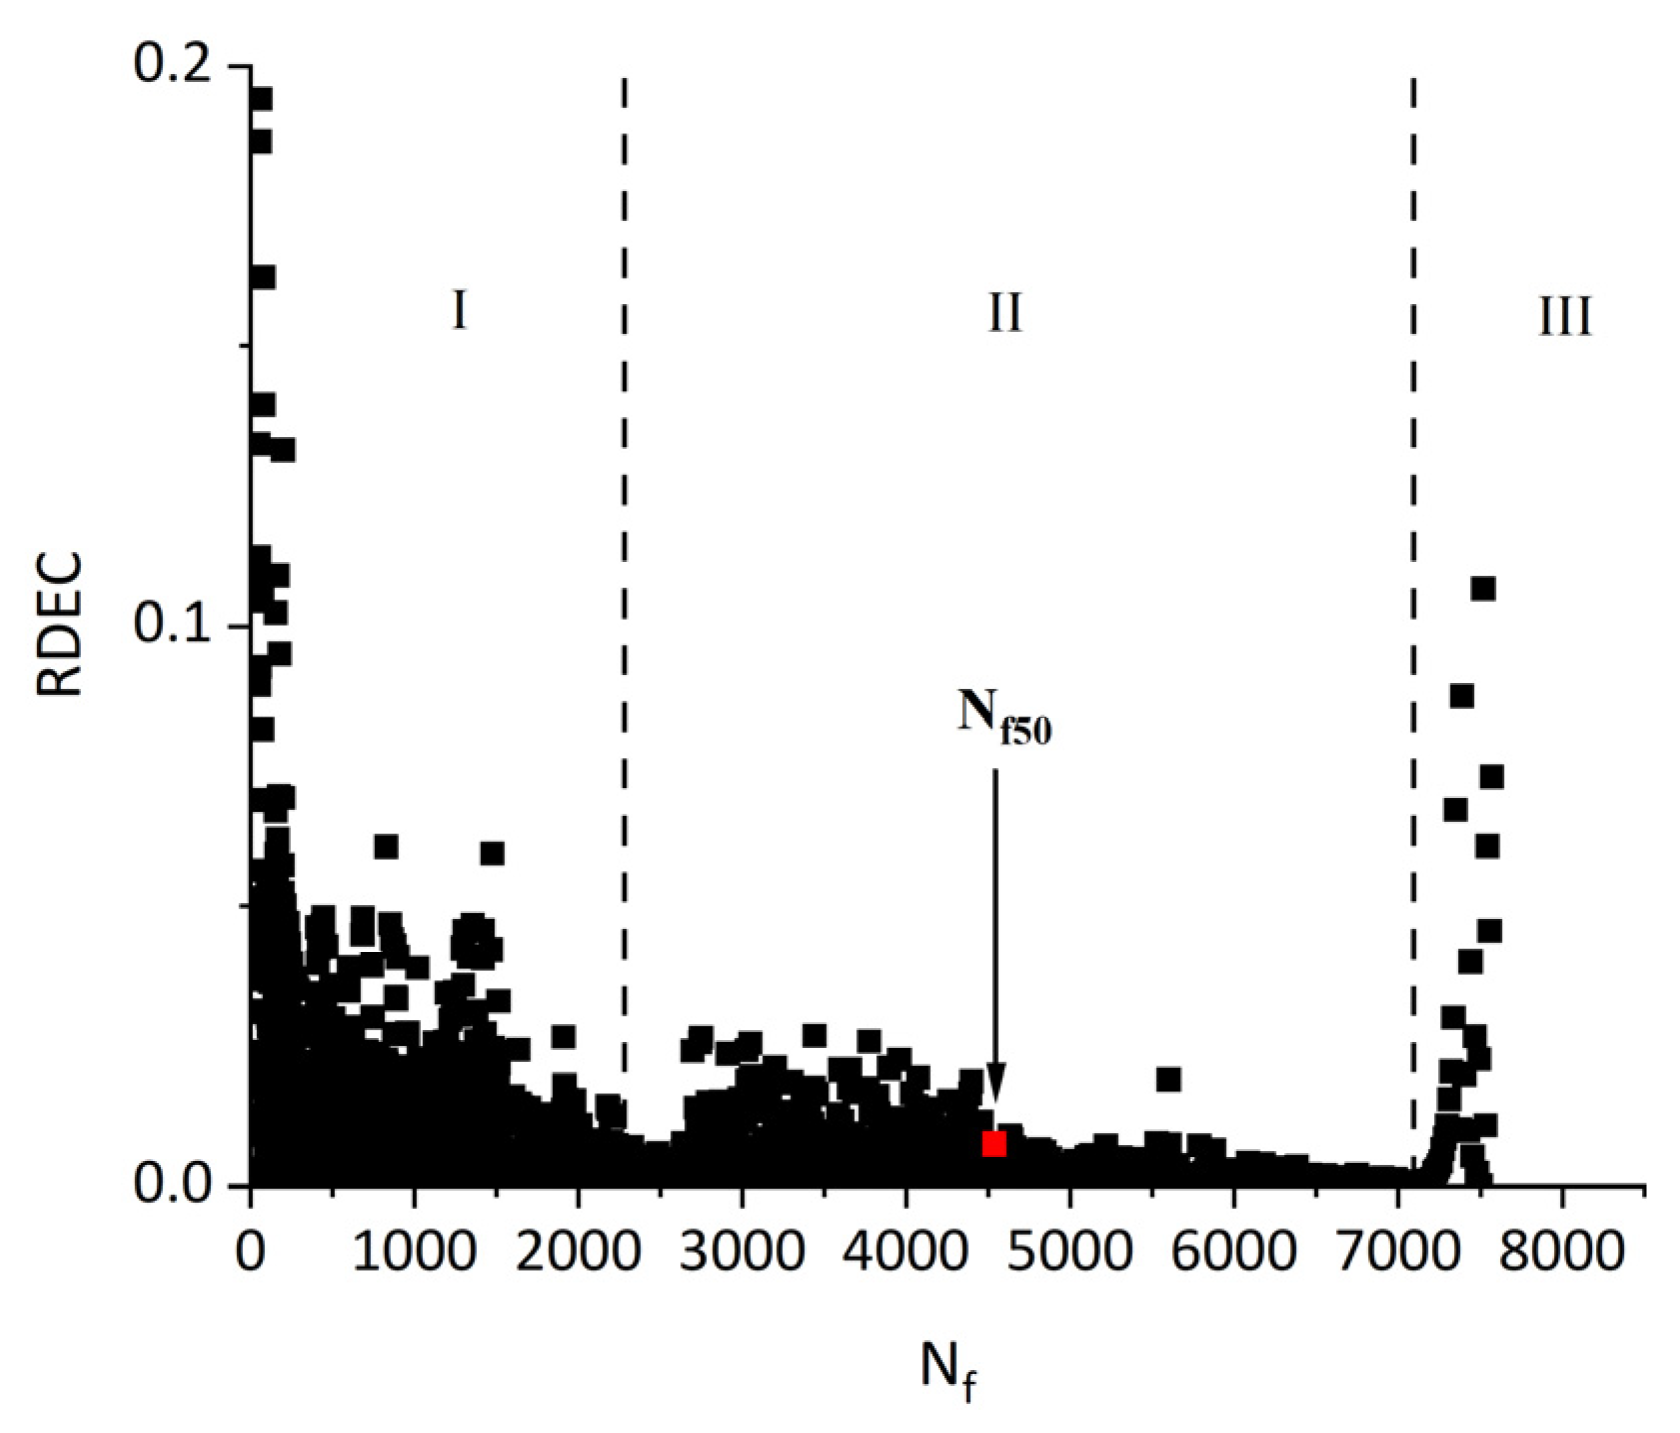
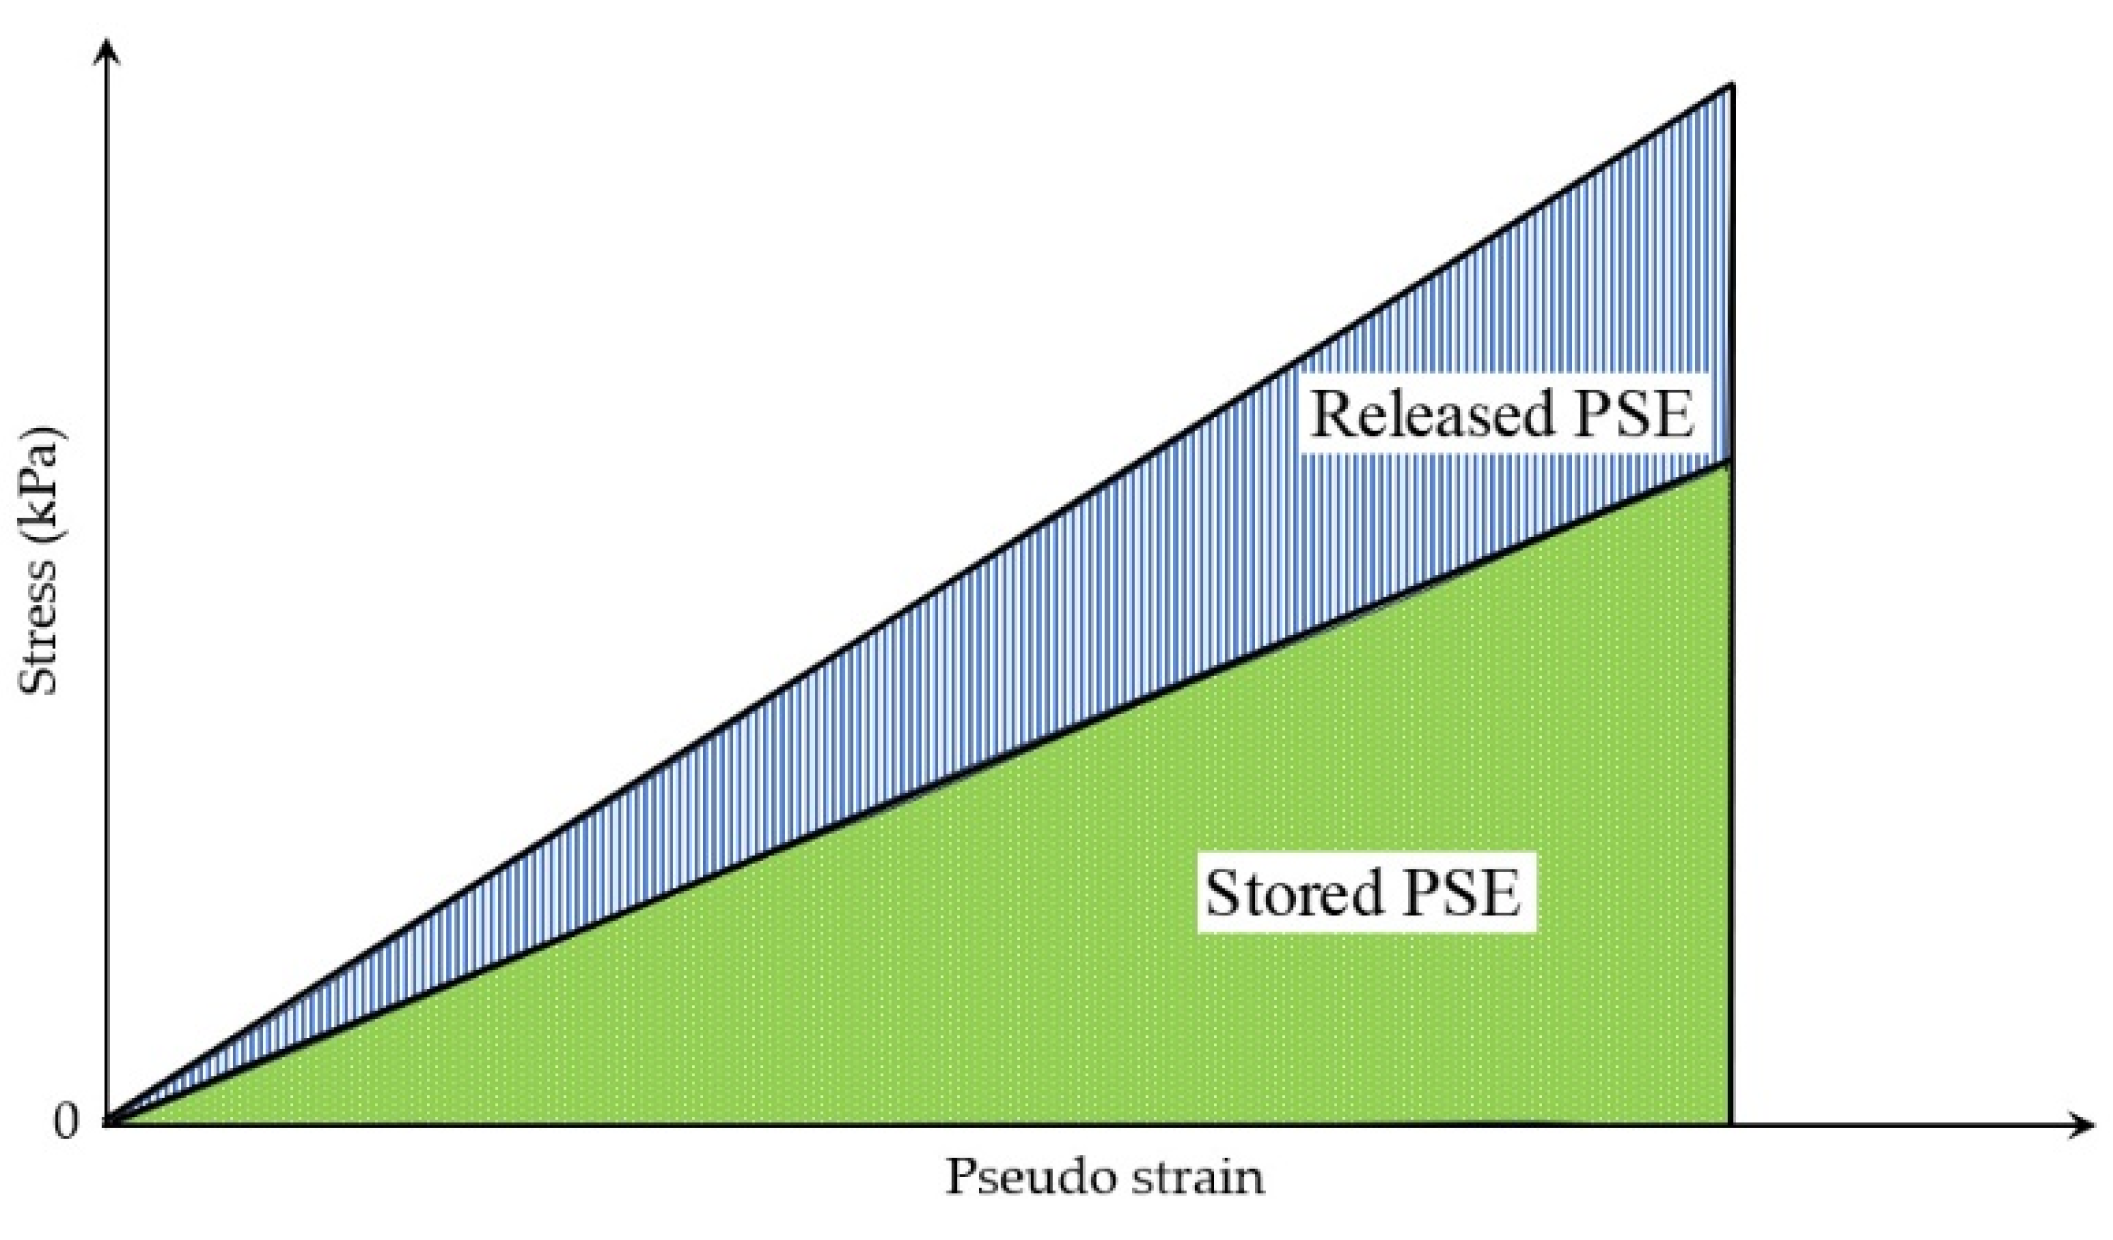
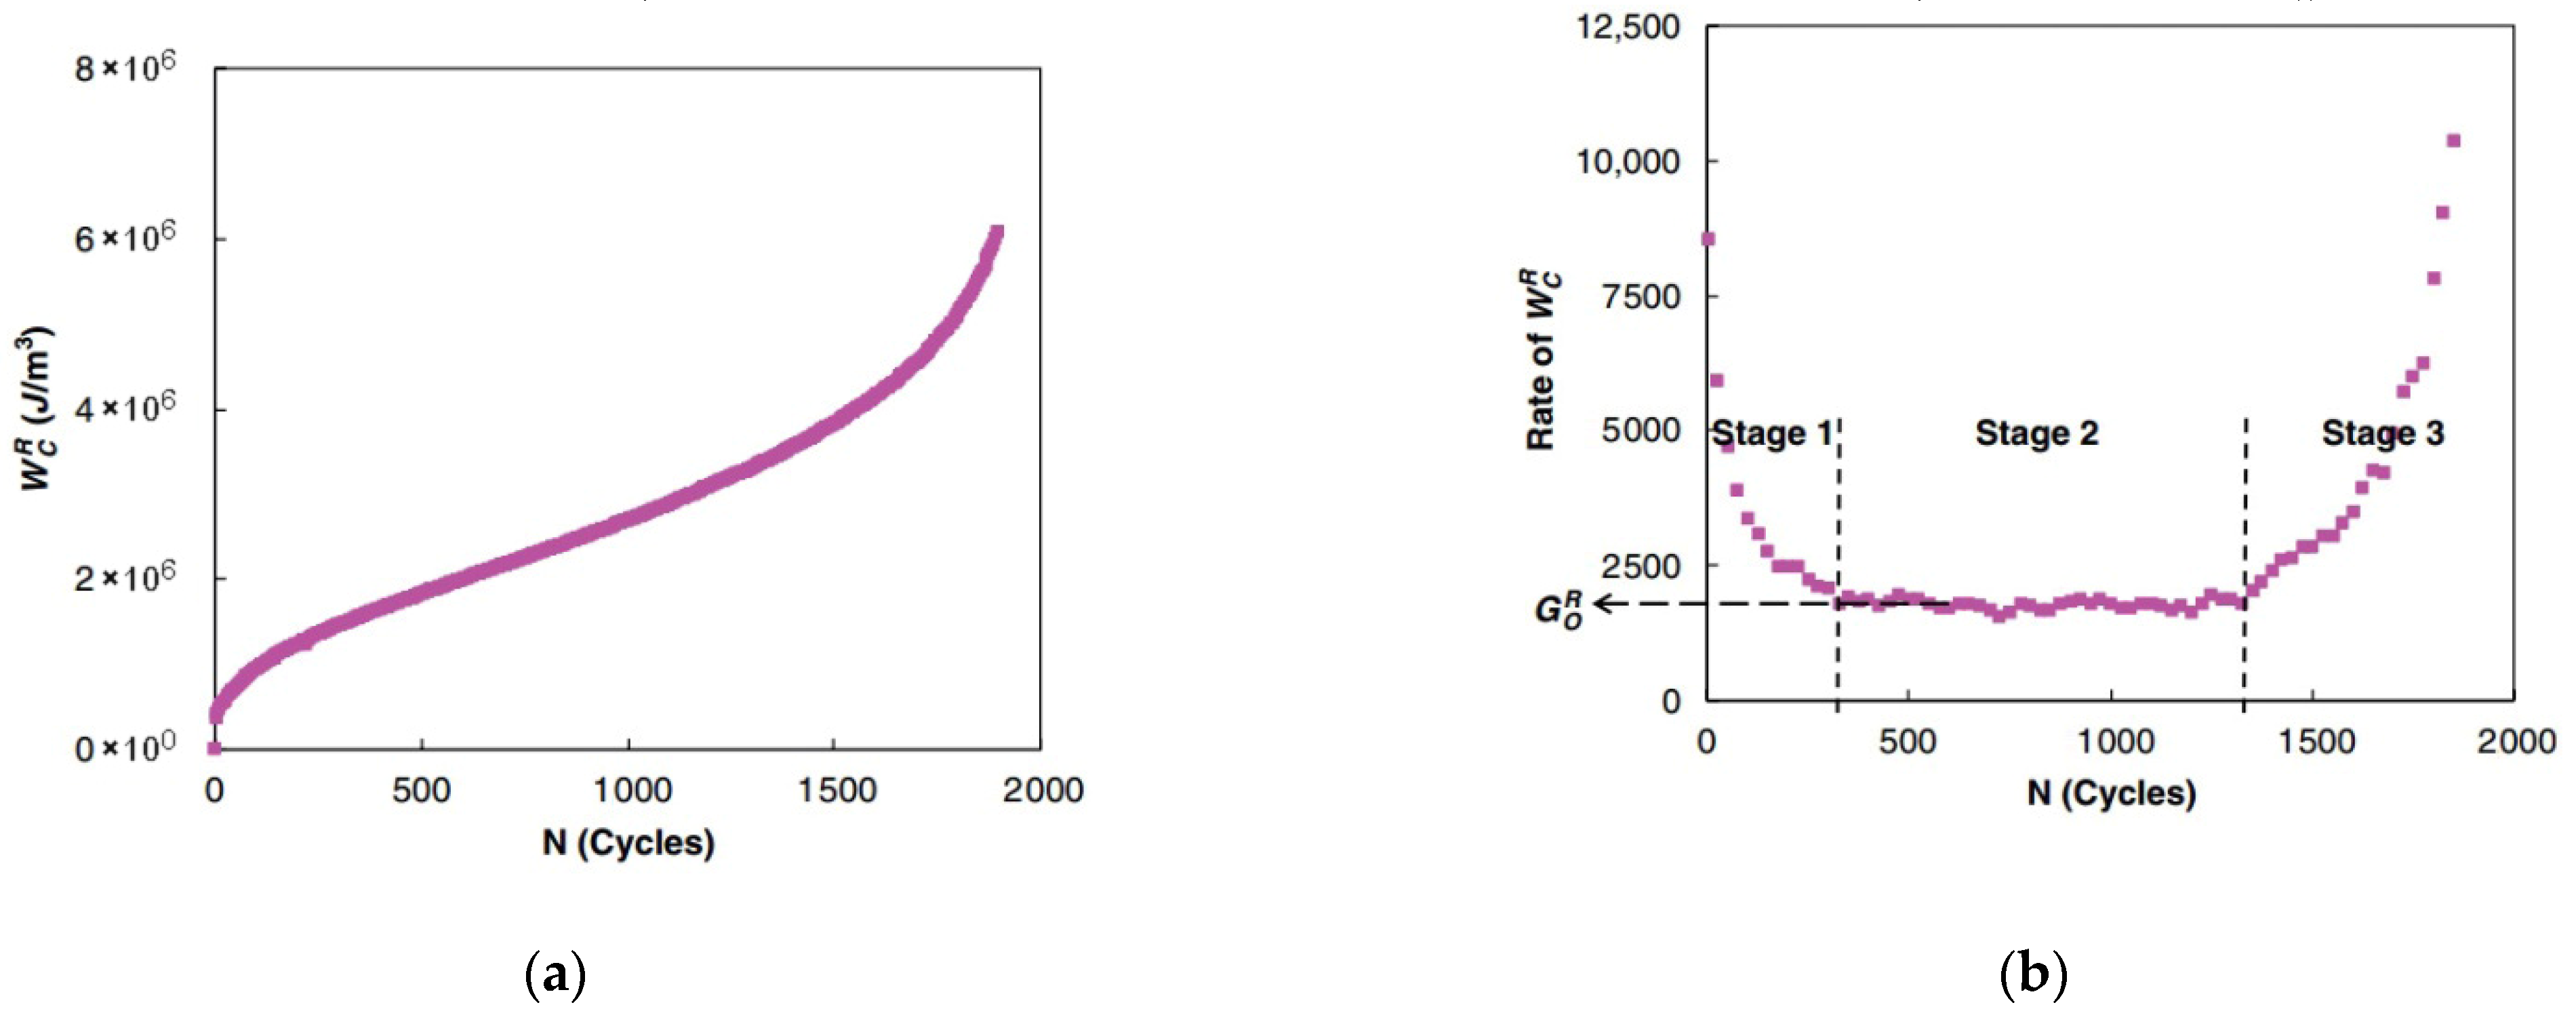
- The fatigue damage evolution metrics—including the stiffness modulus degradation ratio (SMDR), the ratio of the dissipated energy change (RDEC), the cumulative dissipated energy change (RCDEC), the pseudo strain energy release rate (), and the average dissipated pseudo energy rate ()—demonstrate characteristic U-shaped trajectories when plotted against loading cycles () in cyclic fatigue tests. The plateau value (PV) serves as a quantitative indicator of asphalt mixtures’ fatigue endurance, while the critical transition point marking the abrupt shift from Stage II (steady-state damage accumulation) to Stage III (accelerated crack propagation) provides a physically anchored failure criterion. These findings collectively suggest that formulating analogous constitutive relationships to Equation (24), grounded in energy dissipation mechanisms, could enable the precise determination of fatigue failure thresholds;
- The artificial neural network (ANN) framework emerges as a promising computational approach for fatigue life prediction in asphalt mixtures. While its predictive capability is contingent upon the comprehensiveness of existing fatigue datasets and algorithmic sophistication, the ANN essentially functions as a data-driven predictive framework. Furthermore, this methodology holds significant potential for establishing systematic validation protocols to quantitatively assess the sensitivity thresholds and operational domains of established failure criteria under multi-parametric loading scenarios;
- The implementation of fatigue failure criteria requires rigorous field validation through the in situ monitoring of asphalt pavements subjected to multi-axial stress states and hygrothermal fluctuations. Furthermore, advancing predictive fidelity demands a synergistic integration of experimental characterization (e.g., controlled laboratory aging protocols) and computational modeling frameworks (e.g., the discrete element method coupled with the viscoplasticity theory). Critical research priorities should include the following: (1) quantitative benchmarking protocols for cross-criteria reliability assessments and (2) domain-specific validity assessments through multivariate sensitivity analyses across material gradations and climatic regimes.
Author Contributions
Funding
Conflicts of Interest
Abbreviations
| HMA | Hot mix asphalt |
| HPABs | High-polymer asphalt binders |
| HMABs | High-modulus asphalt binders |
| WMA | Warm-mix asphalt |
| RAP | Reclaimed asphalt pavement |
| DSR | Dynamic shear rheometer |
| LAS | Linear amplitude sweep |
| TS | Time sweep |
| ASR | Annular shear rheometer |
| FAM | Fine aggregate matrix |
| AC | Asphalt concrete |
| SCB | Semi-circular beam |
| DCT | Disk compact tension |
| SENB | Single-edge notched beam |
| DENP | Double-edge notched prism |
| UGR-FACT | University of Granada-Fatigue Asphalt Cracking Test |
| DMA | Dynamic mechanical analyzer |
| VECD | Viscoelastic continuum damage |
| VEFM | Viscoelastic fracture mechanics |
| ANN | Artificial neural network |
| SMDR | Stiffness modulus degradation ratio |
| SMD | Stiffness modulus degradation |
| LVDT | Linear variable differential transformer |
| DER | Dissipated energy ratio |
| RDEC | Ratio of dissipated energy change |
| PV | Plateau value |
| RCDEC | Ratio of cumulative dissipated energy change |
| DCSE | Dissipated creep strain energy |
| FE | Fracture energy |
| EE | Elastic energy |
| SIF | Stress intensity factor |
| DPSE | Dissipated pseudo strain energy |
| S-VECD | Simplified viscoelastic continuum damage |
| PSE | Pseudo strain energy |
| I-FIT | Illinois flexibility index test |
References
- Road Research Laboratory. Bituminous Materials in Road Construction; HMSO: London, UK, 1962. [Google Scholar]
- Gudipudi, P.P.; Underwood, B.S. Reliability analysis of fatigue life prediction from the viscoelastic continuum damage model. Transp. Res. Rec. J. Transp. Res. Board 2016, 2576, 91–99. [Google Scholar] [CrossRef]
- Norouzi, A.; Sabouri, M.; Kim, Y.R. Fatigue life and endurance limit prediction of asphalt mixtures using energy-based failure criterion. Int. J. Pavement Eng. 2017, 18, 990–1003. [Google Scholar] [CrossRef]
- Safaei, F.; Castorena, C. Material nonlinearity in asphalt binder fatigue testing and analysis. Mater. Des. 2017, 133, 376–389. [Google Scholar] [CrossRef]
- Shadman, M.; Ziari, H. Laboratory evaluation of fatigue life characteristics of polymer modified porous asphalt: A dissipated energy approach. Constr. Build. Mater. 2017, 138, 434–440. [Google Scholar] [CrossRef]
- Yang, X. Research on Fatigue Damage of Asphalt Mortar and Asphalt Mixture Based on Viscoelastic Continuous Damage Model. Master’s Thesis, Changsha University of Science & Technology, Changsha, China, 2021. [Google Scholar]
- Sudarsanan, N.; Kim, Y.R. A critical review of the fatigue life prediction of asphalt mixtures and pavements. J. Traffic Transp. Eng. Engl. Ed. 2022, 9, 808–835. [Google Scholar] [CrossRef]
- Oteki, D.; Yeneneh, A.; Gedafa, D.; Suleiman, N. Evaluating the fatigue-cracking resistance of North Dakota’s asphalt mixtures. Transp. Res. Rec. J. Transp. Res. Board 2024, 2678, 1369–1378. [Google Scholar] [CrossRef]
- Moreno-Navarro, F.; Rubio-Gámez, M.C. A review of fatigue damage in bituminous mixtures: Understanding the phenomenon from a new perspective. Constr. Build. Mater. 2016, 113, 927–938. [Google Scholar] [CrossRef]
- Chung, K.; Lee, S.; Park, M.; Yoo, P.; Hong, Y. Preparation and characterization of microcapsule-containing self-healing asphalt. J. Ind. Eng. Chem. 2015, 29, 330–337. [Google Scholar] [CrossRef]
- Lv, S.; Hu, L.; Xia, C.; Wang, X.; Borges Cabrera, M.; Guo, S.; Chen, J. Development of fatigue damage model of asphalt mixtures based on small-scale accelerated pavement test. Constr. Build. Mater. 2020, 260, 119930. [Google Scholar] [CrossRef]
- Mensching, D.; Rahbar-Rastegar, R.; Underwood, S.; Sias, J. Identifying indicators for fatigue cracking in hot-mix asphalt pavements using viscoelastic continuum damage principles. Transp. Res. Rec. J. Transp. Res. Board 2016, 2576, 28–39. [Google Scholar] [CrossRef]
- Kim, Y.R.; LEE, H.-J.; Little, D.N. Fatigue Characterization of Asphalt Concrete Using Viscoelasticity and Continuum Damage Theory; Asphalt Paving Technology: Salt Lake City, UT, USA, 1997; pp. 520–569. [Google Scholar]
- Pouget, S.; Sauzéat, C.; Benedetto Hervé, D.; Olard, F. Viscous energy dissipation in asphalt pavement structures and implication for vehicle fuel consumption. J. Mater. Civ. Eng. 2012, 24, 568–576. [Google Scholar] [CrossRef]
- Ghuzlan, K.A.; Carpenter, S.H. Fatigue damage analysis in asphalt concrete mixtures using the dissipated energy approach. Can. J. Civ. Eng. 2006, 33, 890–901. [Google Scholar] [CrossRef]
- Shen, S.; Carpenter, S. Application of the dissipated energy concept in fatigue endurance limit testing. Transp. Res. Rec. J. Transp. Res. Board 2005, 1929, 165–173. [Google Scholar] [CrossRef]
- Shan, L.; Tan, Y.; Underwood, S.; Kim, Y. Separation of thixotropy from fatigue process of asphalt binder. Transp. Res. Rec. J. Transp. Res. Board 2011, 2207, 89–98. [Google Scholar] [CrossRef]
- Sadek, H.; Masad, E.; Al-Khalid, H.; Sirin, O. Probabilistic analysis of fatigue life for asphalt mixtures using the viscoelastic continuum damage approach. Constr. Build. Mater. 2016, 126, 227–244. [Google Scholar] [CrossRef]
- Reese, R.A. Properties of aged asphalt binder related to asphalt concrete fatigue life. J. Assoc. Asph. Paving Technol. 1997, 66, 604–632. [Google Scholar]
- Soltani, A.; Anderson, D.A. New test protocol to measure fatigue damage in asphalt mixtures. Road Mater. Pavement Des. 2005, 6, 485–514. [Google Scholar] [CrossRef]
- Safaei, F.; Lee, J.-S.; Nascimento, L.A.H.d.; Hintz, C.; Kim, Y.R. Implications of warm-mix asphalt on long-term oxidative ageing and fatigue performance of asphalt binders and mixtures. Road Mater. Pavement Des. 2014, 15 (Suppl. S1), 45–61. [Google Scholar] [CrossRef]
- Monismith, C.L. Fatigue characteristics of asphalt paving mixtures and their use in pavement design. In Proceedings of the 18th Paving Conference, University of New Mexico, Albuquerque, NM, USA, 7–9 January 1981; University of New Mexico: Albuquerque, NM, USA, 1981. [Google Scholar]
- Yuan, M. Research on Fatigue Failure Mechanism of Asphalt Mixtures Using Digital Speckle Correlation Method. Ph.D. Thesis, South China University of Technology, Guangzhou, China, 2013. [Google Scholar]
- Wang, C. Rheological Characterization on Paving Performance of Asphalt Mixture. Ph.D. Thesis, Beijing University of Technology, Beijing, China, 2015. [Google Scholar]
- Wang, Y.Z.; Kim, Y.R. Development of a pseudo strain energy-based fatigue failure criterion for asphalt mixtures. Int. J. Pavement Eng. 2019, 20, 1182–1192. [Google Scholar] [CrossRef]
- AASHTO TP 107-18; Standard Method of Test for Determining the Damage Characteristic Curve and Failure Criterion Using the Asphalt Mixture Perfromance Tester (AMPT) Cyclic Fatigue Test. American Association of State Highway and Transportation Officials: Washington, DC, USA, 2018.
- Sousa, J.; Pais, J.; Prates, M.; Barros, R.; Langlois, P.; Leclerc, A.-M. Effect of aggregate gradation on fatigue life of asphalt concrete mixes. Transp. Res. Rec. J. Transp. Res. Board 1998, 1630, 62–68. [Google Scholar] [CrossRef]
- Di Benedetto, H.; Ashayer Soltani, A.; CHAVEROT, P. Fatigue damage for bituminous mixtures: A pertinent approach. J. Assoc. Asph. Paving Technol. 1996, 65, 142–158. [Google Scholar]
- Liu, G.; Jia, Y.; Yang, T.; Du, H.; Zhang, J.; Zhao, Y. Fatigue performance evaluation of asphalt mixtures based on energy-controlled loading mode. Constr. Build. Mater. 2017, 157, 348–356. [Google Scholar] [CrossRef]
- Hartman, A.M.; Gilchrist, M.D. Evaluating four-point bend fatigue of asphalt mix using image analysis. J. Mater. Civ. Eng. 2004, 16, 60–68. [Google Scholar] [CrossRef]
- Kim, Y.-R.; Little, D.N.; Lytton, R.L. Fatigue and healing characterization of asphalt mixtures. J. Mater. Civ. Eng. 2003, 15, 75–83. [Google Scholar] [CrossRef]
- Branco, V.T.F.C. A Unified Method for the Analysis of Nonlinear Viscoelasticity and Fatigue Cracking of Asphalt Mixture Using the Dynamic Mechanical Analyzer. Ph.D. Dissertation, Texas A & M University, College Station, TX, USA, 2008. [Google Scholar]
- BS EN 12697-24; Bituminous Mixtures—Test Methods for Hot Mix Asphalt. BSI (British Standard Institution): London, UK, 2012.
- AASHTO T 321-17; Standard Method of Test for Determining the Fatigue Life of Compacted Asphalt Mixtures Subjected to Repeated Flexural Bending. American Association of State and Highway Transportation Officials: Washington, DC, USA, 2017.
- ASTM D7460-10; Standard Test Method for Determining Fatigue Failure of Compacted Asphalt Concrete Subjected to Repeated Flexural Bending. American Standards for Testing Materials International (ASTM): West Conshohocken, PA, USA, 2010.
- Pronk, A.C.; Poot, M.R.; Jacobs, M.M.J.; Gelpke, R.F. Haversine fatigue testing in controlled deflection mode: Is it possible? In Proceedings of the Transportation Research Board 89th Annual Meeting, Washington, DC, USA, 10–14 January 2010.
- Yang, K.; Cui, H.; Liu, P.; Zhu, M.; An, Y. Accuracy analysis of fatigue life prediction in asphalt binders under multiple aging conditions based on simplified viscoelastic continuum damage (S-VECD) approach. Constr. Build. Mater. 2024, 435, 136868. [Google Scholar] [CrossRef]
- Zhang, Z.; Shen, S.; Shi, B.; Wang, H. Characterization of the fatigue behavior of asphalt mixture under full support using a Wheel-tracking Device. Constr. Build. Mater. 2021, 277, 122326. [Google Scholar] [CrossRef]
- Ahmed, S.; Dave, E.; Buttlar, W.; Behnia, B. Compact tension test for fracture characterization of thin bonded asphalt overlay systems at low temperature. Mater. Struct. 2012, 45, 1207–1220. [Google Scholar] [CrossRef]
- ASTM D7313-20; Standard Test Method for Determining Fracture Energy of Asphalt Mixtures Using the Disk-Shaped Compact Tension Geometry. ASTM: West Conshohocken, PA, USA, 2020.
- AASHTO TP 124-20; Standard Method of Test for Determining the Fracture Potential of Asphalt Mixtures Using the Illinois Flexibility Index Test (I-FIT). AASHTO: Washington, DC, USA, 2020.
- Ozer, H.; Al-Qadi, I.L.; Lambros, J.; El-Khatib, A.; Singhvi, P.; Doll, B. Development of the fracture-based flexibility index for asphalt concrete cracking potential using modified semi-circle bending test parameters. Constr. Build. Mater. 2016, 115, 390–401. [Google Scholar] [CrossRef]
- Mull, M.A.; Stuart, K.; Yehia, A. Fracture resistance characterization of chemically modified crumb rubber asphalt pavement. J. Mater. Sci. 2002, 37, 557–566. [Google Scholar] [CrossRef]
- Mohammad, L.N.; Kim, M.; Challa, H. Development of Performance-Based Specifications for Louisiana Asphalt Mixtures; FHWA/LA.14/558; Louisiana Transportation Research Center: Baton Rouge, LA, USA, 2016. [Google Scholar]
- Kim, K.W.; El Hussein, M. Variation of fracture toughness of asphalt concrete under low temperatures. Constr. Build. Mater. 1997, 11, 403–411. [Google Scholar] [CrossRef]
- Braham, A.; Buttlar, W.; Ni, F. Fracture characteristics of asphalt concrete in mixed-mode. Road Mater. Pavement Des. 2010, 11, 947–968. [Google Scholar]
- Seo, Y.; Kim, Y.; Schapery, R.; Witczak, M.W.; Bonaquist, R. A study of crack-tip deformation and crack growth in asphalt concrete using fracture mechanics. Asph. Paving Technol. AAPT 2004, 73, 697–730. [Google Scholar]
- Moreno-Navarro, F.; Rubio-Gámez, M.C. UGR-FACT test for the study of fatigue cracking in bituminous mixes. Constr. Build. Mater. 2013, 43, 184–190. [Google Scholar] [CrossRef]
- Buannic, M.; Di Benedetto, H.; Ruot, C.; Gallet, T.; Sauzéat, C. Fatigue investigation of mastics and bitumens using annular shear rheometer prototype equipped with wave propagation system. In Proceedings of the 7th RILEM International Conference on Cracking in Pavements, Dordrecht, The Netherlands, 20–22 June 2012; Scarpas, A., Kringos, N., Al-Qadi, I.A.L., Eds.; Springer: Dordrecht, The Netherlands, 2012; pp. 805–814. [Google Scholar]
- Gudipudi, P.P.; Underwood, B.S. Development of modulus and fatigue test protocol for fine aggregate matrix for axial direction of loading. J. Test. Eval. 2017, 45, 497–508. [Google Scholar] [CrossRef]
- Zhang, C.; Ren, Q.; Qian, Z.; Wang, X. Evaluating the effects of high RAP content and rejuvenating agents on fatigue performance of fine aggregate matrix through DMA flexural bending test. Materials 2019, 12, 1508. [Google Scholar] [CrossRef] [PubMed]
- Di Benedetto, H.; Nguyen, Q.T.; Sauzéat, C. Nonlinearity, heating, fatigue and thixotropy during cyclic loading of asphalt mixtures. Road Mater. Pavement Des. 2011, 12, 129–158. [Google Scholar] [CrossRef]
- Zeiada, W.A.; Zeiada, W.A.; Souliman, M.I.; Kaloush, K.E.; Mamlouk, M.S.; Underwood, B.S. Comparison of fatigue damage, healing, and endurance limit with beam and uniaxial fatigue tests. Transp. Res. Rec. 2014, 2447, 32–41. [Google Scholar] [CrossRef]
- Sun, Y.; Fang, C.; Wang, J.; Ma, Z.; Ye, Y. Energy-based approach to predict fatigue life of asphalt mixture using three-point bending fatigue test. Materials 2018, 11, 1696. [Google Scholar] [CrossRef]
- Ren, J.; Di, L.; Yinshan, X.; Jiandong, H.; Liu, W. Fatigue behaviour of rock asphalt concrete considering moisture, high-temperature, and stress level. Int. J. Pavement Eng. 2022, 23, 4638–4648. [Google Scholar] [CrossRef]
- EN 12697-24; Bituminous Mixtures, Test Methods, Resistance to Fatigue. British Standards Institution: London, UK, 2018.
- EN 12697-26; Bituminous Mixtures, Test Methods, Stiffness. British Standards Institution: London, UK, 2018.
- Li, K.; Huang, M.; Zhong, H.; Li, B. Comprehensive evaluation of fatigue performance of modified asphalt mixtures in different fatigue tests. Appl. Sci. 2019, 9, 1850. [Google Scholar] [CrossRef]
- NF P 98-260-1; Essais Relatifs Aux Chaussées—Mesure des Caractéristiques Rhéologiques des Mélanges Hydrocarbonés—Partie 1: Détermination du Module et de la Perte de Linéarité en Traction Directe. AFNOR: Saint-Denis, France, 1992.
- Cheng, H.; Liu, J.; Sun, L.; Liu, L.; Zhang, Y. Fatigue behaviours of asphalt mixture at different temperatures in four-point bending and indirect tensile fatigue tests. Constr. Build. Mater. 2021, 273, 121675. [Google Scholar] [CrossRef]
- AASHTO TP131; Standard Method of Test for Determining the Dynamic Modulus of Asphalt Mixtures Using the Indirect Tension Test. American Association of State and Highway Transportation Officials: Washington, DC, USA, 2018.
- AASHTO PP96; Standard Specification for Developing Dynamic Modulus Master Curves for Asphalt Mixtures Using the Indirect Tension Testing Method. American Association of State and Highway Transportation Officials: Washington, DC, USA, 2018.
- AASHTO PP95; Standard Specification for Preparation of Indirect Tension Performance Test Specimens. American Association of State and Highway Transportation Officials: Washington, DC, USA, 2018.
- Ahmed, T.; Al-Khalid, H. A new approach in fatigue testing and evaluation of hot mix asphalt using a dynamic shear rheometer. In Proceedings of the 6th International Conference on Bituminous Mixtures and Pavements, Thessaloniki, Greece, 10–12 June 2015; pp. 351–359. [Google Scholar]
- Apostolidis, P.; Kasbergen, C.; Bhasin, A.; Scarpas, T.; Erkens, S. Study of asphalt binder fatigue with a new dynamic shear rheometer geometry. Transp. Res. Rec. J. Transp. Res. Board 2018, 2672, 290–300. [Google Scholar] [CrossRef]
- Abd Duraid, M.; Al-Khalid, H. Fatigue Characterization of WMA and Modeling Using Artificial Neural Networks. J. Mater. Civ. Eng. 2022, 34, 04021467. [Google Scholar]
- EN 12697-44; Bituminous Mixtures-Test Methods-Part 44: Crack Propagation by Semi-Circular Bending Test. CEN: Brussels, Belgium, 2019.
- Kim, Y.-R.; Little, D.; Lytton, R.; D’Angelo, J.; Davis, R.; Rowe, G.; Reinke, G.; Marasteanu, M.; Masad, E.; Roque, R.; et al. Use of dynamic mechanical analysis (DMA) to evaluate the fatigue and healing potential of asphalt binders in sand asphalt mixtures. Asph. Paving Technol. Assoc. Asph. Paving Technol. Proc. Tech. Sess. 2002, 71, 176–206. [Google Scholar]
- Delaporte, B.; Van Rompu, J.; Di Benedetto, H.; Chaverot, P.; Gauthier, G. New procedure to evaluate fatigue of bituminous mastics using an annular shear rheometer prototype. In Proceedings of the 6th RILEM International Conference on Cracking in Pavement—Pavement Cracking: Mechanisms, Modeling, Detection, Testing and Case Histories, Chicago, IL, USA, 16–18 June 2008; pp. 457–467. [Google Scholar]
- Rompu, J.V.; Benedetto, H.D.; Gauthier, G.; Gallet, T. Advanced Testing and Characterization of Bituminous Materials, Two Volume Set; CRC Press: Boca Raton, FL, USA, 2009; p. 12. [Google Scholar]
- AASHTO TP 101; Estimating Damage Tolerance of Asphalt Binders Using the Linear Amplitude Sweep. AASHTO: Washington, DC, USA, 2014.
- Castorena, C.; Velasquez, R.; Johnson, C.; Bahia, H. Modification and validation of linear amplitude sweep test for binder fatigue specification. Transp. Res. Rec. J. Transp. Res. Board 2011, 2207, 99–106. [Google Scholar]
- Braham, A.; Underwood, B.S. State of the Art and Practice in Fatigue Cracking Evaluation of Asphalt Concrete Pavements; Association of Asphalt Paving Technology: Lino Lakes, MN, USA, 2016. [Google Scholar]
- Hveem, F.N. Pavement Deflections and Fatigue Failures; The National Academies of Sciences, Engineering, and Medicine: Washington, DC, USA, 1955; pp. 43–87. [Google Scholar]
- Ahmed, T.M.; Al-Khalid, H.; Ahmed, T.Y. Review of techniques, approaches and criteria of hot-mix asphalt fatigue. J. Mater. Civ. Eng. 2019, 31, 03119004. [Google Scholar] [CrossRef]
- Wu, Z. Research on Cumulative Fatigue Damage of Asphalt Mixture and Asphalt Layer Based on Multi-Level Amplitude Loading. Ph.D. Thesis, South China University of Technology, Guangzhou, China, 2014. [Google Scholar]
- Li, H.; Luo, X.; Zhang, Y.; Leng, Z. Viscoelastic fracture mechanics-based fatigue life model in asphalt-filler composite system. Eng. Fract. Mech. 2023, 292, 109589. [Google Scholar] [CrossRef]
- Xiao, F.; Amirkhanian, S.; Juang, C.H. Prediction of fatigue life of rubberized asphalt concrete mixtures containing reclaimed asphalt pavement using artificial neural networks. J. Mater. Civ. Eng. 2009, 21, 253–261. [Google Scholar] [CrossRef]
- Ahmed, T.M.; Green, P.L.; Khalid, H.A. Predicting fatigue performance of hot mix asphalt using artificial neural networks. Road Mater. Pavement Des. 2017, 18 (Suppl. S2), 141–154. [Google Scholar] [CrossRef]
- Yan, C.; Gao, R.; Huang, W. Asphalt mixture fatigue life prediction model based on neural network. In Proceedings of the COTA International Conference of Transportation Professionals 2017, Shanghai, China, 7–9 July 2017; pp. 1292–1299. [Google Scholar]
- Wang, Z.; Guo, N.; Wang, S.; Xu, Y. Prediction of highway asphalt pavement performance based on Markov chain and artificial neural network approach. J. Supercomput. 2021, 77, 1354–1376. [Google Scholar] [CrossRef]
- Houl’ik, J.; Valentin, J.; Nezerka, V. Predicting the fatigue life of asphalt concrete using neural networks. arXiv 2024, arXiv:2406.01523. [Google Scholar]
- Shen, A.; Yu, M.; Zhou, X.; Lv, Z.; Song, P. Fatigue damage and full-cycle life estimation of rubber asphalt mixture. J. Build. Mater. 2018, 21, 620–625. [Google Scholar]
- Monismith, C.L.; Secor, K.E.; Blackmer, E.W. Asphalt mixture behavior in repeated flexure. Proc. Assoc. Asph. Paving Technol. 1961, 30, 188–222. [Google Scholar]
- Monismith, C.L.; Deacon, J.A. Fatigue of asphalt paving mixtures. Transp. Eng. J. ASCE 1969, 95, 317–346. [Google Scholar] [CrossRef]
- Pell, P.S. Fatigue characteristics of bitumen and bituminous mixes. In Proceedings of the First International Conference on the Structural Design of Asphalt Pavements, Ann Arbor, MI, USA, 20–24 August 1962; National Academy of Sciences: Ann Arbor, MI, USA, 1962; pp. 310–323. [Google Scholar]
- Monismith, C.L. Symposium on Flexible Pavement Behavior as Related to Deflection, Part II—Significance of Pavement Deflections; Association of Asphalt Paving Technologists: Lino Lakes, MN, USA, 1962; pp. 231–260. [Google Scholar]
- Epps, J.A.; Monismith, C.L. Influence of Mixture variables on the Flexural Fatigue Properties of Asphalt Concrete; Association of Asphalt Paving Technologists: Los Angeles, CA, USA, 1969; pp. 423–464. [Google Scholar]
- Kingham, R.I. Failure criteria from AASHO road test data. In Proceedings of the Third International Conference on the Structural Design of Asphalt Pavements, London, UK, 11–15 September 1972; pp. 656–669. [Google Scholar]
- Monismith, C.L.; Epps, J.A.; Kasianchuk, D. Asphalt Mixture Behavior in Repeated Flexure; TE 70-5; Institute of Transportation and Traffic Engineering, University of California: Berkeley, CA, USA, 1972. [Google Scholar]
- Witczak, M.W. Design of full-depth asphalt airfield pavements. In Proceedings of the Third International Conference on the Structural Design of Asphalt Pavements, London, UK, 11–15 September 1972; pp. 550–567. [Google Scholar]
- Claessen, A.I.M.; Edwards, J.M.; Sommer, P.; Ugé, P. Asphalt pavement design, the shell method. In Proceedings of the Forth International Conference on the Structural Design of Asphalt Pavements, Ann Arbor, MI, USA, 22–26 August 1977; pp. 39–74. [Google Scholar]
- Di Benedetto, H.; Roche, C.; Baaj, H.; Pronk, A.C.; Lundström, R. Fatigue of bituminous mixtures. Mater. Struct. 2004, 37, 202–216. [Google Scholar] [CrossRef]
- Baaj, H.; Di Benedetto, H.; Chaverot, P. Effect of binder characteristics on fatigue of asphalt pavement using an intrinsic damage approach. Road Mater. Pavement Des. 2005, 6, 147–174. [Google Scholar] [CrossRef]
- Lundstrom, R.; Di Benedetto, H.; Isacsson, U. Influence of asphalt mixture stiffness on fatigue failure. J. Mater. Civ. Eng. 2004, 16, 516–525. [Google Scholar] [CrossRef]
- Nguyen, Q.T.; Di Benedetto, H.; Sauzéat, C. Determination of thermal properties of asphalt mixtures as another output from cyclic tension-compression test. Road Mater. Pavement Des. 2012, 13, 85–103. [Google Scholar] [CrossRef]
- Tapsoba, N.; Sauzéat, C.; Di Benedetto, H. Analysis of fatigue test for bituminous mixtures. J. Mater. Civ. Eng. 2013, 25, 701–710. [Google Scholar] [CrossRef]
- Read, J.M.; Collop, A.C. Practical fatigue characterization of bituminous paving mixture. J. Assoc. Asph. Paving Technol. 1997, 66, 74–108. [Google Scholar]
- Cheng, H.L. Determination of the Stiffness Moduli and Fatigue Endurance Limits of Asphalt Pavements for Perpetual Pavement Design. Ph.D. Thesis, The Hong Kong Polytechnic University, Hong Kong, China, 2022. [Google Scholar]
- Cheng, H.; Liu, J.; Sun, L.; Liu, L. Critical position of fatigue damage within asphalt pavement considering temperature and strain distribution. Int. J. Pavement Eng. 2021, 22, 1773–1784. [Google Scholar] [CrossRef]
- Pellinen, T.; Christensen, D.; Rowe, G.; Sharrock, M. Fatigue-transfer functions: How do they compare? Transp. Res. Rec. 2004, 1896, 77–87. [Google Scholar] [CrossRef]
- Yu, J. Study on Fatigue Performance of Asphalt Mixture. Ph.D. Thesis, South China University of Technology, Guangzhou, China, 2005. [Google Scholar]
- Wen, H. Use of fracture work density obtained from indirect tensile testing for the mix design and development of a fatigue model. Int. J. Pavement Eng. 2013, 14, 561–568. [Google Scholar] [CrossRef]
- Bahadori, A.M.; Mansourkhaki, A.; Ameri, M. A phenomenological fatigue performance model of asphalt mixtures based on fracture energy density. J. Test. Eval. 2015, 43, 133–139. [Google Scholar] [CrossRef]
- Castro, M.; Sánchez, J.A. Estimation of asphalt concrete fatigue curves—A damage theory approach. Constr. Build. Mater. 2008, 22, 1232–1238. [Google Scholar] [CrossRef]
- Ma, Z.; Liu, L.; Yuan, Y.; Sun, L. Estimation of total fatigue life for in-service asphalt mixture based on accelerated pavement testing and four-point bending beam fatigue tests. Can. J. Civ. Eng. 2018, 46, 557–566. [Google Scholar] [CrossRef]
- Bonnaure, F.; Gravois, A.; Udron, J. A new method for predicting the fatigue life of bituminous mixes. J. Assoc. Asph. Paving Technol. 1980, 49, 499–529. [Google Scholar]
- Ahmed, T.M.; Ahmed, T.Y.; Al-Hdabi, A. Evaluating fatigue performance of hot-mix asphalt using degradation parameters. Proc. Inst. Civ. Eng. Constr. Mater. 2018, 173, 111–122. [Google Scholar] [CrossRef]
- AASHTO TP8-94; Standard Test Method for Determining the Fatigue Life of Compacted Hot Mix Asphalt (HMA) Subjected to Repeated Flexural Bending. American Association of State Highway and Transportation Officials: Washington, DC, USA, 1996.
- JTG E20-2011; Standard Test Methods of Bitumen and Bituminous Mixtures for Highway Engineering. Renmin Communication Press: Beijing, China, 2011.
- Van Dijk, W. Practical fatigue characterization of bituminous mixes. J. Assoc. Asph. Paving Technol. 1975, 44, 38–74. [Google Scholar]
- Tayebali, A.; Rowe, G.; Sousa, J. Fatigue response of asphalt-aggregate mixtures. J. Assoc. Asphalt. Paving. Technol. 1992, 61, 333–360. [Google Scholar]
- Tayebali, A.A.; Deacon, J.A.; Coplantz, J.S.; Monismith, C.L. Modeling Fatigue Response of Asphalt-Aggregate Mixtures; Technical Sessions; Association of Asphalt Paving Technologists: Austin, TX, USA, 1993; pp. 385–421. [Google Scholar]
- Lee, H.J. Uniaxial Constitutive Modeling of Asphalt Concrete Using Viscoelasticity and Continuum Damage Theory. Ph.D. Thesis, North Carolina State University, Raleigh, NC, USA, 1996. [Google Scholar]
- Lee, H.-J.; Daniel Jo, S.; Kim, Y.R. Continuum damage mechanics-based fatigue model of asphalt concrete. J. Mater. Civ. Eng. 2000, 12, 105–112. [Google Scholar] [CrossRef]
- Rowe, G.M. Performance of asphalt mixtures in the trapezoidal fatigue test. J. Assoc. Asph. Paving Technol. 1993, 62, 344–384. [Google Scholar]
- Copper, K.; Pell, P.S. The Effect of Mix Variables on the Fatigue Strength of Bituminous Materials; Transport and Road Research Laboratory: Wokingham, UK, 1974; pp. 1–69. [Google Scholar]
- SHRP. Fatigue Response of Asphalt-Aggregate Mixtures; National Research Council: Washington, DC, USA, 1994. [Google Scholar]
- Vadood, M.; Johari, M.S.; Rahai, A.R. Relationship between fatigue life of asphalt concrete and polypropylene/polyester fibers using artificial neural network and genetic algorithm. J. Cent. South Univ. 2015, 22, 1937–1946. [Google Scholar] [CrossRef]
- Sun, L.; Cheng, H.; Liu, L.; Cao, W. Fatigue characteristics of in-situ emulsified asphalt cold recycled mixtures. J. Tongji Univ. Nat. Sci. 2017, 45, 1648–1654 + 1687. [Google Scholar]
- Rowe, G.; Bouldin, M.G. Improved techniques to evaluate the fatigue resistance of asphaltic mixtures. In Proceedings of the 2nd Eurasphalt & Eurobitume Congress Barcelona, Barcelona, Spain, 20–22 September 2000; pp. 754–763. [Google Scholar]
- Li, N.; Pronk, A.C.; Molenaar, A.; Ven, M.; Wu, S. Comparison of uniaxial and four-point bending fatigue tests for asphalt mixtures. Transp. Res. Rec. J. Transp. Res. Board 2013, 2373, 44–53. [Google Scholar] [CrossRef]
- Abhijith, B.S.; Narayan, S.P.A. Evolution of the modulus of asphalt concrete in four-point beam fatigue tests. J. Mater. Civ. Eng. 2020, 32, 04020310. [Google Scholar] [CrossRef]
- Lundström, R.; Isacsson, U. Characterization of asphalt concrete deterioration using monotonic and cyclic tests. Int. J. Pavement Eng. 2003, 4, 143–153. [Google Scholar] [CrossRef]
- Mollenhauer, K.; Wistuba, M. Evaluation of hot-mix asphalt susceptibility to temperature-induced top-down fatigue cracking by means of Uniaxial Cyclic Tensile Stress Test. Road Mater. Pavement Des. 2012, 13, 171–190. [Google Scholar] [CrossRef]
- Zhang, J.; Sabouri, M.; Guddati, M.N.; Kim, Y.R. Development of a failure criterion for asphalt mixtures under fatigue loading. Road Mater. Pavement Des. 2013, 14 (Suppl. S2), 1–15. [Google Scholar] [CrossRef]
- Wang, C.; Castorena, C.; Zhang, J.; Richard Kim, Y. Unified failure criterion for asphalt binder under cyclic fatigue loading. Road Mater. Pavement Des. 2015, 16 (Suppl. S2), 125–148. [Google Scholar] [CrossRef]
- Shen, S.; Lu, X. Energy based laboratory fatigue failure criteria for asphalt materials. J. Test. Eval. 2011, 39, 313–320. [Google Scholar] [CrossRef]
- Huang, M.; Huang, W. Laboratory investigation on fatigue performance of modified asphalt concretes considering healing. Constr. Build. Mater. 2016, 113, 68–76. [Google Scholar] [CrossRef]
- Ameri, M.; Yeganeh, S.; Erfani Valipour, P. Experimental evaluation of fatigue resistance of asphalt mixtures containing waste elastomeric polymers. Constr. Build. Mater. 2019, 198, 638–649. [Google Scholar] [CrossRef]
- Airey, G.; Rahimzadeh, B.; Collop, A.C. Linear and Nonlinear Rheological Properties of Asphalt Mixtures. J. Assoc. Asph. Paving Technol. 2002, 71, 160–196. [Google Scholar]
- Lee, H.; Kim, Y.; Lee, S. Prediction of asphalt mix fatigue life with viscoelastic material properties. Transp. Res. Rec. 2003, 1832, 139–147. [Google Scholar] [CrossRef]
- Sabouri, M.; Kim, Y.R. Development of a failure criterion for asphalt mixtures under different modes of fatigue loading. Transp. Res. Rec. J. Transp. Res. Board 2014, 2447, 117–125. [Google Scholar] [CrossRef]
- Al-Khateeb, G.; Shenoy, A. A distinctive fatigue failure criterion. Asph. Paving Technol. Assoc. Asph. Paving Technol. Proc. Tech. Sess. 2004, 73, 585–622. [Google Scholar]
- Ashayer Soltani, M.A. Comportement en Fatigue des Enrobés Bitumeux. Ph.D. Thesis, Ecole Nationale des Travaux Publics de l’Etat (ENTPE)—Institut National des Sciences Appliquées de Lyon (INSA), Lyon, France, 1998. [Google Scholar]
- Baaj, H. Comportement à la Fatigue des Matériaux Granulaires Traités aux Liants Hydrocarbonés. Ph.D. Thesis, Ecole Nationale des Travaux Publics de l’Etat (ENTPE) and Institut National des Sciences Appliquées de Lyon (INSA), Lyon, France, 2002. [Google Scholar]
- Kutay, M.E.; Gibson, N.; Youtcheff, J. Conventional and viscoelastic continuum damage (VECD)—Based fatigue analysis of polymer modified asphalt pavements. J. Assoc. Asph. Paving Technol. 2008, 77, 395–435. [Google Scholar]
- Shen, S. Dissipated Energy Concepts for HMA Performance: Fatigue and Healing. Ph.D. Dissertation, University of Illinois at Urbana-Champaign, Champaign, IL, USA, 2006. [Google Scholar]
- Chomton, G.; Valyer, P.J. Applied rheology of asphalt mixes—Practical applications. In Proceedings of the Third International Conference on the Structural Design of Asphalt Pavement, London, UK, 11–15 September 1972; pp. 214–225. [Google Scholar]
- Van Dijk, W.; Moreaud, H.; Quedeville, A.; Ugé, P. The fatigue of bitumen and bituminous mixes. In Proceedings of the Third International Conference on the Structural Design of Asphalt Pavement, London, UK, 11–15 September 1972; pp. 355–366. [Google Scholar]
- Dondi, G.; Vignali, V.; Pettinari, M.; Mazzotta, F.; Simone, A.; Sangiorgi, C. Modeling the DSR complex shear modulus of asphalt binder using 3D discrete element approach. Constr. Build. Mater. 2014, 54, 236–246. [Google Scholar] [CrossRef]
- Carpenter, S.; Shen, S. Dissipated energy approach to study hot-mix asphalt healing in fatigue. Transp. Res. Rec. 2006, 1970, 178–185. [Google Scholar] [CrossRef]
- Daniel, J.S.; Bisirri, W.; Kim, Y.R. Fatigue evaluation of asphalt mixtures using dissipated energy and viscoelastic continuum damage approaches. Asph. Paving Technol. Assoc. Asph. Paving Technol. Proc. Tech. Sess. 2004, 73, 557–583. [Google Scholar]
- Van Dijk, W.; Visser, W. The energy approach to fatigue for pavement design. In Proceedings of the Association of Asphalt Paving Technologists Proc, San Antonio, TX, USA, 21–23 February 1977; pp. 1–40. [Google Scholar]
- Pronk, A.C.; Hopman, P.C. Energy dissipation: The leading factor of fatigue. In Highway Research: Sharing the Benefits; Thomas Telford Publishing: London, UK, 1991; pp. 255–267. [Google Scholar]
- Hopman, P.; Kunst, P.; Pronk, A. A renewed interpretation method for fatigue measurements-verification of Miner’s rule. In Proceedings of the 4th Eurobitume Symp, Brussels, Belgium, 4–6 October 1989; Association, E.B., Ed.; European Bitumen Association: Brussels, Belgium, 1989; pp. 557–561. [Google Scholar]
- Pronk, A. Fatigue Lives of Asphalt Beams in 2 and 4 Point Dynamic Bending Tests Based on a ’New’ Fatigue Life Definition Using the "Dissipated Energy Concept": Phase III: DAB 0/8: Controlled Force Mode; Report no. W-DWW-99-006; Ministerie van Verkeer en Waterstaat: Hague, The Netherlands, 1999. [Google Scholar]
- Pronk, A. Fatigue Lives of Asphalt Beams in 2 and 4 Point Dynamic Bending Tests Based on a ’New’ Fatigue Life Definition Using the "Dissipated Energy Concept": Phase II: DAB 0/8: Controlled Displacement Mode; Report no. W-DWW-98-001; Ministerie van Verkeer en Waterstaat: Hague, The Netherlands, 1998. [Google Scholar]
- Rowe, G.M.; Bennert, T.; Blankenship, P.; Criqui, W.; Mamlouk, M.; Willes, J.R.; Steger, R.; Mohammad, L. The Bending Beam Fatigue Test Improvements to Test Procedure Definition and Analysis; Asphalt Mixture Expert Task Group: Boton Rouge, LA, USA, 2012. [Google Scholar]
- AASHTO T 321-14; Standard Method of Test for Determining the Fatigue Life of Compacted Asphalt Mixtures Subjected to Repeated Flexural Bending. AASHTO: Washington, DC, USA, 2014.
- Zeiada, W. Endurance Limit for HMA Based on Healing Phenomenon Using Viscoelastic Continuum Damage Analysis. Ph.D. Thesis, Arizona State University, Tempe, AZ, USA, 2012. [Google Scholar]
- AASHTO T 321-22; Standard Method of Test for Determining the Fatigue Life of Compacted Asphalt Mixtures Subjected to Repeated Flexural Bending. AASHTO: Washington, DC, USA, 2022.
- Tsai, B.-W.; Harvey, J.T.; Monismith, C.L. High temperature fatigue and fatigue damage process of aggregate-asphalt mixes. Asph. Paving Technol. Assoc. Asph. Paving Technol. Proc. Tech. Sess. 2002, 71, 345–385. [Google Scholar]
- Fang, C.; Guo, N.; Sun, Y.; Wang, J. Research on fatigue life of rubber asphalt mixture based on stiffness modulus. Eng. Mech. 2020, 37, 196–204. [Google Scholar]
- Bonnetti, K.; Nam, K.; Bahia, H. Measuring and defining fatigue behavior of asphalt binders. Transp. Res. Rec. 2002, 1810, 33–43. [Google Scholar] [CrossRef]
- Ghuzlan, K.; Carpenter, S. Energy-derived, damage-based failure criterion for fatigue testing. Transp. Res. Rec. 2000, 1723, 141–149. [Google Scholar] [CrossRef]
- Carpenter, S.H.; Jansen, M. Fatigue Behavior Under New Aircraft Loading Conditions; Aircraft/Pavement Technology in the Midst of Change: Seattle, WA, USA, 1997; pp. 259–271. [Google Scholar]
- Carpenter, S.H.; Ghuzlan, K.A.; Shen, S. Fatigue endurance limit for highway and airport pavements. Transp. Res. Rec. J. Transp. Res. Board 2003, 1832, 131–138. [Google Scholar] [CrossRef]
- Bhasin, A.; Castelo Branco Veronica, T.; Masad, E.; Little Dallas, N. Quantitative comparison of energy methods to characterize fatigue in asphalt materials. J. Mater. Civ. Eng. 2009, 21, 83–92. [Google Scholar] [CrossRef]
- Shen, S.; Sutharsan, T. Quantification of cohesive healing of asphalt binder and its impact factors based on dissipated energy analysis. Road Mater. Pavement Des. 2011, 12, 525–546. [Google Scholar] [CrossRef]
- Wu, H.; Huang, B.; Shu, X. Characterizing fatigue behavior of asphalt mixtures utilizing loaded wheel tester. J. Mater. Civ. Eng. 2014, 26, 152–159. [Google Scholar] [CrossRef]
- Nejad Fereidoon, M.; Notash, M.; Forough Seyed, A. Evaluation of healing potential in unmodified and SBS-modified asphalt mixtures using a dissipated-energy approach. J. Mater. Civ. Eng. 2015, 27, 04015060. [Google Scholar] [CrossRef]
- Sun, Y.; Fang, C.; Wang, J.; Ma, Z. Method of fatigue life prediction for rubber asphalt mixture based on plateau value of dissipated energy ratio. J. Build. Mater. 2019, 22, 108–112. [Google Scholar]
- Fang, C. Research on Damage Evolution and Fatigue Life Prediction of Asphalt Mixture. Master’s Thesis, Shenyang Jianzhu University, Shenyang, China, 2019. [Google Scholar]
- Fang, C.; Guo, N.; You, Z.; Tan, Y.; Wang, L.; Wen, Y. Fatigue damage characteristics for asphalt mixture based on energy dissipation history. J. Southeast Univ. Nat. Sci. Ed. 2021, 51, 1018–1024. [Google Scholar]
- Zhang, Z.; Roque, R.; Birgisson, B.; Sangpetngam, B. Identification and verification of a suitable crack growth law. Proc. Assoc. Asph. Paving Technol. 2001, 70, 206–241. [Google Scholar]
- Roque, R.; Birgisson, B.; Sangpetngam, B.; Zhang, Z. Hot mix asphalt fracture mechanics: A fundamental crack growth law for asphalt mixtures. Asph. Paving Technol. Assoc. Asph. Paving Technol. Proc. Tech. Sess. 2002, 71, 816–827. [Google Scholar]
- Zhang, Z. Identification of Suitable Crack Growth Law for Asphalt Mixture Using the Superpave Indirect Tensile Test (IDT). Ph.D. Thesis, University of Florida, Gainesville, FL, USA, 2000. [Google Scholar]
- Birgisson, B.; Montepara, A.; Romeo, E.; Roque, R.; Roncella, R.; Tebaldi, G. Determination of fundamental tensile failure limits of mixtures. J. Assoc. Asph. Paving Technol. 2007, 76, 303–344. [Google Scholar]
- Masad, E.; Castelo Branco, V.T.F.; Little, D.N.; Lytton, R. A unified method for the analysis of controlled-strain and controlled-stress fatigue testing. Int. J. Pavement Eng. 2008, 9, 233–246. [Google Scholar] [CrossRef]
- Castelo Branco, V.; Masad, E.; Bhasin, A.; Little, D. Fatigue analysis of asphalt mixtures independent of mode of loading. Transp. Res. Rec. 2008, 2057, 149–156. [Google Scholar] [CrossRef]
- Paris, P.; Erdogan, F. A critical analysis of crack propagation laws. J. Basic Eng. 1963, 85, 528–533. [Google Scholar] [CrossRef]
- Erkens, S.; Moraal, J. Cracking in asphalt concrete. Heron 1996, 41, 53–70. [Google Scholar]
- SHRP. Development and Validation of Performance Prediction Models and Specifications for Asphalt Binders and Paving Mixes; National Academy of Sciences: Washington, DC, USA, 1993. [Google Scholar]
- Schapery, R.A. Correspondence principles and a generalized J integral for large deformation and fracture analysis of viscoelastic media. Int. J. Fract. 1984, 25, 195–223. [Google Scholar] [CrossRef]
- Schapery, R.A. On Viscoelastic Deformation and Failure Behavior of Composite Materials with Distributed Flaws; ASME: New York, NY, USA, 1981; pp. 5–20. [Google Scholar]
- Schapery, R.A. Nonlinear viscoelastic and viscoplastic constitutive equations based on thermodynamics. Mech. Time-Depend. Mater. 1997, 1, 209–240. [Google Scholar] [CrossRef]
- Schapery, R.A. Nonlinear viscoelastic and viscoplastic constitutive equations with growing damage. Int. J. Fract. 1999, 97, 33–66. [Google Scholar] [CrossRef]
- Kim, Y.R.; Little Dallas, N. One-dimensional constitutive modeling of asphalt concrete. J. Eng. Mech. 1990, 116, 751–772. [Google Scholar] [CrossRef]
- Daniel, J.S.; Kim, Y.R. Development of a simplified fatigue test and analysis procedure using a viscoelastic continuum damage model. J. Assoc. Asph. Paving Technol. 2002, 71, 619–650. [Google Scholar]
- Chehab, G.; Kim, Y.-R.; Schapery, R.; Witczak, M.W.; Bonaquist, R. Time-temperature superposition principle for asphalt concrete with growing damage in tension state. J. Assoc. Asph. Paving Technol. 2002, 71, 559–593. [Google Scholar]
- Underwood, B.S.; Kim, Y.R.; Guddati, M.N. Improved calculation method of damage parameter in viscoelastic continuum damage model. Int. J. Pavement Eng. 2010, 11, 459–476. [Google Scholar] [CrossRef]
- Lee, J.-S.; Kim, Y. Performance-based moisture susceptibility evaluation of warm-mix asphalt concrete through laboratory tests. Transp. Res. Rec. J. Transp. Res. Board 2014, 2446, 17–28. [Google Scholar] [CrossRef]
- Wen, H.; Bahia, H. Characterizing fatigue of asphalt binders with viscoelastic continuum damage mechanics. Transp. Res. Rec. 2009, 2126, 55–62. [Google Scholar] [CrossRef]
- Johnson, C.; Bahia, H.U. Evaluation of an accelerated procedure for fatigue characterization of asphalt binders. Road Mater. Pavement Des. 2011, 10, Y201Z. [Google Scholar]
- Safaei, F.; Castorena, C. Temperature effects of linear amplitude sweep testing and analysis. Transp. Res. Rec. 2016, 2574, 92–100. [Google Scholar] [CrossRef]
- Safaei, F.; Castorena, C.; Kim, Y.R. Linking asphalt binder fatigue to asphalt mixture fatigue performance using viscoelastic continuum damage modeling. Mech. Time-Depend. Mater. 2016, 20, 299–323. [Google Scholar] [CrossRef]
- Underwood, B.S. A continuum damage model for asphalt cement and asphalt mastic fatigue. Int. J. Fatigue 2016, 82, 387–401. [Google Scholar] [CrossRef]
- Lee, H.-J.; Kim, Y.R. Viscoelastic constitutive model for asphalt concrete under cyclic loading. J. Eng. Mech. 1998, 124, 32–40. [Google Scholar] [CrossRef]
- Lee, H.-J.; Kim, Y.R. Viscoelastic continuum damage model of asphalt concrete with healing. J. Eng. Mech. 1998, 124, 1224–1232. [Google Scholar] [CrossRef]
- Hou, T.; Underwood, S.; Kim, Y.R. Fatigue performance prediction of North Carolina mixtures using the simplified viscoelastic continuum damage model. Asph. Paving Technol. Assoc. Asph. Paving Technol. Proc. Tech. Sess. 2010, 79, 35–73. [Google Scholar]
- Zhang, J. Development of Failure Criteria for Asphalt Concrete Mixtures Under Fatigue Loading. Master’s Thesis, North Carolina State University, Raleigh, NC, USA, 2012. [Google Scholar]
- Freire, R.A. Evaluation of the Coarse Aggregate Influence in the Fatigue Damage Using Fine Aggregate Matrices with Different Maximum Nominal Sizes. Ph.D. Thesis, Universidade Federal do Ceará, Fortaleza, Ceará, Brazil, 2015. [Google Scholar]
- Lee, K.C. Improvement in Dynamic Modulus and Cyclic Fatigue Testing of Asphalt Mixture. Ph.D. Thesis, North Carolina State University, Raleigh, NC, USA, 2020. [Google Scholar]
- AASHTO T 400-24; Standard Method of Test for Determining the Damage Characteristic Curve and Failure Criterion Using the Asphalt Mixture Performance Tester (AMPT) Cyclic Fatigue Test. AASHTO: Washington, DC, USA, 2024.


| Criteria | Indicator | Schematic Diagram | References |
|---|---|---|---|
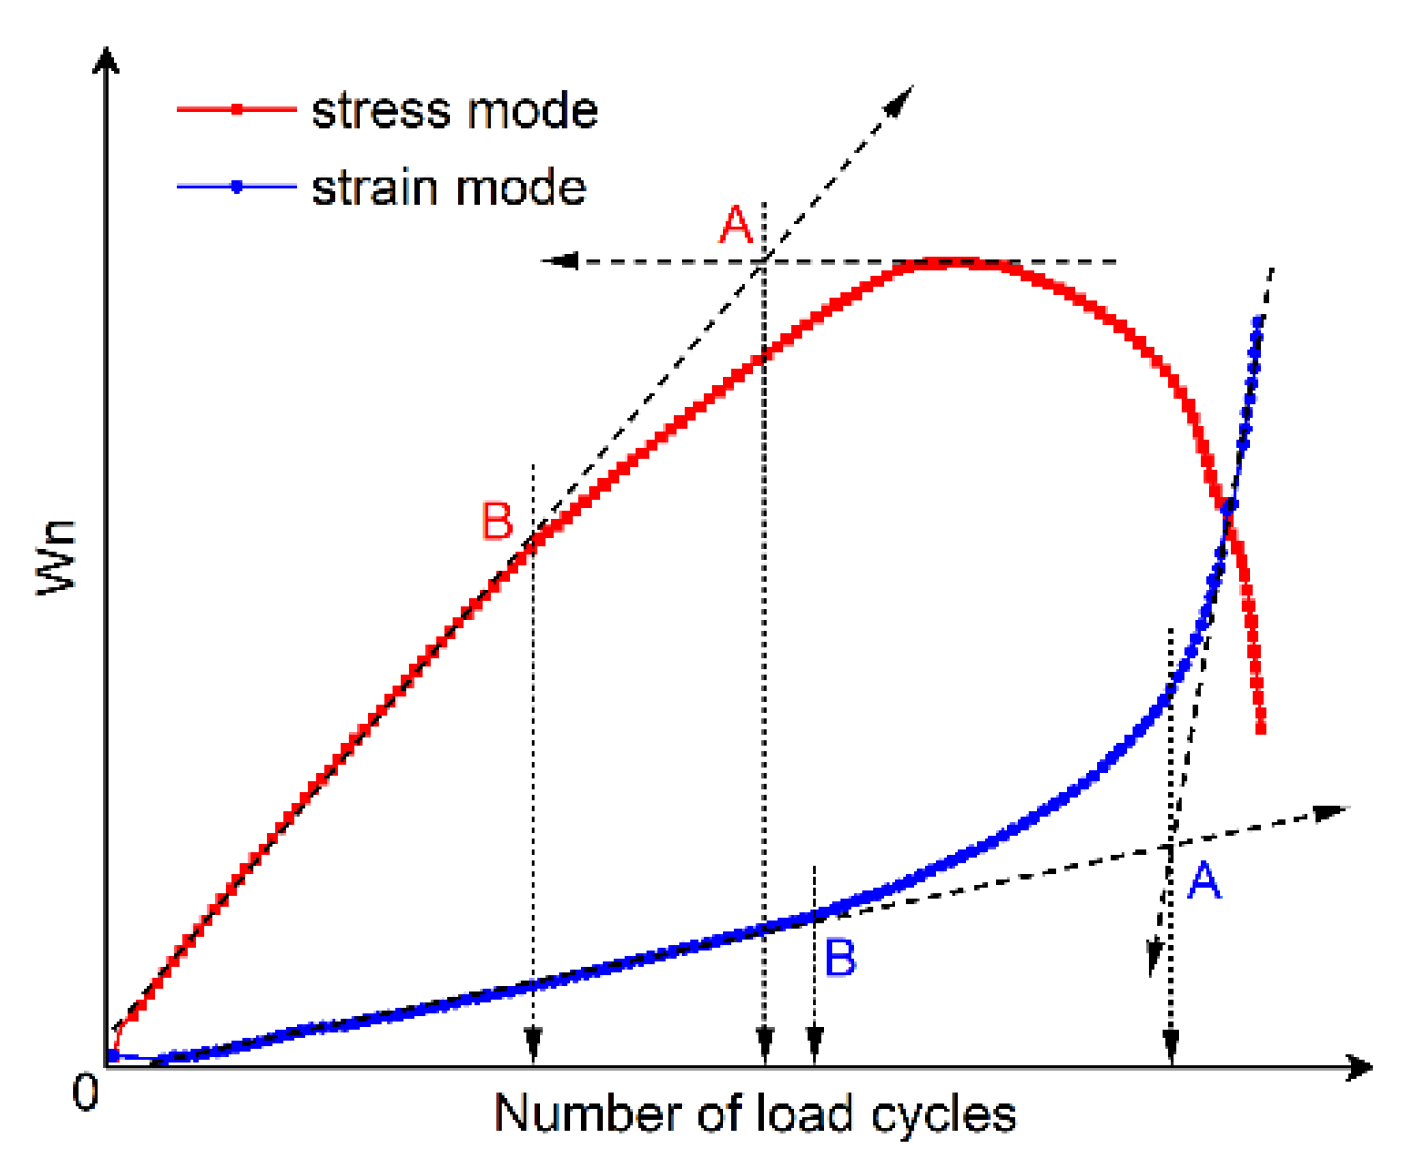
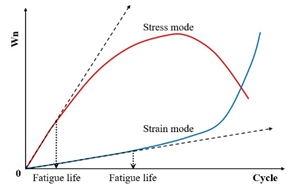
| Energy ratio criteria | Energy ratio (Wn) | 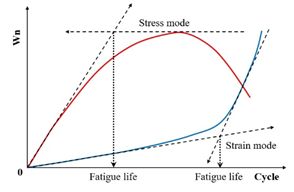 | [147] |
 | [128] | ||
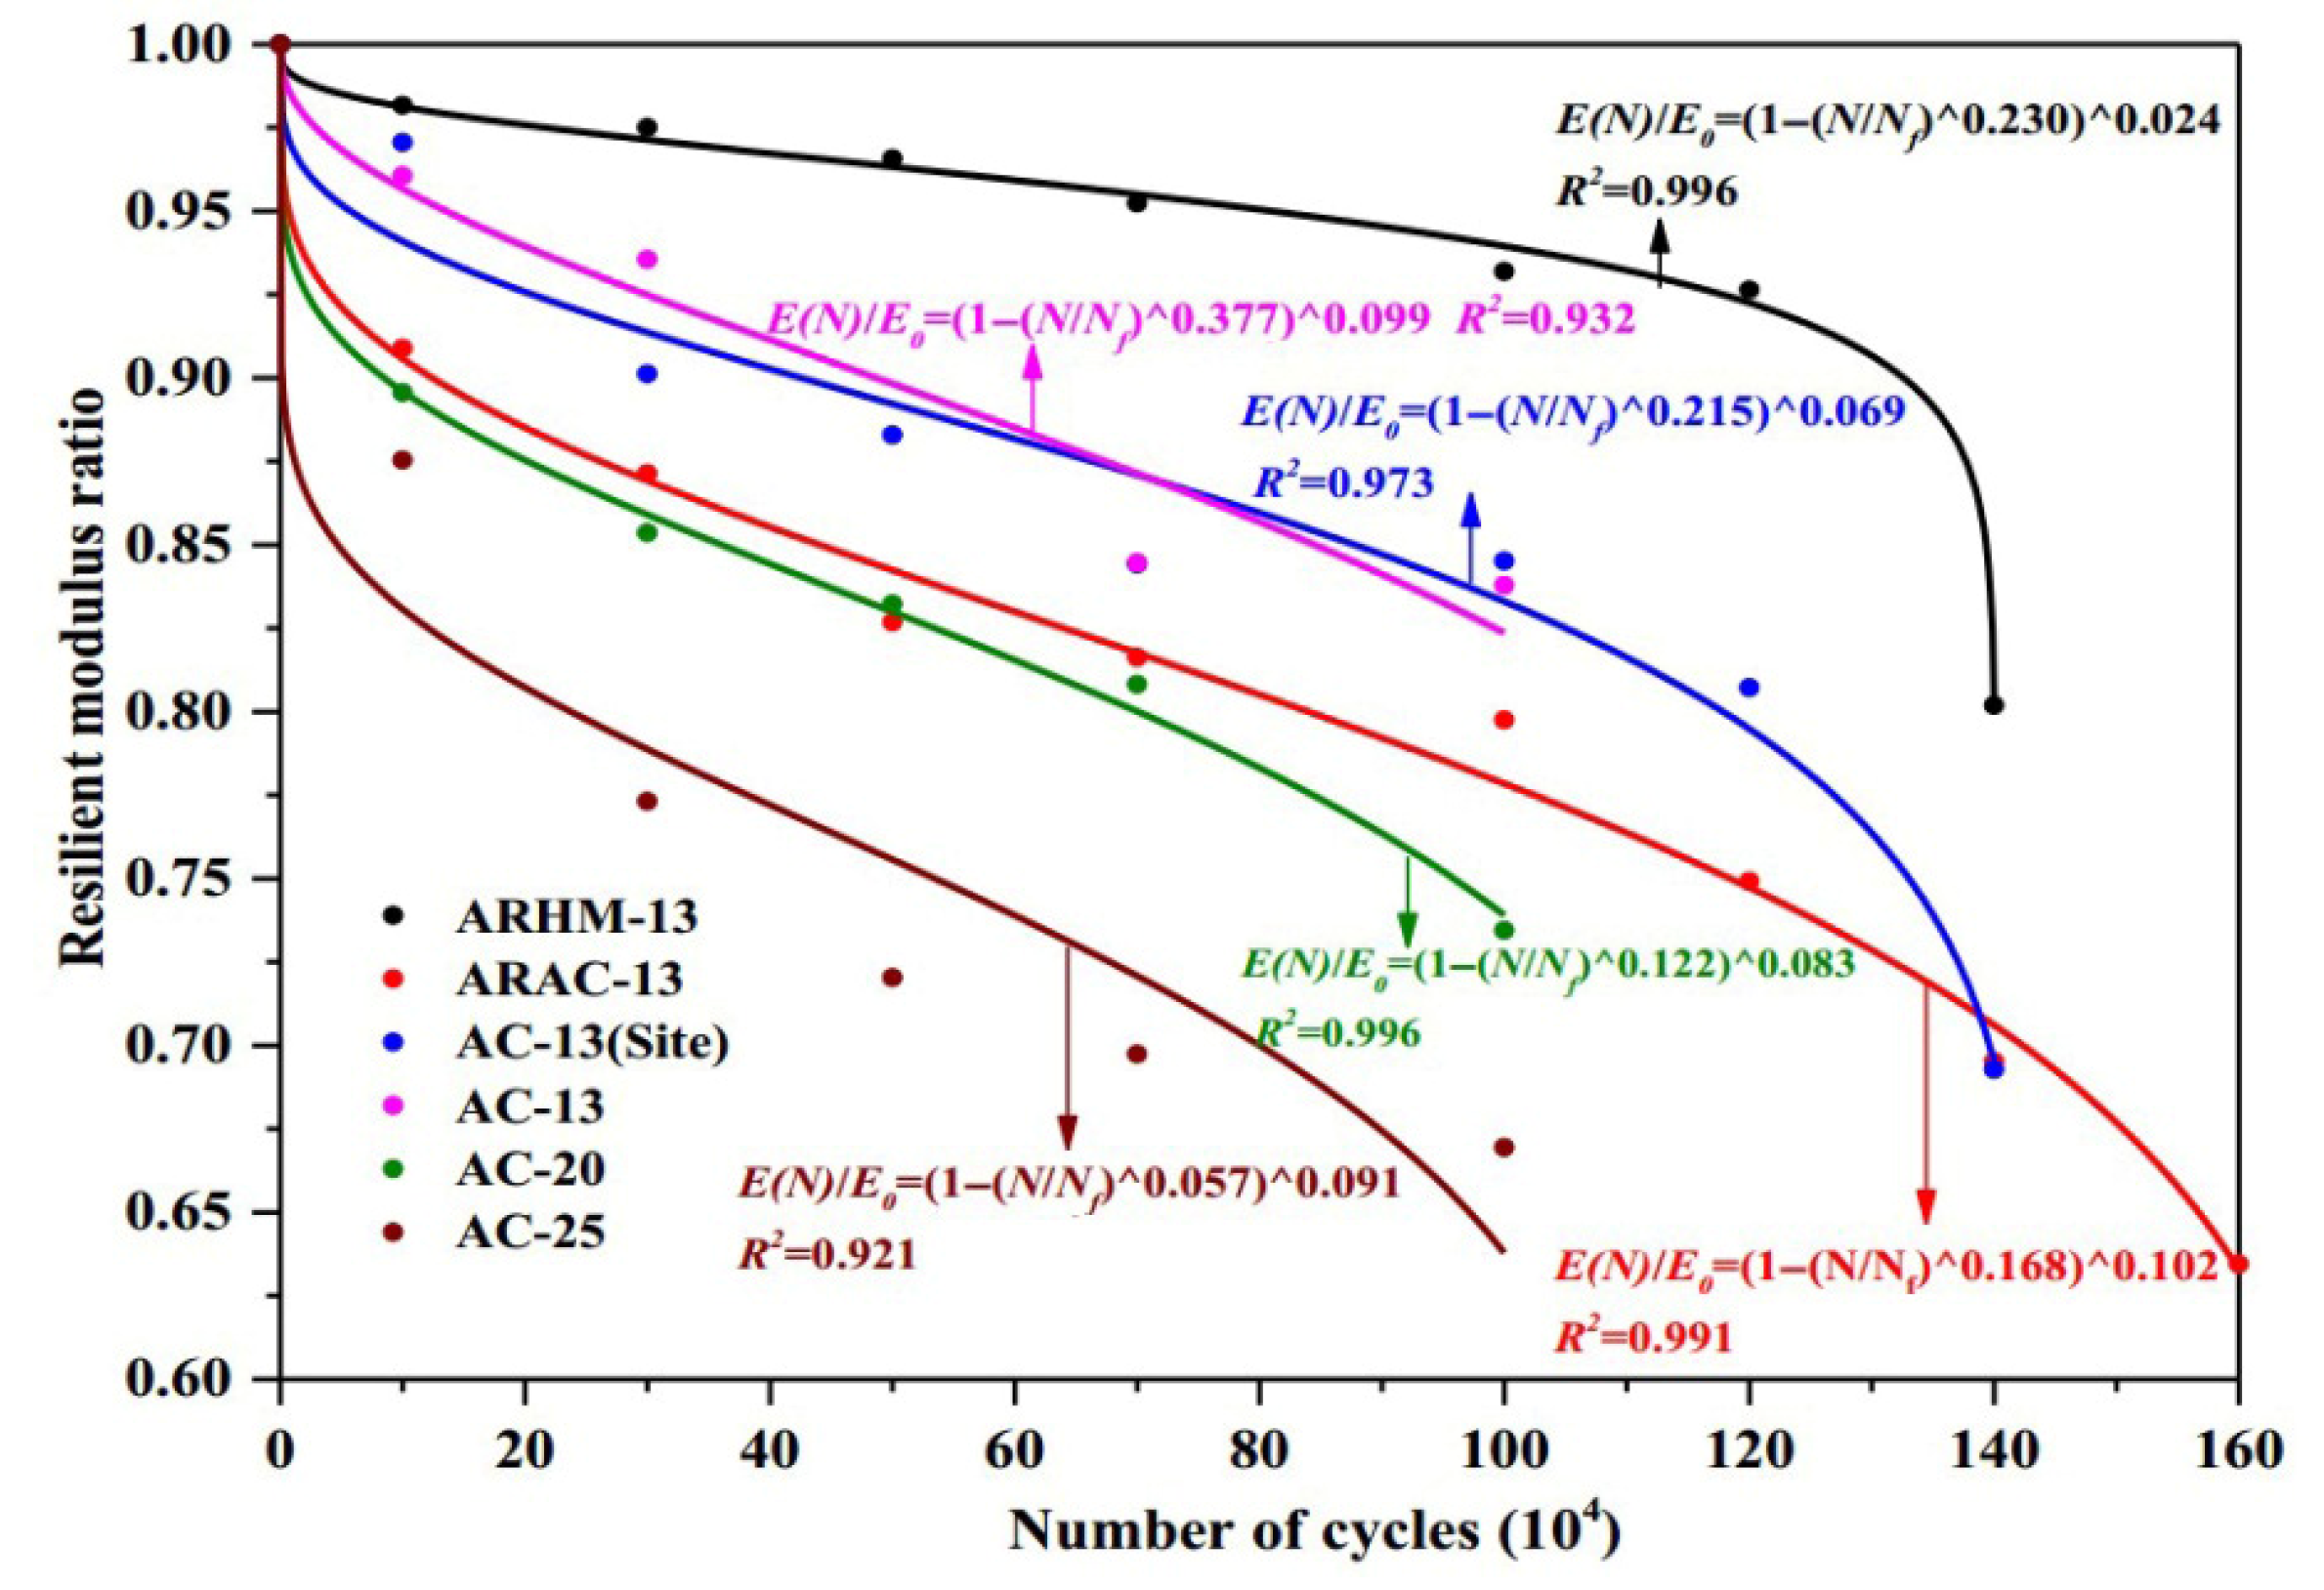
| Stiffness degradation ratio criterion | Stiffness degradation ratio ( ) | 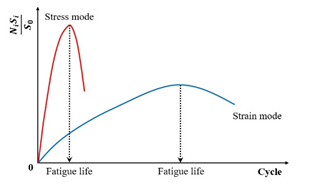 | [151] |
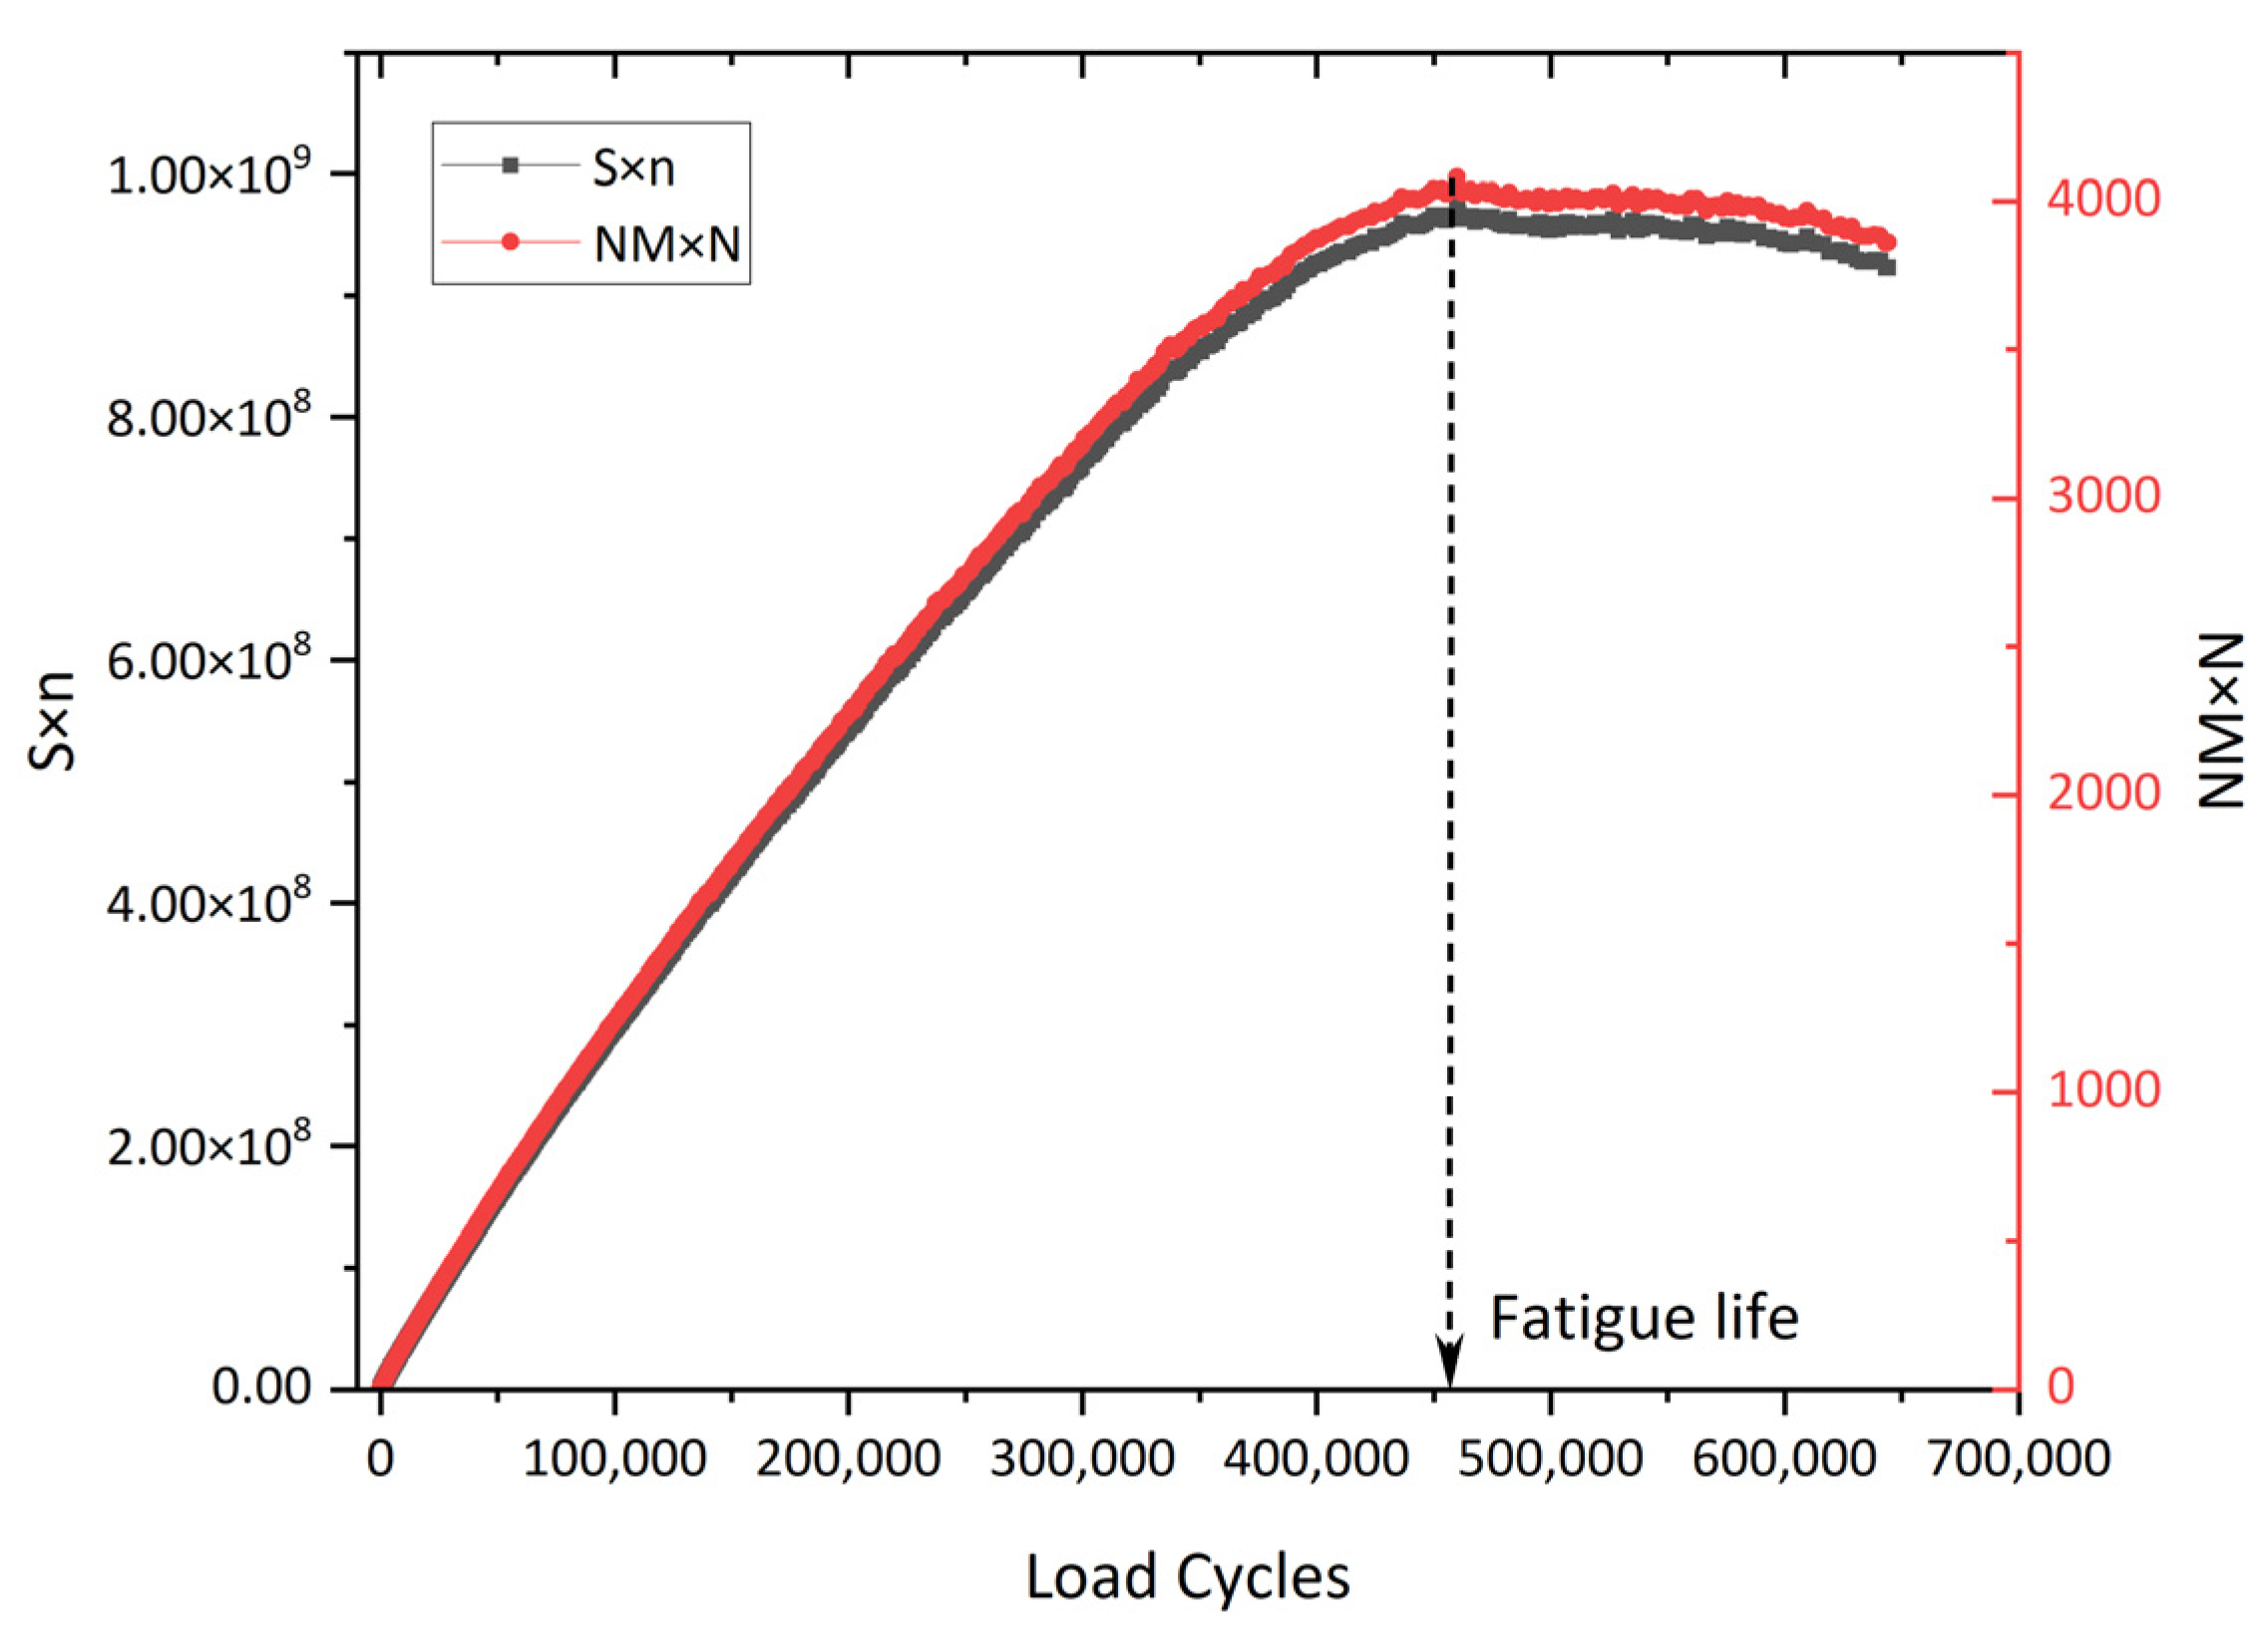
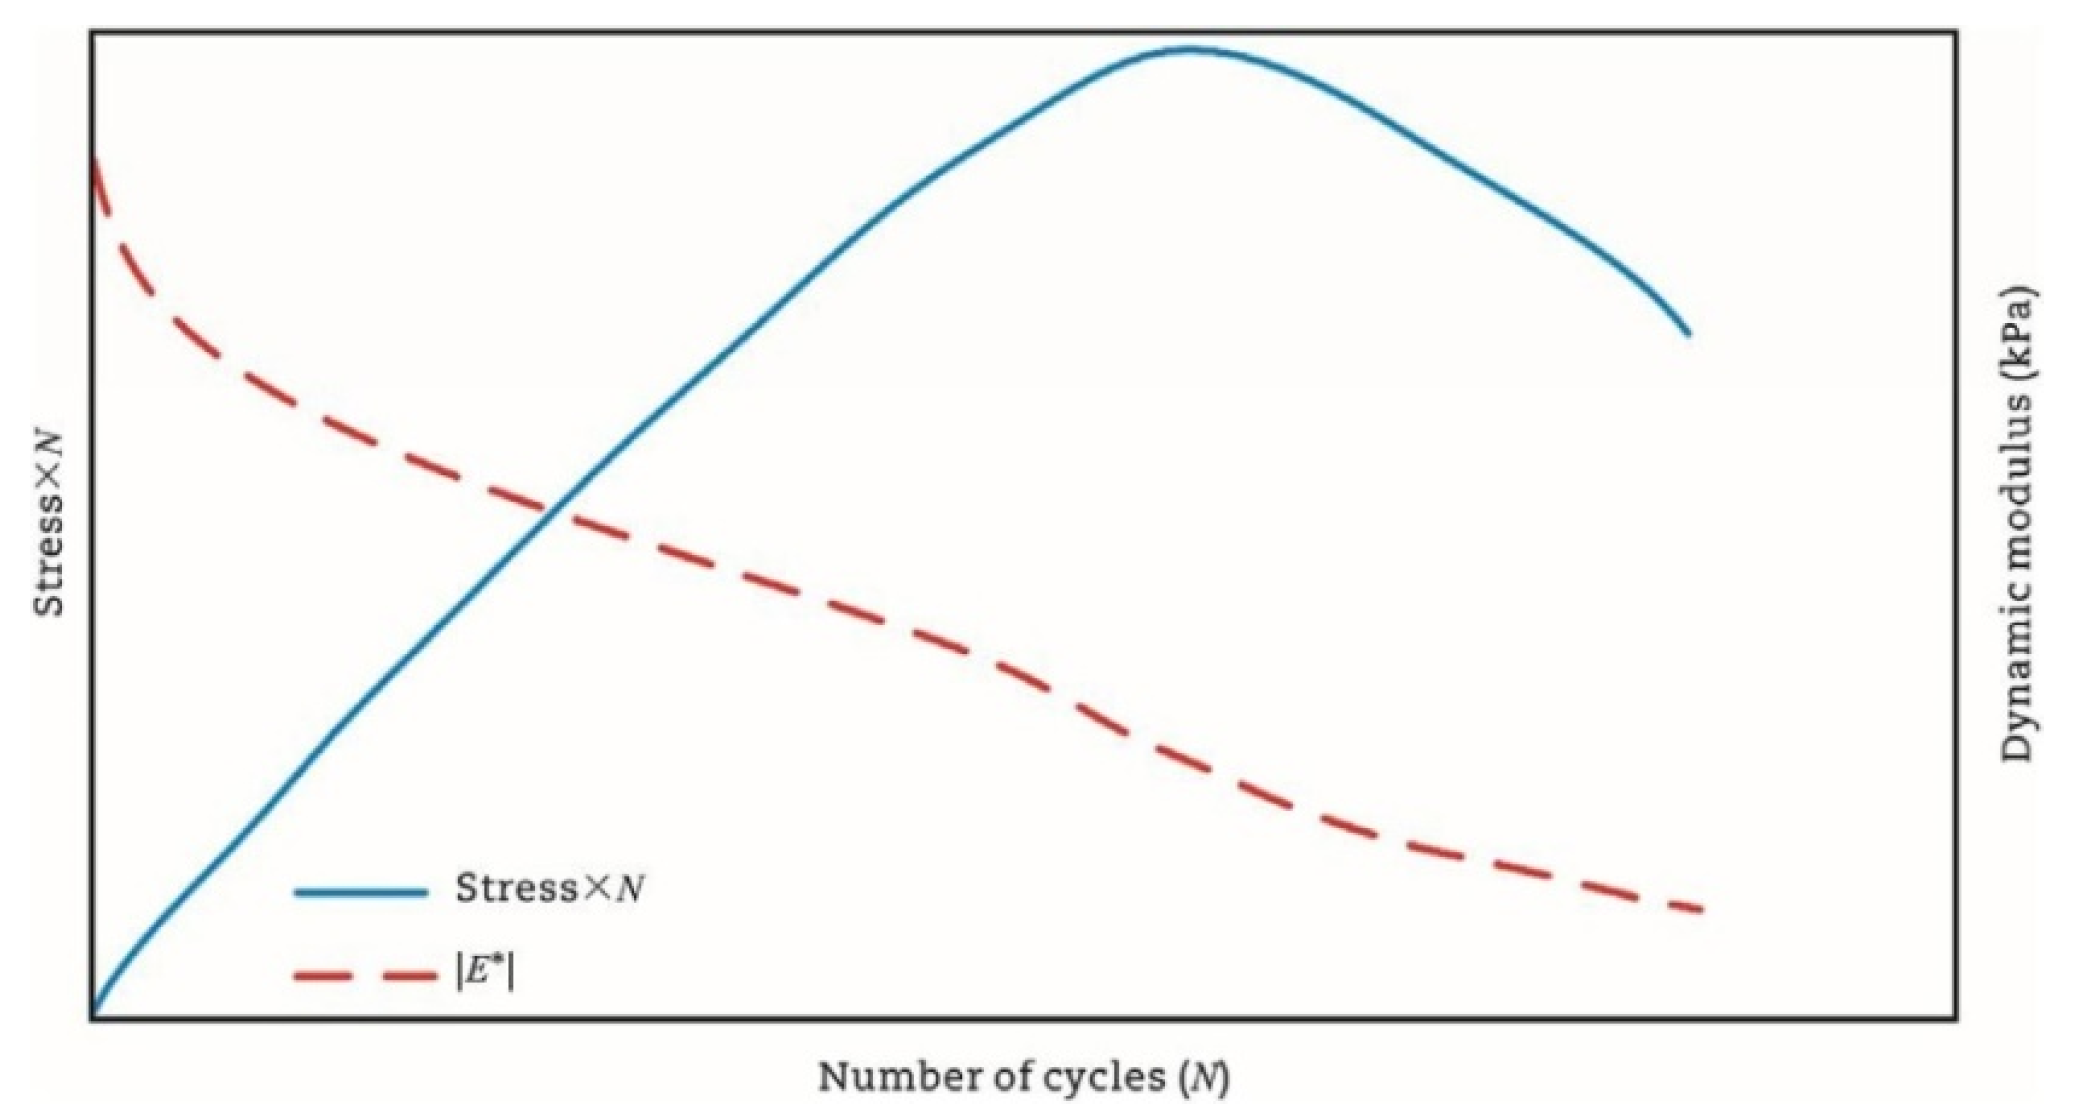
| The normalized modulus × cycles () | 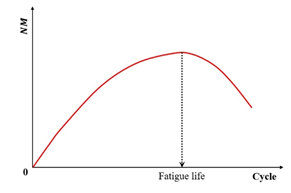 | [152] | |
| The maximum stiffness reduction rate ( ) | 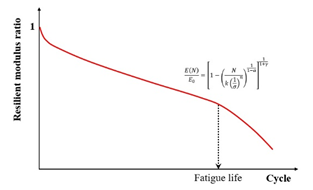 | [11] | |
| The stiffness modulus degradation ratio (SMDR) | 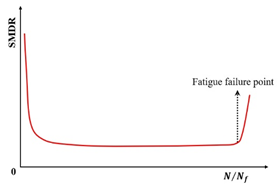 | [154] | |
| Stress degradation ratio criterion | Stress × | 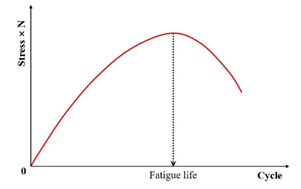 | [7] |
| Dissipated energy ratio criteria | The dissipated energy ratio (DER) | 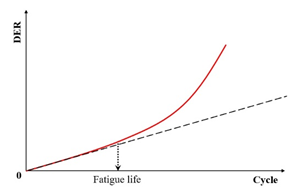 | [155] |
| The ratio of the dissipated energy change (RDEC) | 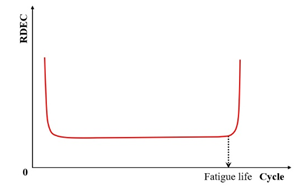 | [142,143,156] | |
| The ratio of the cumulative dissipated energy change (RCDEC) | 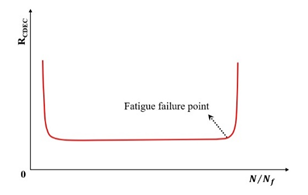 | [165] | |
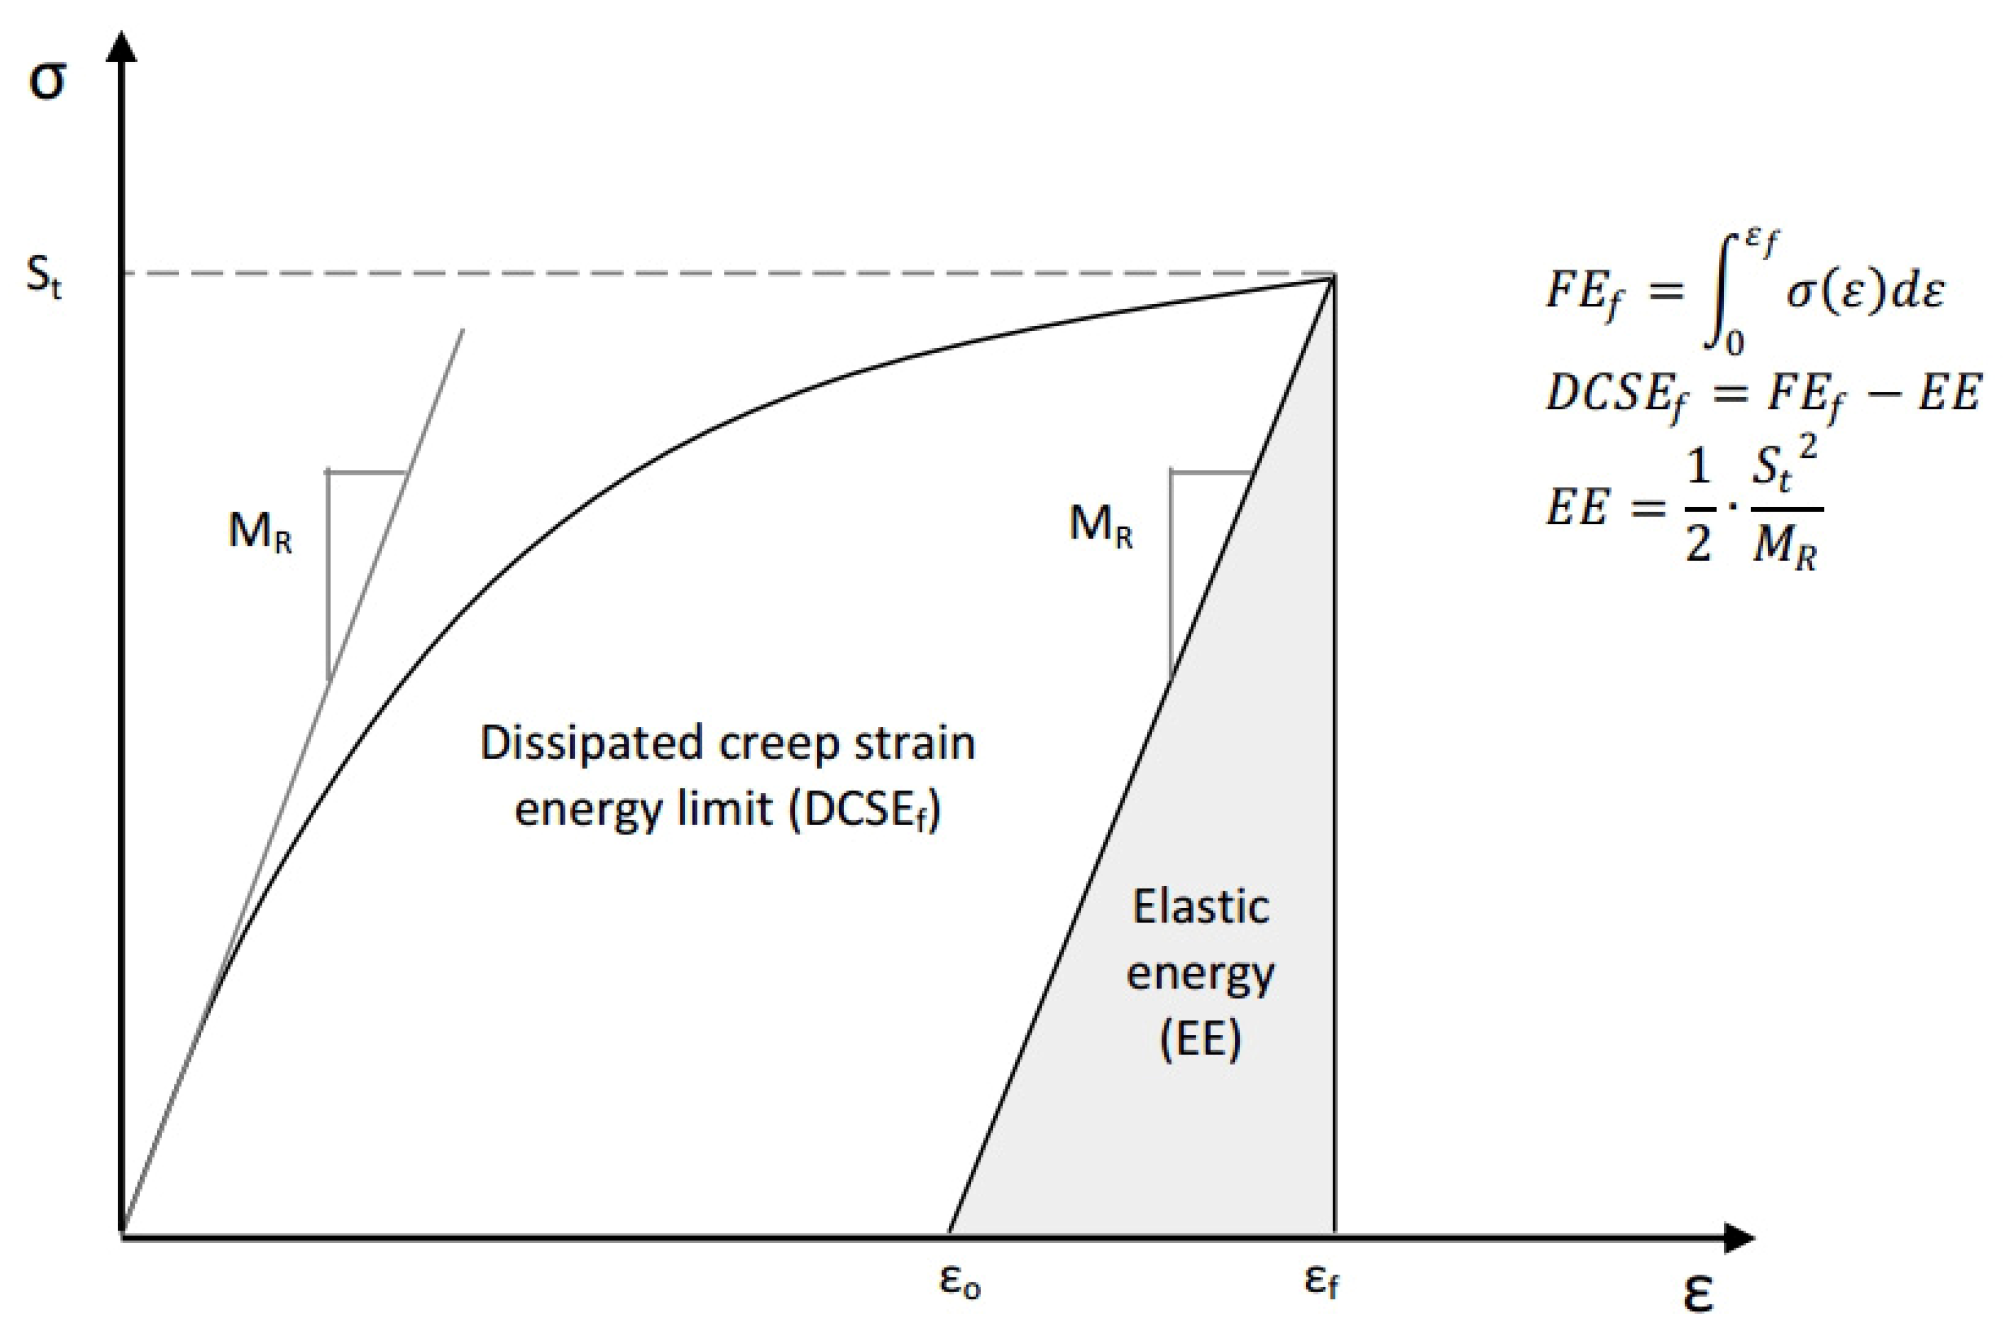
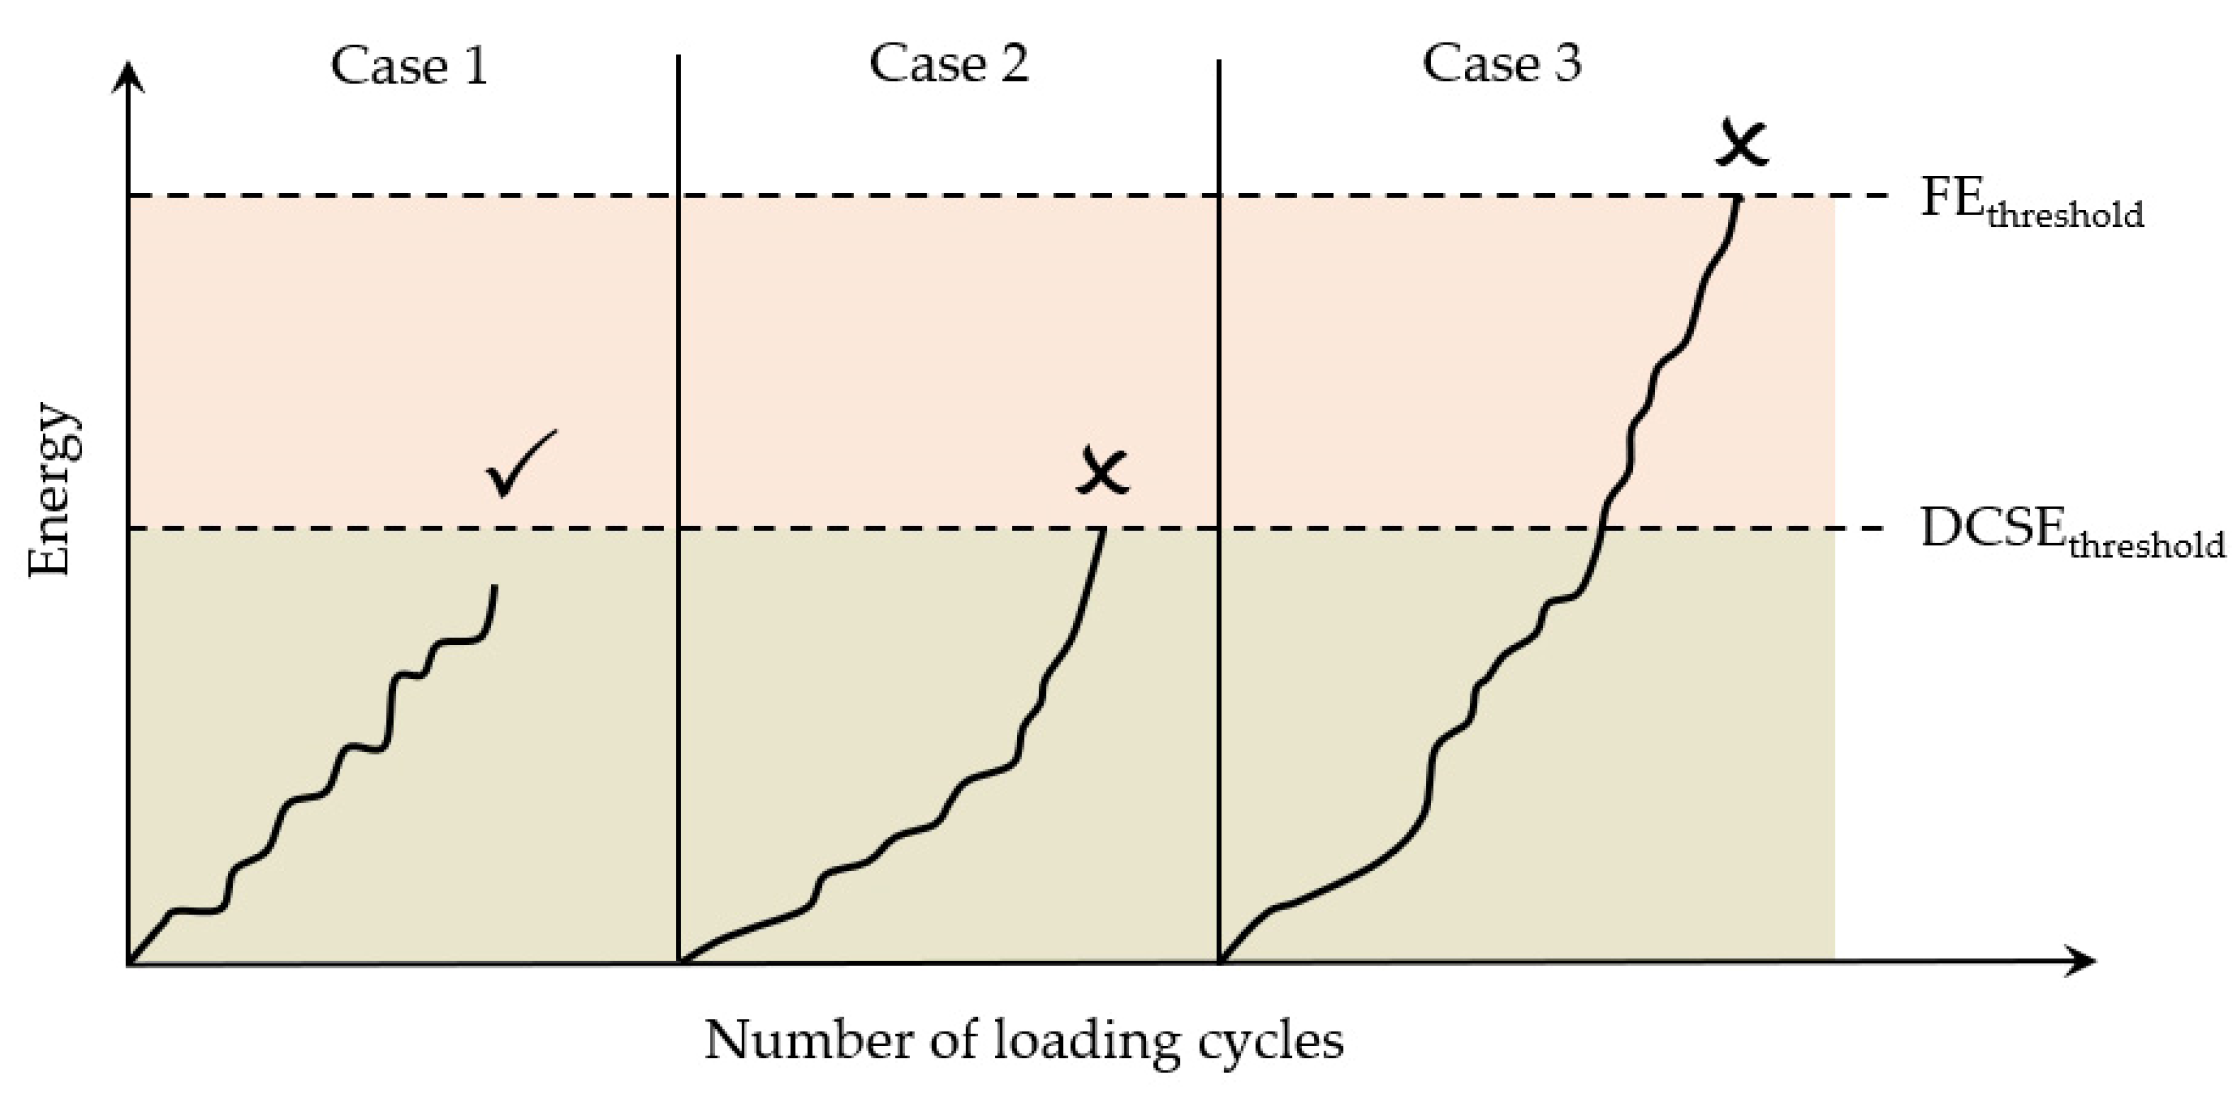
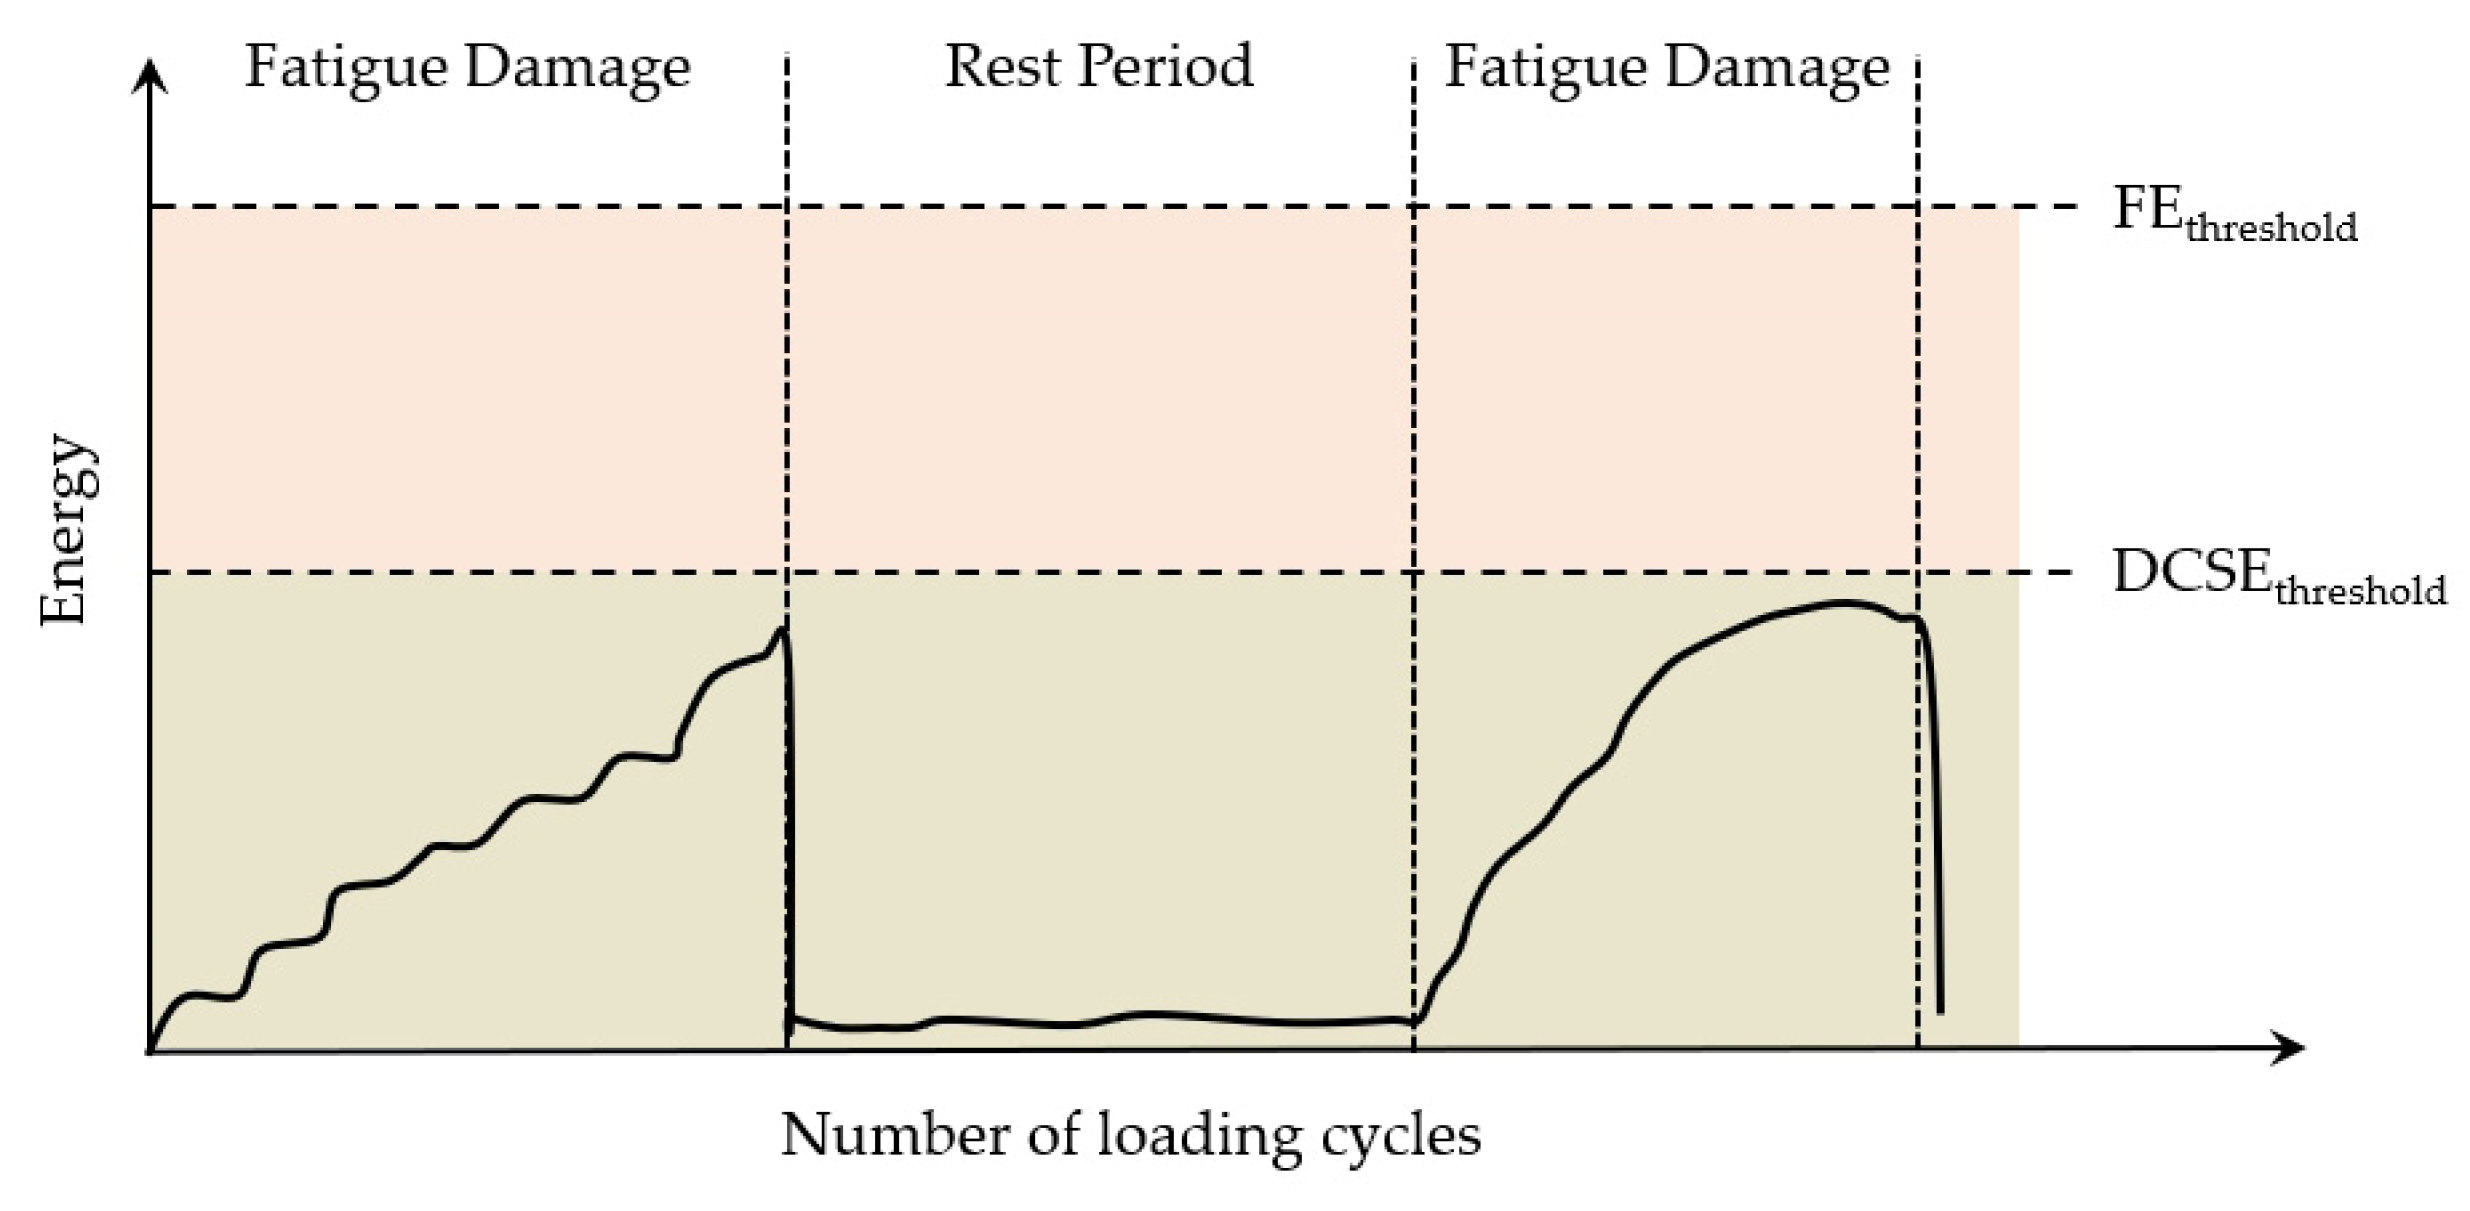
| Fracture energy criteria | The fracture energy limit (
); The dissipated creep strain energy limit ( ) | 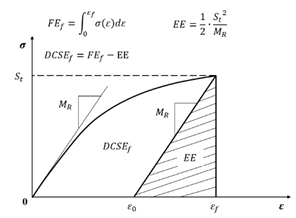 | [166,168,169] |
| Criteria | Indicator | Schematic Diagram | References |
|---|---|---|---|
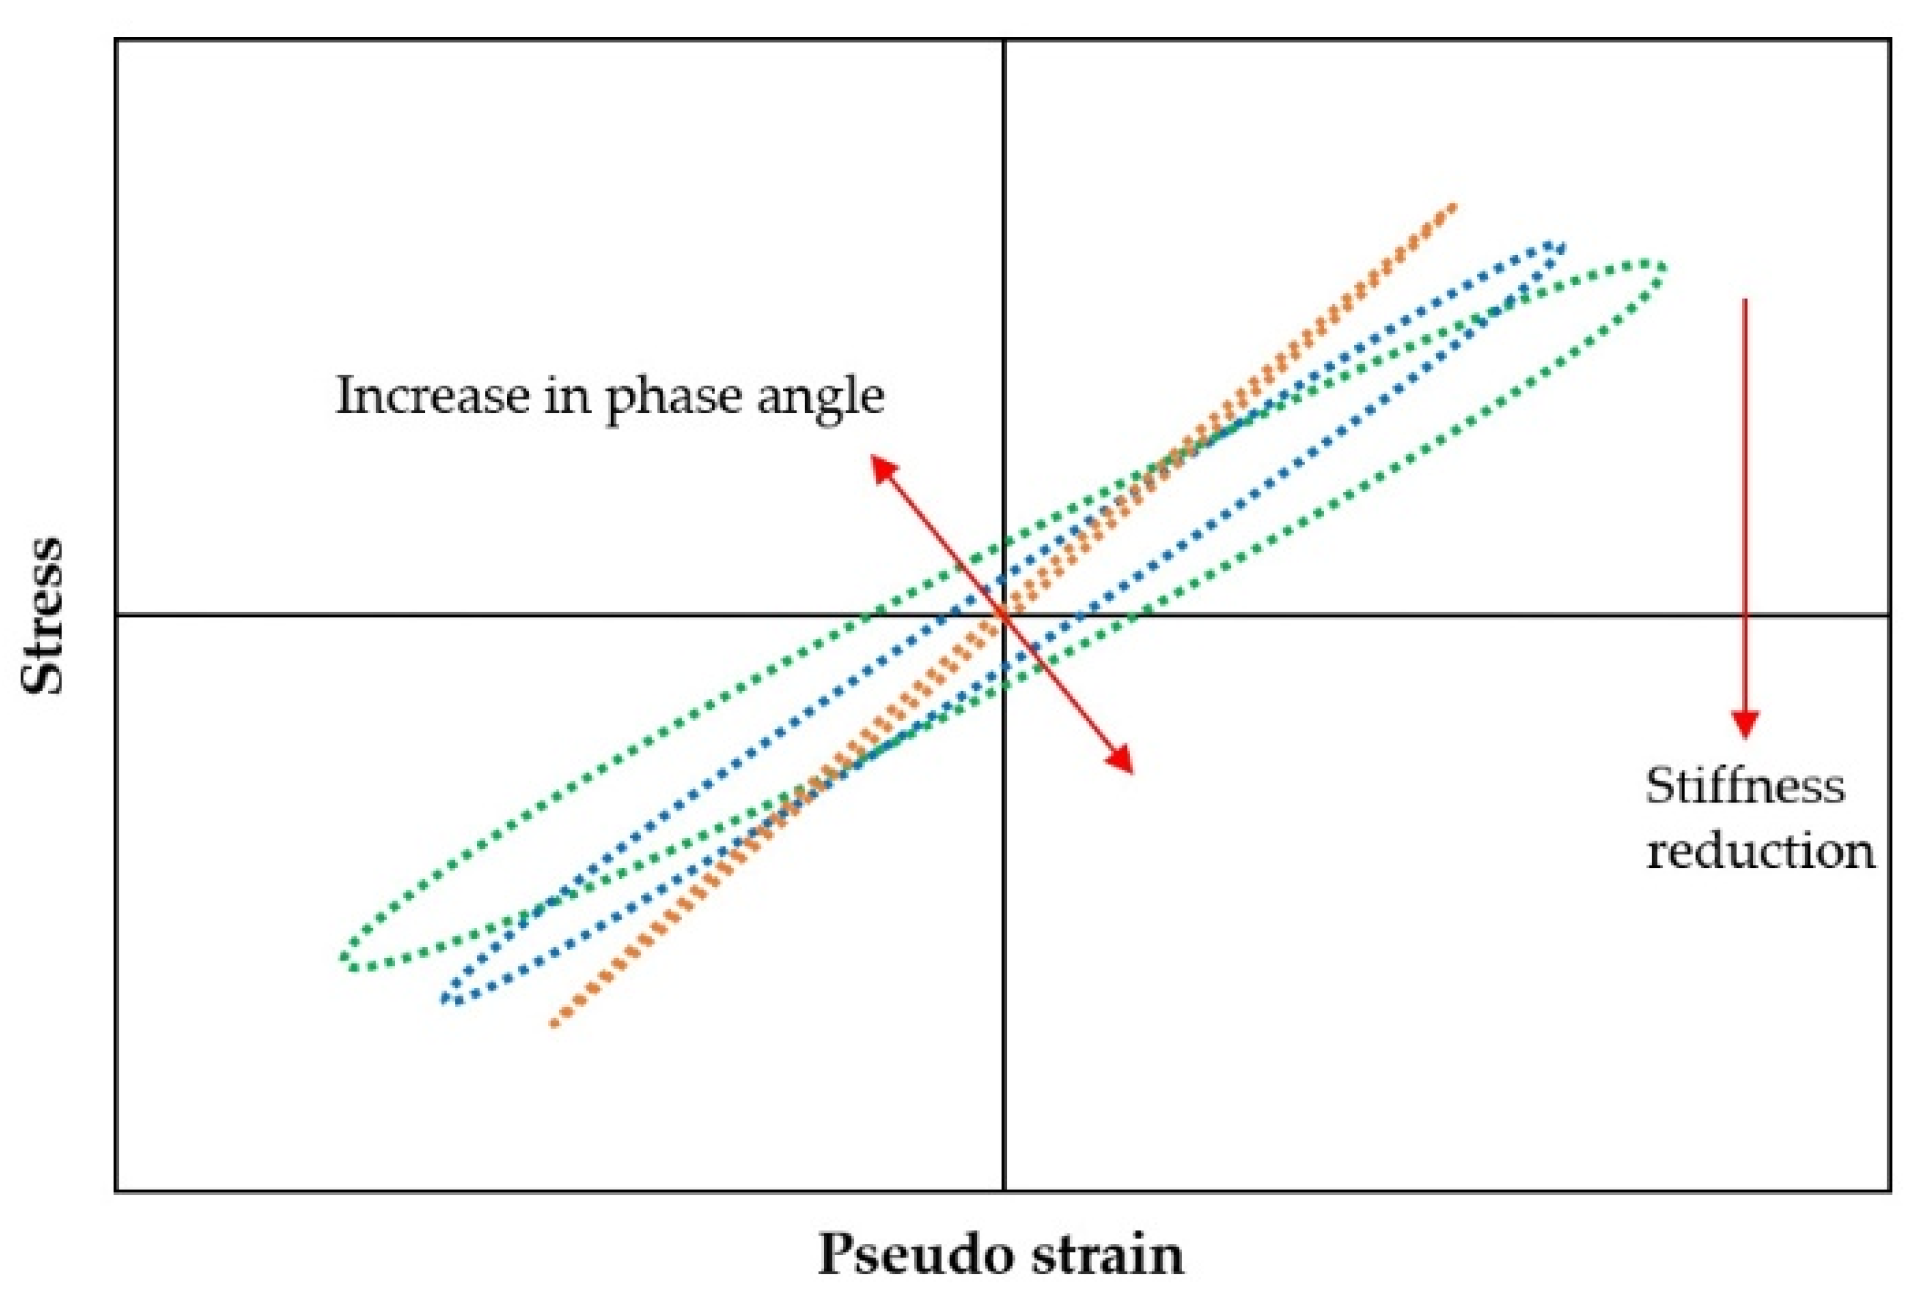
| Pseudo stiffness criterion | The pseudo stiffness value |  | [188] |
| -based criterion | is the total released pseudo strain energy | 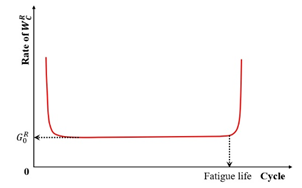 | [126] |
| -based criterion | ) | 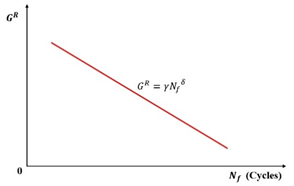 | [133] |
| -based criterion | ) | 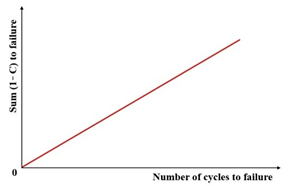 | [25] |
| Fatigue Approach | Material Type | Fatigue Test Method | Indicator of Failure Criterion | Schematic Diagram | References |
|---|---|---|---|---|---|
| Phenomenological approach | AC | Four-point bending (4PB) | The normalized modulus × cycles (NM) | 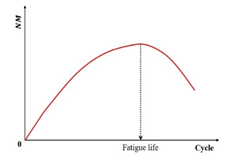 | [35,152] |
| AC | Uniaxial cyclic fatigue test | Stress × N |  | [194] | |
| AC | Three-point bending (3PB) or four-point bending (4PB) | The ratio of the cumulative dissipated energy change (RCDEC) | 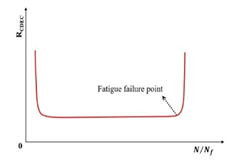 | [165] | |
| Mechanistic approach | AC | Fingerprint dynamic modulus test and cyclic fatigue test | The average reduction in the pseudo stiffness up to failure () |  | [25,195] |
| Asphalt | Frequency sweep test and LAS test (or TS test) | The average dissipated pseudo energy rate () | 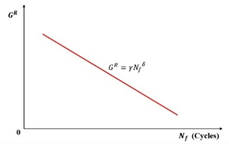 | [127] |
Disclaimer/Publisher’s Note: The statements, opinions and data contained in all publications are solely those of the individual author(s) and contributor(s) and not of MDPI and/or the editor(s). MDPI and/or the editor(s) disclaim responsibility for any injury to people or property resulting from any ideas, methods, instructions or products referred to in the content. |
© 2025 by the authors. Licensee MDPI, Basel, Switzerland. This article is an open access article distributed under the terms and conditions of the Creative Commons Attribution (CC BY) license (https://creativecommons.org/licenses/by/4.0/).
Share and Cite
Xu, S.; Zhao, Z.; Wang, H.; Wan, C.; Wang, X.; Wang, Z.; Zhang, X. Fatigue Failure Criteria of Asphalt Binders and Asphalt Mixtures: A Comprehensive Review. Materials 2025, 18, 3267. https://doi.org/10.3390/ma18143267
Xu S, Zhao Z, Wang H, Wan C, Wang X, Wang Z, Zhang X. Fatigue Failure Criteria of Asphalt Binders and Asphalt Mixtures: A Comprehensive Review. Materials. 2025; 18(14):3267. https://doi.org/10.3390/ma18143267
Chicago/Turabian StyleXu, Shizhan, Zhigang Zhao, Honglei Wang, Chenguang Wan, Xiaofeng Wang, Zhenjun Wang, and Xuanrui Zhang. 2025. "Fatigue Failure Criteria of Asphalt Binders and Asphalt Mixtures: A Comprehensive Review" Materials 18, no. 14: 3267. https://doi.org/10.3390/ma18143267
APA StyleXu, S., Zhao, Z., Wang, H., Wan, C., Wang, X., Wang, Z., & Zhang, X. (2025). Fatigue Failure Criteria of Asphalt Binders and Asphalt Mixtures: A Comprehensive Review. Materials, 18(14), 3267. https://doi.org/10.3390/ma18143267