Abstract
This paper estimates friction stir welded joints’ ultimate tensile strength (UTS) and hardness using six supervised machine learning models (viz., linear regression, support vector regression, decision tree regression, random forest regression, K-nearest neighbour, and artificial neural network). Tool traverse speed, tool rotational speed, pin diameter, shoulder diameter, tool offset, and tool tilt are the six input parameters in the 200 datasets for training and testing the models. Deep learning artificial neural networks (ANN) exhibited the highest accuracy. Therefore, the ANN approach was used successfully to estimate the UTS and the hardness of friction stir welded joints. Additionally, the relationship of pin diameter, tool offset, and tool rotation speed over UTS and hardness were extracted over the collected data points. Furthermore, experimental results, such as UTS and hardness of steel–magnesium-based welded joints and model estimated results, were compared to cross-check model generalization capability. It was noted that ANN estimates and experimental results at desired processing conditions are consistent with sufficiently high accuracy.
1. Introduction
Welding is an essential manufacturing process for achieving components with complex configurations. However, it is considered a secondary step in manufacturing a product, followed by basic techniques, i.e., casting, machining, and forming. In most situations, we cannot produce a product as a single part; therefore, to obtain multi-functional products, the need for welding and its development has changed exponentially in the last few decades [1]. The use of composite materials is widespread in the automotive and aerospace industries due to their advantageous properties, including high specific strength, low densities, and the ability to reduce weight [2]. However, traditional fusion welding processes used to join different metals and alloys can result in poor weld zone characteristics in terms of strength and reliability. These challenges stem from excessive heat, differences in crystal structure, and variations in the physiochemical properties of the parent metals and alloys. As a result, coarse grains form in the weld zone, and numerous brittle intermetallic compounds are created [3].
Friction stir welding (FSW), a solid-state welding technique developed by Wayne Thomas in 1991 at The Welding Institute (TWI) in the U.K., can be utilized for welding various metals and alloys [4,5]. During FSW, the parent material does not melt because its processing temperature is lower than the material’s melting point. Eventually, the weld bead becomes free from unwanted metallurgical reactions. It is regarded as an environment-friendly and energy-efficient process. Further, FSW also displays vital catching features such as low distortions, minimal residual stresses, and no fumes and spatters. Nowadays, FSW is widely used for welding many low- and high-melting-point materials, such as aluminium alloys, magnesium alloys, and titanium and nickel [6,7,8].
Forming high-strength joints through FSW is essential for both academic interests and industrial applications. Increasing porosity and brittle intermetallic compounds decrease their static and dynamic behaviour to many folds. However, these issues can be minimized by understanding the complex relationship between various process parameters such as rotational speed, transverse speed, shoulder diameter, pin diameter, offset, tilt angle, etc. Many attempts have been made in both experimental and analytical directions for process optimization and confirming defect-free welds with improved metallurgical properties and mechanical behaviour.
1.1. Experimental Investigations
Zhao et al. [9] examined the impact of the pin profile (viz., column pin, taper pin, column screw thread pin, and taper screw thread pin) on the welded joint of Al2014 alloys. He found that the taper screw thread pin performed better in creating a strong bond. Bisadi et al. [10] studied the impact of different tool pin shapes (square, triangular and cylindrical) on the friction stir welding (FSW) of Al 7075 alloys. He inferred that workpiece temperature is more influenced by pin shoulder than pin diameter. The tool linear and rotation speeds are the most influential parameters in FSW, as they govern heat input and material flow. Kanemaru et al. [11] and Liu et al. [12] studied the influence of these parameters. They concluded that the strain region moves from the retreating side to the advancing side and widens the strained area. Fu et al. [13] studied the influence of rotation speed and welding speed on the FSW joints of dissimilar metals of 6061-T6 aluminium alloy to AZ31B magnesium alloy. The optimum set of welding and rotational speeds for higher strength were 30 and 60 mm/min and 600–800 rpm. Any departure with the welding and rotation speed leads to poor weld quality. Sahu et al. [14] studied the influence of tool offset on the morphology and structure of FSW joints of dissimilar materials. The authors concluded that a slight tool offset greatly influences intermetallic compounds’ material flow behaviour and volume. Watanabe et al. [15] concluded that maximum ultimate tensile strength could be achieved by providing a 0.2 mm offset. A higher offset reduces tensile strength by mixing large fragmented steel particles in the aluminium matrix.
1.2. Analytical and Statistical Investigations
Analytical and mathematical simulation is often used to model friction stir welding (FSW) due to its ability to accurately simulate heat generation, temperature distribution, material flow, and defect prediction. However, experimental investigation is costly, time-consuming, and limited in scope and cannot explain the complex interaction between process parameters and output results. Suresha et al. [16] conducted experiments with the L9 Taguchi orthogonal array to analyze the influence of tool pin profiles on the tensile strength of AA7075-T6 FSW joints. The percentage contributions of welding parameters, including tool rotational speed, traverse speed, and plunge depth, to tensile strength were analyzed using the signal-to-noise (S/N) ratio and analysis of variance (ANOVA). Javadi et al. [17] optimized the residual stresses of friction welded joints of 5086 aluminium plates through the statistical design of the experiment (DOE). ANOVA analysis concluded that feed rate is the most significant parameter for longitudinal residual stress. However, the shoulder and pin diameter effects were insignificant. Sarsilmaz et al. [18] conducted experiments according to a full factorial design to determine the influence of stirrer speed, traverse speed, and spindle rotational speed on UTS and the hardness of FSW joints of aluminium.
In recent years, the application of machine learning has increased tremendously in solving the complex behaviour of manufacturing processes. These trained algorithms can quickly learn previous data and provide information regarding the complex interrelationship between various processing parameters [19]. In the field of materials and manufacturing research, researchers have explored the use of artificial neural networks (ANNs) [20,21], the adaptive neuro-fuzzy inference system (ANFIS) [22,23], and regression analysis [24] to prioritize, plan, optimize, and forecast experimental results. This study introduces a novel application of machine learning models to predict the ultimate tensile strength (UTS) and hardness of friction stir welded joints by considering a comprehensive set of process parameters. While previous studies have focused on individual parameters or simple regression models, our work expands the scope by evaluating six different machine learning algorithms, with a particular focus on the artificial neural network (ANN) for accurate prediction. Additionally, this research incorporates a diverse dataset, including both similar and dissimilar material joints, which enhances the generalizability and practical applicability of the model across various welding scenarios.
After an extensive review of the literature, the following process parameters were identified as critical for friction stir welding (FSW) and were therefore selected for this study:
- Tool traverse speed and rotational speed: These are key determinants of heat generation and material flow, directly influencing weld quality, ultimate tensile strength (UTS), and hardness.
- Pin diameter and shoulder diameter: These geometrical features play a significant role in material stirring and mixing, impacting grain refinement, defect formation, and mechanical properties.
- Tool offset: Particularly important for dissimilar material welding, tool offset helps balance heat distribution, ensuring defect-free joints with improved strength.
- Tool tilt angle: This parameter aids in optimizing the plunge force and enhances material flow around the tool, reducing defects such as tunnelling.
These parameters were chosen based on their frequent citation and critical role in determining the mechanical and metallurgical properties of FSW joints, as highlighted in the reviewed studies.
This deficiency in the literature motivated the authors to design, develop, and test a machine learning model for the following reasons: (a) to establish the relationship between key process parameters of friction stir welding and (b) the developed model will be used to estimate the hardness and ultimate tensile strength of friction stir welded joints.
2. Modelling Procedure
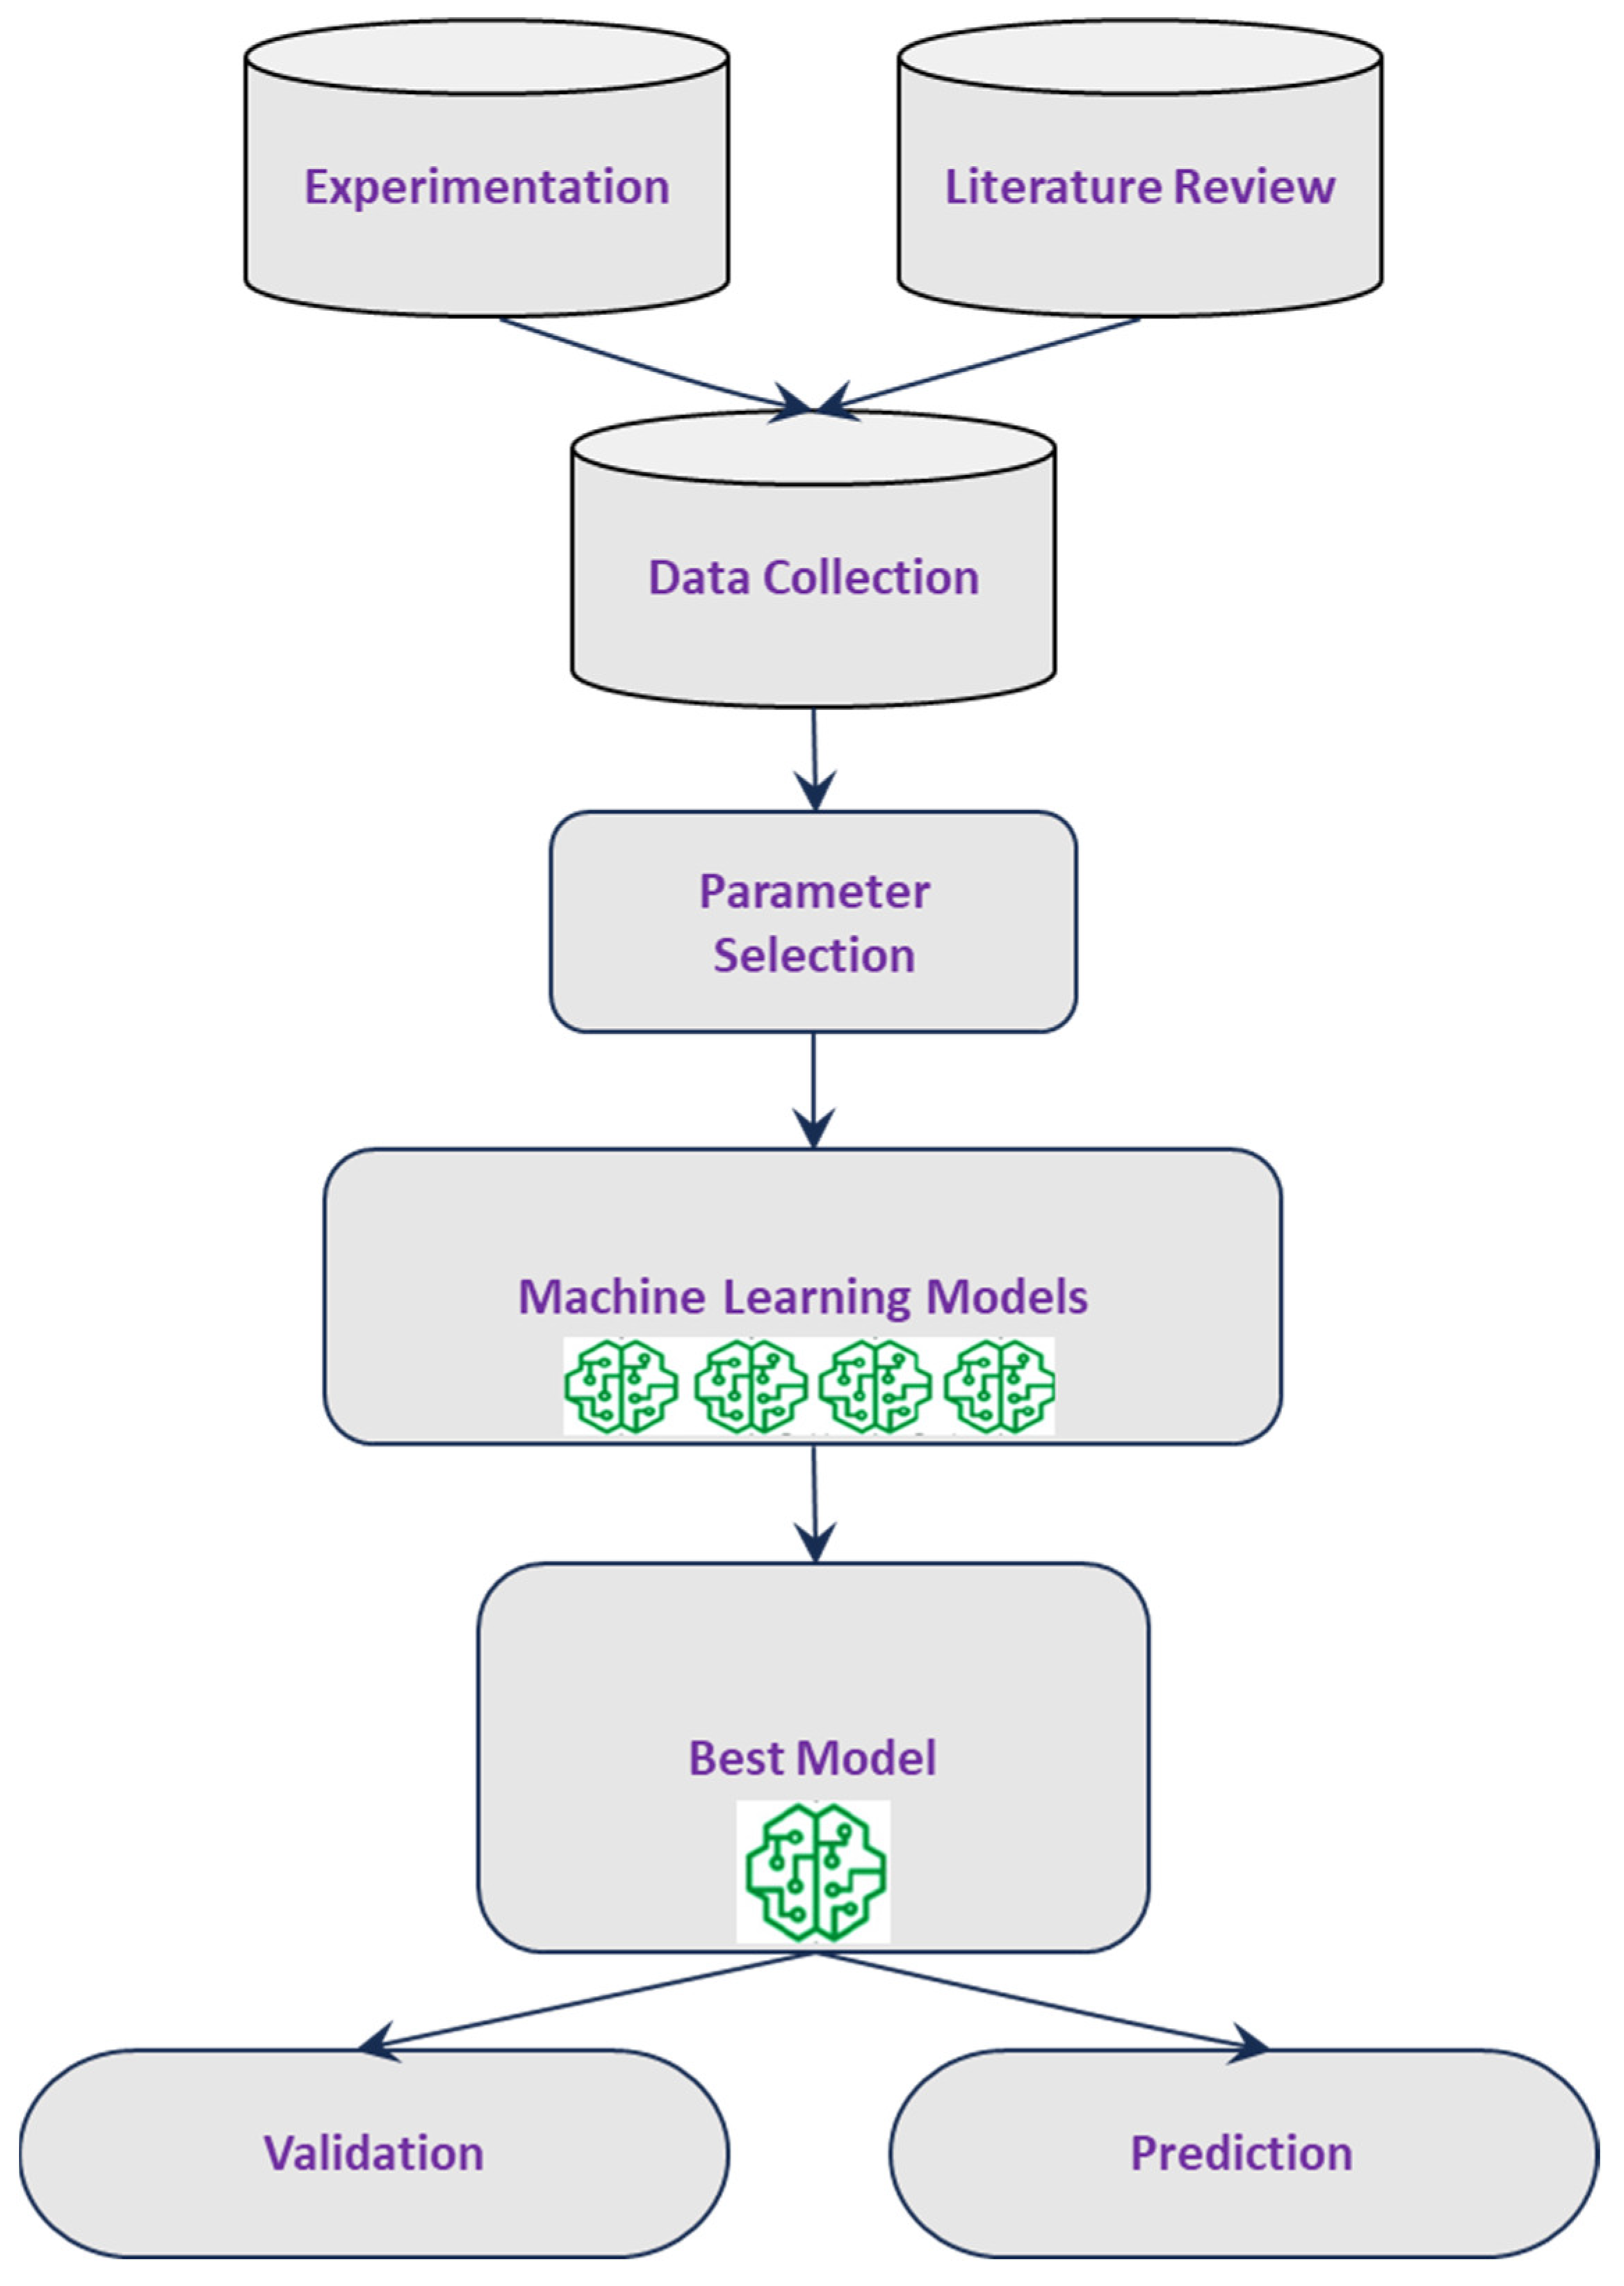
Creating machine learning models involves three main steps: data collection, model generation, and model validation. This process, illustrated in Figure 1, begins with data collection and concludes with model validation and output prediction. In this work, 200 data groups were collected and screened for machine learning models’ design, development, and testing, as depicted in Table 1.
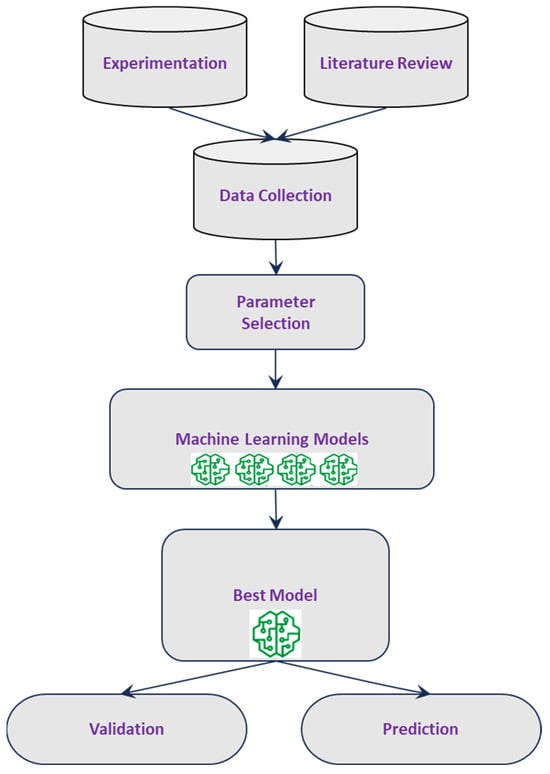
Figure 1.
Procedure of machine learning modelling.

Table 1.
Collected and screened data of friction stir welded joints for machine learning.
2.1. Collection of Data
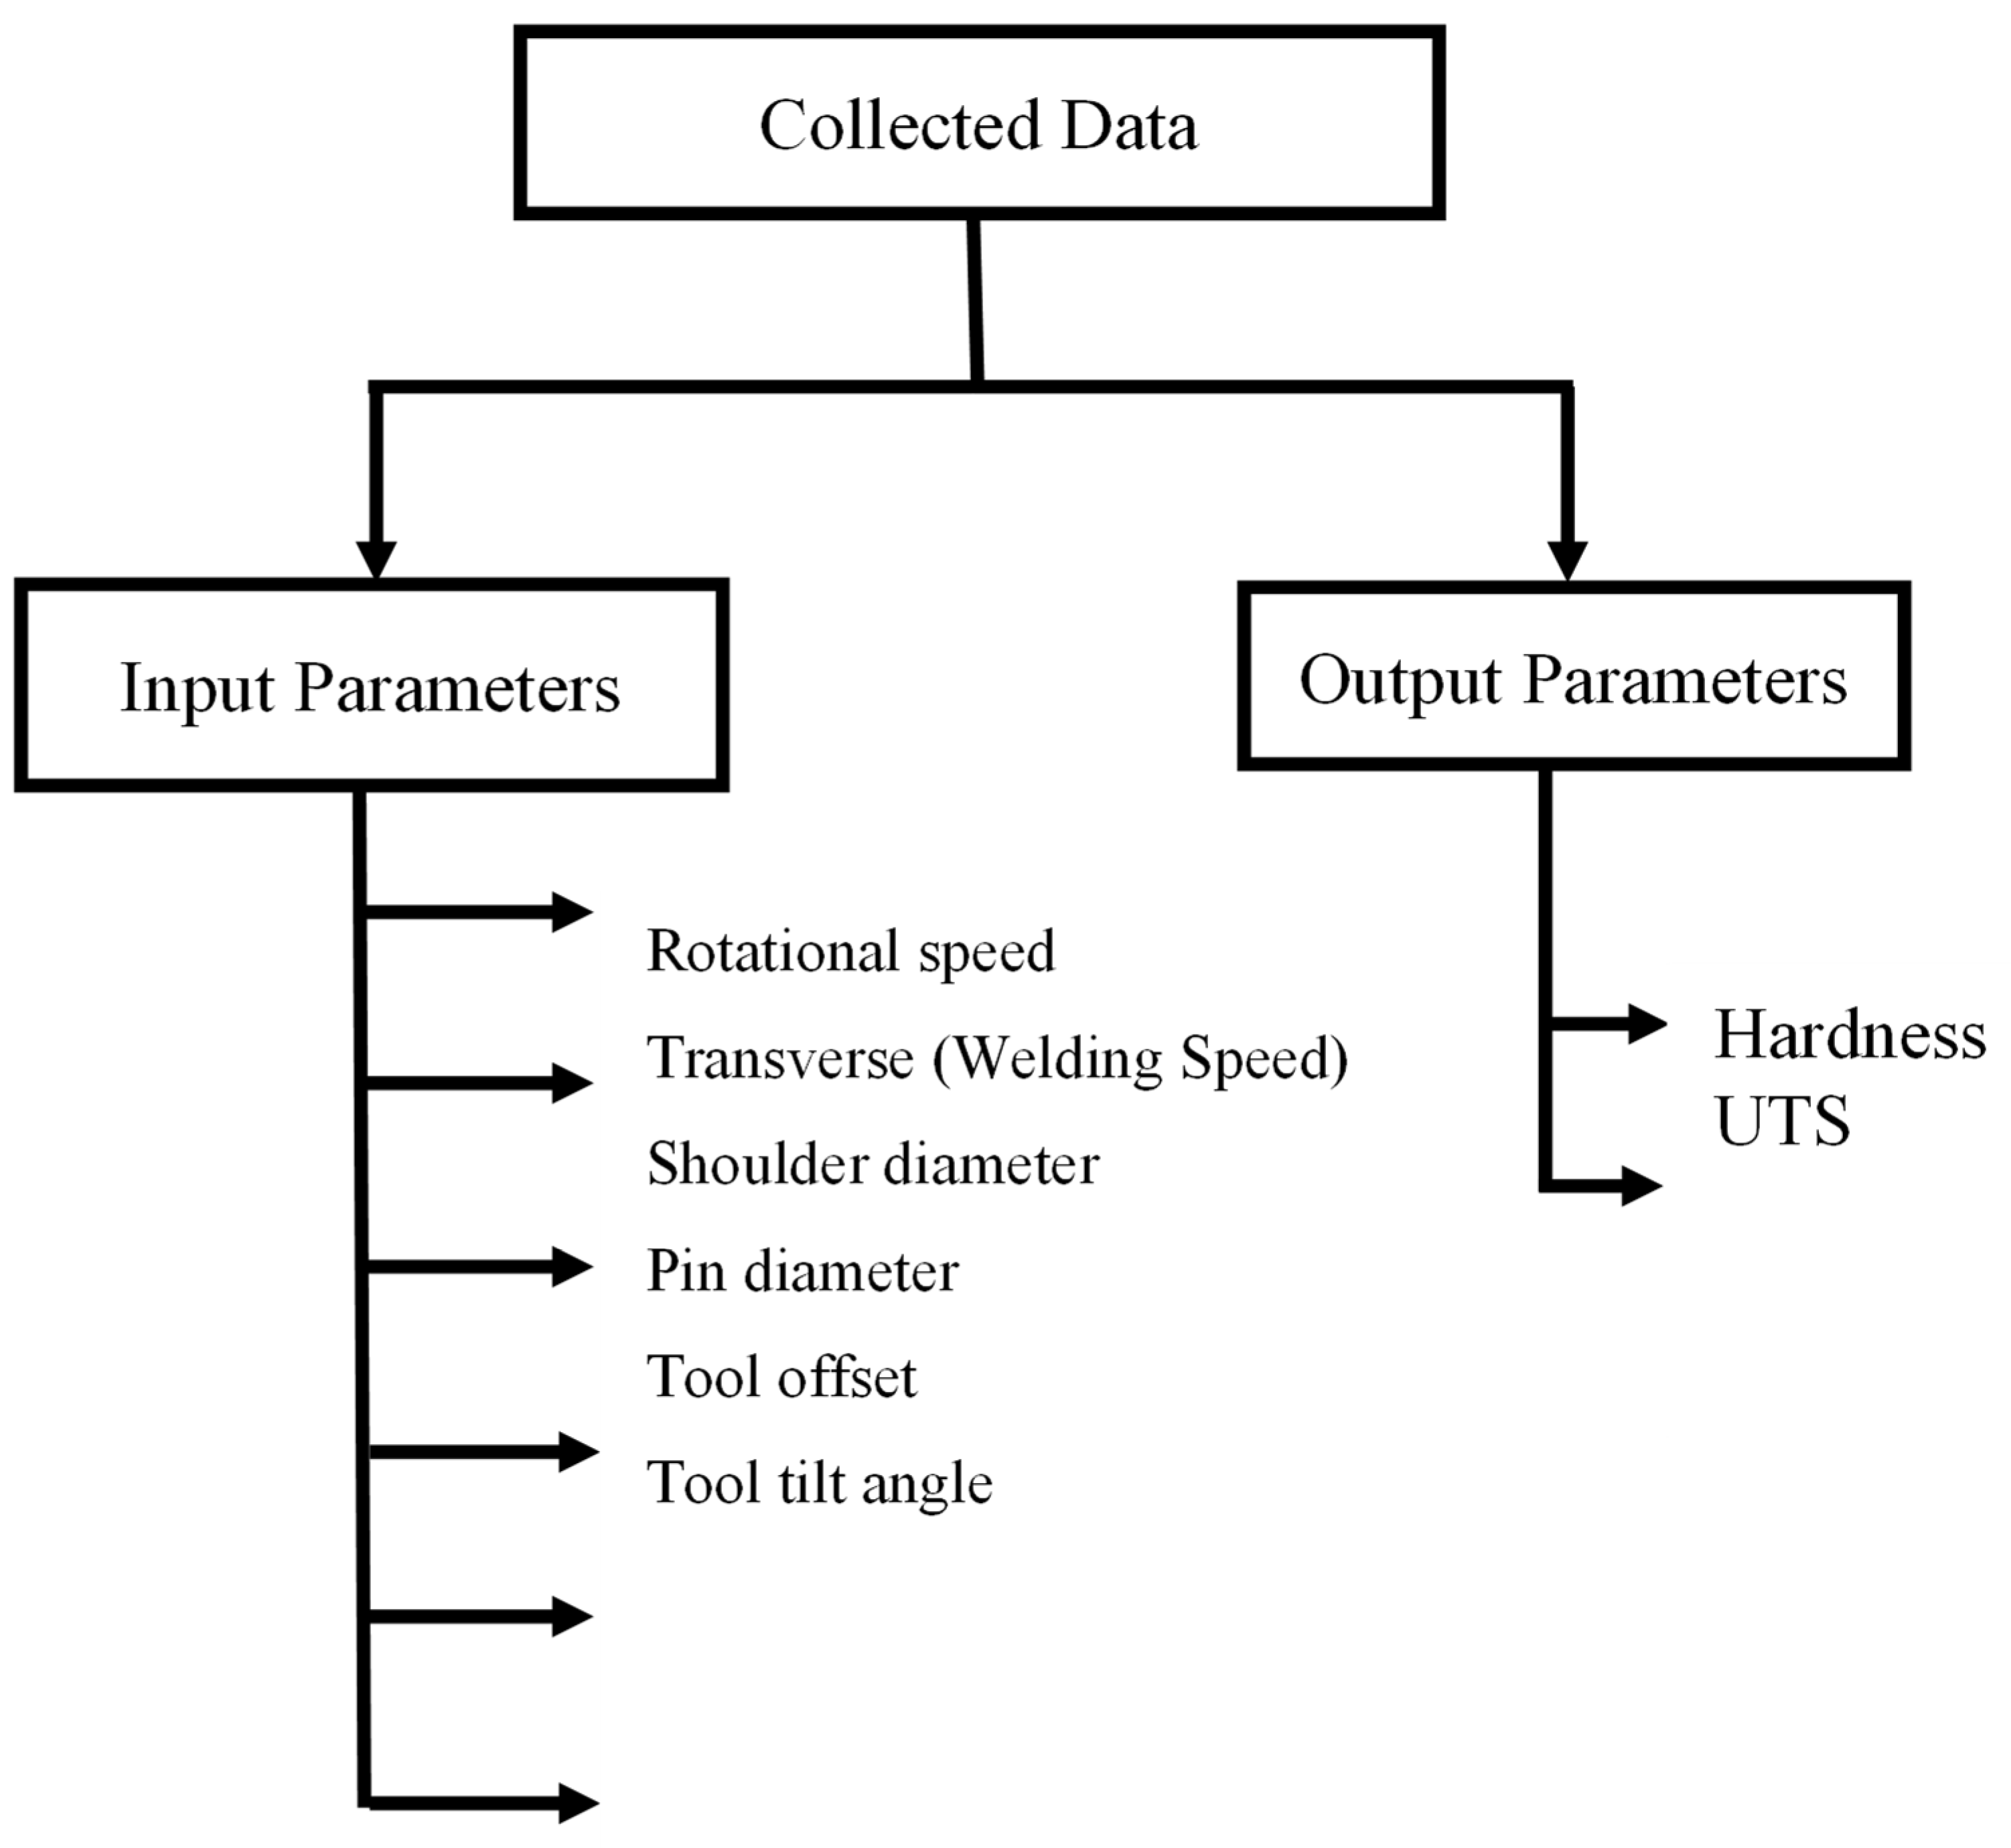
Data collection is one of the most fundamental steps before generating a machine learning model. The two main data sources are the author’s laboratory experiments and literature review [25,26,27,28,29,30,31,32,33,34,35,36,37,38,39,40]. The dataset, given in Table 1, used in this study consists of 200 data points collected from both similar and dissimilar material joints. Among these, approximately 50% represent similar material joints, such as aluminium–aluminium and steel–steel combinations, while the remaining 50% correspond to dissimilar material joints, including combinations such as aluminium–magnesium and steel–magnesium. This distribution ensures that the dataset encompasses a wide range of material combinations, allowing the models to generalize well across different welding scenarios. Figure 2 and Table 2 shows the various input and output parameters used in the present study.
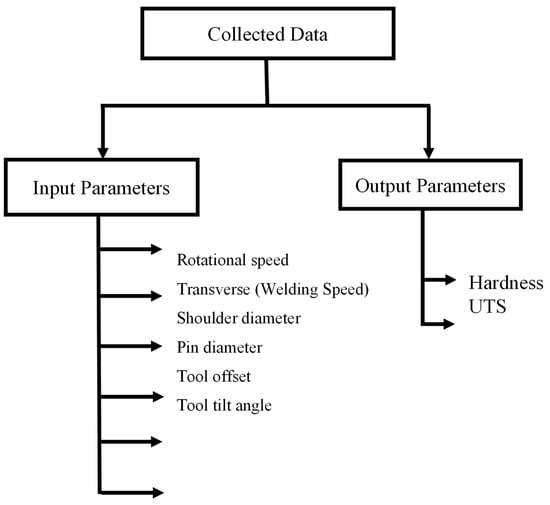
Figure 2.
Various input and output parameters.
Table 2.
Various groups along with parameters.
2.2. Modelling
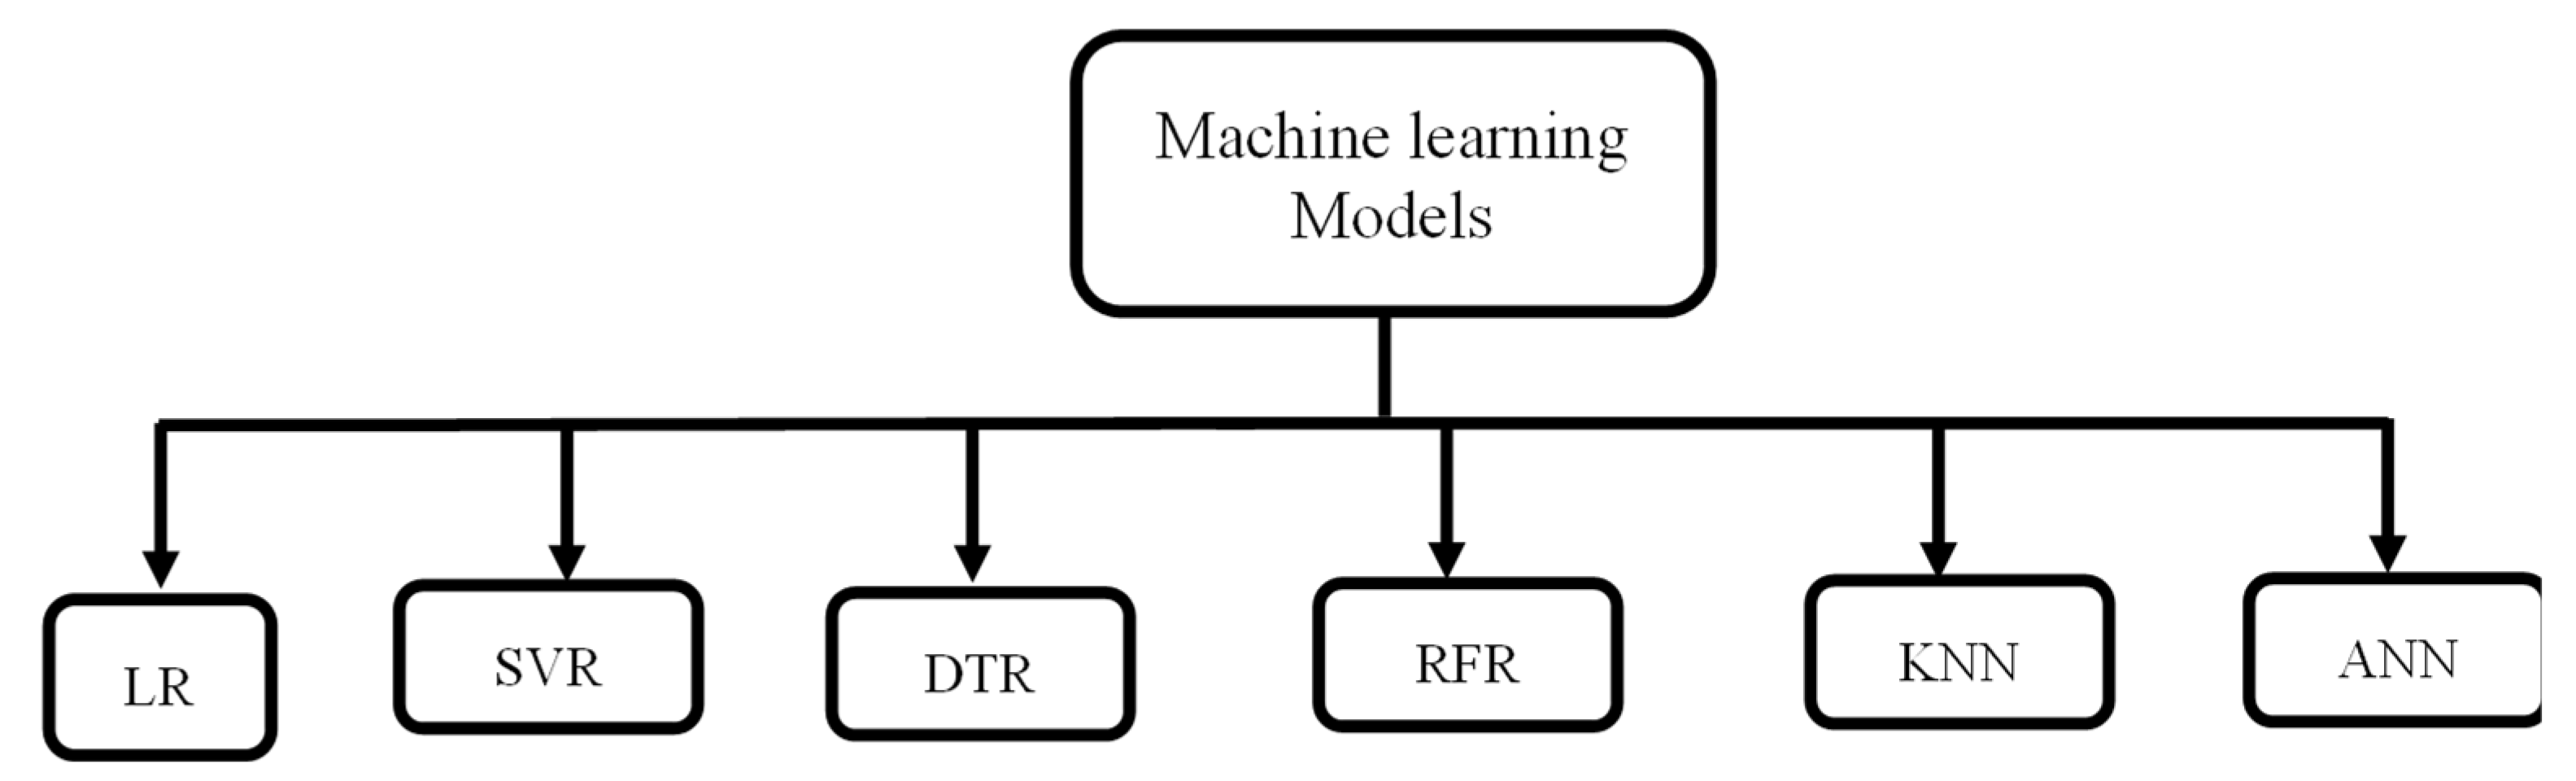
The present study primarily focused on six different and well-known machine learning algorithms to discover the best model. Figure 3 depicts the various machine learning models that were used in the present study.
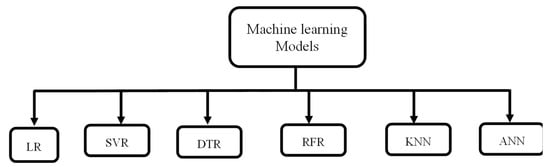
Figure 3.
Different machine learning models used.
We selected six machine learning models to thoroughly assess their predictive performance: LR, KNN, DT, SVR, ANN, and RF regression. LR predicts outputs based on a linear relationship between input and output variables, while KNN regression calculates the target variable by identifying a sample’s nearest neighbours using the Euclidean distance function (d), as shown in Equation (1):
Here, xi is the new value of the sample, yi represents the value of the training sample, and i is a sequential number of features. The decision tree (DT) is a supervised machine learning model that represents decision points as nodes, with each node branching out based on the results of sequential tests until a final decision is made. Random forest (RF) regression, illustrated in Figure 4, is an ensemble of decision trees built using a bagging algorithm. The trees in a random forest operate independently, and the individual predictions of each tree determine the final output of the RF model. One key advantage of the RF model is its ability to manage a diverse range of categorical and continuous variables. The predicted value is given by averaging the sum of individual trees, as per Equation (2) [39]:
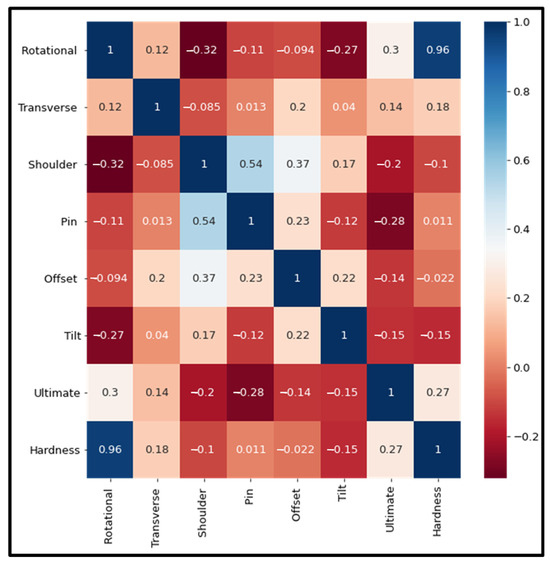
Figure 4.
Correlation between the features of a dataset through a heat map.
Ntree is the total number of trees used in the random forest (RF). The RF model minimizes prediction error by aggregating the predictions of all decision trees within the random forest.
| Model | Training Parameters |
| LR | Random state = 42 |
| SVR | Kernel = ‘linear’, Random state = 40 |
| KNN | N Neighbours = 2, Random state = 35 |
| DT | Criterion = Mse, Random State = 10 |
| RF | N estimators = 250, Random state = 0 |
| ANN | No. of hidden layer = 1, Neurons = 2–16 |
SVR is a regression algorithm derived from Support Vector Machines (SVM) principles. To enhance the generalization ability of learning machines by minimizing both structured risk and empirical risk, along with the confidence interval. Critical parameters in the SVR model include the kernel function type t, the penalty factor c, and the kernel function factor g. The radial basis function (RBF) is typically selected as the kernel function, which effectively addresses linearly non-separable problems through data transformation, as detailed in Equation (3). Additionally, t and c represent the tolerance for fitting errors in the model; a higher c increases the risk of overfitting. Meanwhile, g indicates the distribution of support vectors in the transformed feature space.
In order to effectively test and select a model, it is crucial to establish clear evaluation criteria. This will help in making informed decisions and choosing the best model for the task at hand. Here, we have used parameters such as coefficient of determination (COD, R2), mean square error (MSE), and mean absolute error (MAE), for selecting the most effective ML model for hardness and ultimate tensile strength estimation. Equations (4), (5), and (6) provide these parameters, respectively:
where
MSE = mean squared error
n = number of data points
Yi = actual value
Y′ = predicted value
Ynorm = normalized value
x = value to be normalized
The model, which has a least mean squared error, mean average error and maximum coefficient of determination, was selected as the best model for further study, but before that, all the given data were normalized using Equation (7). All collected data (input and output data) were normalized between 0.1 and 0.9 [41]. To judge the accuracy of the model, the whole data set was split into two parts: one part for the training of the model (70% of the total data) and the other part for testing (30% of the entire data) using the train-test split function of Scikit learn library. Feature selection is a critical aspect of model generation in machine learning, as including irrelevant features can reduce the model’s accuracy [42]. Thus, it is essential to distinguish between significant and insignificant features (i.e., process parameters). To establish correlations among different features, the collected data were statistically analyzed using the Pearson correlation coefficient, calculated using the Python Pandas library [43]. The formula used to compute the correlation coefficient (Equation (8)) is provided below:
Figure 4 shows a positive correlation between tool rotational speed, welding speed, tool tilt angle, and tool offset on UTS and hardness. Shoulder diameter and pin diameter have a negative correlation. However, the tool shoulder diameter positively correlates with the tool pin diameter. Therefore, all the features shown in the heat map were selected for the study.
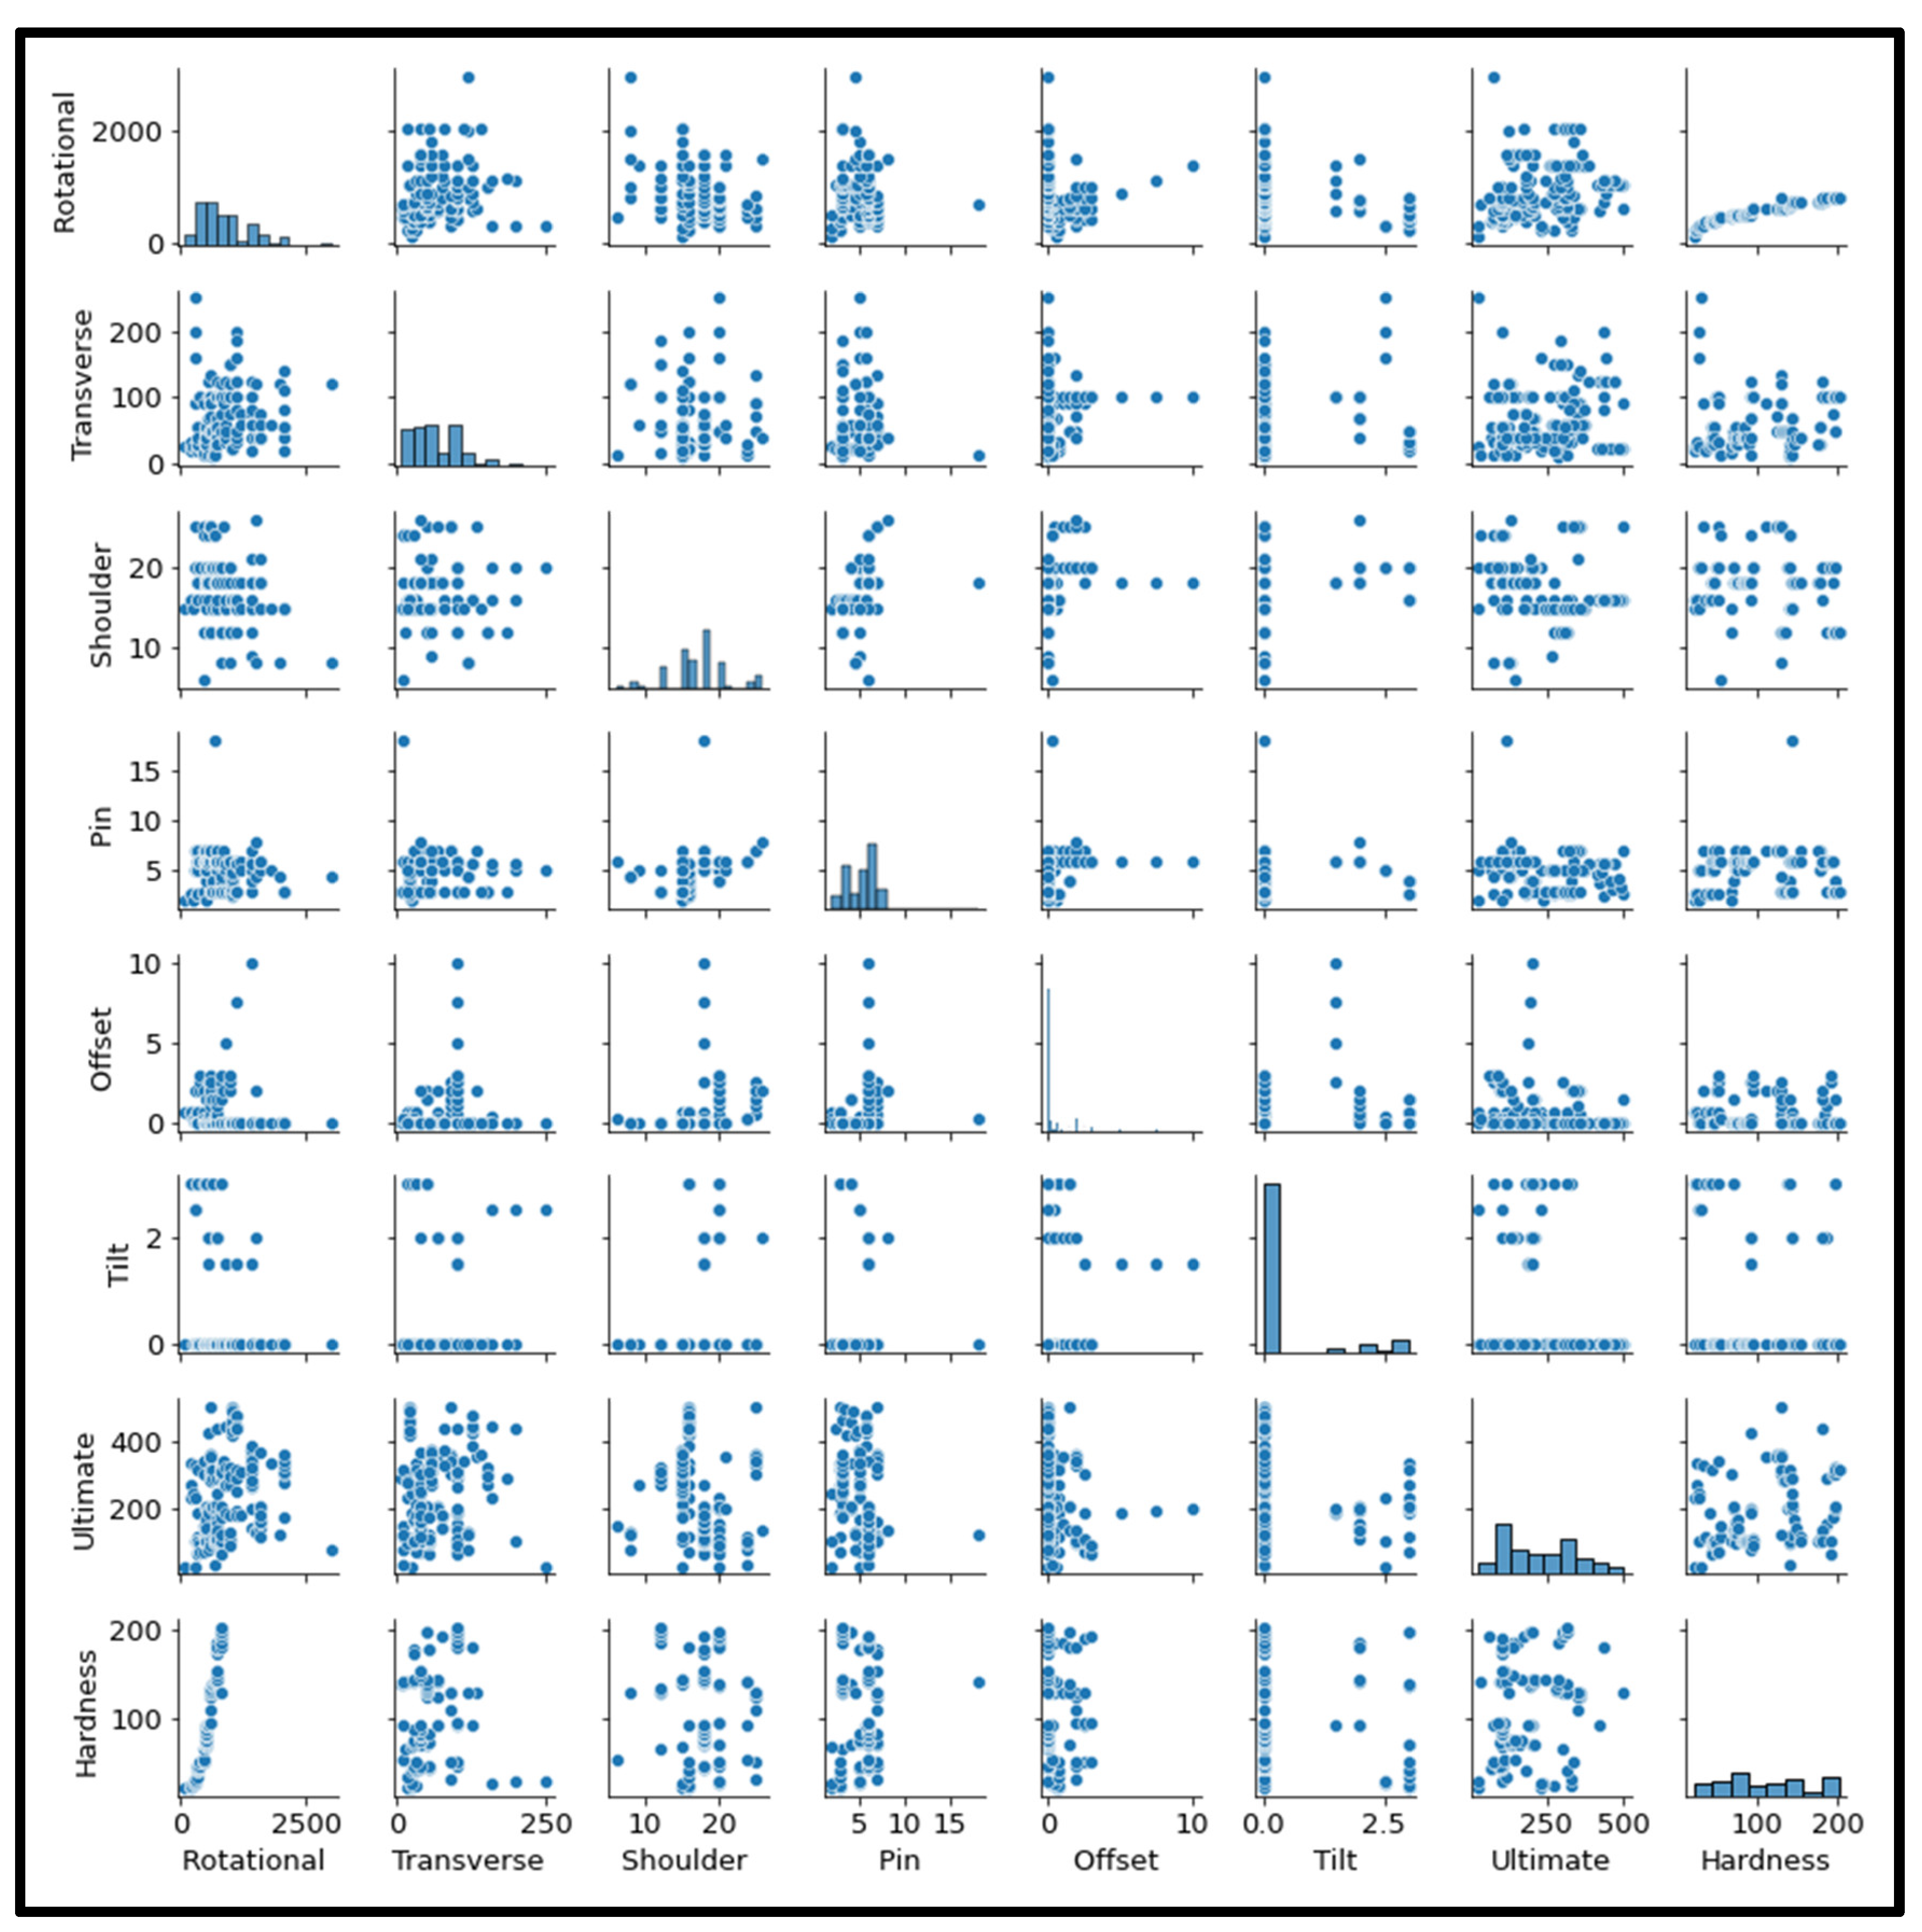
Furthermore, to recognize the association between input and output features, scatter plots were plotted, as shown in Figure 5. The histogram shows the prediction of ultimate tensile strength and hardness for various friction stir welded plates based on multiple process parameters. It is also evident from Figure 5 that tool rotational speed, welding speed, shoulder diameter, tool pin diameter, tool offset, and tool tilt are very closely related, as their corresponding pair plots are very similar.

Figure 5.
Correlation between the features of the dataset through scatterplot matrices.
3. Experimental
For dissimilar material joining, the workpiece specimens were AZ61 magnesium alloys (Mg–5.8 wt. % percent Al–0.85 wt. % Zn) and low carbon steel plates with 200 mm × 50 mm × 1.5 mm dimensions were procured for experimentation and validation. The FSW was performed with a welding tool made of tungsten carbide (WC), with a 12 mm shoulder diameter, 4 mm probe diameter, and 1.3 mm probe length. The welding tool was set at a 3° tilt angle to the vertical axis. FSW was conducted in a butt configuration with a constant tool rotational speed of 1500 rpm. The tool traverse rates varied between 15, 30, and 50 mm/min. Figure 6 depicts the schematic arrangement of the friction stir welding (FSW) process for creating dissimilar joints.
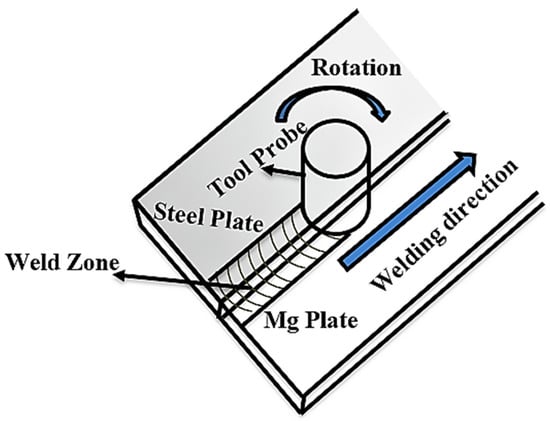
Figure 6.
Schematic illustrations of the friction stir welding process.
An optical microscope was used for the metallographic studies. The OM specimens were manually polished using sand sheets of up to 4000 grits, followed by a final polish with 0.05 µm Al2O3 suspensions. To examine the microstructure and identify the elemental composition of the specimens, an SEM equipped with EDS was used.
4. Results and Discussion
4.1. Morphology of the Welded Joint
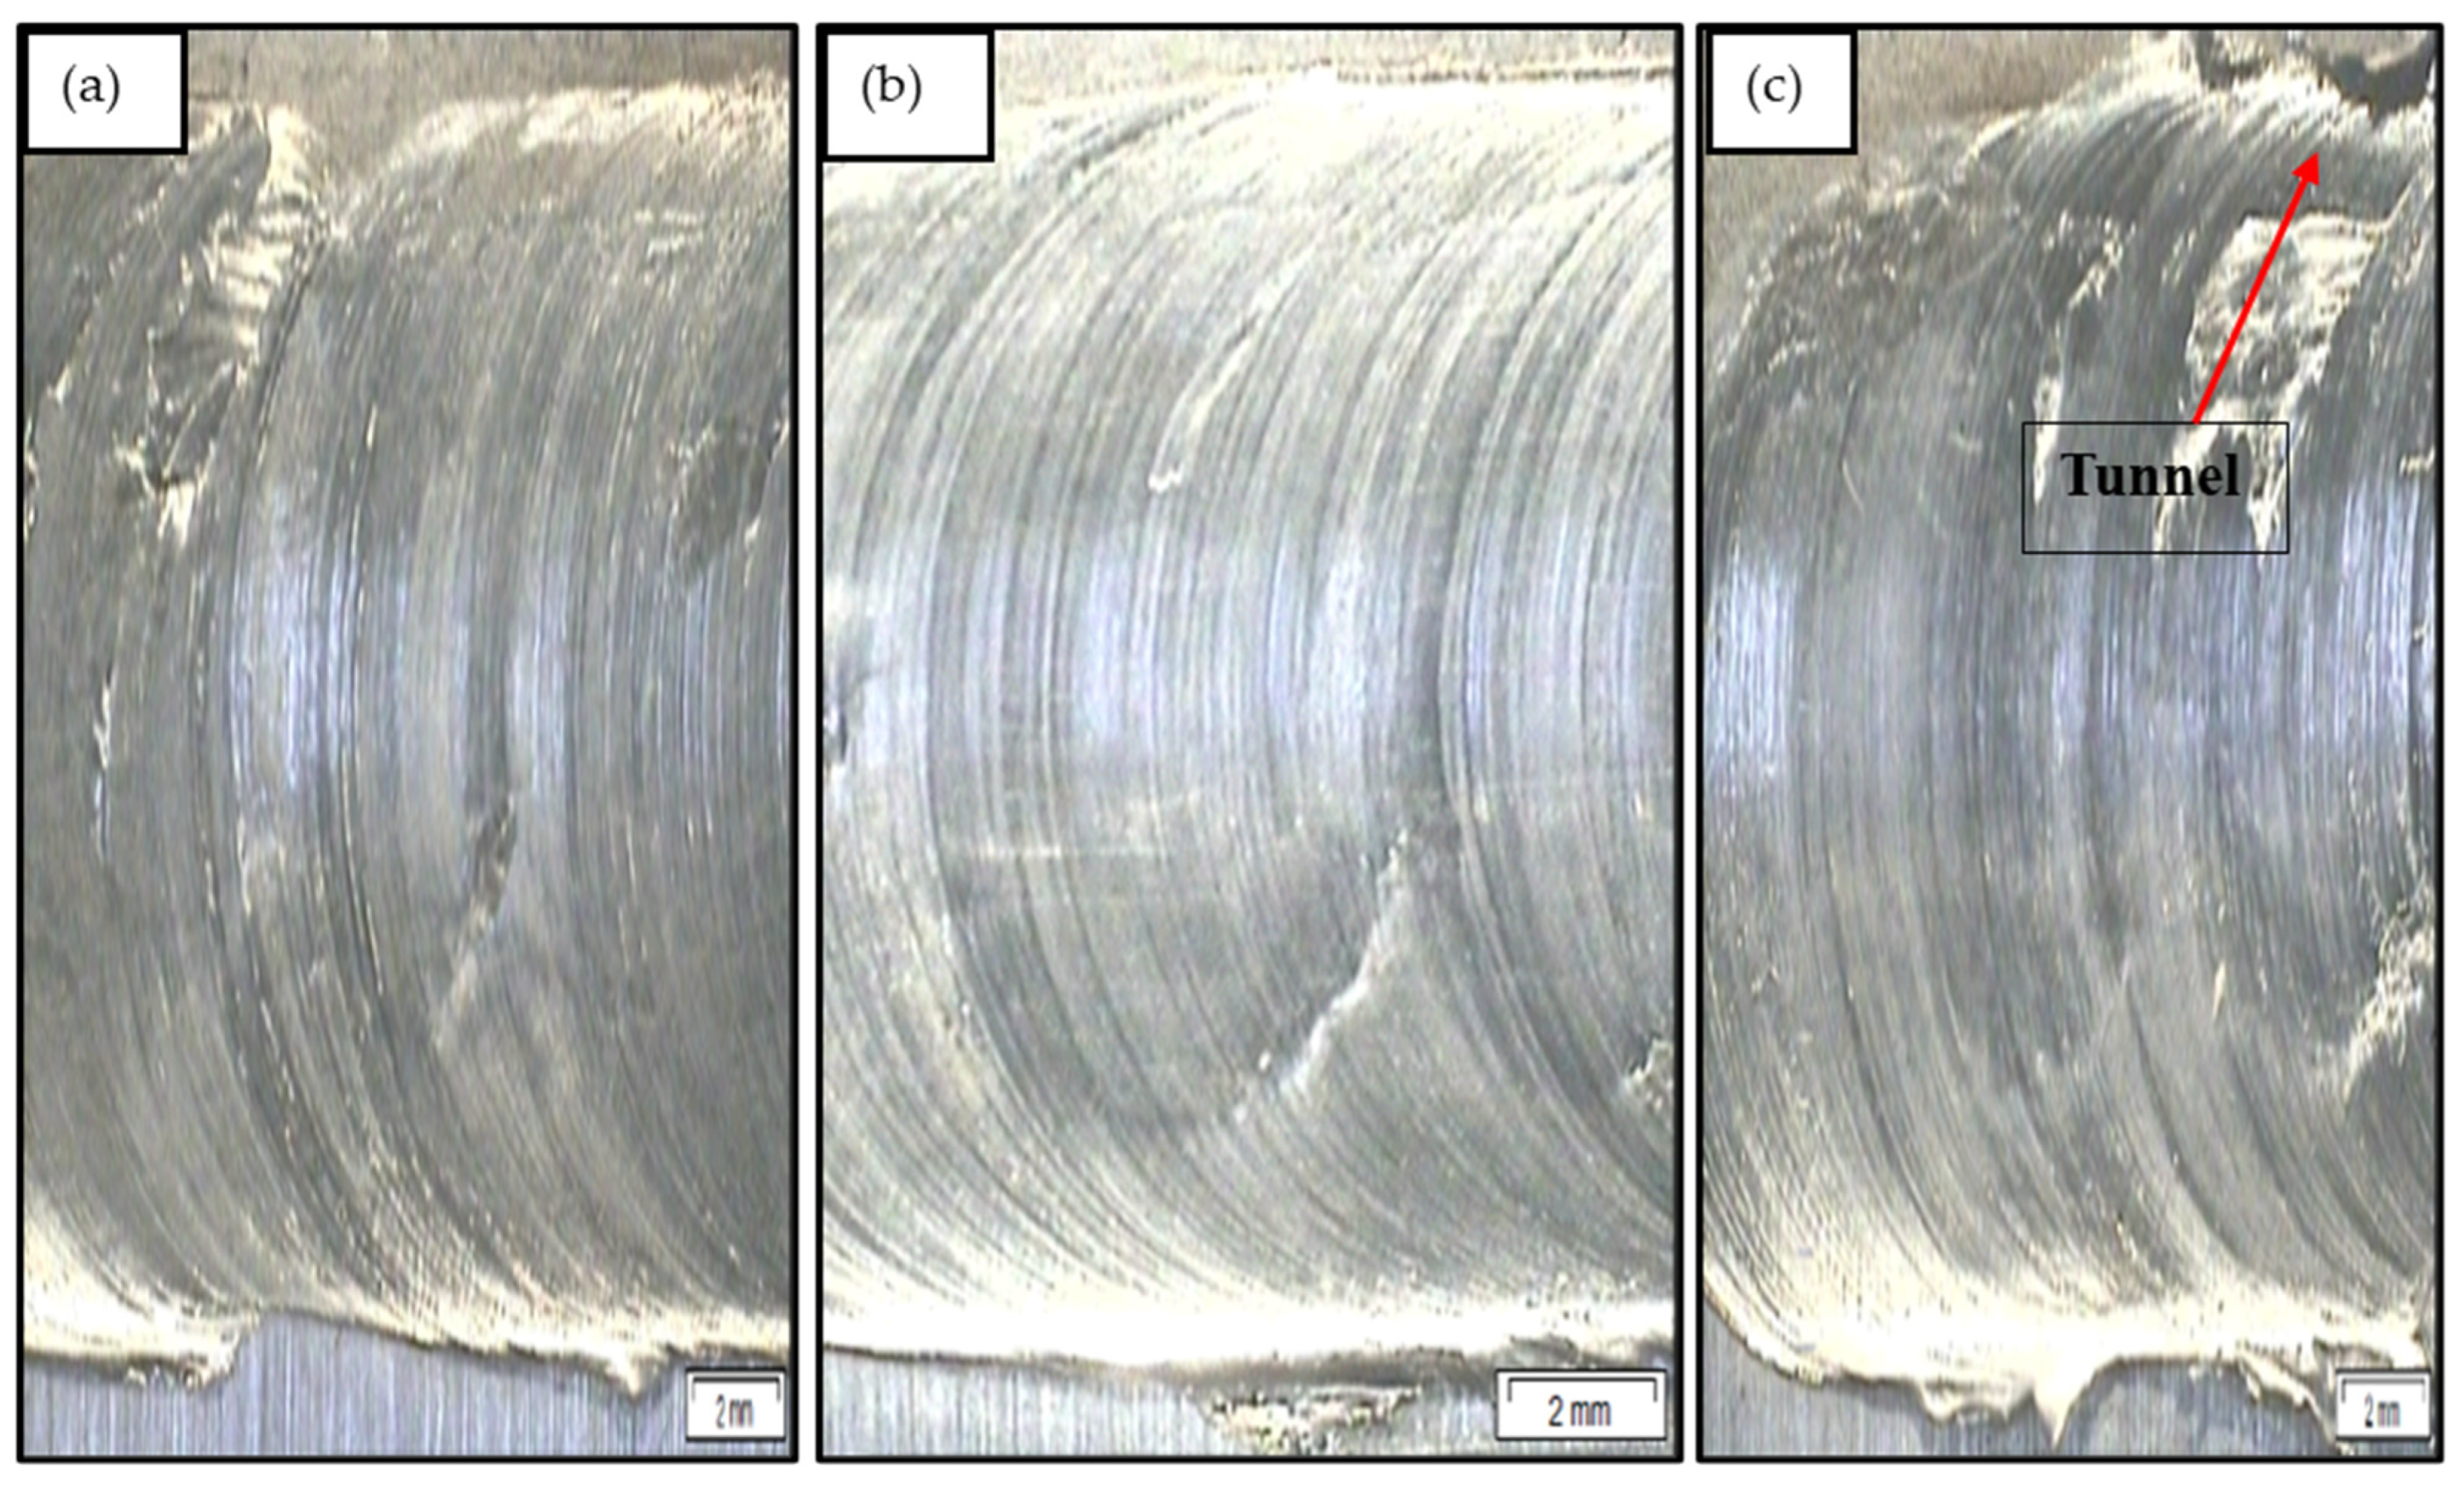
The surface appearance of all the welded specimens was good. Figure 7 depicts the changes in surface appearance with an increasing welding speed from 15 mm/min to 50 mm/min. The joint’s surface became smoother as the welding speed increased from 15 mm/min to 30 mm/min, as demonstrated in Figure 7a,b. Further increments in welding speed from 30 mm/min to 50 mm/min caused improper stirring of materials, which led to the slight appearance of tunnel defects. Proper mixing of materials was achieved at a welding speed of 30 mm/min, possibly due to the favourable working conditions. The proper mixing of materials promoted better mechanical interlocking with bending structures. Such interlocking results in a stronger joint and increased tensile strength. Finally, no flaws, such as pores, cavities, or tunnels, were observed at a greater scale in any of the joints.

Figure 7.
Surface appearance of dissimilar FSW joints between the AZ61 magnesium alloy and mild steel at a welding speed of (a) 15 mm/min, (b) 30 mm/min, and (c) 50 mm/min.
4.2. Microstructure at the Interface
Figure 8 shows optical microscopic pictures of the cross-section interfaces at a tool rotation speed of 1500 rpm, traverse speed of 30 mm/min and 50 mm/min, and a tool offset location of 0.5 mm. The joint interface was uniform, with a 30 mm/min welding speed, as depicted in Figure 8a. However, with an increased welding speed, defects are observed at the joint interface, as shown in Figure 8b.
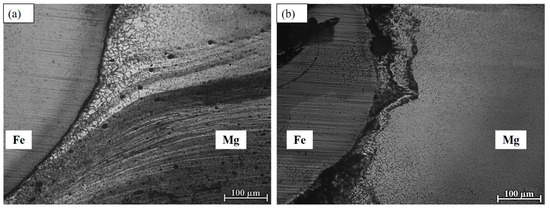
Figure 8.
OM images of the interfaces of welded joints at a welding speed of (a) 30 mm/min and (b) 50 mm/min.
Figure 9 displays the SEM imaging and EDS mappings of the interfaces on the cross-section at a tool rotation speed of 1500 rpm, a welding speed of 30 mm/min, and a tool offset position of 0.5 mm. The EDS mapping indicates a region of aluminium depletion near the interface on the magnesium side compared to the aluminium content of the base AZ61 magnesium alloy, as shown in Figure 9a and 9b, respectively. Microstructural observations revealed the formation of an intermetallic compound of iron and aluminium at the joint interface due to the presence of aluminium in the magnesium alloy. Consequently, the Fe–Al intermetallic compound layer may form as the tool probe makes contact with the steel butt face, creating a new surface on the steel plate.
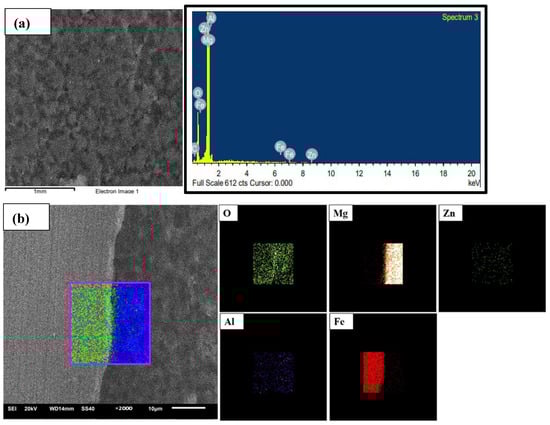
Figure 9.
SEM image and EDS mappings of the interfaces on the cross-section of the specimen at 1500 rpm, 30 mm/min, offset 0.5 mm. (a) Point EDS at Mg side near-adjacent to interface. (b) EDS mapping of interface.
The aluminium in magnesium is thought to have been consumed during the production of the Fe–Al intermetallic compound.
5. Machine Learning Results
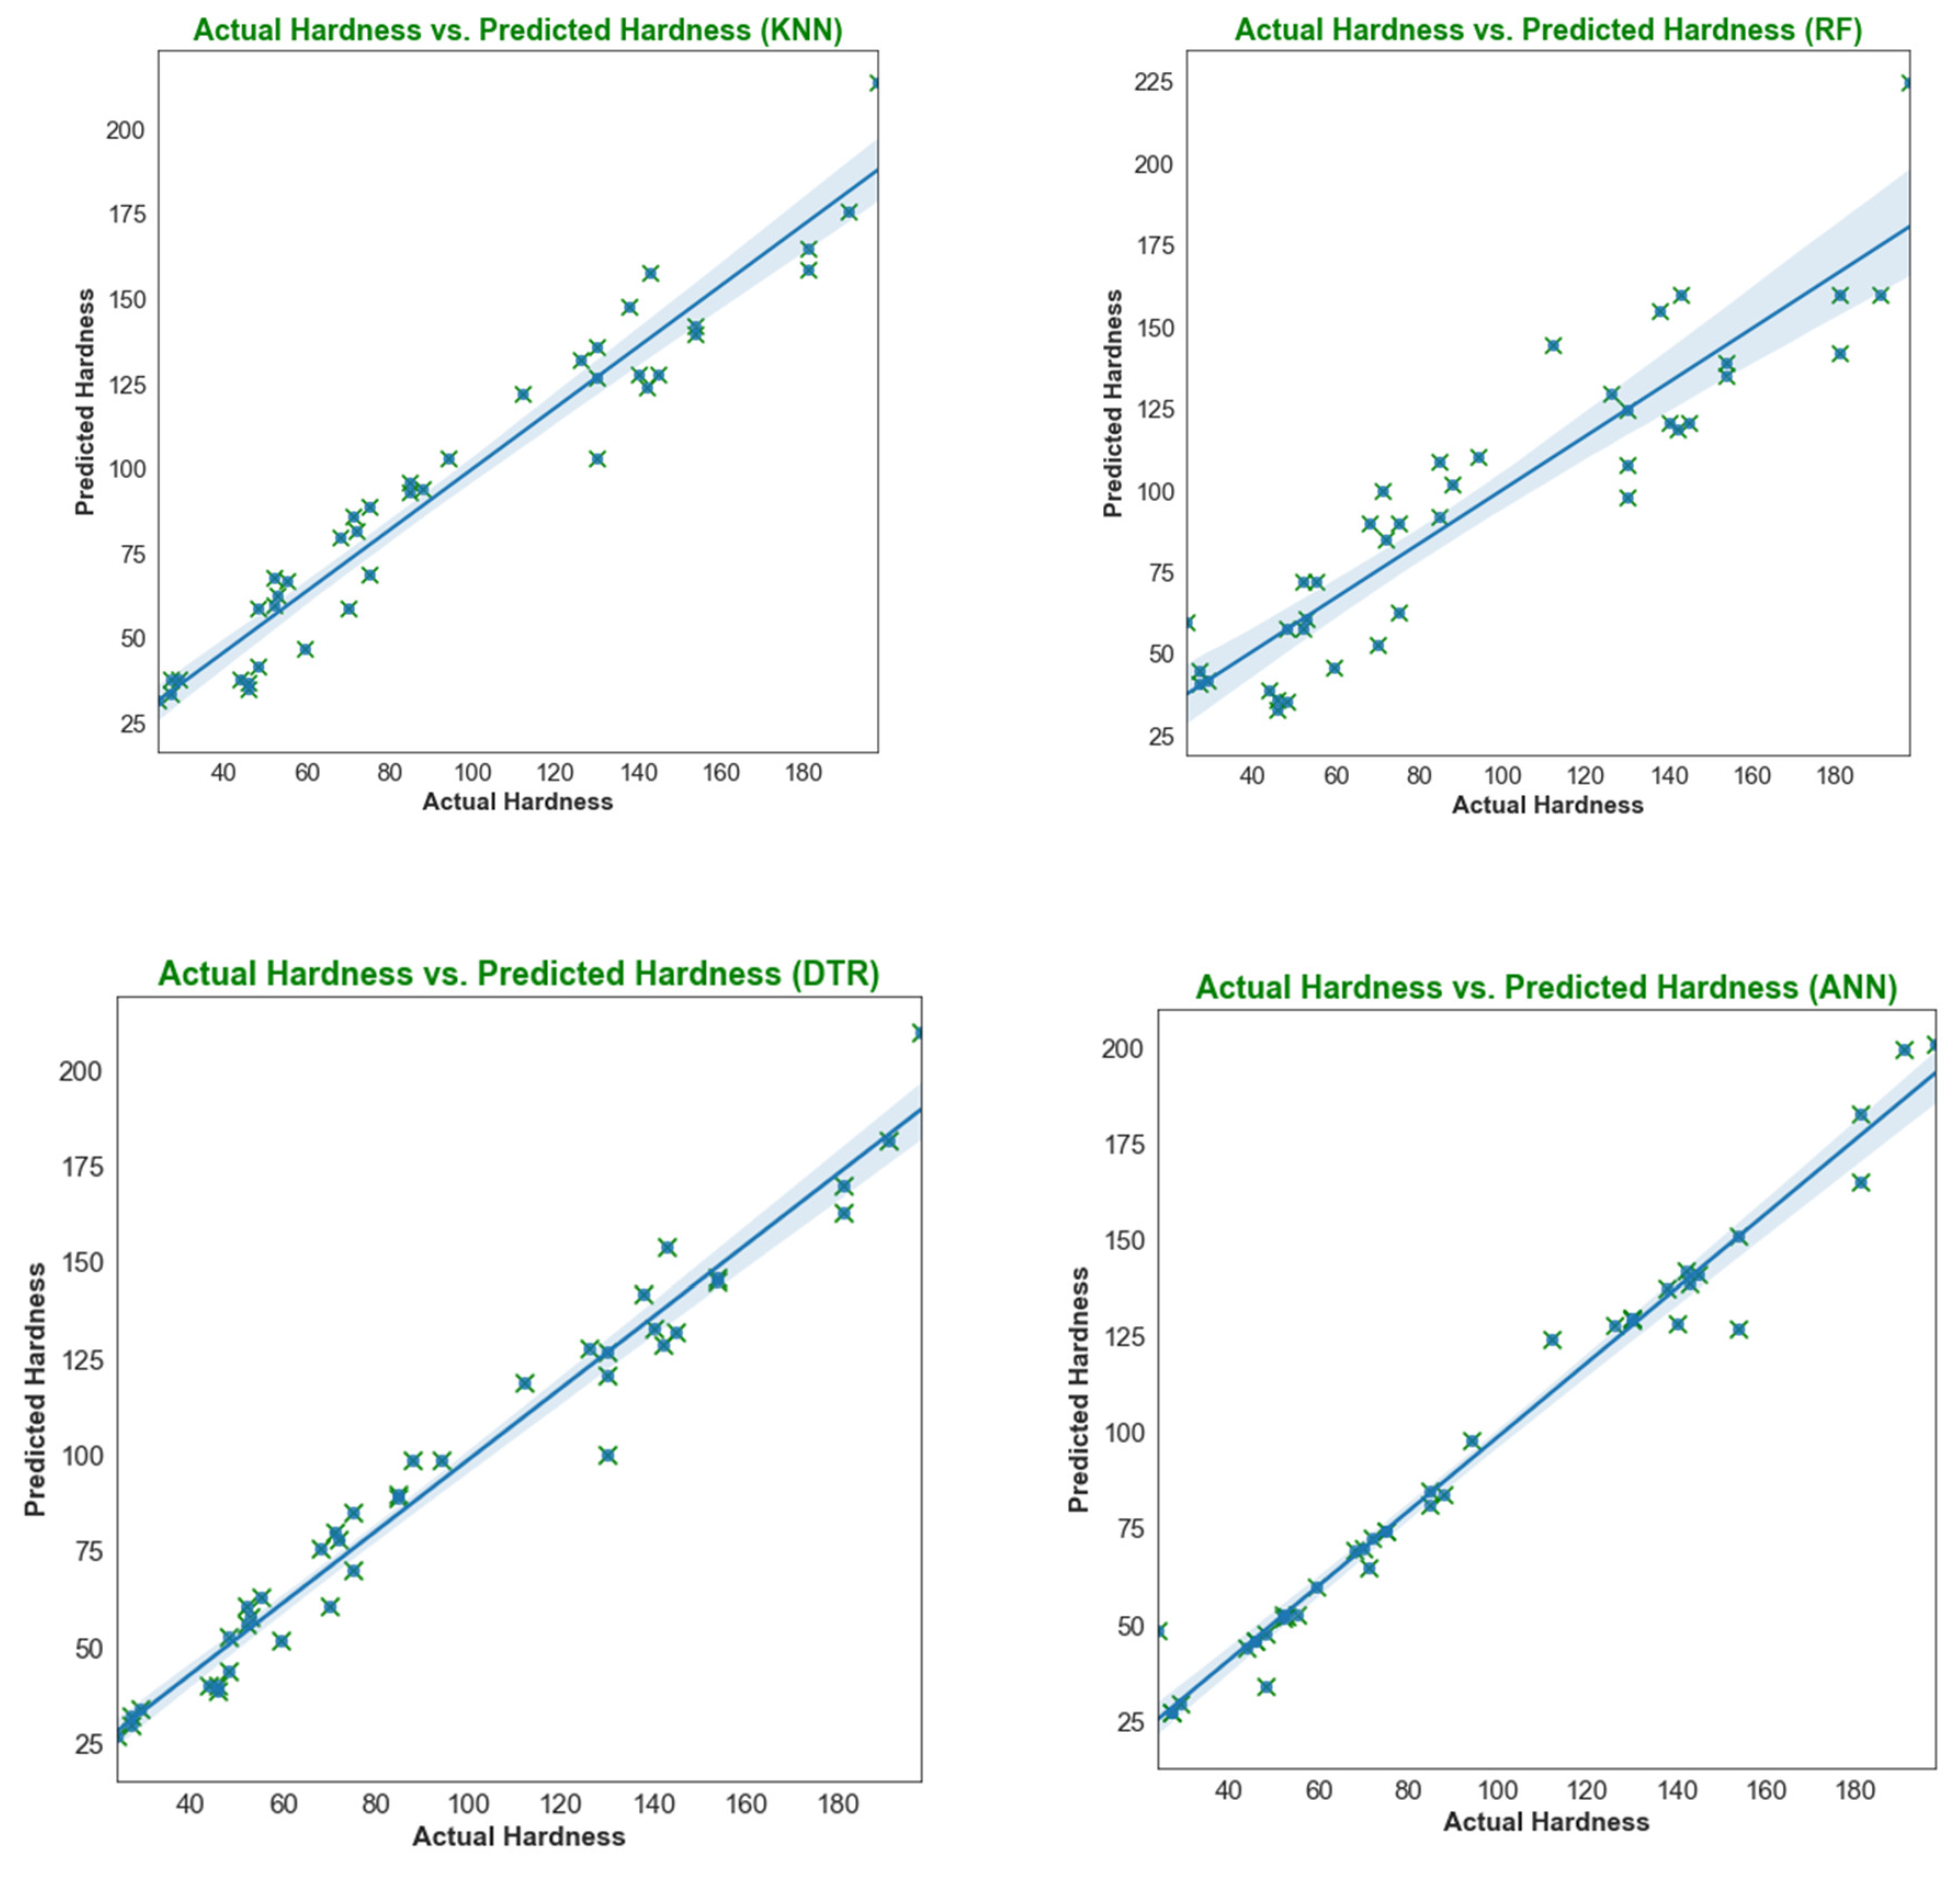
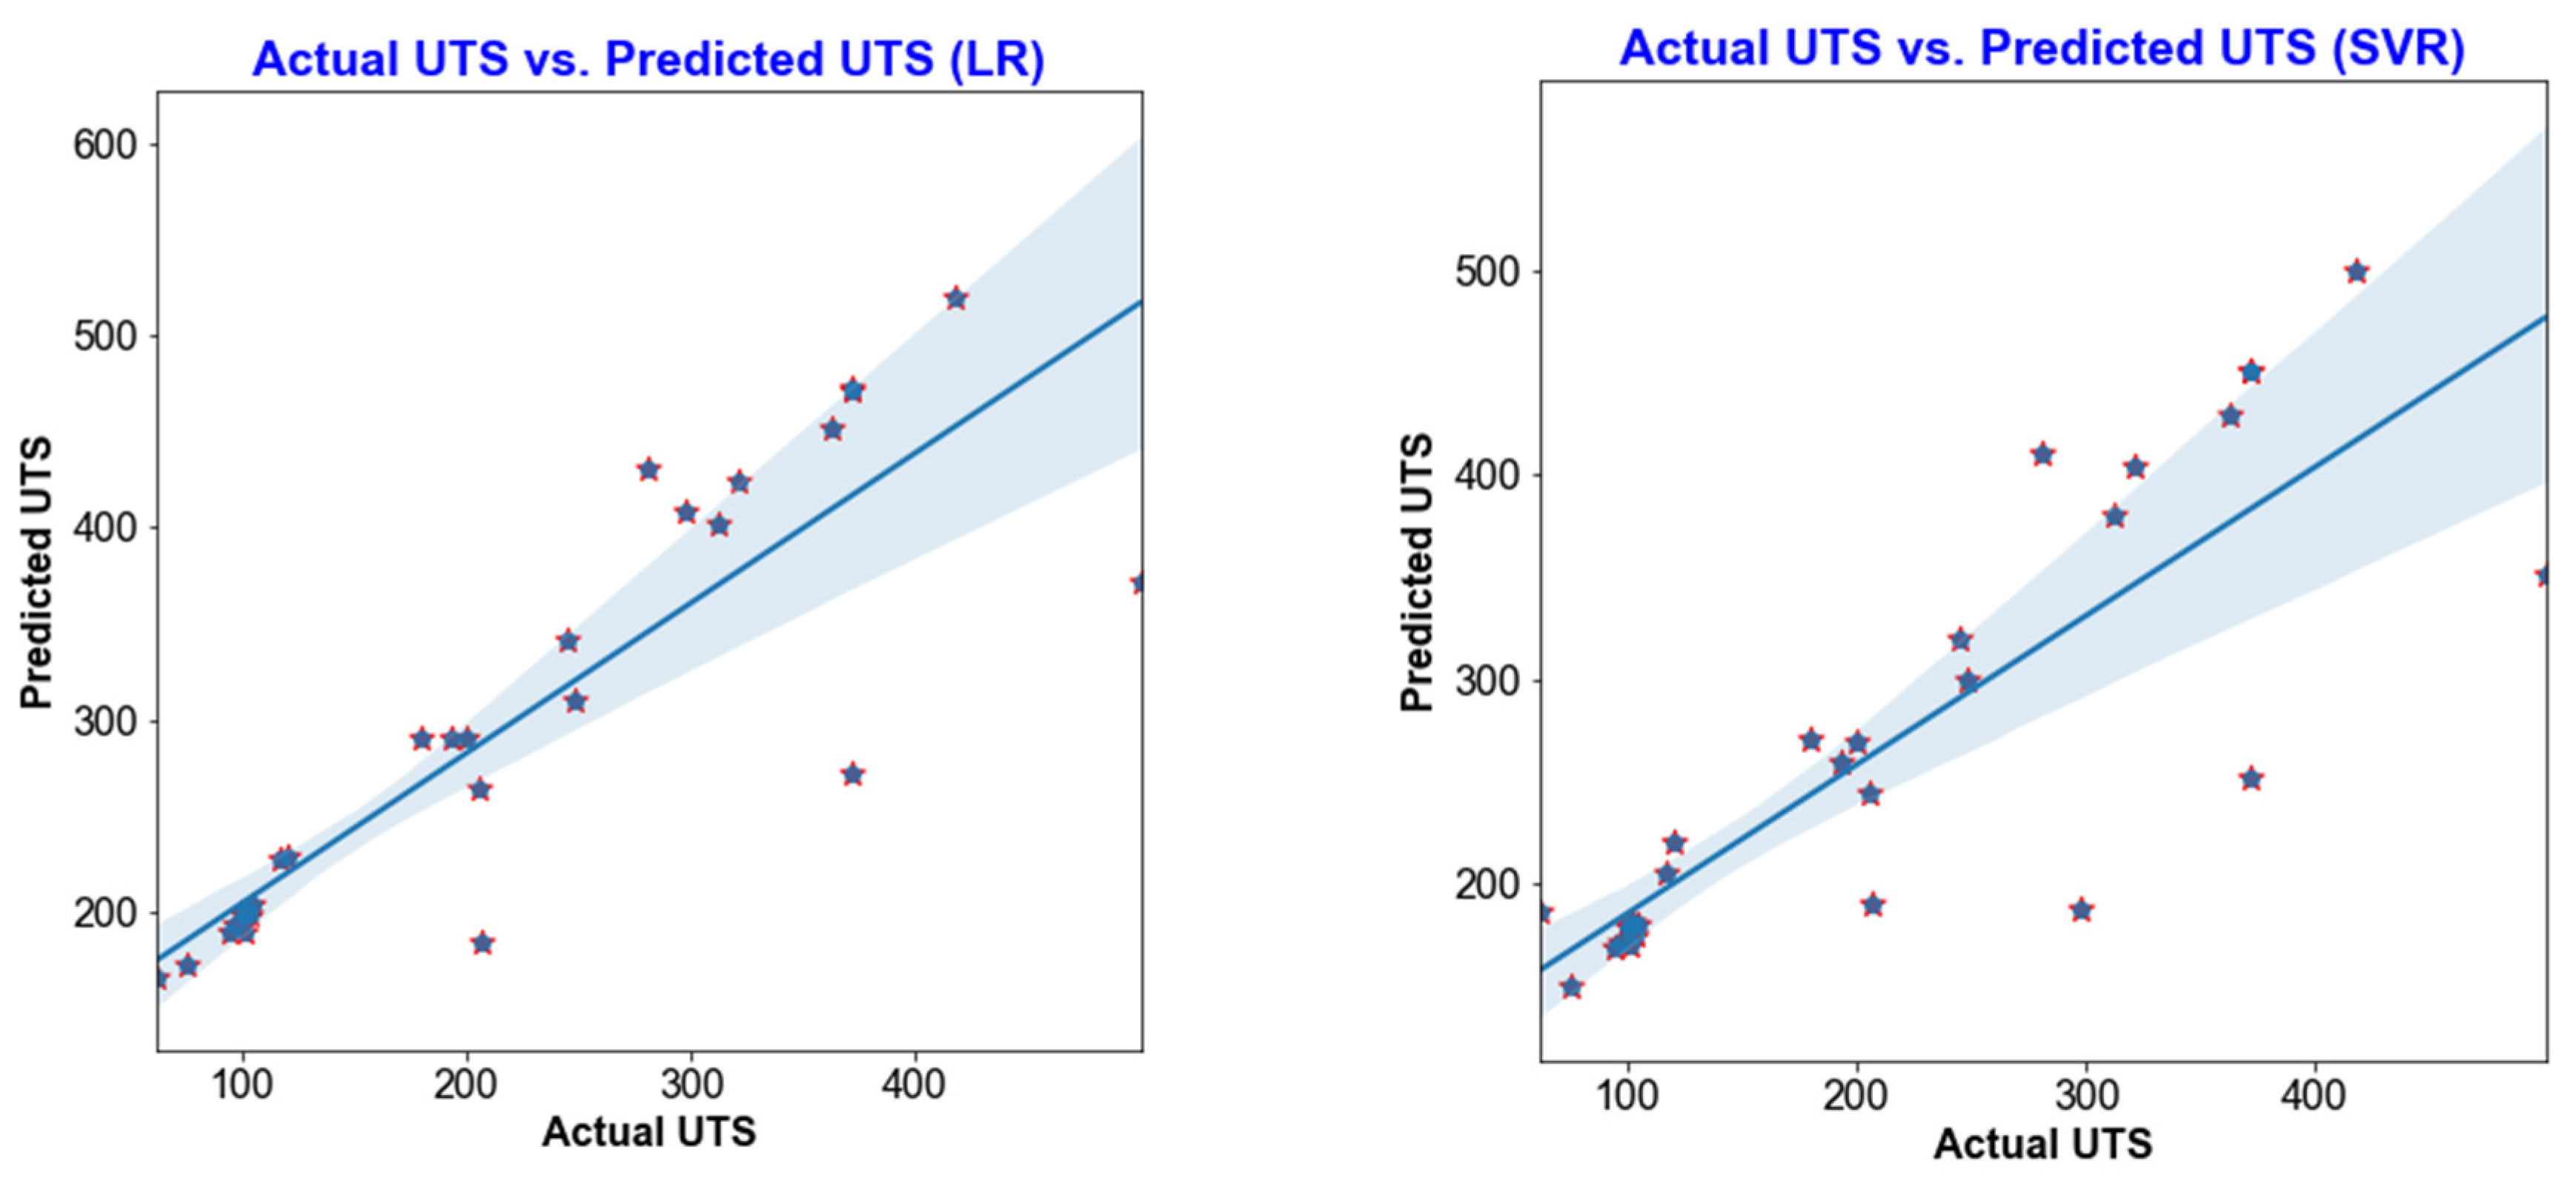
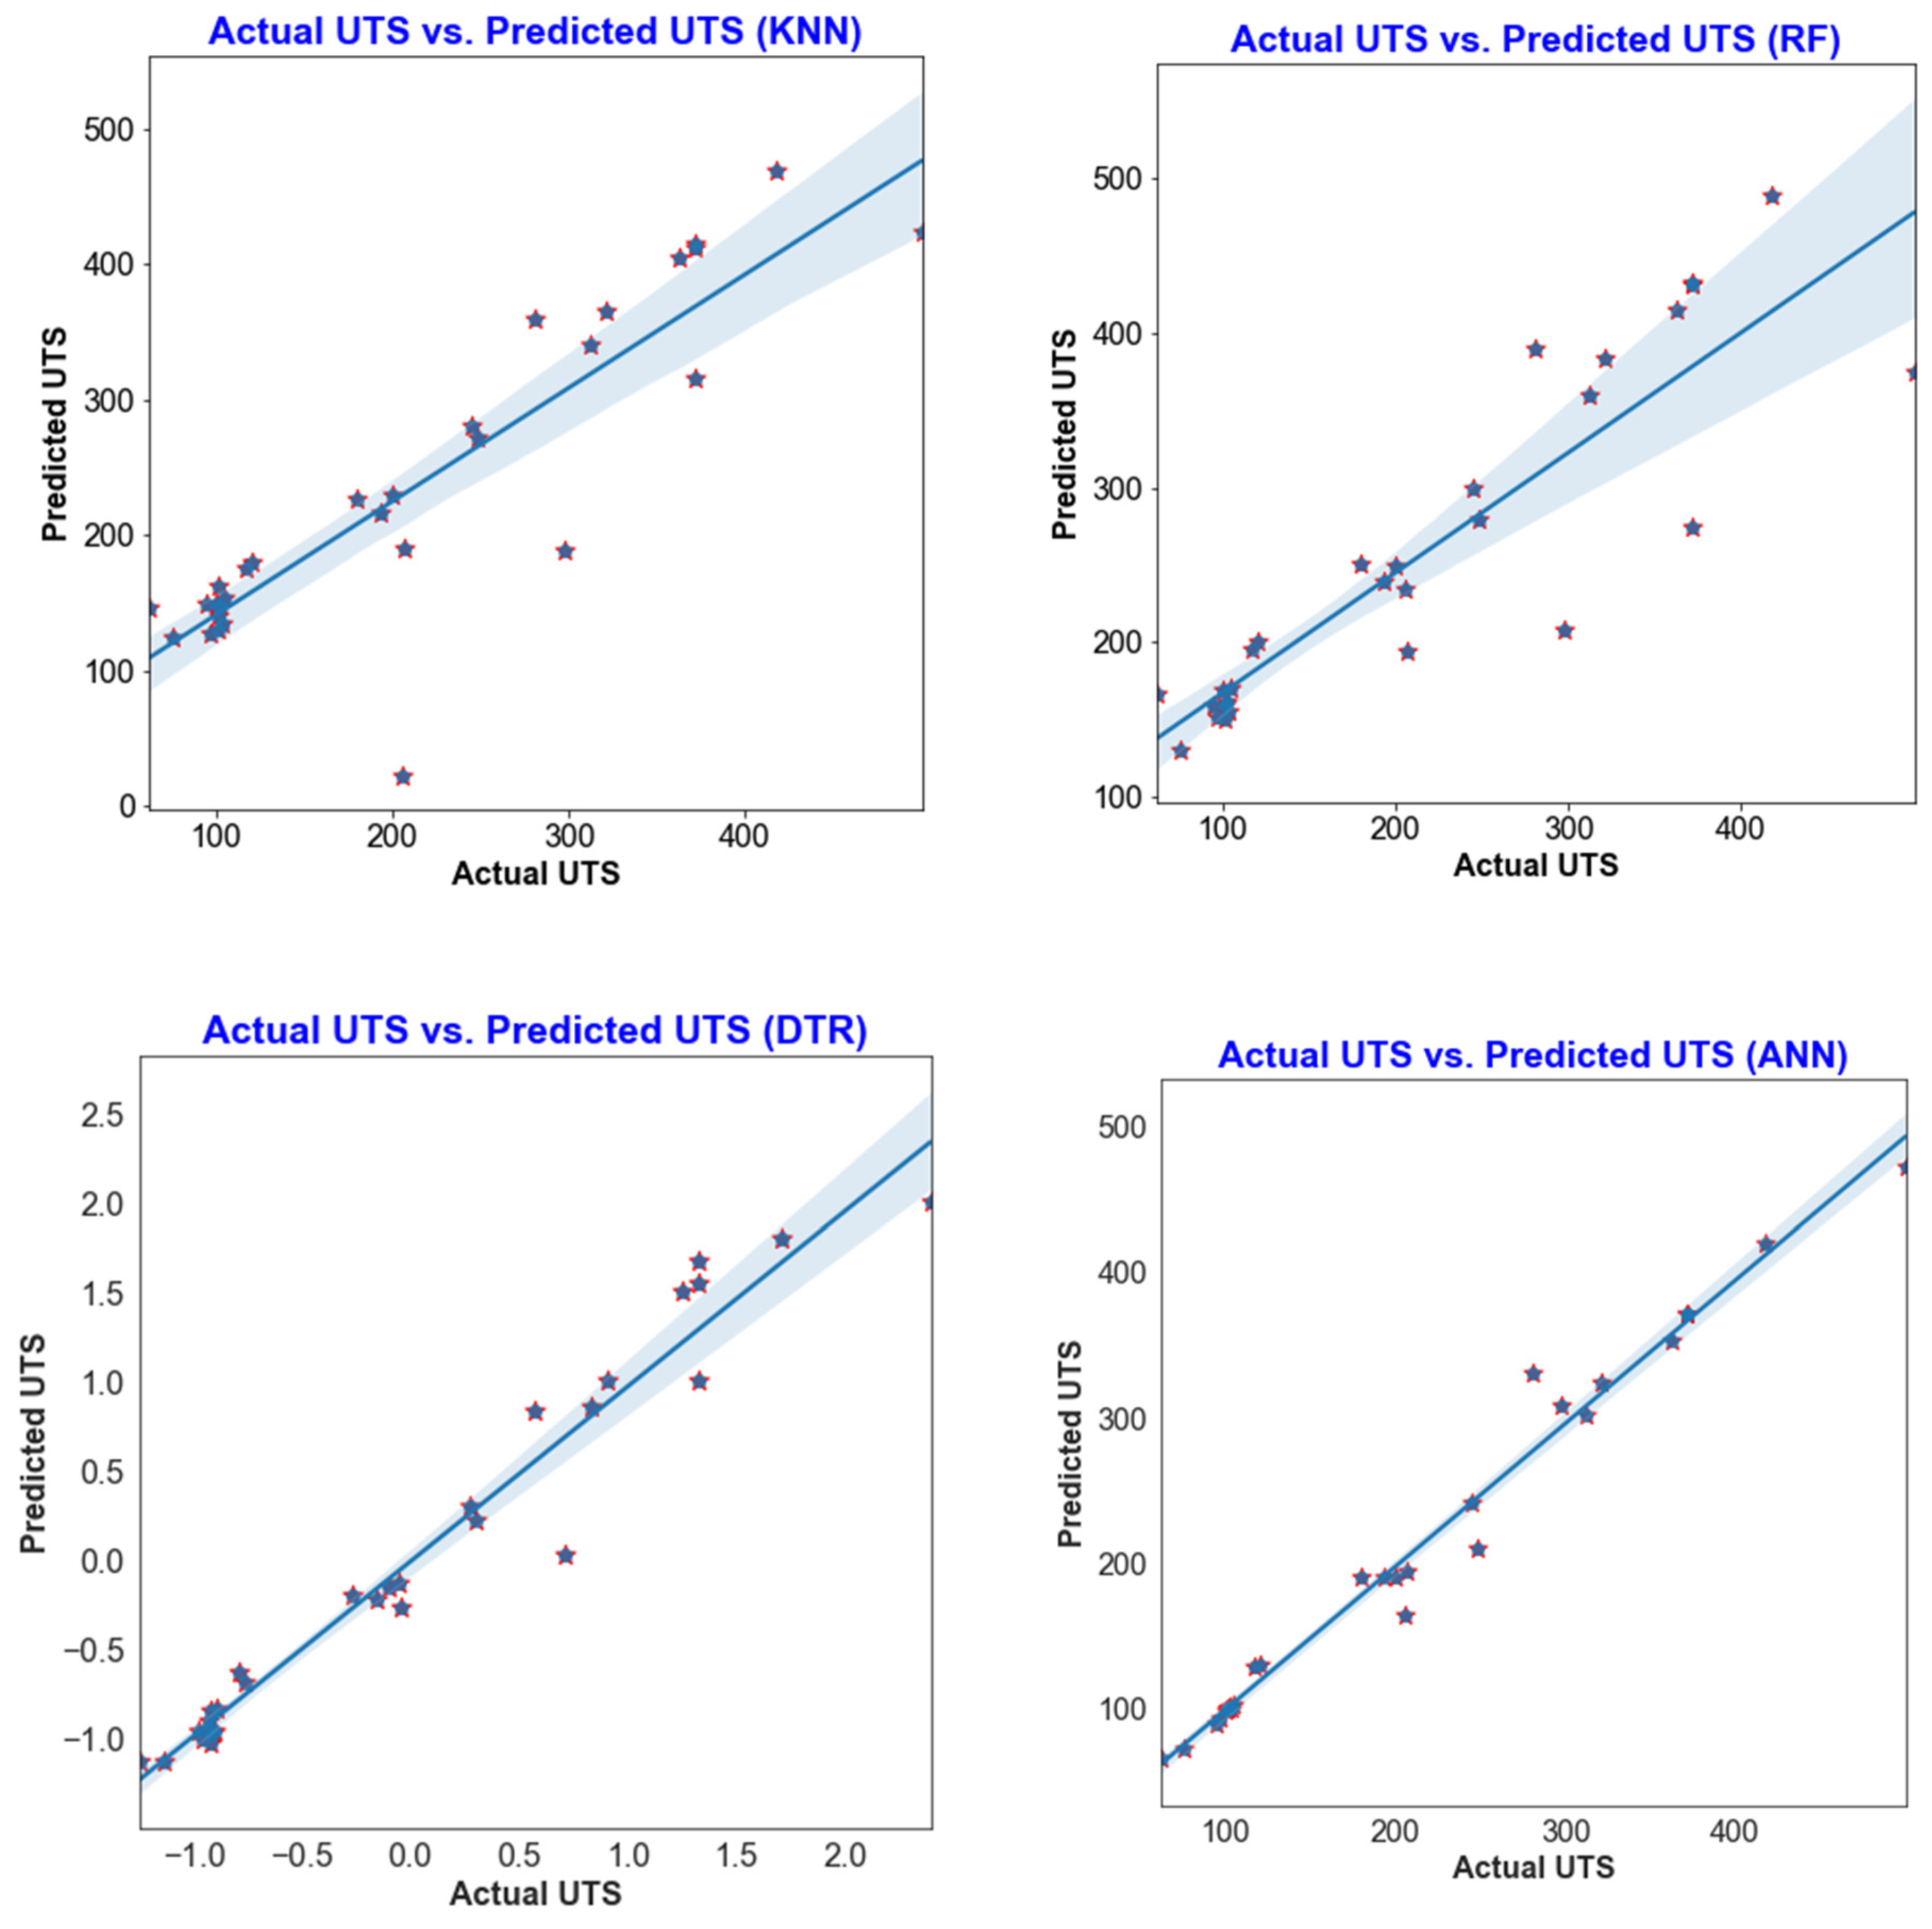
The results from testing the trained models on the remaining 30% of the dataset can be seen in Figure 10 and Figure 11. The output achieved from different machine learning (ML) models depends on the characteristics of the working dataset. An imbalance in the dataset impacts the model results, as is evident from the performance of different ML models. Figure 10 and Figure 11 illustrate that the estimation performance of ANN is significantly superior compared to LR, KNN, DT, SVR, and RF regression. The lower estimation accuracy of these models may be attributed to their simplicity. Furthermore, a simple, direct relationship is insufficient to describe the variation in hardness and ultimate tensile strength of FSW joints, likely due to the complex nature of the welding process. In this process, various parameters interact simultaneously, and even a slight change in any of them impacts the final output. Therefore, it is crucial to develop an effective machine learning model capable of accommodating the process’s non-linearity. The prediction results below indicate that the ANN model effectively achieved this objective.
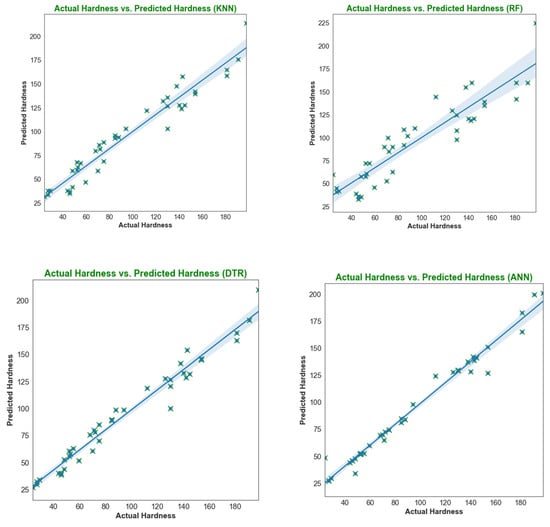
Figure 10.
Training performance of LR, SVR, KNN, RF, DT, and ANN for hardness.
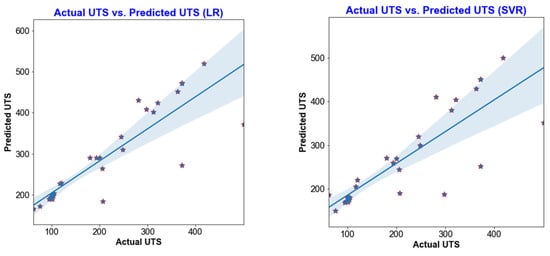
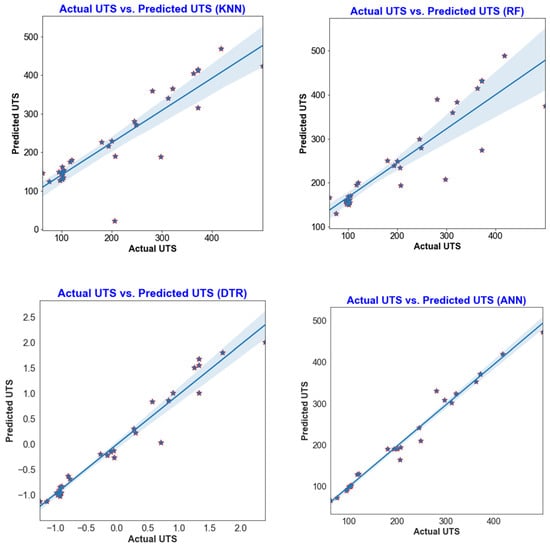
Figure 11.
Training performance of LR, SVR, KNN, RF, DT, and ANN for UTS.
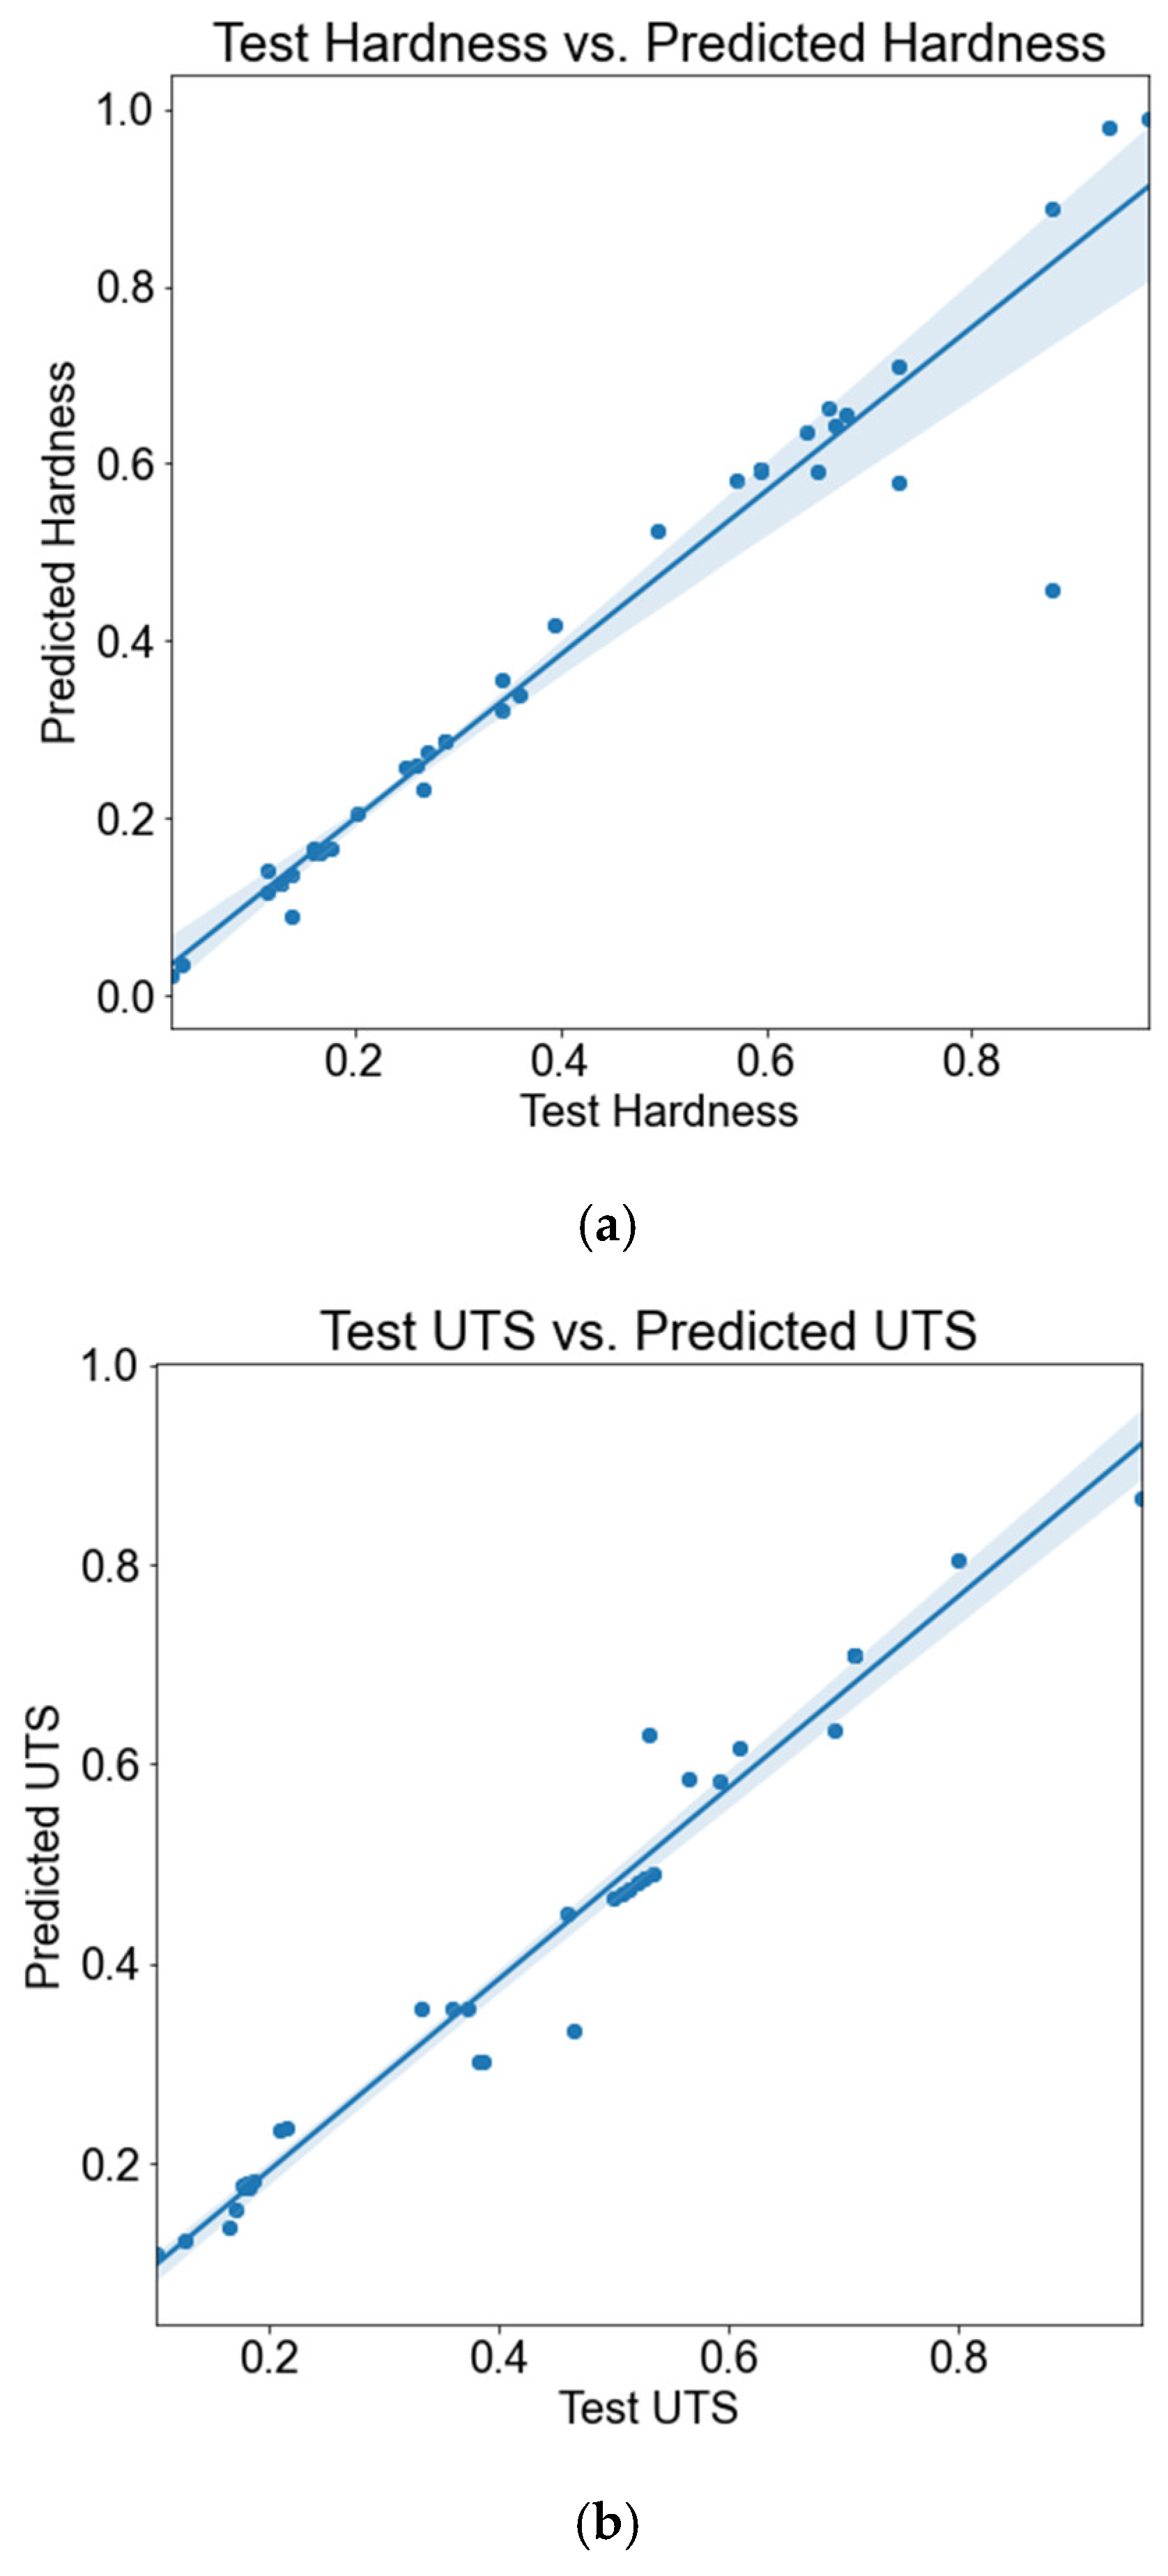
Figure 10 and Figure 11 show that the artificial neural network (ANN) is the best fit for predicting both hardness and ultimate tensile strength (UTS). The consistent dispersion and variation of test data points around the regression line strongly indicate robust data fitting and the potential for highly accurate predictions in the ANN model.
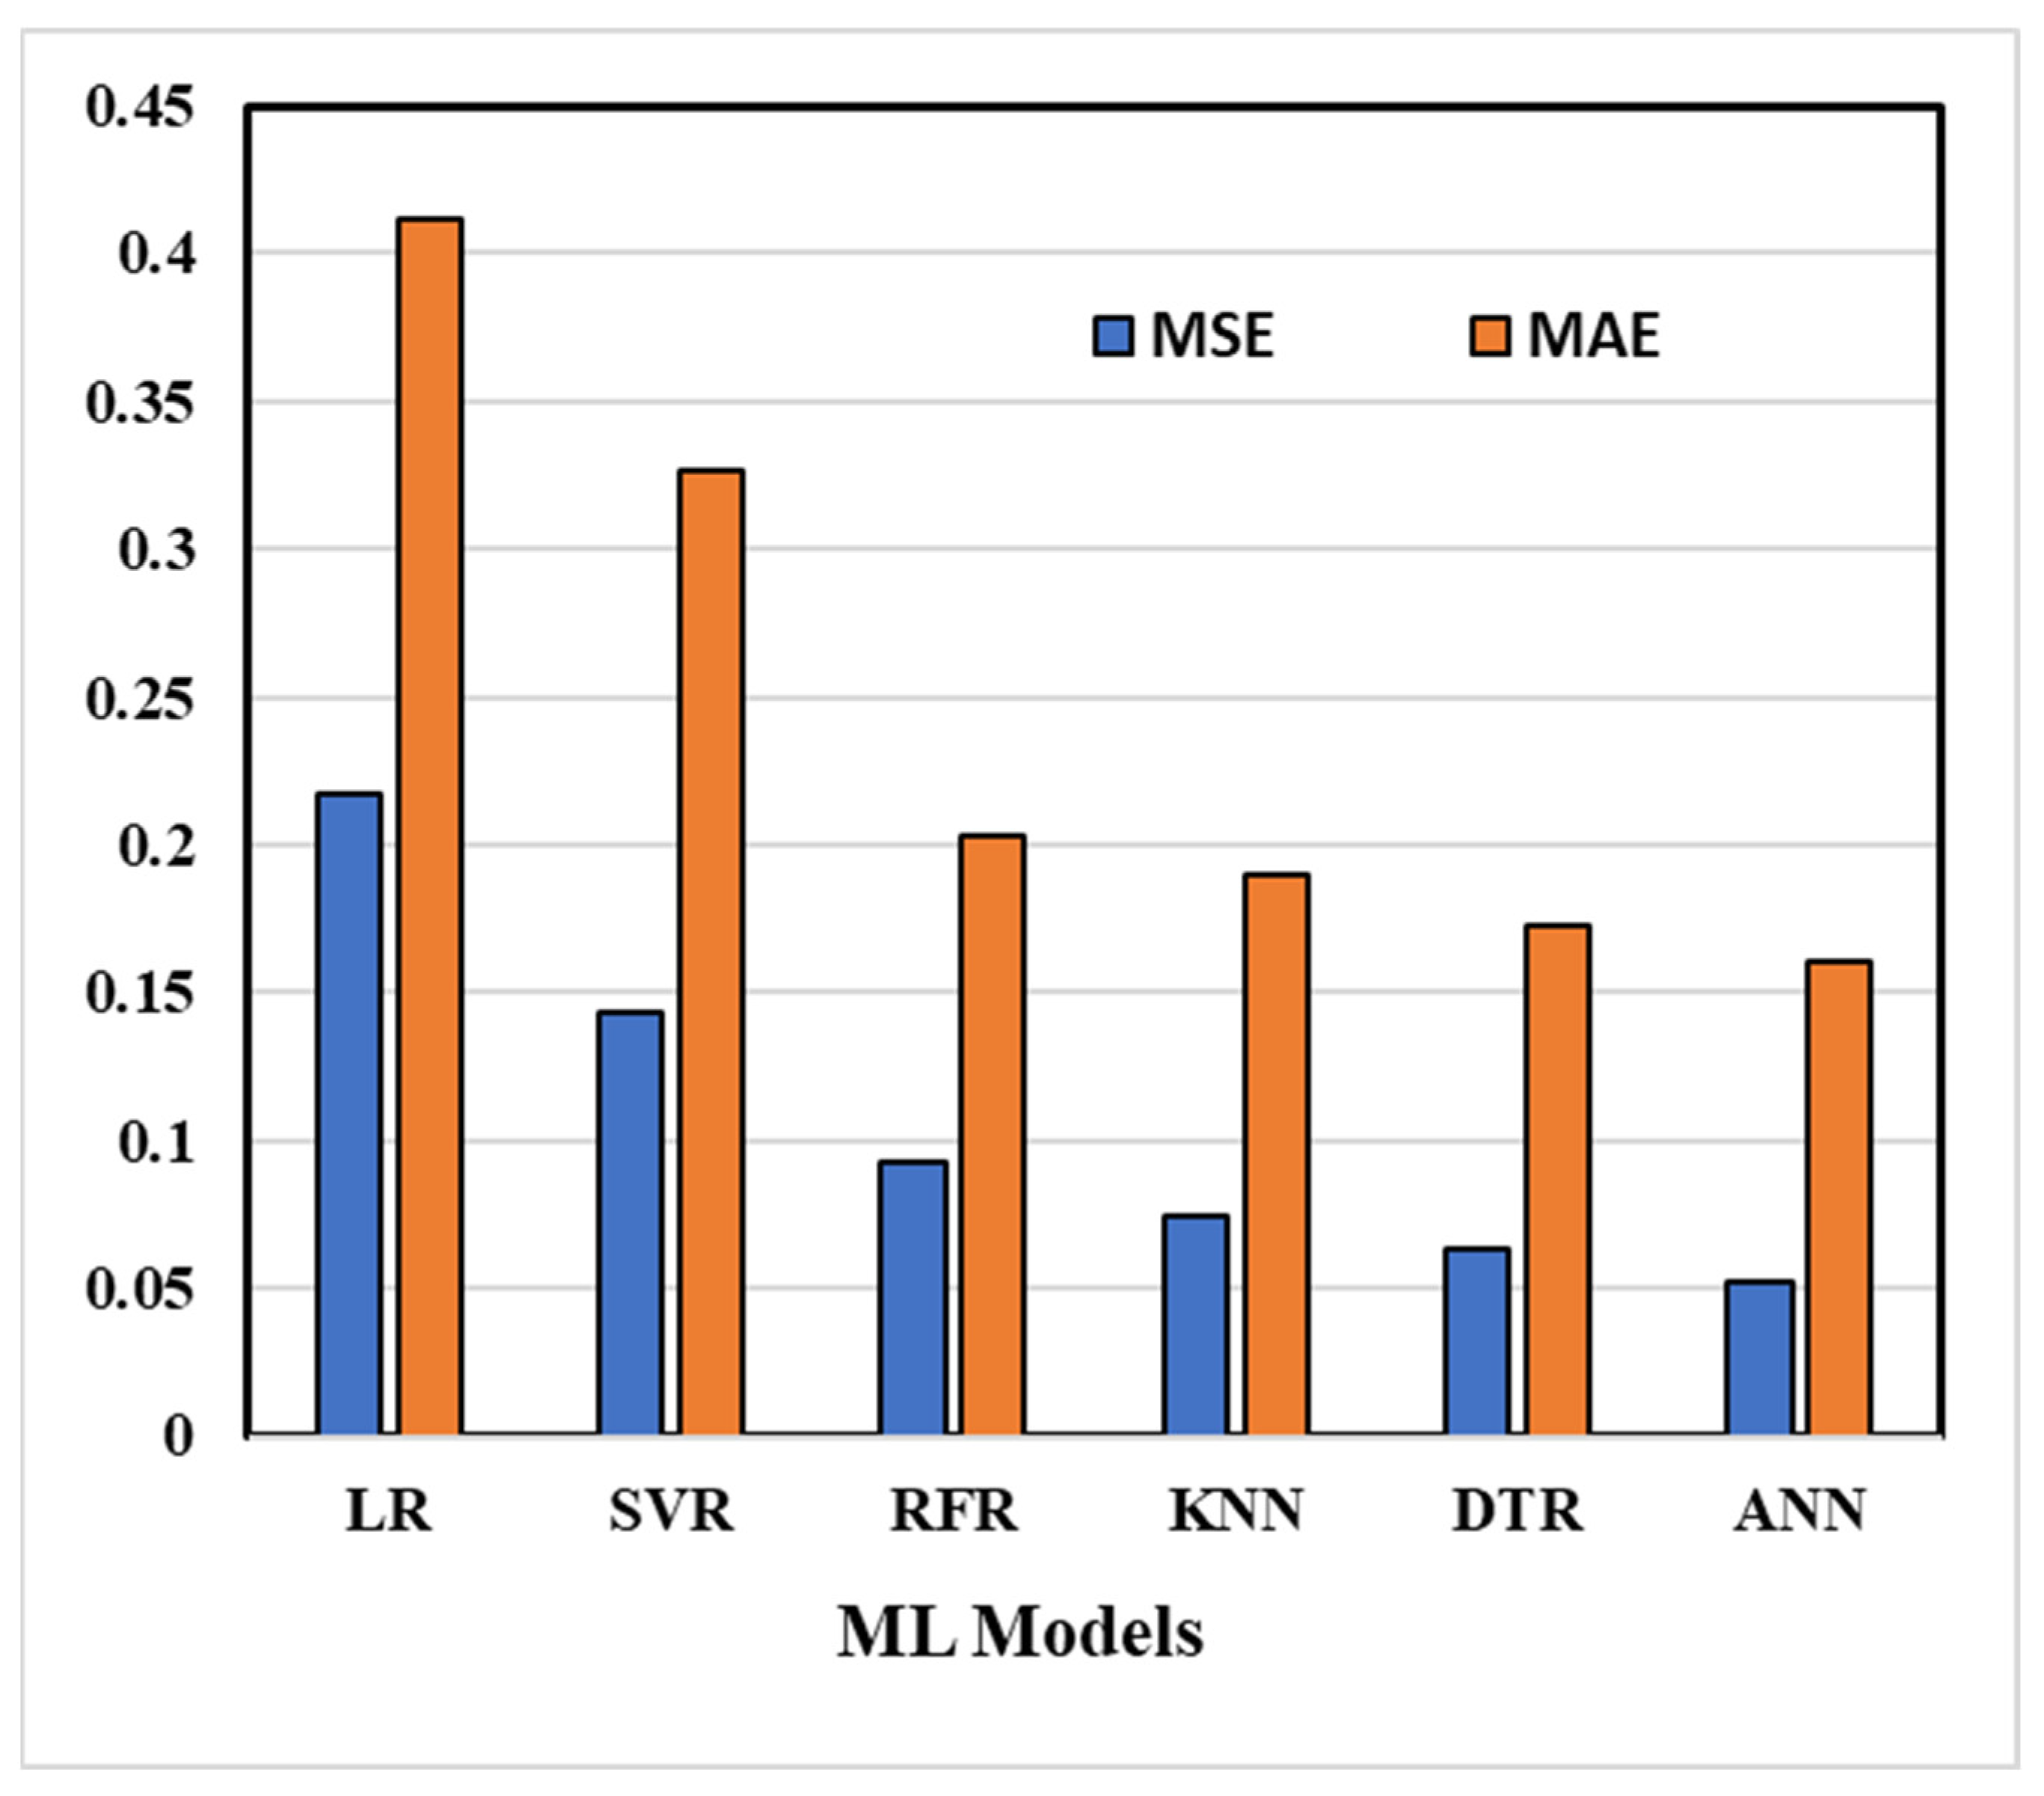
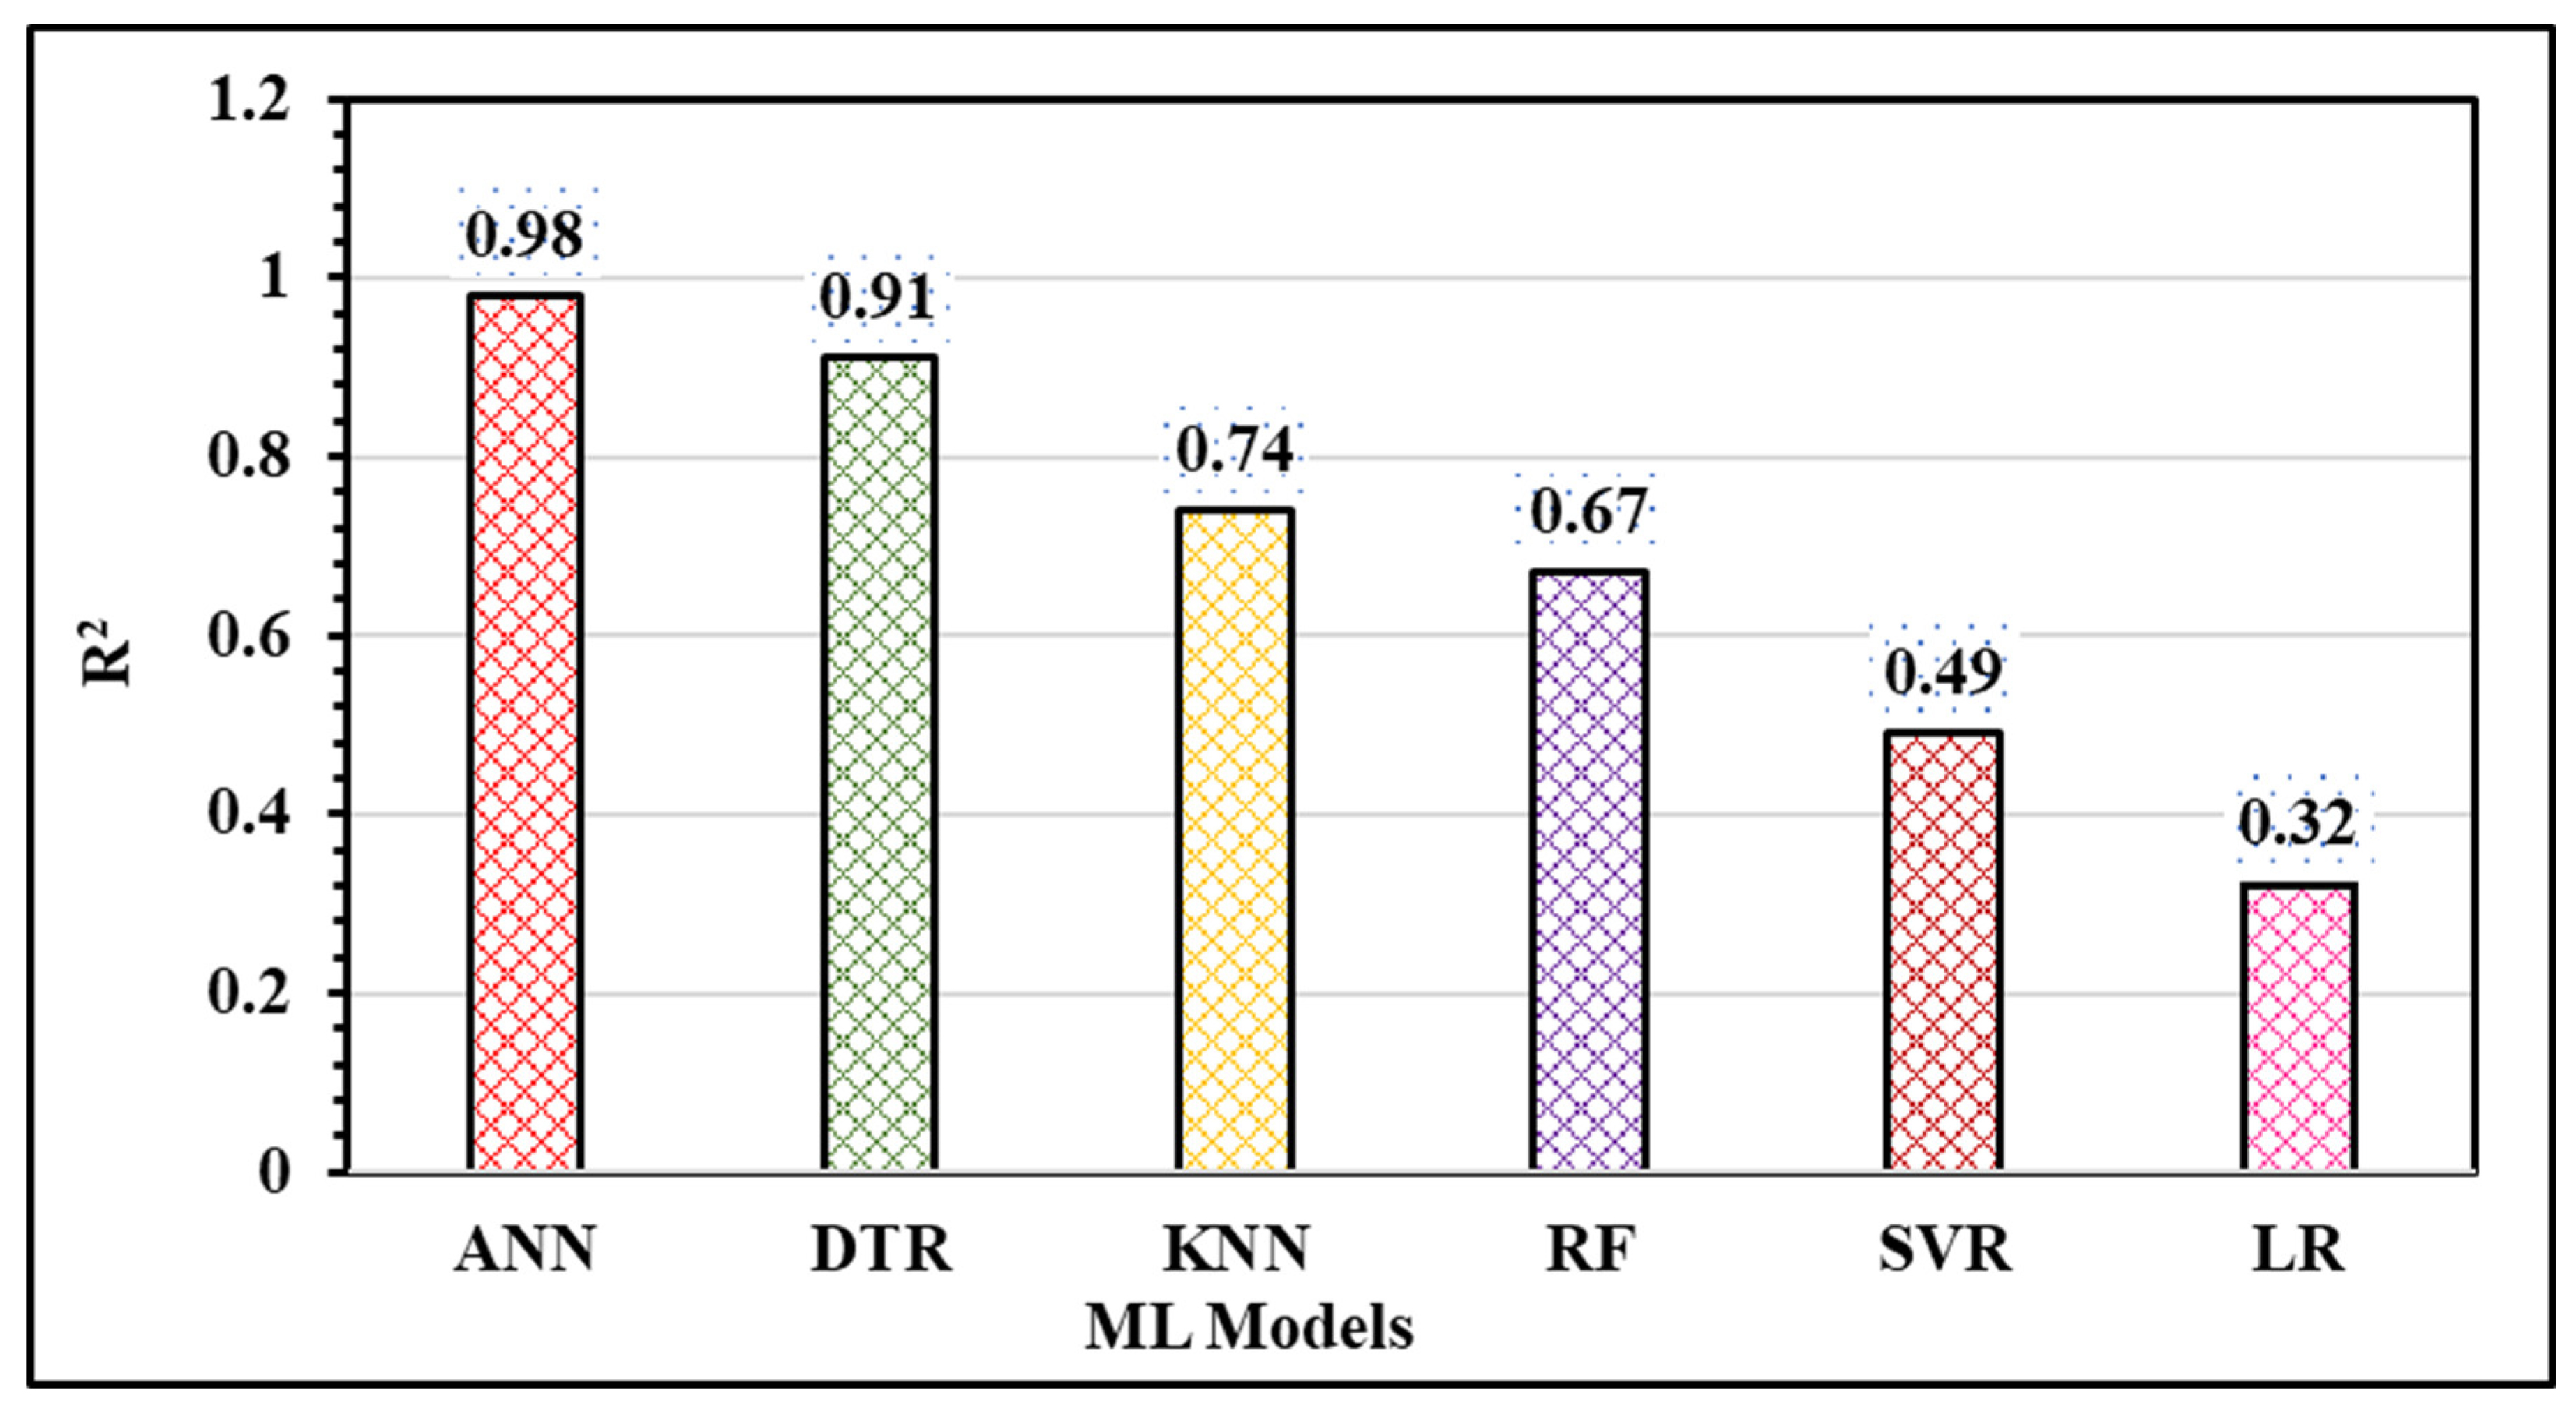
In Figure 12 and Figure 13, the MSE, MAE, and R2 values for all six machine learning models are displayed. The coefficient of determination (R2) value for the ANN model on the testing data is 0.91, which is notably higher than the values obtained for the other models. Moreover, the ANN model exhibits the highest R2 score and the lowest MAE and MSE (as depicted in Figure 13), suggesting that it is the most suitable method for accurately estimating hardness and UTS.
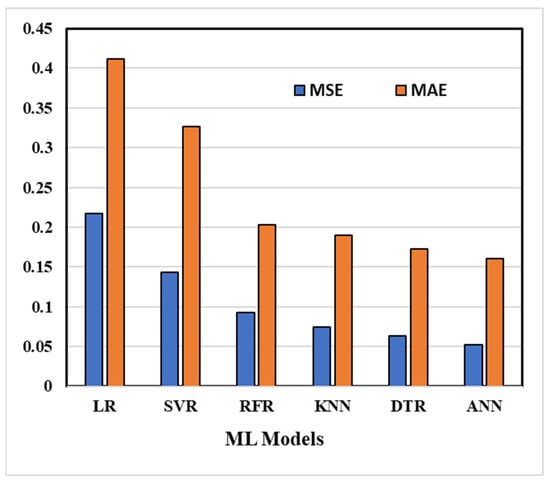
Figure 12.
MSE and MAE for all six models under consideration.
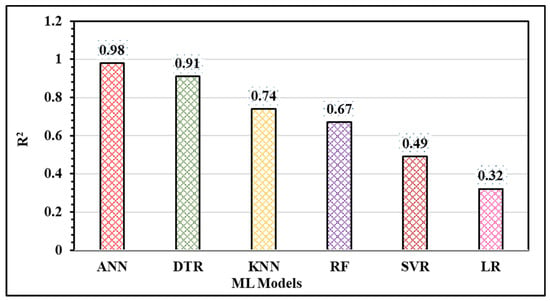
Figure 13.
Correlation coefficient (R2) for all six models under consideration.
It has been seen that the ANN has the lowest mean squared error. Therefore, a feed forward back propagation artificial neural network was selected for further study.
5.1. ANN Modelling Using Python
Artificial neural networks (ANNs) are intelligent techniques inspired by biological neurons. Due to their finest qualities, such as generalization, faster processing, and simple implementation, ANNs have become quite popular in many engineering domains. ANNs are composed of several simple, interconnected processing units called neurons that are grouped into layers. Manufacturing, pattern identification, speech recognition, defect detection, communications, autonomous vehicles, and gantry crane navigation control are just a few sectors where artificial neural networks are widely used [43,44]. In manufacturing, ANNs are used in cold forging to forecast flow stress in hot deformation, tool wear monitoring, machining behaviour prediction, manufacturing process optimization, sintered density prediction, and many more [41,44]. In the training process, the network is provided with input and output pairs representing the pattern to be simulated, and the weights are determined using an iterative technique [45]. During the forward-back propagation network, each neuron in the hidden layer responds to each neuron in the output layer. In the backward pass, each hidden layer neuron unequivocally receives an error from the output layer through an activation function [45].
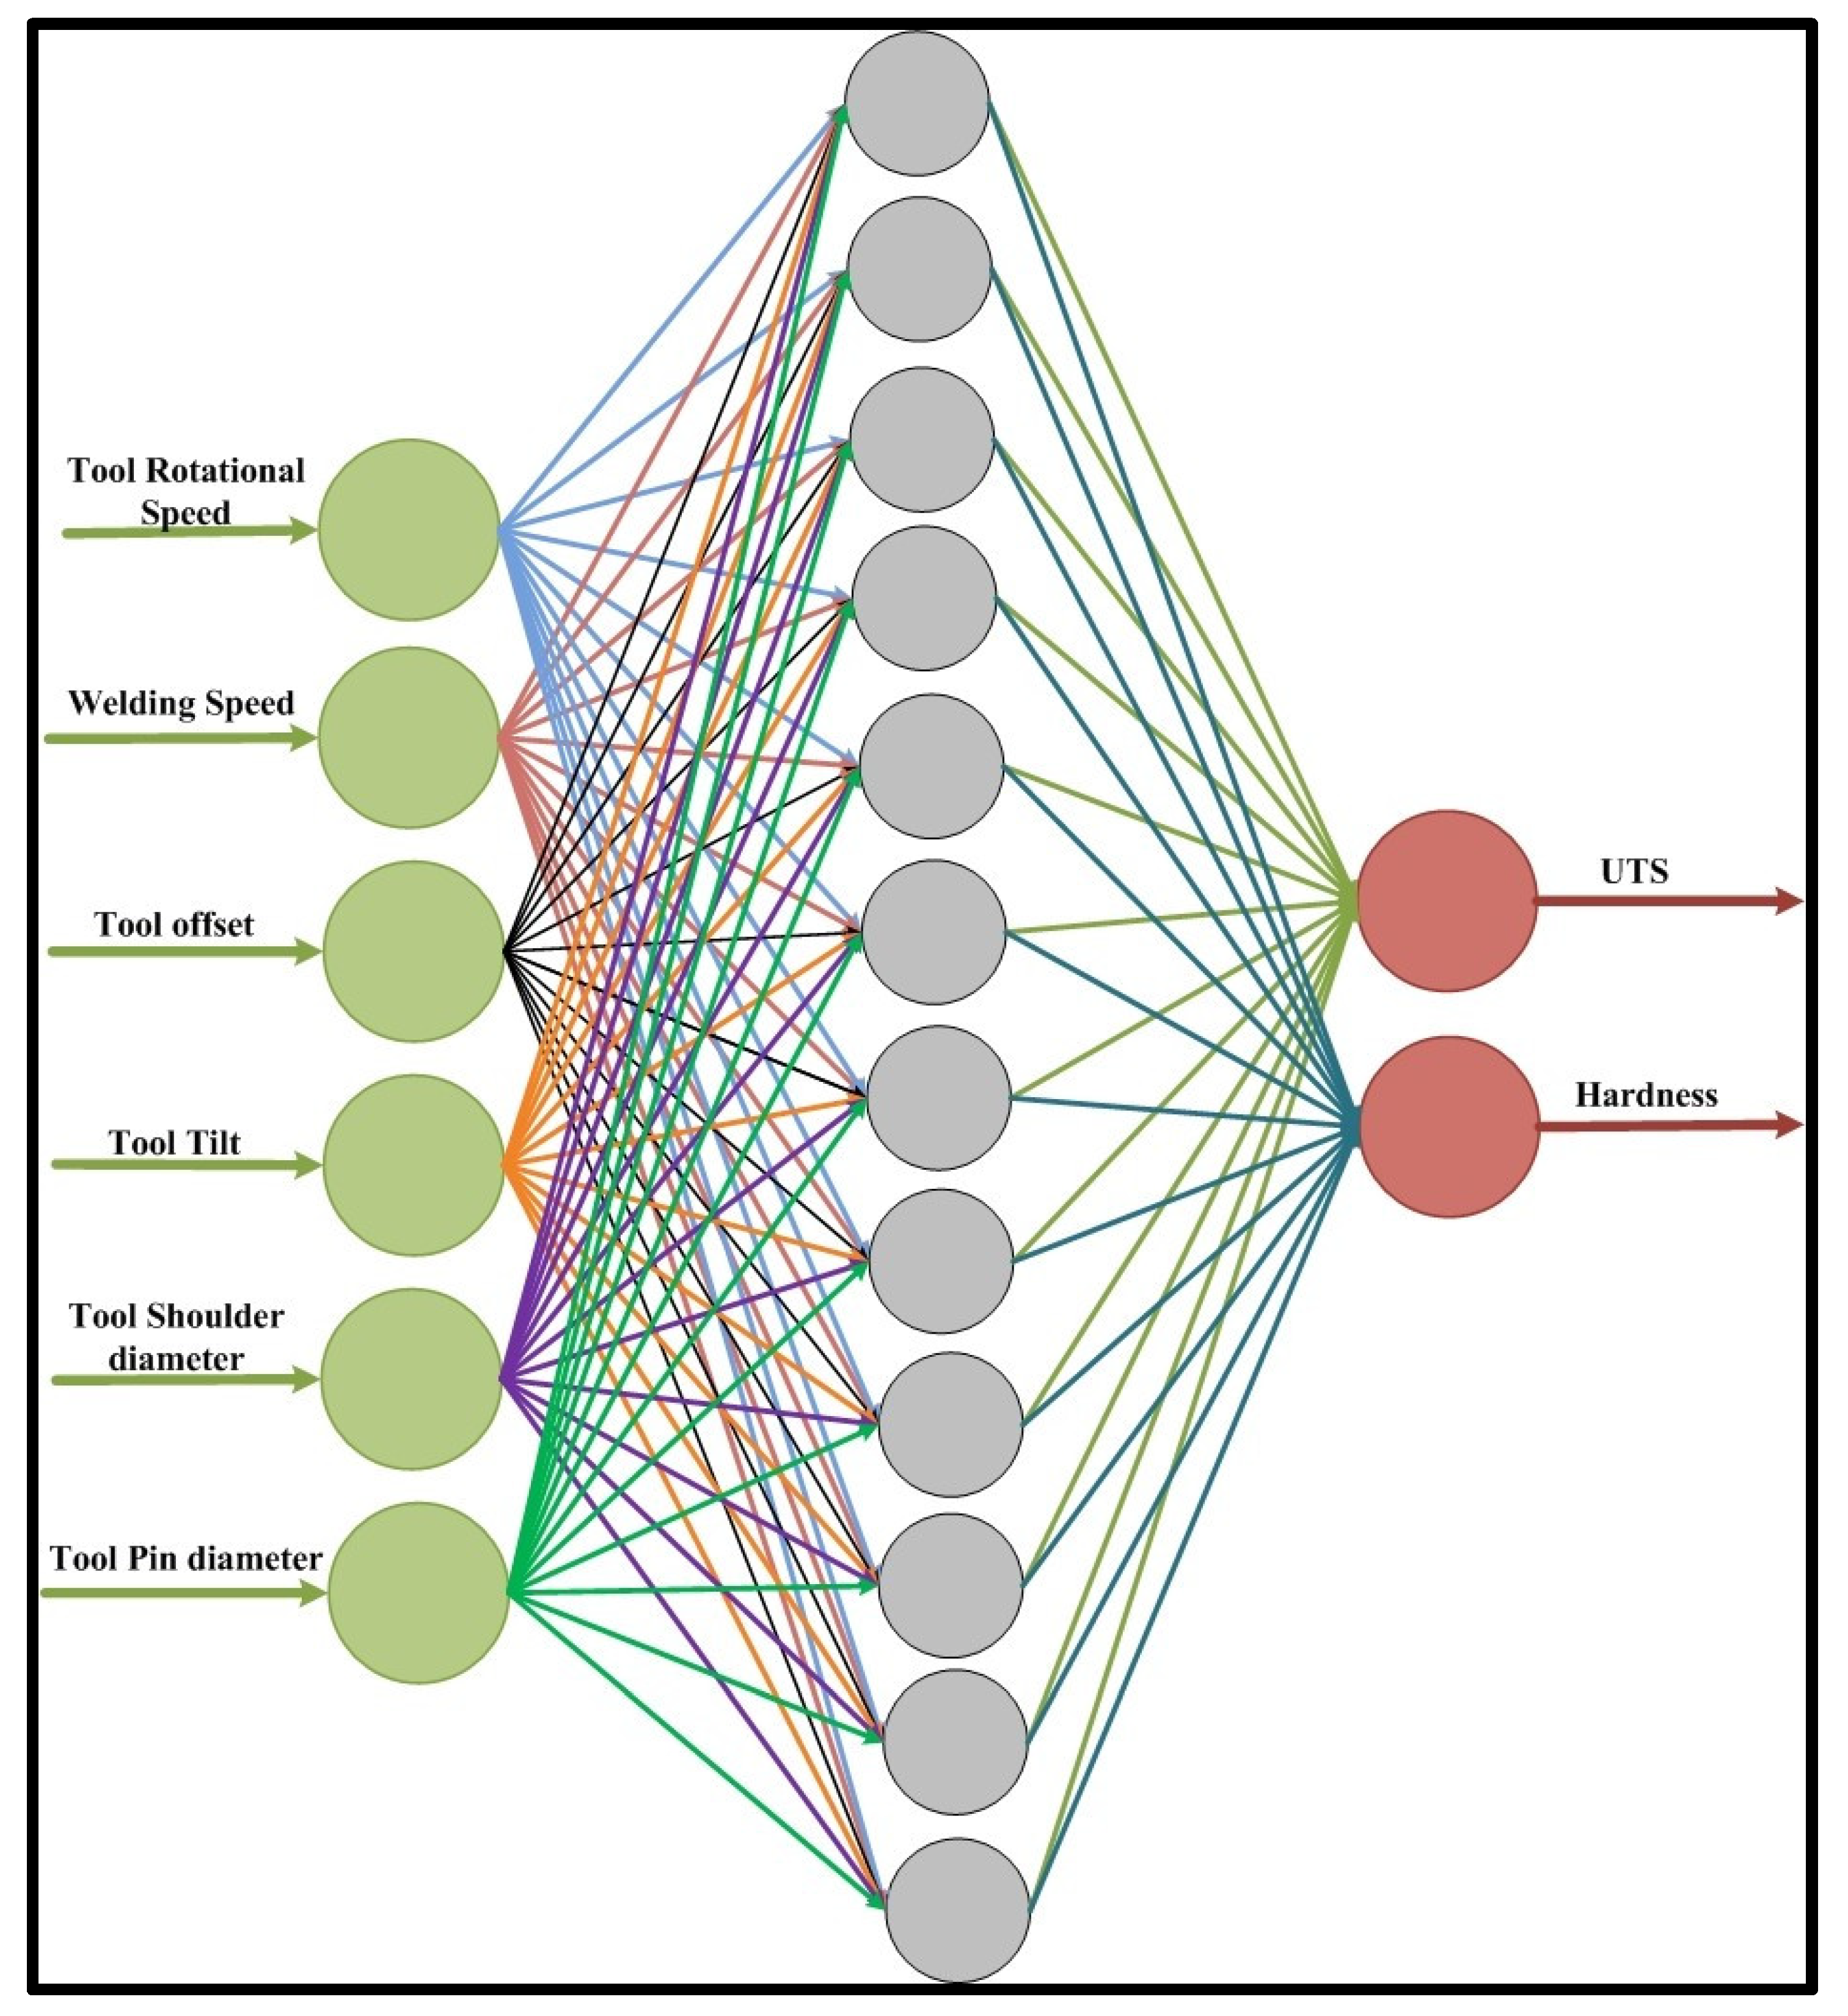
In the present work, Python and its various libraries, such as Pandas, Scikit-learn, Numpy, Scipy, Matplotlib, etc., were utilized to create an ANN. Figure 14 depicts the topology of ANN that will be used to forecast the ultimate tensile strength and hardness for friction stir welded joints. Furthermore, the developed model is used to carry out the behavioural study of UTS and hardness with respect to different processing parameters. The feed-forward back propagation (B.P.) artificial neural network was first trained using 70% of the collected data from various kinds of literature, and then testing of the model was performed using 30% of the collected data that had not been utilized during training.

Figure 14.
ANN architecture used for prediction of UTS and hardness.
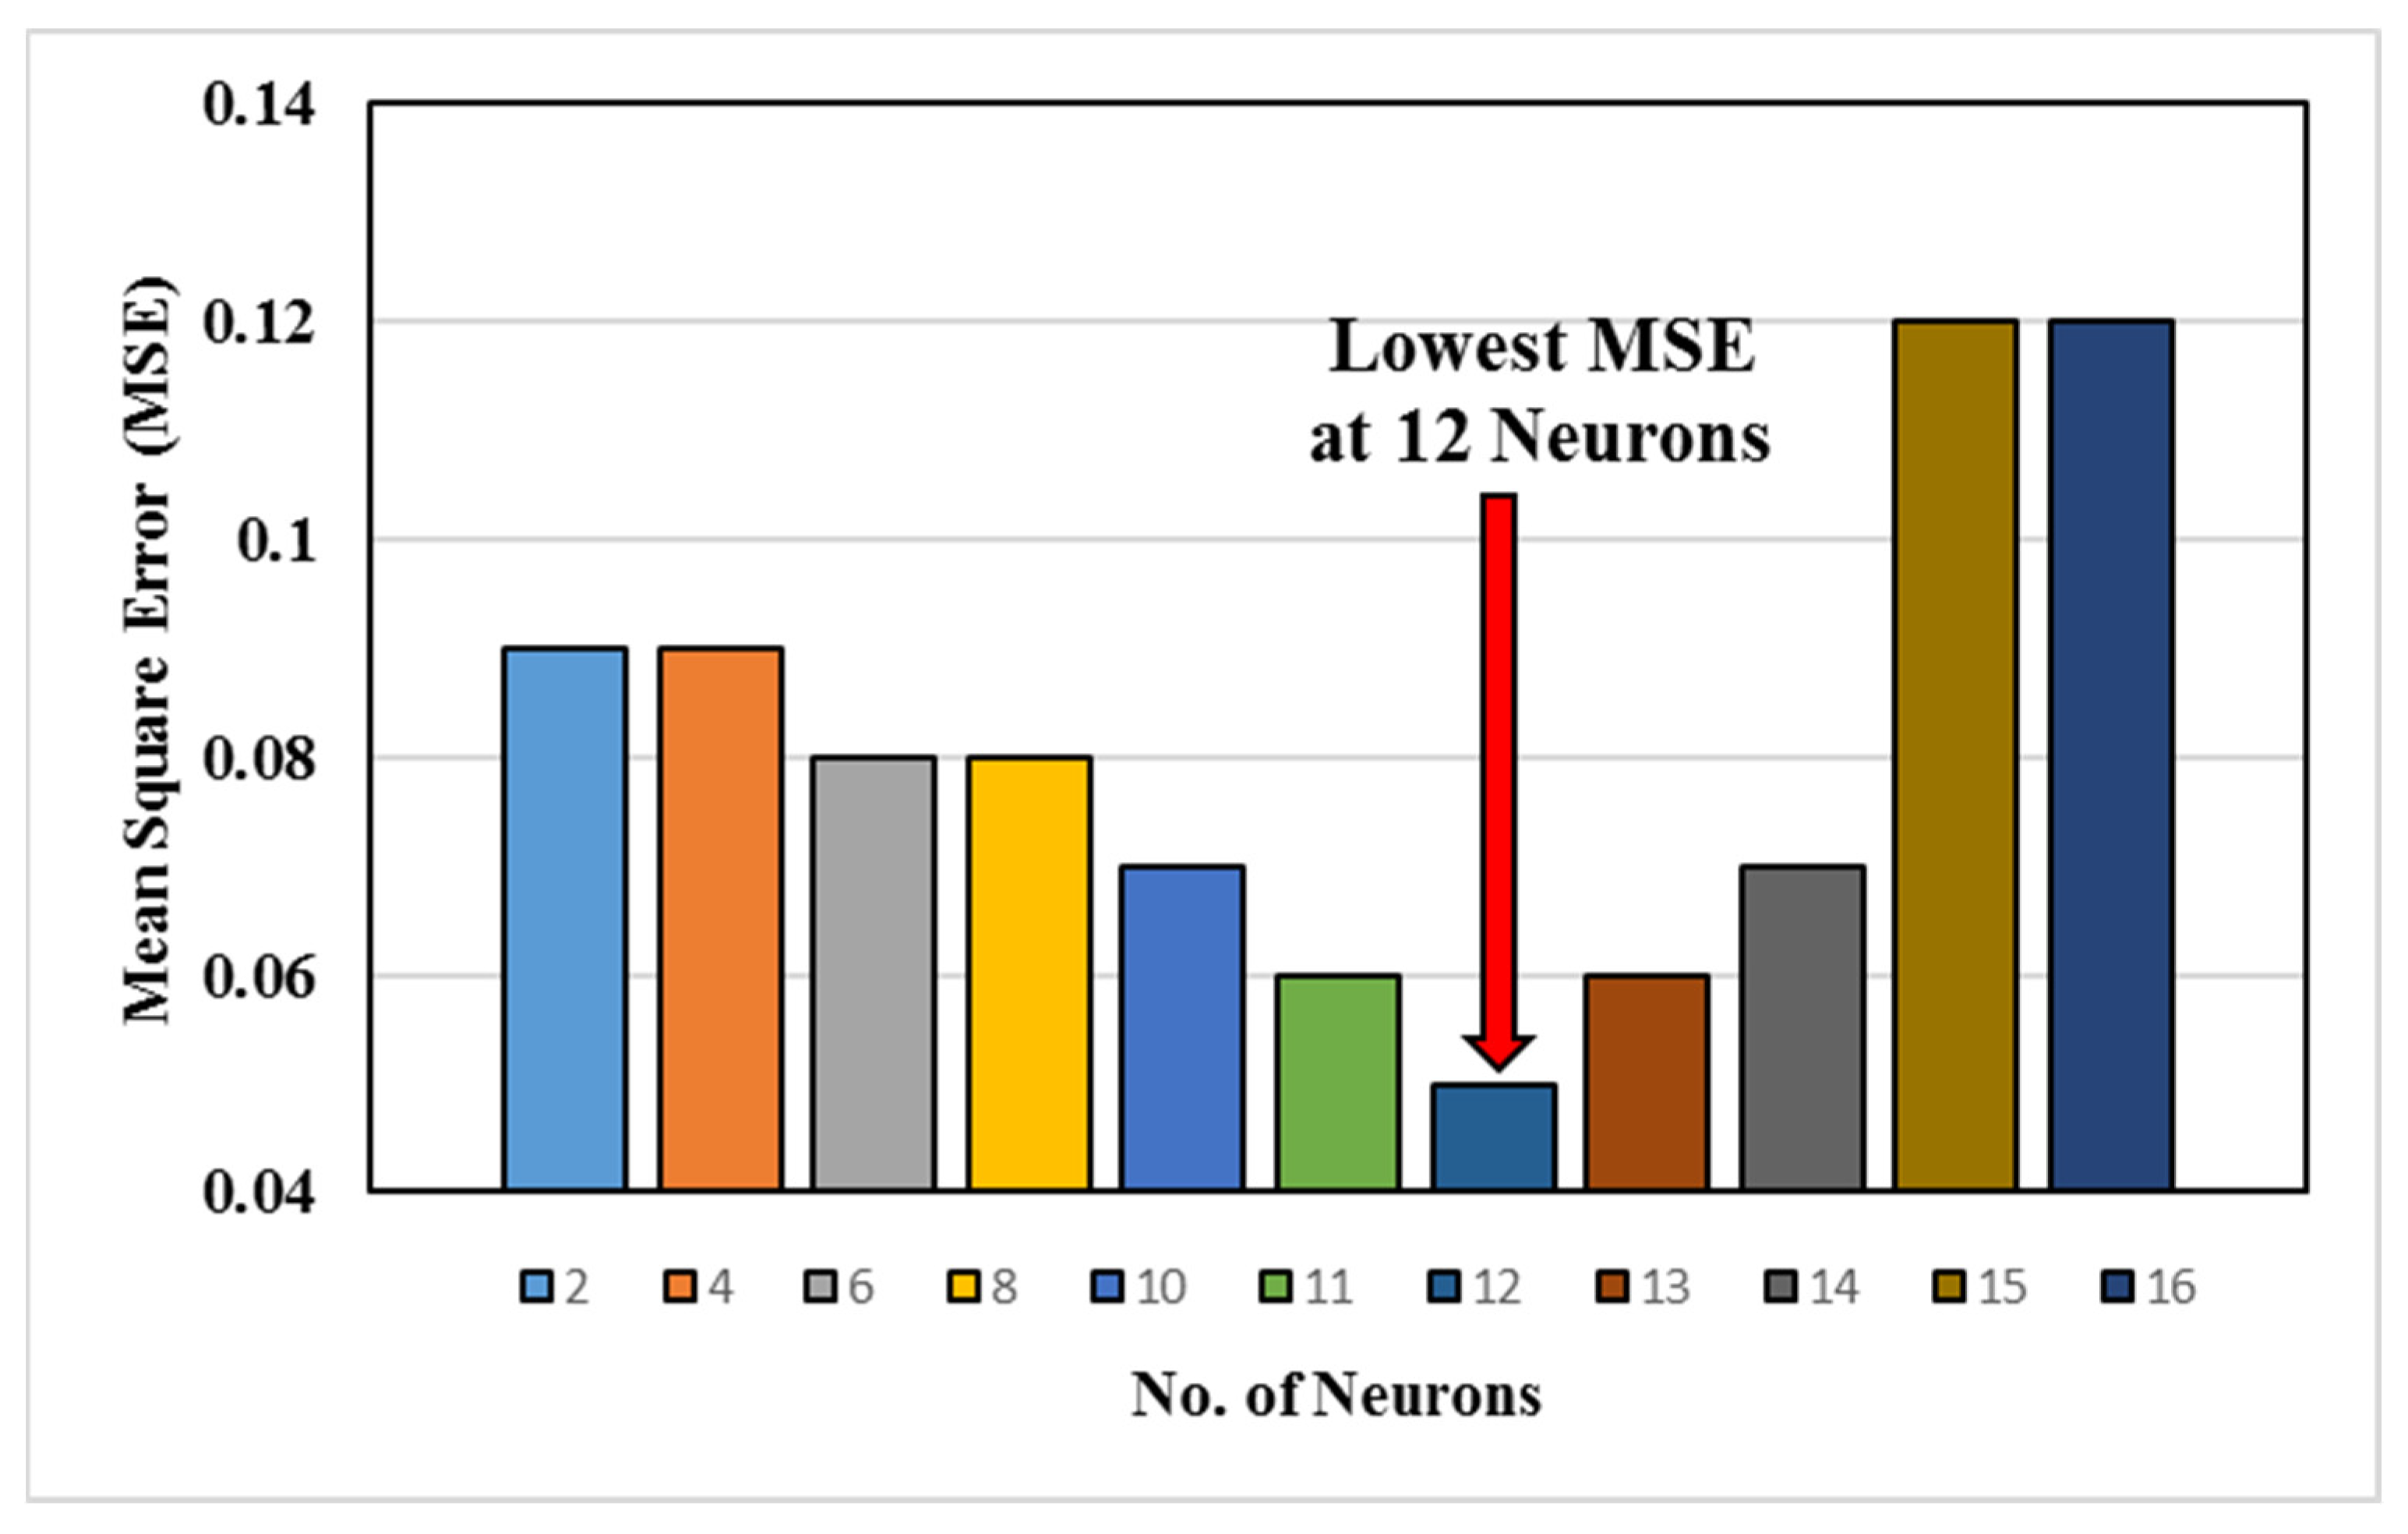
In this study, B.P. was employed with a single hidden layer, and ReLU was used as an activation function. Python and its various libraries were used to train and test the ANN model. The K-fold cross-validation technique (with 8 folds) was used to avoid overfitting the data. Furthermore, the output of the selected architecture was optimized by varying the number of neurons, keeping the limit to reduce the complexities of models. If the quantity of neurons is high in the hidden layer, more time and computational resources are utilized to generate satisfactory output.
Figure 15 shows the change in the mean square deviation with the number of neurons. The selection of 12 neurons and a single hidden layer was based on a balance between model complexity and performance. During the preliminary testing phase, we varied the number of neurons and hidden layers to identify the configuration that minimized the mean squared error (MSE) while avoiding overfitting or excessive computational cost. Figure 15 in the manuscript shows the variation in MSE with the number of neurons, where the optimal performance was observed at 12 neurons. Increasing the number of neurons beyond this point resulted in diminishing returns in accuracy while increasing computational complexity.

Figure 15.
Variation in MSE with the number of neurons.
A single hidden layer was chosen because it is sufficient to model the non-linear relationships between the input parameters (process parameters) and outputs (UTS and hardness) in this study. This is consistent with the universal approximation theorem, which states that a single hidden layer can approximate any continuous function, given sufficient neurons. Adding more layers did not significantly improve the accuracy, but increased training time and the risk of overfitting.
The training parameters used in this study are listed in Table 3. The first layer of ANN, the input layer, consists of process parameters, such as tool rotational speed, tool transverse speed, tool shoulder, pin diameter, tool offset, and tool tilt angle. The outer layer consists of UTS and hardness. When training of the defined network is completed, it is tested using well-defined test data. After the successful implementation of the training and testing, validation was performed. After successful validation, the described ANN model was used to predict the output behaviour, UTS, and hardness.
Table 3.
Model training parameters.
5.2. Prediction Using ANN
Now, 30% of the total data, which were separated for testing, are used to test the generated model separately for both UTS and hardness. Figure 16 shows the graph between actual test hardness and UTS versus the corresponding predicted (normalized) values using ANN.

Figure 16.
Graph between normalized test and predicted values of (a) hardness and (b) UTS.
5.3. Behavioural Study of Predicted UTS and Hardness
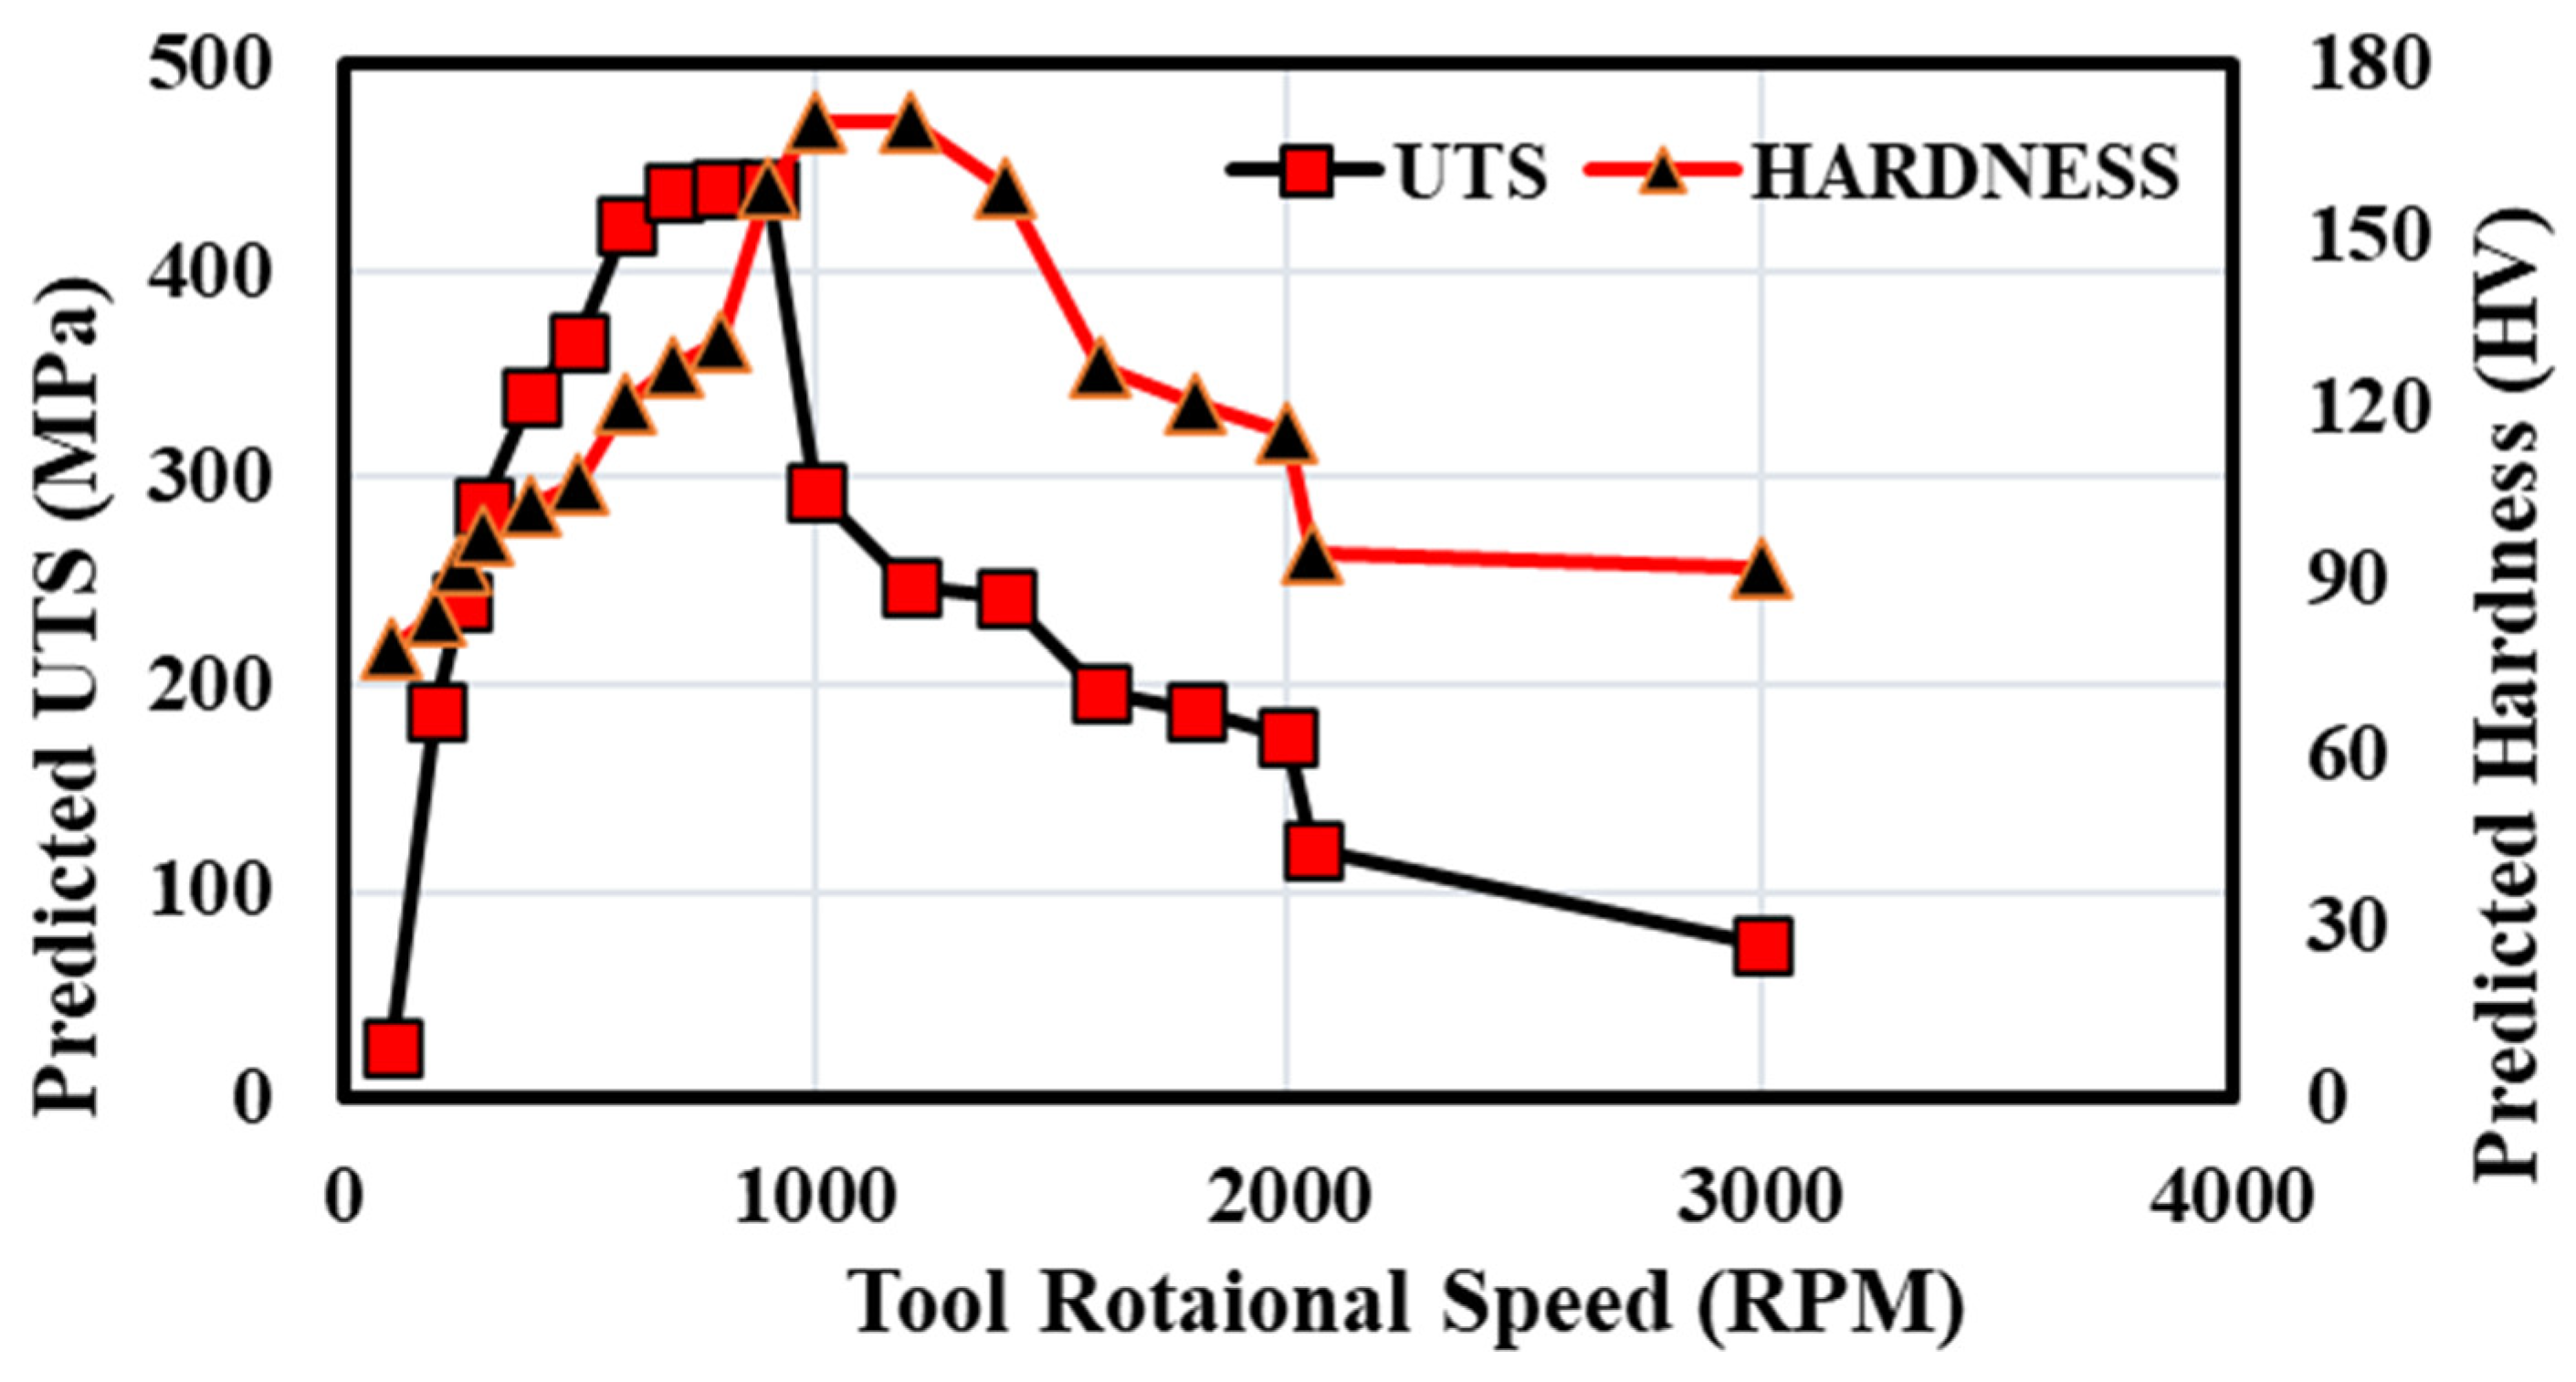
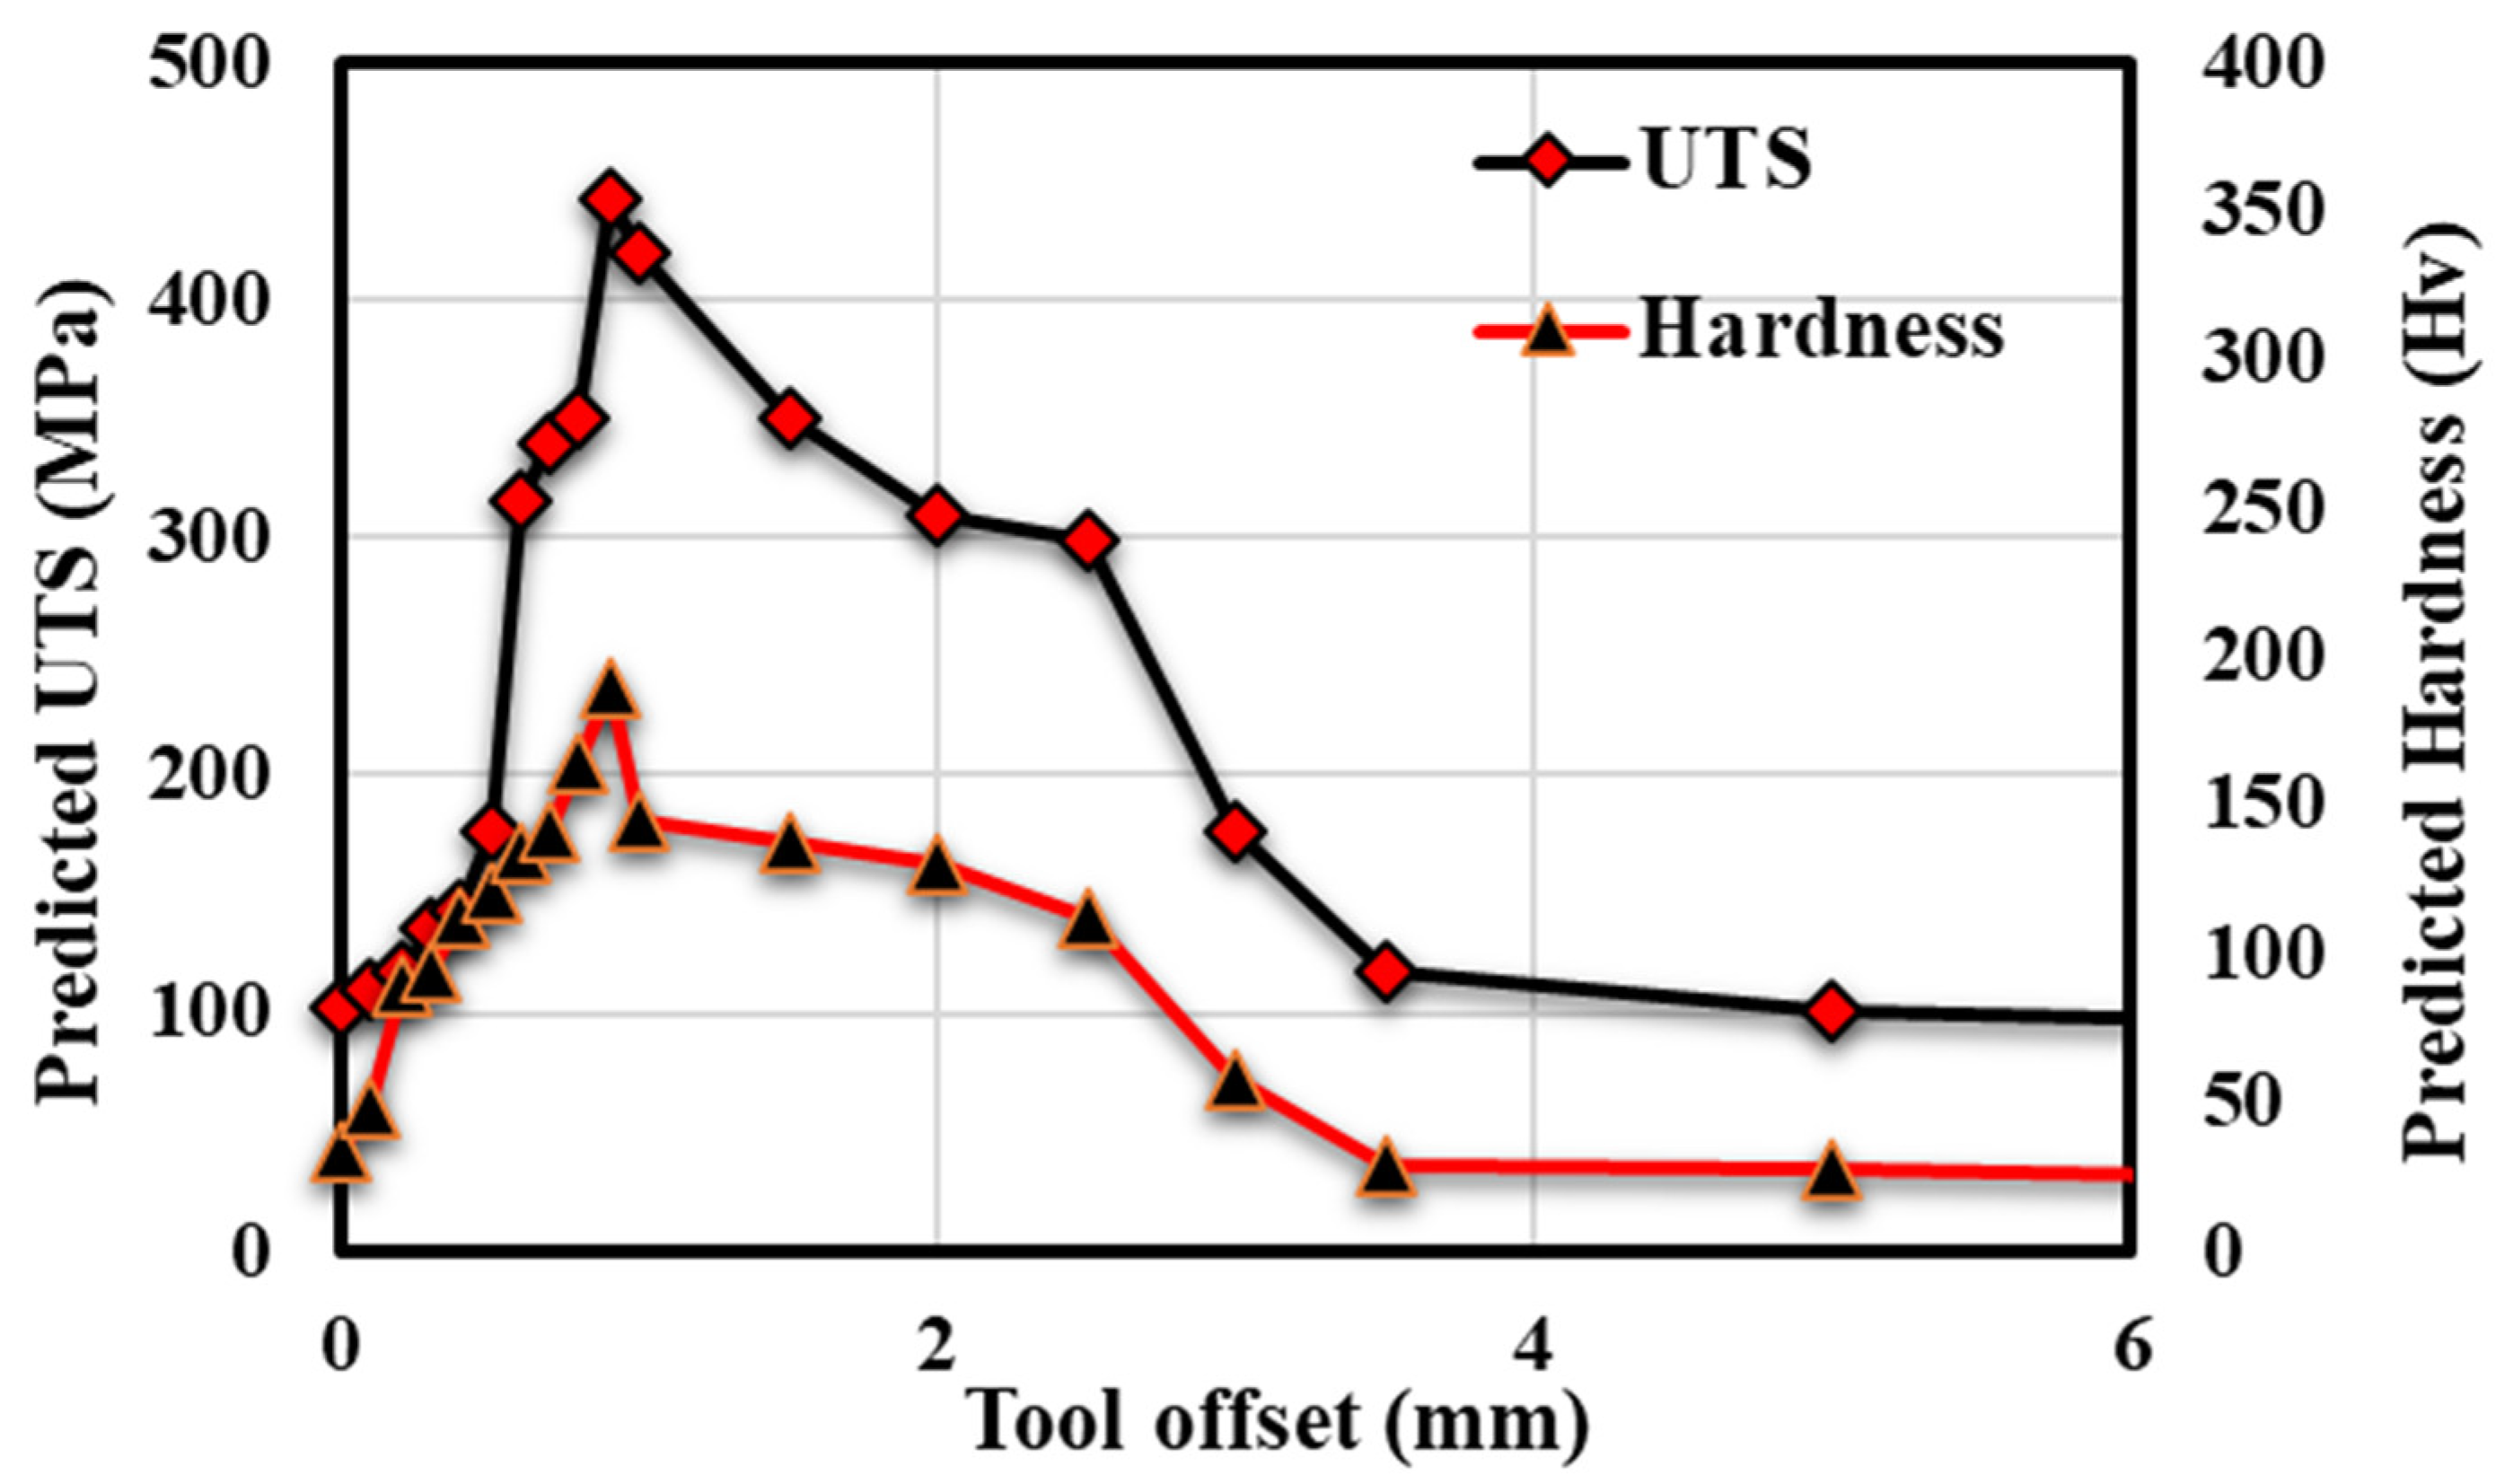
After successfully validating the ANN model, further study was carried out in the present work to predict the behaviour of UTS and the hardness of different materials relative to different process parameters. Behavioural analysis was carried out by varying one of the process parameters at a time and keeping all other parameters constant. First, UTS and hardness were predicted by varying the tool rotational speed and keeping all other parameters constant. Secondly, tool offset was used as a varying parameter, keeping all other parameters constant. Figure 17 and Figure 18 show the predicted UTS and hardness behaviour by varying tool rotational speed and tool offset and keeping all other parameters constant.

Figure 17.
Variation in predicted UTS and hardness with tool rotational speed.
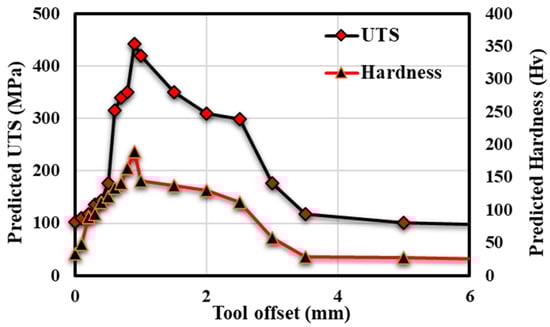
Figure 18.
Variation in predicted UTS and hardness with tool offset.
The graph shows that both the UTS and hardness reach a maximum value and then decrease to a minimum value. Firstly, the value of predicted UTS and hardness by varying the tool rotational speed and tool offset increases and attains a maximum value, and then it starts decreasing and attains a minimum value. This result is similar to some of the previous experimental work performed by various researchers; the results of those experiments show a similar trend [46,47,48,49]. During FSW, tool rotation controls heat generation or input concerning the material’s plastic flow. The tool’s rotating speed affects the amount of plastic deformation and, as a result, material mixing. Extremely high rotation speeds result in excessive heat input, which causes a variety of flaws, such as flash, porosity, voids, and wormhole development. Low welding speeds result in more heat input and are linked to problems such as tunnelling [50]. Ugender et al. [51] observed that if the FSW tool rotational speed is below 900 rpm, pores will occur due to a lack of heat input and inadequate material filling. The tunnelling flaw was discovered at a rotational speed greater than 1400 rpm due to the heat generated. Various samples of 3 mm thick AA5052-O alloy were welded using FSW at tool rotation ranging from 800 to 3000 rpm while maintaining a tool traverse speed of 120 mm/min. The joint generated at a rotational speed of 1000 rpm had a UTS of 132 MPa, which was 74% compared to the base specimen [52]. Zafar et al., in their study, show the effect of tool rotational speed on FSW of ASTM A516-70 Steel using W–25%Re Alloy Tool. As the speed increases, both hardness and UTS increase, then decrease [53].
The studies by Nidhi et al. on the FSW of aluminium and copper and Yazdipour et al. on the FSW of dissimilar Al 5083-H321 and 316L stainless steel alloy joints show that by increasing the value of tool offset, UTS and hardness first increase and then decrease [54,55]. High-strength alloys typically require more heat to plasticize under FSW. As a result, an appropriate offset is required during dissimilar FSW. Because the varying thermal conductivity of dissimilar materials causes the heat distribution to be unbalanced in FSW, it can be adjusted by adding an offset. If a sufficient amount of tool offset is applied to the softer material (i.e., towards the harder material), the tool will be able to stir both materials [56] adequately. During the joining of dissimilar materials, an optimal tool offset becomes critical. A previous study demonstrated that welding with no pin offset produces poor weld quality with various flaws [57]. Watanabe et al. [58] analyzed the effect of tool offset on joining mild steel to aluminium alloy. With a tool pin offset of 0.2 mm toward the steel side, the highest strength (UTS) was achieved. Steel particles were broken into the aluminium matrix at a higher tool pin offset. These fragments were large enough to make holes, which weakened the weld’s tensile strength. Maintaining a pin offset that is too high or too low impairs weld quality and mechanical performance.
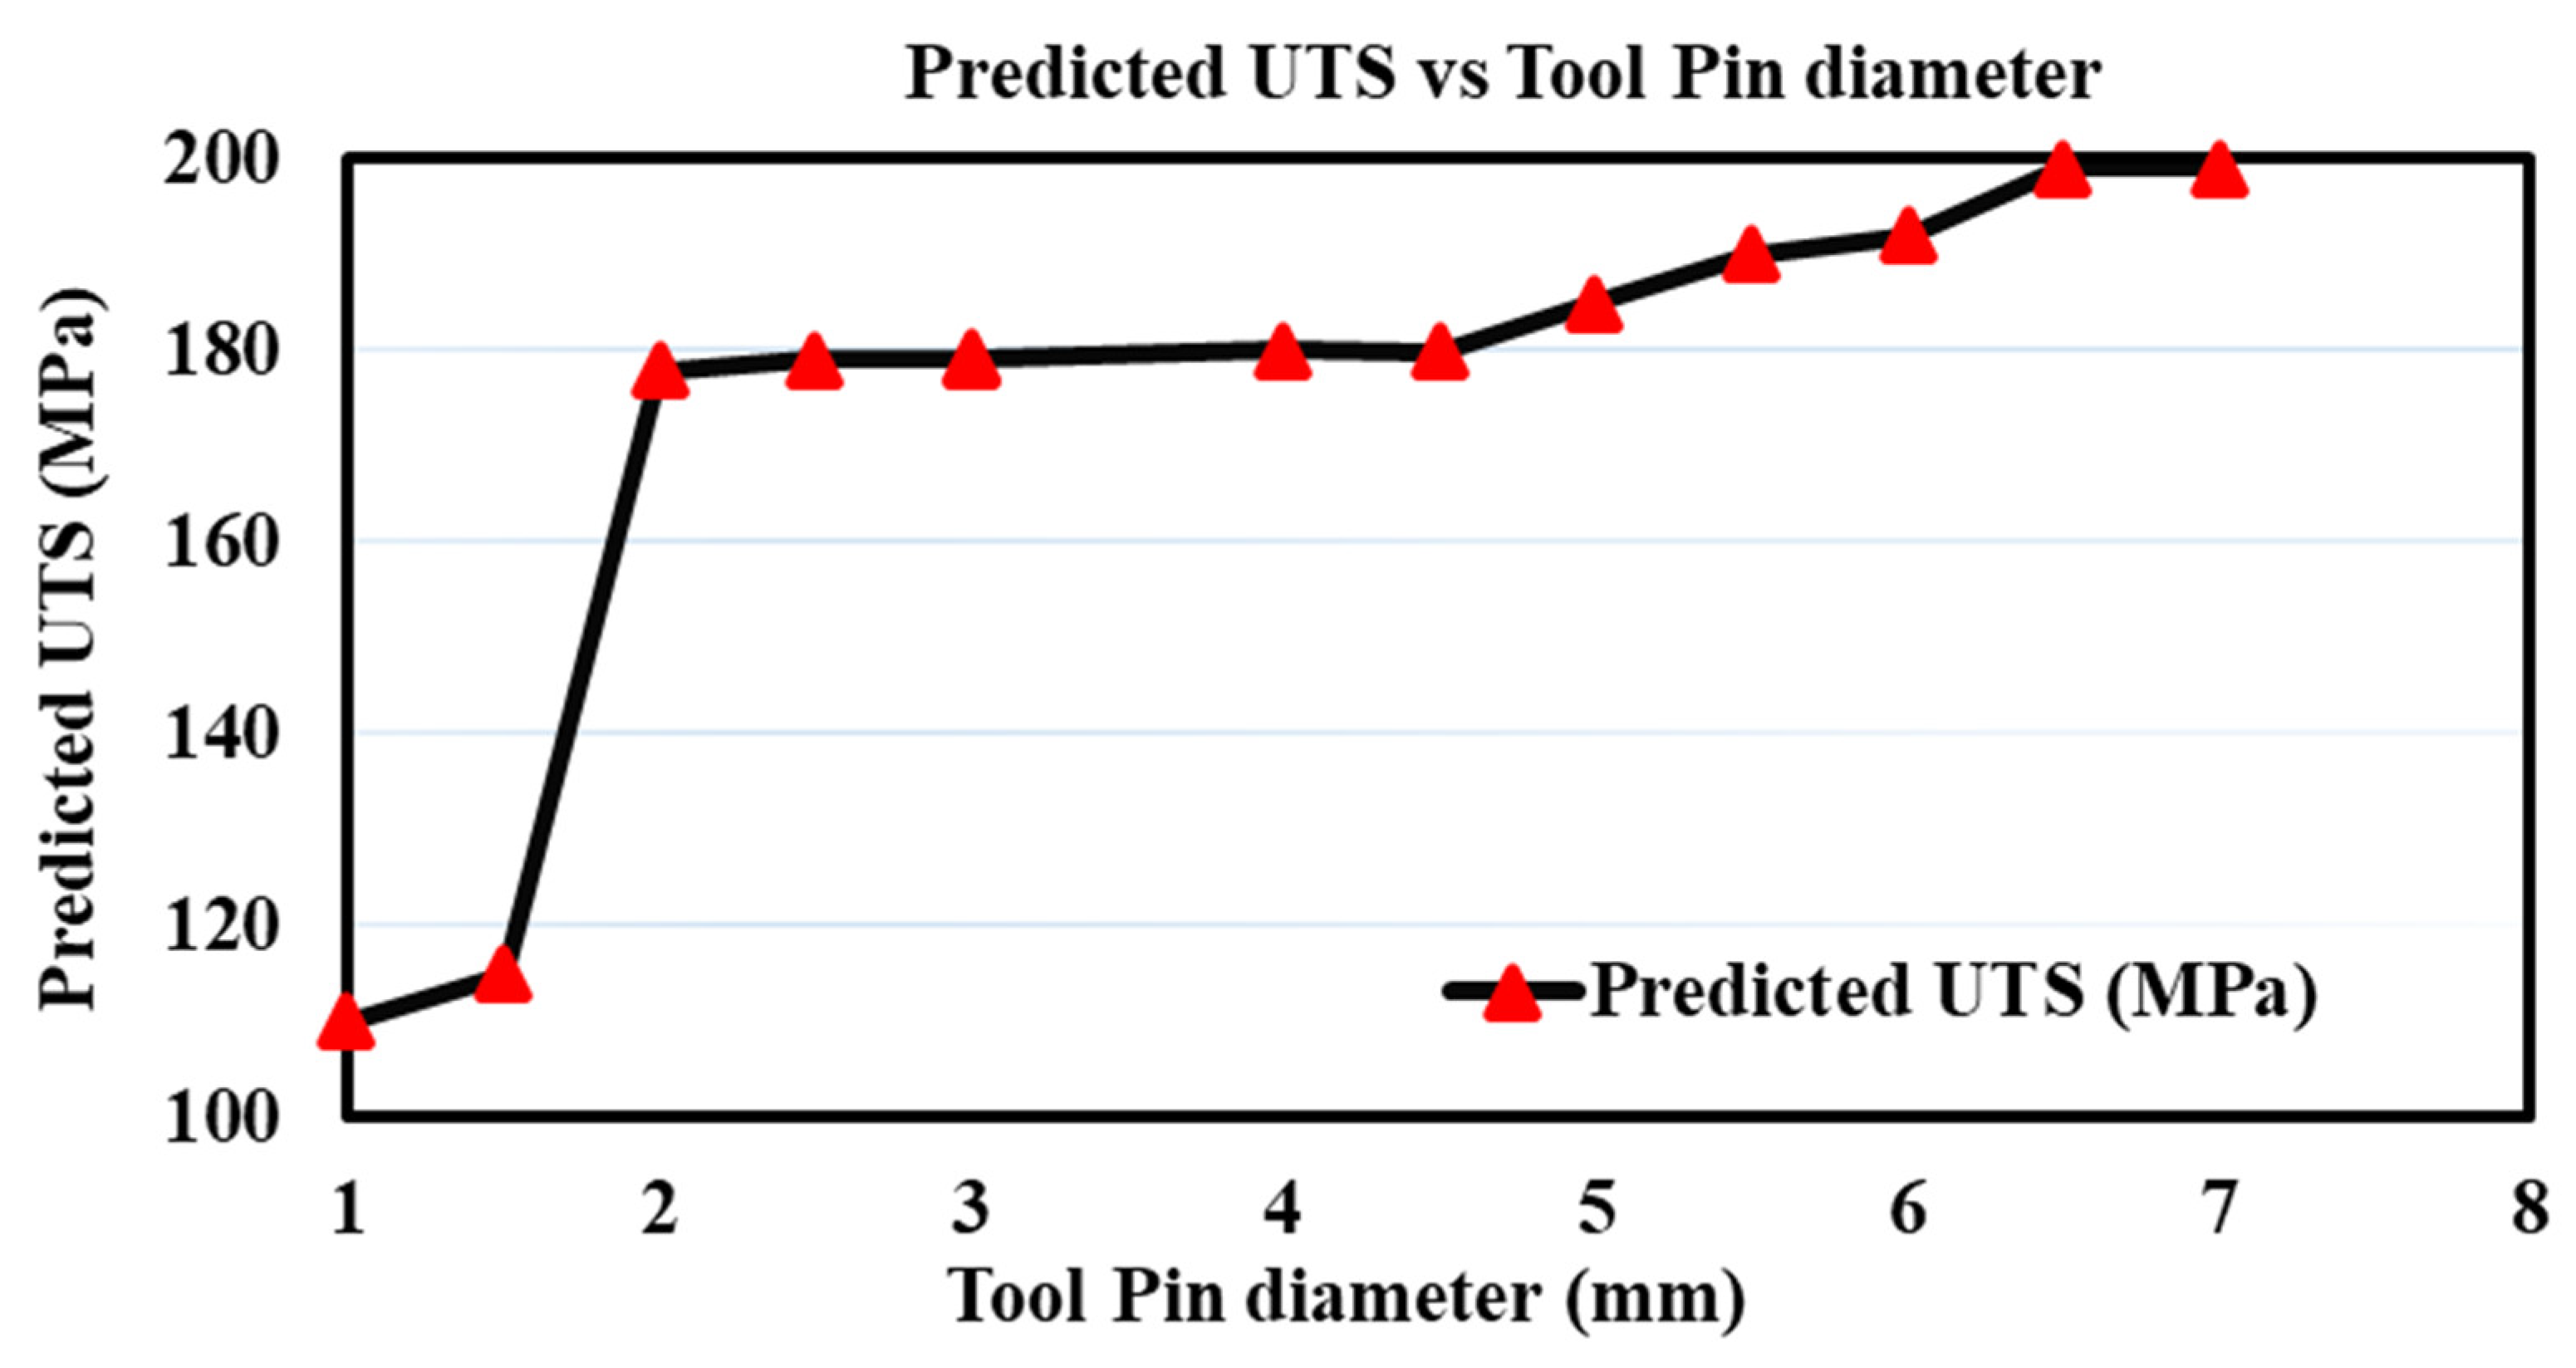
It is visible from Figure 19 that the predicted UTS is closely related to tool pin diameter (in mm). The predicted UTS increases with an increase in tool pin diameter up to a particular value, and after that, it becomes constant. This result is similar to previous work done by Jadav et al. [15] and Anganan et al. [59,60,61].
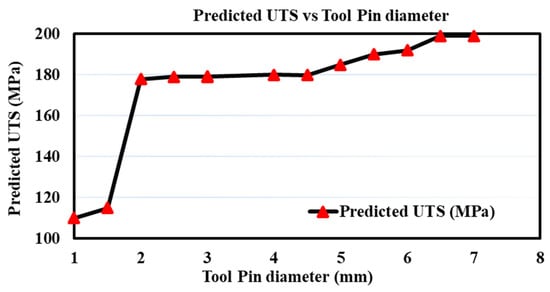
Figure 19.
Variation in predicted UTS w.r.t. tool pin diameter.
5.4. The Experimental Results Prediction and Discussion
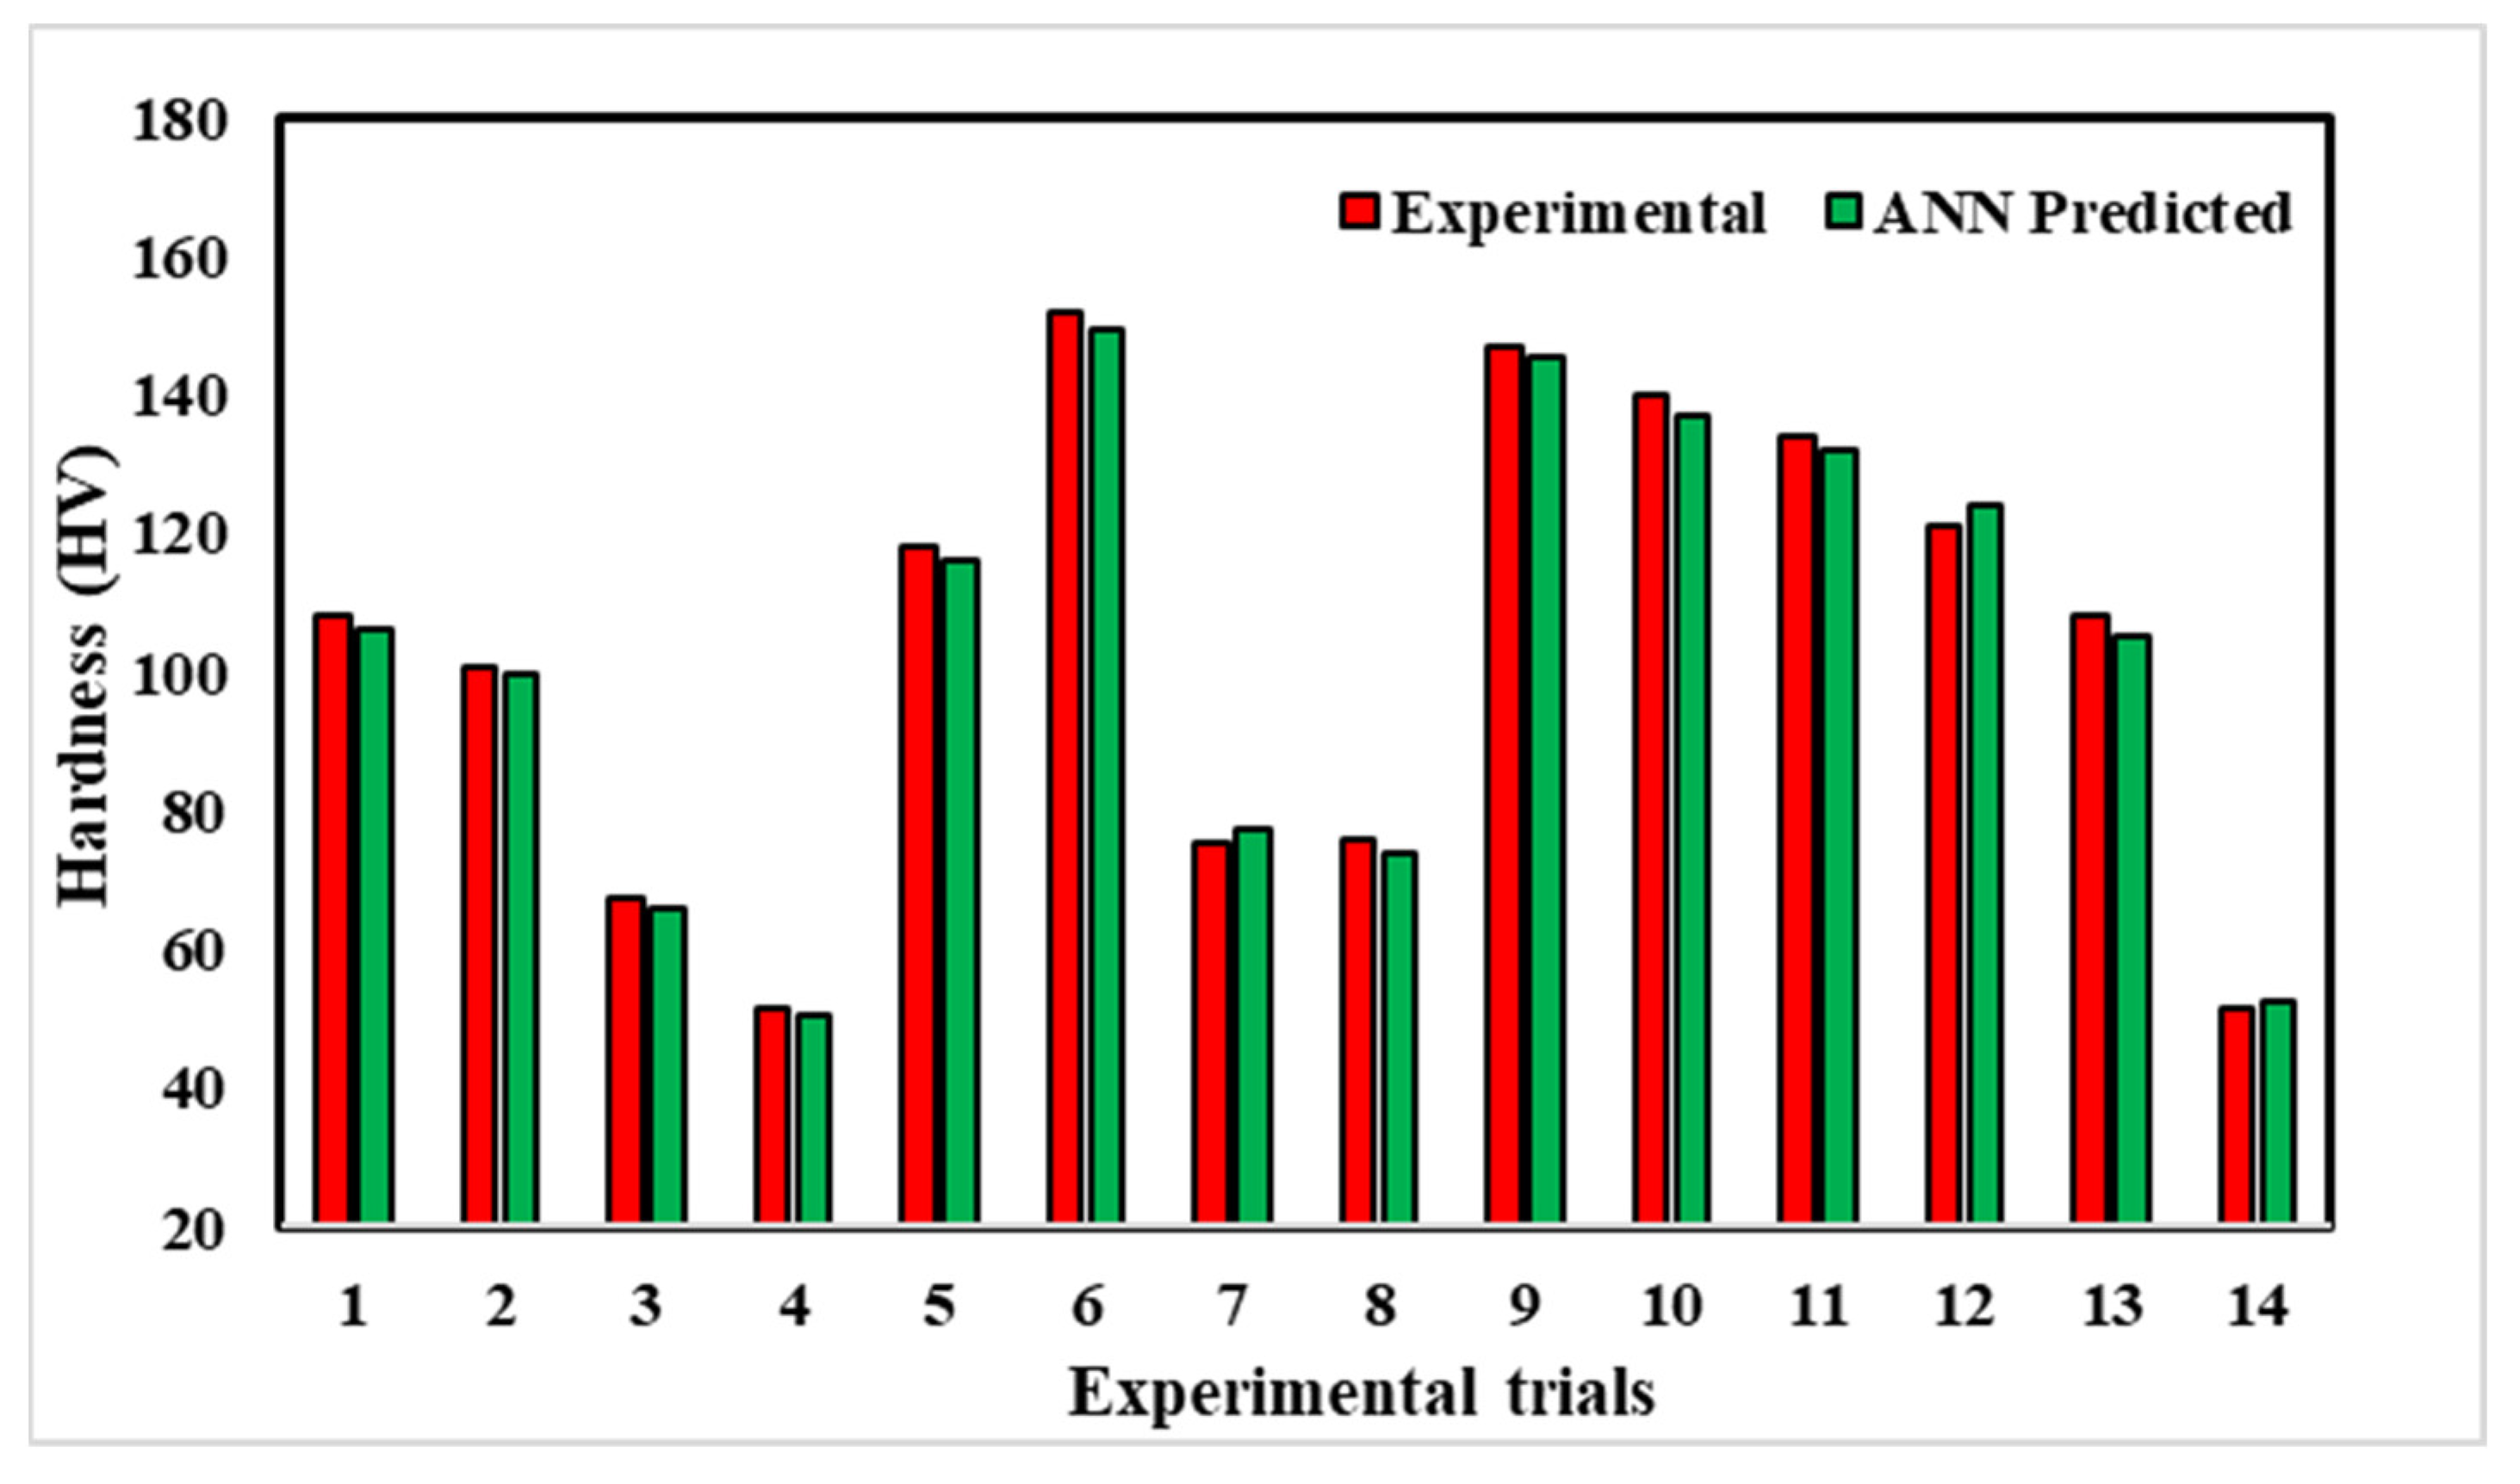
The ANN model predicted the hardness and ultimate tensile strength of the friction stir welded joints fabricated at different processing conditions, as shown in Figure 20 and Figure 21, respectively. The maximum and minimum hardness obtained is 152 HV and 51.3 HV, which differ by 1.5% and 2.3% from the value predicted by the ANN model. Furthermore, the maximum and minimum ultimate tensile strength obtained are 218 MPa and 78 MPa, which differ by 1.8% and 5.1% from the value predicted by the ANN model. Therefore, we can conclude that the experimental values agreed very well with the ANN-predicted values.
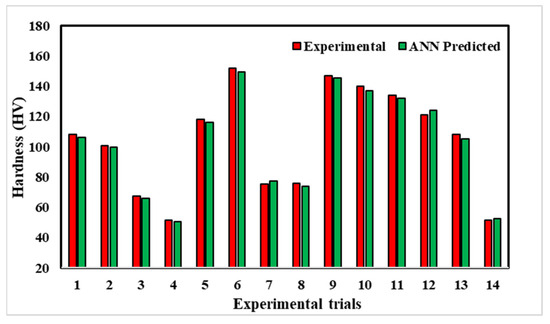
Figure 20.
Comparison between experimental and modelling results for hardness by machine learning.
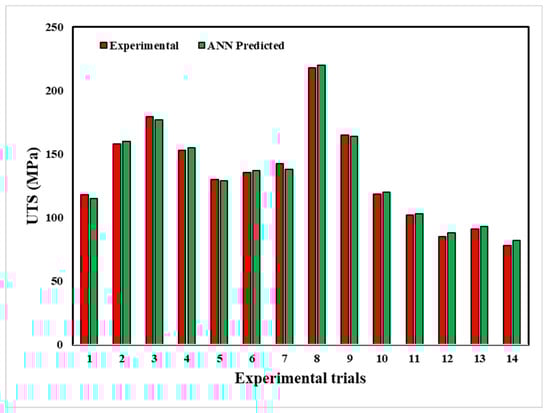
Figure 21.
Comparison between experimental and modelling results for UTS by machine learning.
The prediction results of friction stir welded joints validate that the MLP method is very capable of dealing with nonlinear complex relations in material processing and property identification with high prediction accuracy. Therefore, we can easily switch to machine learning techniques over regression analysis, which is more suitable for linear problems. Furthermore, an abundance of data on friction stir welded joints is available in the literature, which can be used as raw data to improve and optimize joint properties and efficiencies using machine learning techniques. Additionally, the proposed ANN model can be extended to other welding processes, such as laser, arc, or resistance spot welding, by adjusting the input parameters specific to these methods. Similarly, it can be trained for diverse material combinations, including non-ferrous alloys and composites, to predict properties such as UTS and hardness. This adaptability highlights the model’s potential for broader applications in advanced manufacturing scenarios, such as aerospace and biomedical components.
6. Conclusions
In this paper, we applied six machine learning models to analyze process parameters affecting output responses, such as ultimate tensile strength and hardness, for FSW joints. The key findings are as follows:
- More than 200 groups of FSW data were collected, which include tool traverse speed, tool rotational speed, pin diameter, shoulder diameter, tool offset and tool tilt.
- The artificial neural network predicts the ultimate tensile strength and hardness with maximum accuracy among all trained and tested models. The ANN model with the 6-12-1 topology showed better testing and validation capability over attempted combinations.
- With the trial and tested machine learning model, the relationship between pin diameter, tool offset, and tool rotation speed over UTS and hardness was extracted from the entire range of collected data points.
- The hardness and ultimate tensile strength of the experimental results were predicted using the ANN model. The results obtained agree with the experimental data, with a maximum error of 2.9% for hardness and 5.1% for ultimate tensile strength. Therefore, it can be concluded that synthetic prediction by machine learning modelling can be used for various FSW joints to dramatically accelerate the discovery of strong and efficient joints.
Future Research Directions
While the proposed models offer significant insights, further research is needed to enhance their applicability and reliability. Potential directions include:
- Expanding the dataset to include additional materials, joint configurations, and process conditions to improve the generalizability of the models.
- Exploring advanced machine learning techniques, such as ensemble models and deep learning architectures, for better predictive performance and feature interaction analysis.
- Investigating the influence of environmental conditions, such as temperature and humidity, on the welding process and incorporating them into predictive models.
- Integrating real-time monitoring and sensor data during the welding process for dynamic model updates and predictive maintenance.
- Applying the developed models in multi-objective optimization frameworks to simultaneously balance mechanical properties, cost, and process efficiency.
7. Practical Implications of the Findings
The developed machine learning models, particularly the ANN, provide a robust framework for understanding and predicting the effects of key process parameters on weld properties. These models can significantly aid welding design in the following ways:
- Process Optimization: By accurately predicting ultimate tensile strength (UTS) and hardness, the models help identify optimal combinations of process parameters, reducing the need for extensive trial-and-error experimentation.
- Defect Minimization: The insights derived from the models about the relationship between parameters (e.g., tool offset, rotational speed) and weld quality can guide the selection of parameter ranges to minimize defects such as voids or tunnels.
- Material Pairing: The models are particularly valuable for dissimilar material welding, where parameter selection is crucial to balance heat distribution and mechanical properties, ensuring a strong and reliable joint.
- Design for Applications: The predicted mechanical properties can inform the design of welded components tailored for specific applications, such as in the automotive and aerospace industries, where the strength-to-weight ratio and joint reliability are critical.
Author Contributions
Conceptualization, S.A.; Methodology, S.A.; Software, A.S.; Validation, A.S., M.E.K., W.A. and F.A.; Formal analysis, A.S., M.M., and A.U.K.; Resources, M.M.; Writing—original draft, S.A.; Writing—review & editing, A.U.K., M.E.K., W.A. and F.A.; Visualization, A.S.; Project administration, A.U.K.; Funding acquisition, A.U.K., M.E.K., W.A. and F.A.; Supervision, S.A.; Data Curation, M.M.; Investigation, M.M., M.E.K., W.A. and F.A. All authors have read and agreed to the published version of the manuscript.
Funding
This research was funded by Deanship of Graduate Studies and Scientific Research, Jazan University, Saudi Arabia, project number RG24-S0139.
Institutional Review Board Statement
Not applicable.
Informed Consent Statement
Not applicable.
Data Availability Statement
The original contributions presented in the study are included in the article, further inquiries can be directed to the corresponding author.
Acknowledgments
The authors gratefully acknowledge the funding of the Deanship of Graduate Studies and Scientific Research, Jazan University, Saudi Arabia, through project number: RG24-S0139.
Conflicts of Interest
The authors have no competing interests to declare that are relevant to the content of this article.
References
- Mishra, R.S.; Ma, Z.Y. Friction stir welding and processing. Mater. Sci. Eng. R Rep. 2005, 50, 1–78. [Google Scholar] [CrossRef]
- Nandan, R.; Roy, T.D.; Bhadeshia, H.K.D.H. Recent advances in friction-stir welding—Process, weldment structure and properties. Prog. Mater. Sci. 2008, 53, 980–1023. [Google Scholar] [CrossRef]
- Tan, S.; Zheng, F.; Chen, J.; Han, J.; Wu, Y.; Peng, L. Effects of process parameters on microstructure and mechanical properties of friction stir lap linear welded 6061 aluminum alloy to NZ30K magnesium alloy. J. Magnes. Alloys 2017, 5, 56–63. [Google Scholar] [CrossRef]
- Rudrapati, R. Effects of welding process conditions on friction stir welding of polymer composites: A review. Compos. Part C Open Access 2022, 8, 100269. [Google Scholar] [CrossRef]
- El-Sayed, M.M.; Shash, A.; Abd-Rabou, M.; ElSherbiny, M.G. Welding and processing of metallic materials by using friction stir technique: A review. J. Adv. Join. Process. 2021, 3, 100059. [Google Scholar] [CrossRef]
- Shehabeldeen, T.A.; Yin, Y.; Ji, X.; Shen, X.; Zhang, Z.; Zhou, J. Investigation of the microstructure, mechanical properties and fracture mechanisms of dissimilar friction stir welded aluminium/titanium joints. J. Mater. Res. Technol. 2021, 11, 507–518. [Google Scholar] [CrossRef]
- Aonuma, M.; Nakata, K. Dissimilar metal joining of ZK60 magnesium alloy and titanium by friction stir welding. Mater. Sci. Eng. B 2012, 177, 543–548. [Google Scholar] [CrossRef]
- Singh, K.; Singh, G.; Singh, H. Review on friction stir welding of magnesium alloys. J. Magnes. Alloys 2018, 6, 399–416. [Google Scholar] [CrossRef]
- Zhao, Y.-H.; Lin, S.-B.; Wu, L.; Qu, F.-X. The influence of pin geometry on bonding and mechanical properties in friction stir weld Al alloy. Mater. Lett. 2005, 59, 2948–2952. [Google Scholar] [CrossRef]
- Bisadi, H.; Rasaee, S.; Farahmand, M. Effects of pin shape on the tool plunge stage in friction stir welding. Trans. Indian Inst. Met. 2014, 67, 989–995. [Google Scholar] [CrossRef]
- Kanemaru, S.; Sasaki, T.; Sato, T.; Mishima, H.; Tashiro, S.; Tanaka, M. Study for TIG-MIG hybrid welding process. Weld World 2014, 58, 11–18. [Google Scholar] [CrossRef]
- Liu, H.J.; Fujii, H.; Maeda, M.; Nogi, K. Mechanical properties of friction stir welded joints of 1050—H24 aluminium alloy. Sci. Technol. Weld. Join. 2003, 8, 450–454. [Google Scholar] [CrossRef]
- Fu, B.; Qin, G.; Li, F.; Meng, X.; Zhang, J.; Wu, C. Friction stir welding process of dissimilar metals of 6061-T6 aluminum alloy to AZ31B magnesium alloy. J. Mech. Work. Technol. 2015, 218, 38–47. [Google Scholar] [CrossRef]
- Sahu, P.K.; Pal, S.; Pal, S.K.; Jain, R. Influence of plate position, tool offset and tool rotational speed on mechanical properties and microstructures of dissimilar Al/Cu friction stir welding joints. J. Mater. Process. Technol. 2016, 235, 55–67. [Google Scholar] [CrossRef]
- Watanabe, T.; Takayama, H.; Yanagisawa, A. Joining of aluminium alloy to steel by friction stir welding. J. Mater. Process. Technol. 2006, 178, 342–349. [Google Scholar] [CrossRef]
- Suresha, C.N.; Rajaprakash, B.M.; Upadhya, S. A study of the effect of tool pin profiles on tensile strength of welded joints produced using friction stir welding process. Mater. Manuf. Process. 2011, 26, 1111–1116. [Google Scholar] [CrossRef]
- Javadi, Y.; Sadeghi, S.; Najafabadi, M.A. Taguchi optimization and ultrasonic measurement of residual stresses in the friction stir welding. Mater. Des. 2014, 55, 27–34. [Google Scholar] [CrossRef]
- Sarsılmaz, F.; C¸aydas, U. Statistical analysis on mechanical properties of friction-stir-welded AA 1050/AA 5083 couples. Int. J. Adv. Manuf. Technol. 2009, 43, 248–255. [Google Scholar] [CrossRef]
- Amiri, N.; Farrahi, G.; Kashyzadeh, K.R.; Chizari, M. Applications of ultrasonic testing and machine learning methods to predict the static & fatigue behavior of spot-welded joints. J. Manuf. Process. 2020, 52, 26–34. [Google Scholar]
- Okuyucu, H.; Kurt, A.; Arcaklioglu, E. Artificial neural network application to the friction stir welding of aluminum plates. Mater. Des. 2007, 28, 78–84. [Google Scholar] [CrossRef]
- Salhan, P.; Singh, R.; Jain, P.; Butola, R. Prediction of heat generation and microstructure of AA7075 friction stir welding using ANN: Effect of process parameters. Manuf. Lett. 2022, 32, 5–9. [Google Scholar] [CrossRef]
- Shehabeldeen, T.A.; Elaziz, M.A.; Elsheikh, A.H.; Zhou, J. Modeling of friction stir welding process using adaptive neuro-fuzzy inference system integrated with harris hawks optimizer. J. Mater. Res. Technol. 2019, 8, 5882–5892. [Google Scholar] [CrossRef]
- Dewan, M.W.; Huggett, D.J.; Liao, T.W.; Wahab, M.A.; Okeil, A.M. Prediction of tensile strength of friction stir weld joints with adaptive neuro-fuzzy inference system (ANFIS) and neural network. Mater. Des. 2016, 92, 288–299. [Google Scholar] [CrossRef]
- Sahu, P.K.; Pal, S. Multi-response optimization of process parameters in friction stir welded AM20 magnesium alloy by Taguchi grey relational analysis. J. Magnes. Alloys 2015, 3, 36–46. [Google Scholar] [CrossRef]
- Erdem, M. Investigation of structure and mechanical properties of copper-brass plates joined by friction stir welding. Int. J. Adv. Manuf. Technol. 2015, 76, 1583–1592. [Google Scholar] [CrossRef]
- Goel, P.; Khan, N.Z.; Khan, Z.A.; Ahmari, A.; Gangil, N.; Abidi, M.H.; Siddiquee, A.N. Investigation on material mixing during FSW of AA7475 to AISI304. Mater. Manuf. Process. 2019, 34, 192–200. [Google Scholar] [CrossRef]
- Al-Roubaiy, A.O.; Nabat, S.M.; Batako, A.D.L. Experimental and theoretical analysis of friction stir welding of Al–Cu joints. Int. J. Adv. Manuf. Technol. 2014, 71, 1631–1642. [Google Scholar] [CrossRef]
- Singh, S.H.; Mahmeen, M. Effect of tool pin offset on the mechanical properties of dissimilar materials based on friction stir welding (FSW). Int. J. Mod. Trends Eng. Res. 2016, 3, 75–80. [Google Scholar]
- Raturi, M.; Garg, A.; Bhattacharya, A. Joint strength and failure studies of dissimilar AA6061-AA7075 friction stir welds: Effects of tool pin, process parameters and preheating. Eng. Fail. Anal. 2019, 96, 570–588. [Google Scholar] [CrossRef]
- Meran, C. The joint properties of brass plates by friction stir welding. Mater. Des. 2006, 27, 719–726. [Google Scholar] [CrossRef]
- Mehta, K.P.; Badheka, V.J. Influence of tool design and process parameters on dissimilar friction stir welding of copper to AA6061-T651 joints. Int. J. Adv. Manuf. Technol. 2015, 80, 2073–2082. [Google Scholar] [CrossRef]
- Heidarzadeh, A. Tensile behavior, microstructure, and substructure of the friction stir welded 70/30 brass joints: RSM, EBSD, and TEM study. Arch. Civ. Mech. Eng. 2019, 19, 137–146. [Google Scholar] [CrossRef]
- Kimapong, K.; Watanabe, T. Friction stir welding of aluminum alloy to steel. Weld. J. 2004, 83, 277–282. [Google Scholar]
- Jagathesh, K.; Jenarthanan, M.; Babu, P.D.; Chanakyan, C. Analysis of factors influencing tensile strength in dissimilar welds of AA2024 and AA6061 produced by Friction Stir Welding (FSW). Aust. J. Mech. Eng. 2017, 15, 19–26. [Google Scholar] [CrossRef]
- Dash, K.; Ray, B.; Chaira, D. Synthesis and characterization of copper–alumina metal matrix composite by conventional and spark plasma sintering. J. Alloys Compd. 2012, 516, 78–84. [Google Scholar] [CrossRef]
- Singh, R.; Sharma, C.; Dwivedi, D.; Mehta, N.; Kumar, P. The microstructure and mechanical properties of friction stir welded Al–Zn–Mg alloy in as welded and heat treated conditions. Mater. Des. 2011, 32, 682–687. [Google Scholar] [CrossRef]
- Kaushik, P.; Dwivedi, D.K. Effect of tool geometry in dissimilar Al-Steel Friction Stir Welding. J. Manuf. Process. 2021, 68, 198–208. [Google Scholar] [CrossRef]
- Chao, Y.J.; Wang, Y.; Miller, K.W. Effect of friction stir welding on dynamic properties of AA2024-T3 and AA7075-T7351. Weld. J. 2001, 80, 196–200. [Google Scholar]
- Amini, S.; Amiri, M.R.; Barani, A. Investigation of the effect of tool geometry on friction stir welding of 5083-O aluminum alloy. Int. J. Adv. Manuf. Technol. 2015, 76, 255–261. [Google Scholar] [CrossRef]
- Bhandari, U.; Rafi, R.; Zhang, C.; Yang, S. Yield strength prediction of high-entropy alloys using machine learning. Mater. Today Commun. 2021, 26, 101871. [Google Scholar] [CrossRef]
- Ghetiya, N.; Patel, K. Prediction of Tensile Strength in Friction Stir Welded Aluminium Alloy Using Artificial Neural Network. Procedia Technol. 2014, 14, 274–281. [Google Scholar] [CrossRef]
- Liu, Y.; Zhao, T.; Ju, W.; Shi, S. Materials discovery and design using machine learning. J. Mater. 2017, 3, 159–177. [Google Scholar] [CrossRef]
- Méneroux, Y.; Le Guilcher, A.; Pierre, G.S.; Hamed, M.G.; Mustière, S.; Orfila, O. Traffic signal detection from in-vehicle GPS speed profiles using functional data analysis and machine learning. Int. J. Data Sci. Anal. 2019, 10, 101–119. [Google Scholar] [CrossRef]
- Caggiano, A.; Zhang, J.; Alfieri, V.; Caiazzo, F.; Gao, R.; Teti, R. Machine learning-based image processing for on-line defect recognition in additive manufacturing. CIRP Ann. 2019, 68, 451–454. [Google Scholar] [CrossRef]
- Liu, J.; Chang, H.; Hsu, T.; Ruan, X. Prediction of the flow stress of high-speed steel during hot deformation using a BP artificial neural network. J. Mech. Work. Technol. 2000, 103, 200–205. [Google Scholar] [CrossRef]
- Kanti, K.M.; Rao, P.S. Prediction of bead geometry in pulsed GMA welding using back propagation neural network. J. Mech. Work. Technol. 2008, 200, 300–305. [Google Scholar]
- Hwang, Y.; Fan, P.; Lin, C. Experimental study on Friction Stir Welding of copper metals. J. Mech. Work. Technol. 2010, 210, 1667–1672. [Google Scholar] [CrossRef]
- Zheng, H.; Cheng, Y.; Gou, B.; Frank, D.; Bern, A.; Muston, W. Impact of automatic switches on power distribution system reliability. Electr. Power Syst. Res. 2011, 83, 51–57. [Google Scholar] [CrossRef]
- Tansel, I.N.; Demetgul, M.; Okuyucu, H.; Yapici, A. Optimizations of friction stir welding of aluminum alloy by using genetically optimized neural network. Int. J. Adv. Manuf. Technol. 2009, 48, 95–101. [Google Scholar] [CrossRef]
- Chen, T. Process parameters study on FSW joint of dissimilar metals for aluminum–steel. J. Mater. Sci. 2009, 44, 2573–2580. [Google Scholar] [CrossRef]
- bin Muhamad, M.R.; Raja, S.; Jamaludin, M.F.; Yusof, F.; Morisada, Y.; Suga, T.; Fujii, H. Enhancements on Dissimilar Friction Stir Welding Between AZ31 and SPHC Mild Steel With Al–Mg as Powder Additives. J. Manuf. Sci. Eng. 2021, 143, 1–22. [Google Scholar] [CrossRef]
- Singarapu, U.; Adepu, K.; Arumalle, S.R. Influence of tool material and rotational speed on mechanical properties of friction stir welded AZ31B magnesium alloy. J. Magnes. Alloys 2015, 3, 335–344. [Google Scholar] [CrossRef]
- Moshwan, R.; Yusof, F.; Hassan, M.A.; Rahmat, S.M. Effect of tool rotational speed on force generation, microstructure and mechanical properties of friction stir welded Al–Mg–Cr–Mn (AA 5052-O) alloy. Mater. Des. (1980–2015) 2015, 66, 118–128. [Google Scholar] [CrossRef]
- Iqbal, Z.; Bazoune, A.; Al-Badour, F.; Shuaib, A.; Merah, N. Effect of Tool Rotational Speed on Friction Stir Welding of ASTM A516-70 Steel Using W–25%Re Alloy Tool. Arab. J. Sci. Eng. 2019, 44, 1233–1242. [Google Scholar] [CrossRef]
- Sharma, N.; Khan, Z.A.; Siddiquee, A.N. Friction stir welding of aluminum to copper—An overview. Trans. Nonferrous Met. Soc. China 2017, 27, 2113–2136. [Google Scholar] [CrossRef]
- Yazdipour, A.; Heidarzadeh, A. Effect of friction stir welding on microstructure and mechanical properties of dissimilar Al 5083-H321 and 316L stainless steel alloy joints. J. Alloys Compd. 2016, 680, 595–603. [Google Scholar] [CrossRef]
- Khan, N.Z.; Siddiquee, A.N.; Khan, Z.A.; Shihab, S.K. Investigations on tunneling and kissing bond defects in FSW joints for dissimilar aluminum alloys. J. Alloys Compd. 2015, 648, 360–367. [Google Scholar] [CrossRef]
- Ouyang, J.; Yarrapareddy, E.; Kovacevic, R. Microstructural evolution in the friction stir welded 6061 aluminum alloy (T6-temper condition) to copper. J. Mech. Work. Technol. 2006, 172, 110–122. [Google Scholar] [CrossRef]
- Jadav, H.H.; Badheka, V.; Sharma, D.K.; Upadhyay, G. Effect of pin diameter and different cooling media on friction stir welding of dissimilar Al-Mg alloys. Mater. Today Proc. 2021, 42 Pt 2, 362–369. [Google Scholar] [CrossRef]
- Hernández-Acosta, M.; Martines-Arano, H.; Soto-Ruvalcaba, L.; Martínez-González, C.; Martínez-Gutiérrez, H.; Torres-Torres, C. Fractional thermal transport and twisted light induced by an optical two-wave mixing in single-wall carbon nanotubes. Int. J. Therm. Sci. 2019, 147, 106136. [Google Scholar] [CrossRef]
- Chadha, U.; Selvaraj, S.K.; Gunreddy, N.; Babu, S.S.; Mishra, S.; Padala, D.; Shashank, M.; Mathew, R.M.; Kishore, S.R.; Panigrahi, S.; et al. A survey of machine learning in friction stir welding, including unresolved issues and future research directions. Mater. Des. Process. Commun. 2022, 2022, 2568347. [Google Scholar] [CrossRef]


Disclaimer/Publisher’s Note: The statements, opinions and data contained in all publications are solely those of the individual author(s) and contributor(s) and not of MDPI and/or the editor(s). MDPI and/or the editor(s) disclaim responsibility for any injury to people or property resulting from any ideas, methods, instructions or products referred to in the content. |
© 2024 by the authors. Licensee MDPI, Basel, Switzerland. This article is an open access article distributed under the terms and conditions of the Creative Commons Attribution (CC BY) license (https://creativecommons.org/licenses/by/4.0/).