Abstract
The influence of dispersed ZrO2 particles on the microstructure evolution and the superconducting properties of a Nb-Ti alloy was investigated. The studied materials were prepared by different methods including mechanical alloying (MA) and arc-melting. The obtained samples were studied by X-ray diffraction (XRD) and vibrating-sample magnetometer (VSM). It was found that ZrO2 particles can be successively introduced into an Fe-Nb matrix by MA. However, among all prepared samples with a nominal composition of Nb-47wt%Ti-5 wt% ZrO2, only the powders, which were prepared by MA of Nb-47wt%Ti and ZrO2 powders, exhibit superconductivity with critical parameters comparable to those observed in pristine Nb-47wt%Ti alloy. In particular, the determined upper critical field at 0 K is close to 15.6(1) T. This value is slightly higher than 15.3(3) T obtained for Nb-47wt%Ti and it can be ascribed to the presence of introduced ZrO2 particles in the Nb-Ti matrix.
1. Introduction
Oxide dispersion strengthening (ODS) is a method of improving the mechanical strength of certain materials by homogenously distributing thermally stable nano-sized oxides (i.e., Y2O3, ZrO2, SiO2, TiO2, Y2Ti2O7) in the matrix [1]. The fine dispersed particles can significantly reduce the motion of grain boundaries and dislocations, stabilize the microstructure at elevated temperature and increase the tensile and creep strength [2,3,4]. Since ODS alloys can withstand the extreme conditions, they are considered as high-performance structural materials for safe and sustainable use in gas turbine engines, hydrogen combustion power plants, advanced fusion and fission reactors. For that reason, in previous decades, ODS alloys have been intensively studied by experimental and theoretical methods of physics, chemistry, and material science [1,5,6].
ODS alloys are commonly fabricated by powder metallurgy methods, involving mechanical alloying (MA), which is a ball milling process where a powder mixture placed in the ball mill is subjected to high energy collision from the balls [7]. The technique of MA was originally developed by J. Benjamin to produce ODS superalloys in the middle of 1960s [7,8]. Today, MA is a well-known technique for synthesizing new materials including supersaturated solid solutions, metallic glasses, nanocrystalline materials, and high-entropy alloys [9].
In 2021, Mousavi et al. reported the investigation of dispersion of Y2O3 particles into the Nb-Ti superconductor using a processing strategy based on the ODS concept [10]. For the first time, the ODS material was prepared not to enhance its mechanical properties but in order to stabilize a superconducting state in the system. Following this idea, in this work, we present the study of influence of dispersed ZrO2 particles on microstructure evolution and superconducting properties of Nb-Ti alloy. The investigated materials were prepared by different methods including MA and arc-melting. The obtained samples were studied by X-ray diffraction (XRD) and vibrating-sample magnetometer (VSM) to characterize their phase composition and superconducting properties after each step of synthesis.
2. Materials and Methods
The samples with a nominal composition of Nb-47wt%Ti-5 wt% ZrO2 were prepared using MA in two series, powders A and B, and an additional sample C was prepared by arc-melting method. In the case of powders A, the mixture of Nb (99.99%, ∼325 mesh, Alfa Aesar, Heysham, UK), Ti (99.99%, ∼325 mesh, Alfa Aesar) and ZrO2 (99.99%, Sigma–Aldrich, Burlington, MA, USA) powders was placed in the grinding bowl with 25 grinding balls. The bowl and balls were made of hardened stainless steel. To avoid any contamination, the bowl was filled with argon. The milling was carried out at 430 rpm for effective times up to h. In the case of powders B, the Nb-Ti alloy was firstly prepared in an arc furnace using Nb sponges (99.8%, Thermal Scientific, Waltham, MA, USA) and Ti sponges (99.99%, Johnson Matthey, London, UK). In the next step, the obtained ingot was pulverised into fine powder and mixed with ZrO2 powder (99.99%, Sigma–Aldrich) before MA. Finally, the synthesis of sample C was conducted using an arc furnace using the same substrates as for powders B. The 1 g ingot of material was remelted four times to improve its homogeneity. The furnace chamber was filled with argon and pure titanium getter was melted before each melting of alloy ingot to purge the argon atmosphere of residual oxygen and nitrogen. After complete synthesis, the total weight loss of the obtained material did not exceed 0.2%.
The phase composition of the prepared materials was verified by powder X-ray diffraction (XRD) using a PANalytical X’pert Pro diffractometer with Cu K radiation ( Å, Å). The measurements were carried out at room temperature. The experimental XRD patterns were analyzed with the FULLPROF software based on the Rietveld method [11,12]. Additionally, the mean grain size L and the level of internal stress were estimated for each prepared sample using the Williamson–Hall method [13]:
where is the broadening of the diffraction peak at half its maximum intensity, corresponds to the wavelength of the X-ray beam used in the measurement, is the Bragg angle and denotes the dimensionless shape factor.
Measurements of dc and ac magnetic susceptibility as a function of temperature from 2 K to 15 K and applied magnetic field up to = 9 T were performed using a quantum design Physical Properties Measurements System (PPMS) platform. The ac susceptibility measurements were conducted by applying an ac-field amplitude of = 1 mT with a frequency of f = 1 kHz. The presented values of the mass magnetic susceptibility as well as the real and imaginary parts of ac-susceptibility have an uncertainty of about 5%.
The chemical composition and homogeneity of selected samples were verified by energy dispersive X-ray spectroscopy (EDXS) using a JEOL JSM-IT100 In-Touch-ScopeTM scanning electron microscope.
3. Results and Discussion
3.1. Chemical and Phase Composition
Figure 1 shows XRD patterns measured for powders A obtained after effective milling times up to h. The analysis of the experimental data performed using the Rietveld method reveals that the powders milled up to 40 h contain two phases: a body-centered cubic () structure (space group ) and a hexagonal close-packed () structure (space group ). The lattice parameter a for structure is close to 3.305(3) Å, which is a comparable value to Å determined for pure Nb [14] and slightly higher than Å obtained for Nb-47wt%Ti alloy prepared by arc-melting [15]. In the case of hcp structure, the lattice parameters Å and Å are in good agreement with corresponding values for high purity alpha titanium [16]. For the powders after 60 h and 80 h of MA, XRD patterns show an additional phase which is identified as a non-stoichiometric metallic carbide (probably NbTiCx), which crystallizes in rock–salt structure (space group ) with Å. In all XRD patterns measured for powders A, the diffraction peaks which could be ascribed to ZrO2 are not observed.
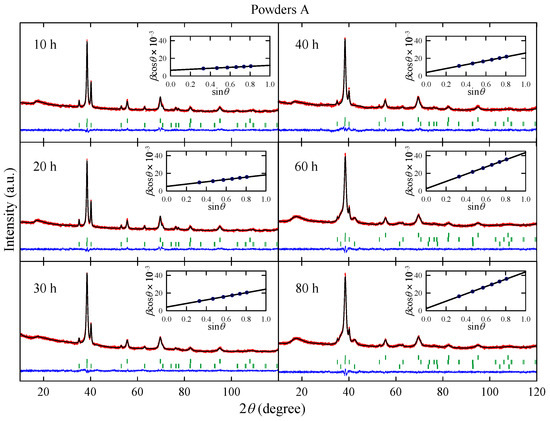
Figure 1.
X-ray diffraction patterns measured for powders A obtained after effective milling times up to h. Red dots and black lines represent experimental data, and the result of the Rietveld refinement, respectively, and blue line shows the difference between the two. Green dashes indicate positions of the Bragg reflections. Insets show the Williamson–Hall plot; solid line is a linear fit to data points.
The phase composition of powders A and the L and parameters determined for the phase are presented in Figure 2. Taking into account XRD data, one can assume that during the MA up to 40 h, the Ti atoms as well as ZrO2 particles are successively introduced into the Nb-rich phase. Longer milling times than 40 h result in carbon contamination of the sample and the formation of non-stoichiometric metallic carbides which crystallize in a rock–salt structure. Carbon contamination of the powder is most likely caused by mechanical alloying using stainless steel vial and balls. The values of L and parameters determined for the phase increase with the milling time. In the case of parameter this result is expected, since MA leads to creation of many lattice defects which increase the mean level of internal strain in the powders. At first glance it seems the increase in mean grain size with the milling time is rather surprising since MA of many systems leads to a decrease in the particles’ size [9]. However, in the case of ductile–ductile systems such as Nb-Ti [17], Ag–Cu [18] or Ni–Ti [19], powder particles have tendency to weld together and form large grains.
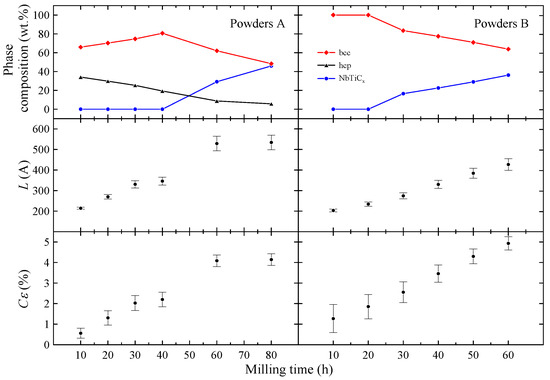
Figure 2.
The phase composition of powders A and B. The estimated L and parameters for the phase.
Figure 3 shows XRD patterns measured for powders B obtained after effective milling times up to h. The analysis of the experimental data reveals that the powders milled up to 20 h contain only one phase with lattice parameter close to 3.29(1) Å, which is comparable with that observed for phase in powders A. For longer milling times, the presence of a non-stoichiometric metallic carbide NbTiCx phase is detected.
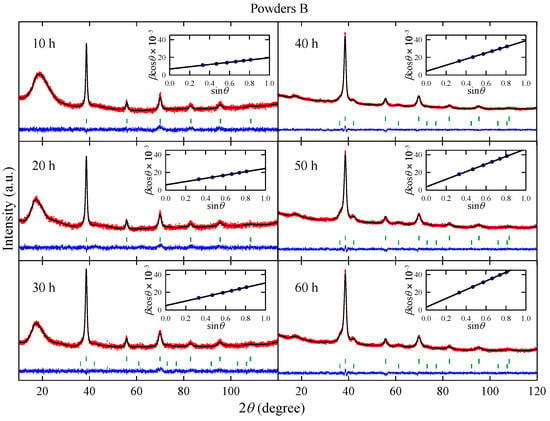
Figure 3.
X-ray diffraction patterns measured for powders B obtained after effective milling times up to h. Red dots and black lines represent experimental data, and the result of the Rietveld refinement, respectively, and blue line shows the difference between the two. Green dashes indicate positions of the Bragg reflections. Insets show the Williamson–Hall plot; a solid line is a linear fit to data points.
As one can see in Figure 2, for h, the content of non-stoichiometric metallic carbide phase gradually increases with the milling time. Again, this effect is probably connected with the carbon contamination during the synthesis. The presence of metallic carbide is detected after t = 60 h for powders A and after 30 h for powders B. Therefore, one can conclude that the NbTiCx phase is formed from bcc Nb-Ti alloy and carbon contamination. The changes in L and parameters with the milling time (Figure 2) are similar to those observed for powders A. Both parameters increase with t. However, it can be noted that estimated for powder B after 10 h of milling is more than twice higher than the corresponding one for powder A. This finding may be associated with arc-melting and subsequent powdering of the Nb-Ti sample before MA synthesis.
The chemical composition of two powders B after 20 and 60 h of MA were determined using SEM with EDX detector (see Figure 4 and Figure 5). It was found that powder B after 20 h of milling has the following chemical composition (in wt.%): 18.6(2.5)% C, 35.3(2.2)% Ti, 42.6(2.3)% Nb, 3.5(1.8)% Zr, while powder B after 60 h of MA is composed of 39.2(7.0)% C, 27.9(3.0)% Ti, 31.2(4.9)% Nb, 1.7(0.7)% Zr. As one can notice, the concentration of carbon drastically increases in studied powders with the milling time. Therefore, it is plausible to assume that the observed phase which crystallizes in rock–salt structure corresponds to non-stoichiometric metallic carbide (probably NbTiCx). The selected EDX spectra and the weight content of the studied samples are presented in the Supplementary Materials.
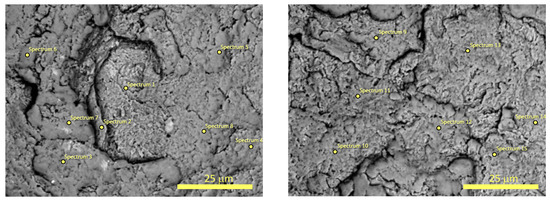
Figure 4.
The SEM micrographs with marked points for EDX microanalysis of the surfaces of the powder B after 20 h of MA.

Figure 5.
The SEM micrographs with marked points for EDX microanalysis of the surfaces of the powder B after 60 h of MA.
3.2. Superconducting Properties
The XRD data collected for powders A and B reveal that the samples contain various phases. It should be noted here that pure Ti and ZrO2 particles do not exhibit superconductivity above 2 K. Therefore, the described below superconducting proprieties of the studied samples can be attributed to Nb-rich phase and NbTiCx.
The selected temperature dependencies of mass magnetic susceptibility measured for powders A in the range of 2–15 K and in applied magnetic field up to = 9 T are presented in Figure 6. As one can notice, dependencies measured at low magnetic field of = 10 mT reveal a strong diamagnetic response at low temperatures. This indicates that the studied powders undergo superconducting transition at critical temperature K. The influence of the milling time on is negligibly small. Since the critical temperatures for high-purity Nb (9.25 K) [20] and Nb-47wt%Ti alloy (9.2 K) [15] are comparable to each other and only slightly higher than determined for all powders A, it is difficult to assess, using , how many Ti atoms and ZrO2 particles were introduced into the Nb matrix during MA. Fortunately, pure Nb has a relatively low upper critical field T [20], while for the Nb-47wt%Ti alloy is close to 15 T [15]. As one can see in Figure 6, the dependencies measured at = 1 T clearly show that the superconducting diamagnetic signal increases with the increase in the milling time, indicating the formation of bcc alloy. At the same time, no strong diamagnetic signal was observed at = 9 T. These results suggest that during MA, some Ti atoms and ZrO2 particles are successively introduced into the Nb matrix.
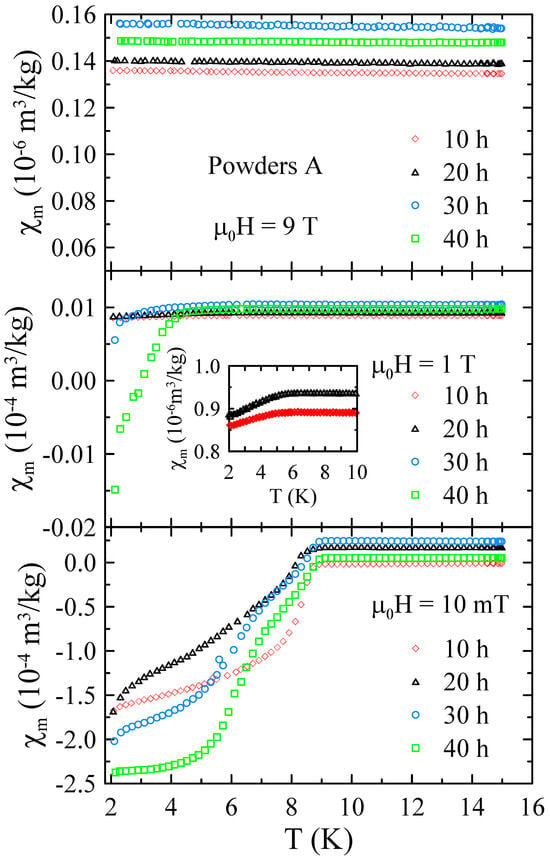
Figure 6.
The selected temperature dependencies of mass magnetic susceptibility measured for powders A in the range of 2–15 K and in applied magnetic field up to = 9 T.
Real and imaginary parts of the ac-susceptibility measured in applied magnetic field up to = 9 T for powders A after 10 and 40 h of MA are presented in Figure 7 and Figure 8, respectively. The results obtained for powders A after 20 h and 30 h of milling are included in the Supplementary Materials. These results provide a more detailed insight into the superconducting properties of the powders studied. In general, the diamagnetic behavior observed in confirms the presence of bulk superconductivity in the studied material. In the case of the imaginary part, the measured (T) curves reveal peaks that reflect energy dissipation and are characteristic of superconductors. As can be seen in Figure 7, the dependence measured in = 1 mT shows two peaks that can be associated with the presence of two superconducting phases in this powder. The first narrow peak with maximum at 9.0(1) K is related to pure Nb since this peak is not observed in dependencies measured in 1 T. The second peak, which is broad and disappears only for magnetic fields greater than 2 T, can be connected with the mechanically alloyed bcc phase. For this phase, the onset of is close to 9.0(2) K in = 1 mT and decreases to 4.0(2) K in = 2 T. In the case of powder A milled for 40 h, one can observe that the peak assigned to pure Nb is relatively lower (see Figure 8) than for 10 h (see Figure 7). Again, this result suggests that during MA, some Ti atoms and ZrO2 particles are successively introduced into the Nb matrix. At the same time, the second peak in is much narrower than the one observed for powders milled for a shorter time. Moreover, the transition to the superconducting state is clearly visible in and curves measured in = 7 T with the onset of close to 3.5(2) K. This result suggests that longer grinding times have a positive effect on the superconducting properties of the prepared bcc alloy. Unfortunately, the superconducting critical parameters such as 9 K and, especially, 9 T estimated for the powder prepared by method A for 40 h are far below those determined for Nb-47wt%Ti alloy ( = 9.2(1) K, = 15.3(3) T [15]). At the same time, the XRD data reveal that longer milling times than 40 h result in carbon contamination of the sample and the formation of non-stoichiometric carbides which crystallize in the rock–salt structure.
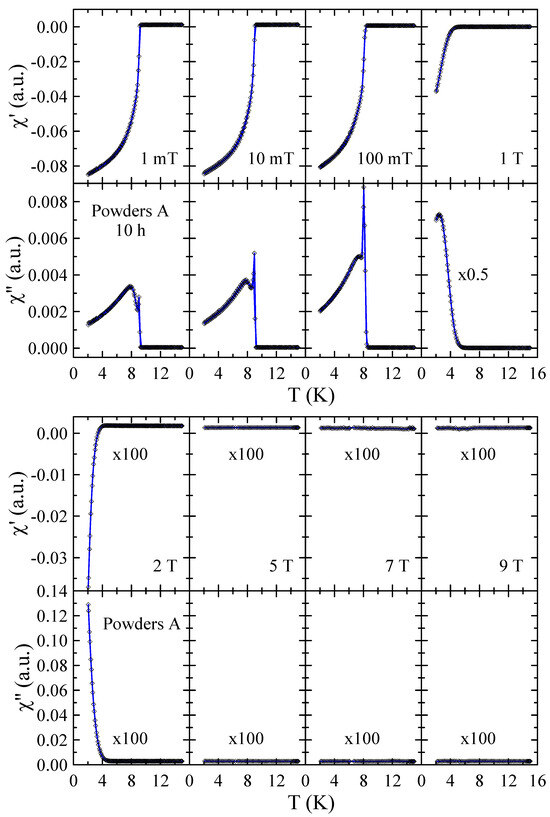
Figure 7.
Real and imaginary parts of the ac-susceptibility measured in applied magnetic field up to = 9 T for powder A after 10 h of MA. Solid curves serve as guides for the eye.
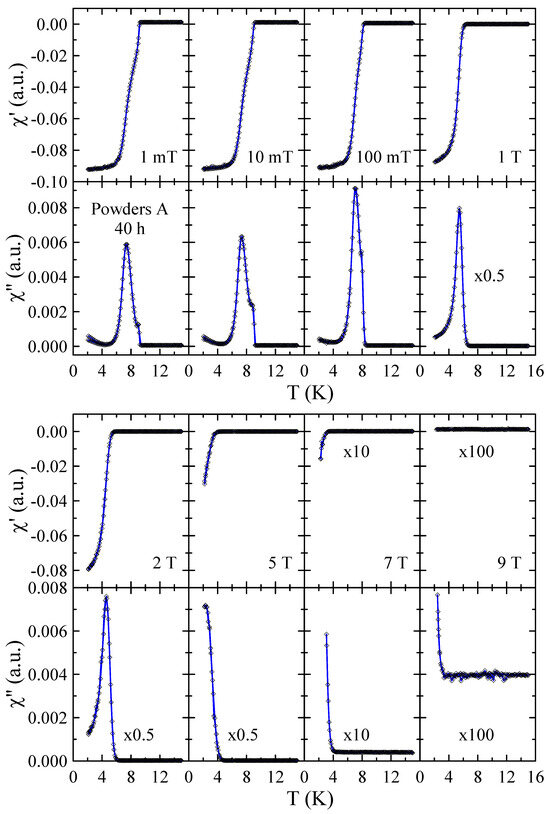
Figure 8.
Real and imaginary parts of the ac-susceptibility measured in applied magnetic field up to = 9 T for powder A after 40 h of MA. Solid curves serve as guides for the eye.
Figure 9 presents the selected temperature dependencies of mass magnetic susceptibility measured for powders B in the range of 2–15 K and in applied magnetic field up to = 9 T. The data obtained for powders B reveal that all these samples are superconductors with 8.5 K in = 10 mT. Moreover, the measurements performed in higher magnetic fields suggest that for these materials is higher than 9 T.
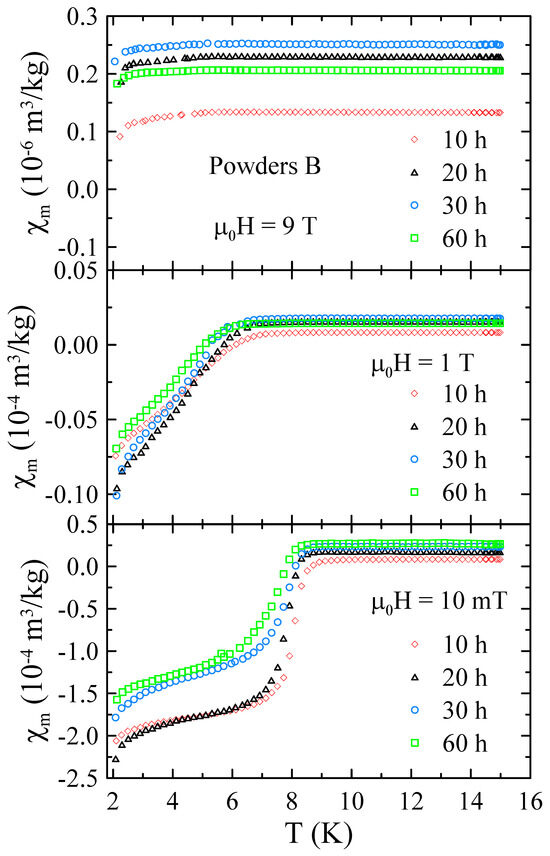
Figure 9.
The selected temperature dependencies of mass magnetic susceptibility measured for powders B in the range of 2–15 K and in applied magnetic field up to = 9 T.
Real and imaginary parts of the ac-susceptibility measured in applied magnetic field up to = 9 T for powders B after 10, 40 and 60 h of MA are presented in Figure 10, Figure 11 and Figure 12, respectively. The results obtained for powders B after 20 h, 30 h and 50 h of milling are included in the Supplementary Materials. The temperature dependencies of and obtained for 10 h powder confirm that the sample is superconductor with 9 K and 9 T. The sharp and narrow peaks observed in dependencies for this powder indicate the good homogeneity of the superconducting state. With increasing milling time, the peaks become broader, which is presumably due to the structural disorder, introduction of ZrO2 particles into the Nb-Ti matrix and lattice strain introduced into the powder by MA. Surprisingly, in the case of powders B milled for 50 h and 60 h, the and data reveal the presence of two superconducting phases. The basis for this statement is that two distinct peaks can be clearly seen in the curves. Moreover, the fact that both peaks gradually shift towards lower temperatures as the applied magnetic field increases additionally supports this statement. Taking into account the XRD results as well as the fact that NbC and TiC compounds are superconductors with close to 11 K [21] and 0.5 K [22], respectively, it is plausible to assume that the second superconducting phase in these powders is non-stoichiometric carbide crystallising in the rock–salt structure. In the case of powder B milled for 50 h, the of this carbide determined as the maximum of peak in = 1 mT is close to 6.1 K, while for 60 h sample, decreases to 4.2 K. This finding suggests that longer milling times, which result in a higher carbon content in the carbide phase, have a negative effect on its superconducting properties.
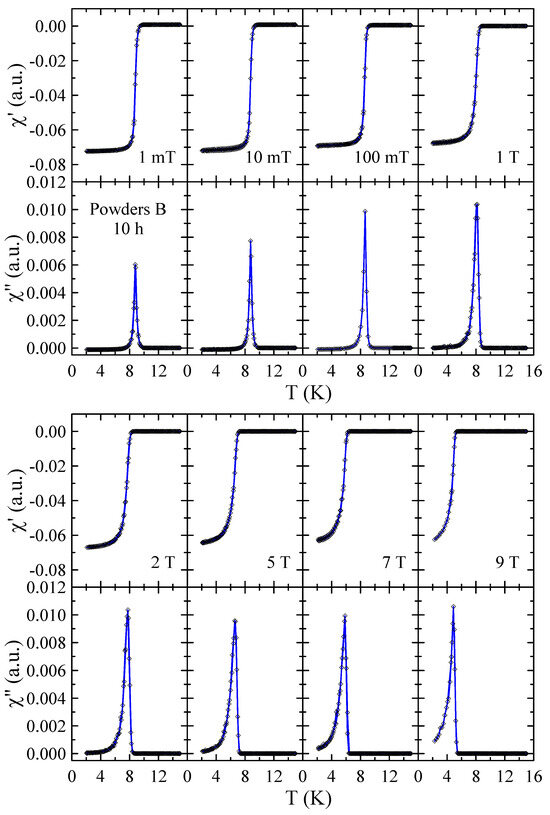
Figure 10.
Real and imaginary parts of the ac-susceptibility measured in applied magnetic field up to = 9 T for powder B after 10 h of MA. Solid curves serve as guides for the eye.
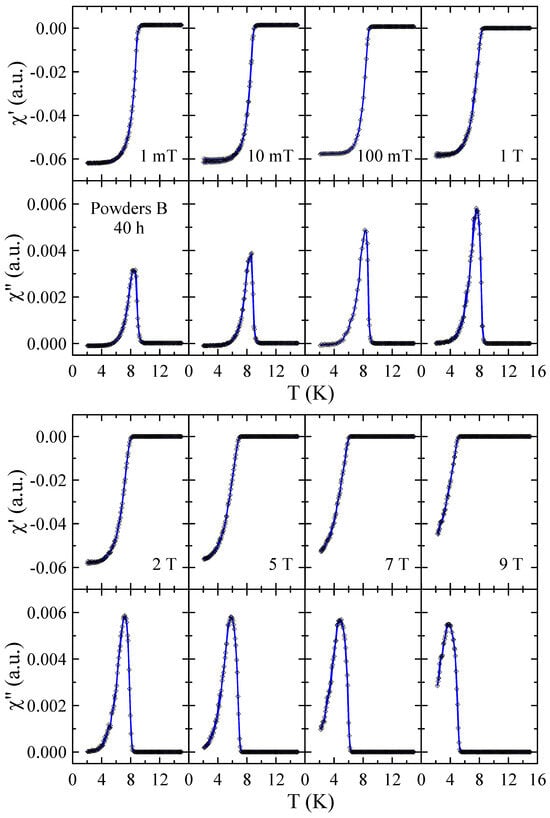
Figure 11.
Real and imaginary parts of the ac-susceptibility measured in applied magnetic field up to = 9 T for powder B after 40 h of MA. Solid curves serve as guides for the eye.
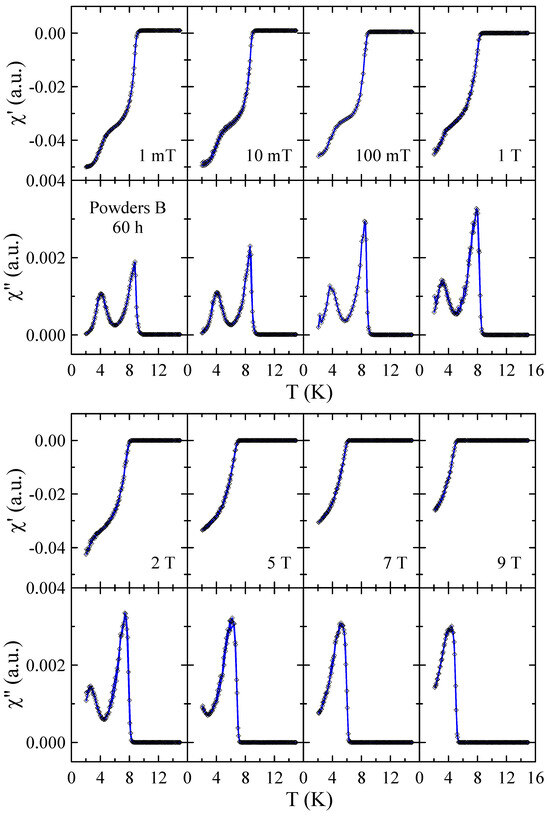
Figure 12.
Real and imaginary parts of the ac-susceptibility measured in applied magnetic field up to = 9 T for powder B after 60 h of MA. Solid curves serve as guides for the eye.
The measurements of the magnetic properties of powders B indicate that for the superconducting bcc alloy, the upper critical field at 0 K () is higher than 9 T. The Pauli limiting field 16.6 T was estimated from the equation [23]:
Therefore, to obtain correct assessment of we applied the Werthamer–Helfand– Hohenberg (WHH) [24,25,26] model for BCS superconductors in the dirty limit, which includes the spin-paramagnetic effect (described by the Maki parameter ) and the spin–orbit scattering constant to fit the experimental data (Equation (3), where , , and is digamma function):
The results are presented in Figure 13. As one can see, the values of and determined for phase in all powders B are comparable to each other, indicating the limited influence of milling time on superconducting properties of this phase. In other words, this finding suggests that the changes in the mean grain size as well as the level of internal strain observed for the phase (see Figure 2) do not cause any noticeable changes in and values. Due to that, it was decided to simulate only one set of WHH curves for all powders B. The best results were obtained for the Maki parameter and , yielding T, = 9.0(1) K, and the orbital limiting field T. Comparing these values with the results obtained for Nb-47wt%Ti alloy ( = 9.2(1) K, = 15.3(3) T [15]), one can notice that the influence of dispersed ZrO2 particles on the superconducting properties of the Nb-Ti alloy is rather small. However, it should be mentioned that T is slightly higher than 15.3(3) T obtained for Nb-47wt%Ti. Taking into account that the changes in L and parameters do not cause any observable changes in values, the increase in the upper critical field may be connected with the presence of introduced ZrO2 particles.
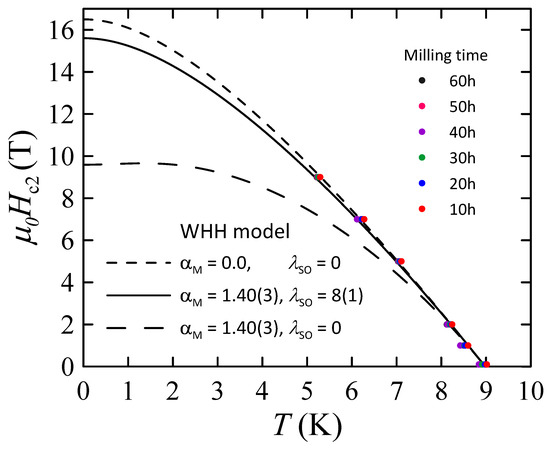
Figure 13.
Upper critical field of superconducting bcc alloy in powders B as a function of temperature and derived from ac-susceptibility measurements. Solid and dashed lines are simulated WHH curves.
Figure 14 shows the temperature dependencies of mass magnetic susceptibility measured for sample C prepared by arc-melting in the range of 2–15 K and in applied magnetic field up to = 9 T. As one can notice, in this sample superconductivity emerges at = 6.5(2) K, which is much lower value than that observed for phase in powders A and B. This result can be explained by assuming that ZrO2 particles decompose to Zr and O atoms during the arc melting process. Despite the fact that the transition temperature of Nb-Ti alloy can be slightly increased by adding Zr atoms [27], the effect of interstitial oxygen on reduction may be dominant. According to works [28,29], the addition of interstitial oxygen atoms to niobium, in concentrations below the solubility limit, significantly reduces its transition temperature. In particular, drops by about 0.93 K for each 1 at.% O dissolved in Nb. Therefore, it is plausible to assume that the obtained sample C consists of the Nb-Ti alloy with the addition of substitutional metallic Zr solutes and interstitial oxygen atoms. At the same time, much higher observed for superconducting phase in powders A and B indicates that during MA, the ZrO2 particles do not decompose to Zr and O, and they are introduced to the Nb-Ti matrix.
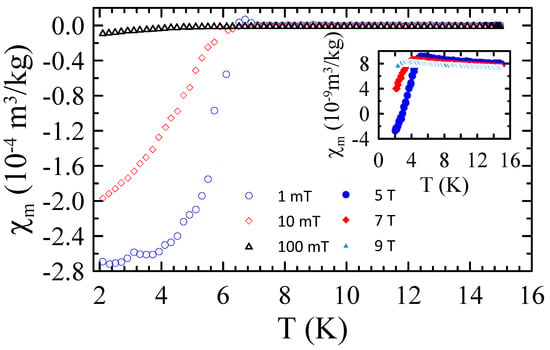
Figure 14.
The temperature dependencies of mass magnetic susceptibility measured for sample C prepared by arc-melting in the range of 2–15 K and in applied magnetic field up to = 9 T.
In summary, it was found that the sample A obtained after 40 h of MA of Nb, Ti and ZrO2 powders still contains pure Nb and Ti, while ZrO2 particles are successively introduced into the Nb-Ti matrix. Unfortunately, the superconducting critical parameters such as 9 K and, especially, 9 T estimated for the powder prepared by method A for 40 h are far below those determined for Nb-47wt%Ti alloy ( = 9.2(1) K, = 15.3(3) T [15]. At the same time, the XRD data reveal that longer milling times than 40 h result in carbon contamination of the sample and the formation of non-stoichiometric carbides which crystallize in rock-salt structure. In the case of powders B which were prepared by MA of Nb-47wt%Ti and ZrO2 powders, the phase exhibits superconductivity below 9 K and the determined T is slightly higher than 15.3(3) T obtained for Nb-47wt%Ti. The increase in the upper critical field may be connected with the presence of introduced ZrO2 particles. In sample C, prepared by arc-melting procedure, the superconductivity emerges at = 6.5(2) K, which is much lower value than that observed for phase in powders A and B. This result can be explained by assuming that ZrO2 particles decompose to Zr and O atoms during the arc melting process.
4. Conclusions
The influence of dispersed ZrO2 particles on microstructure evolution and superconducting properties of Nb-Ti alloy was investigated. The studied material with a nominal composition of Nb-47wt%Ti-5 wt% ZrO2 was prepared using MA in two series, powders A and B, and an additional sample C was prepared by arc-melting method. The obtained results reveal that the optimal method of synthesis of Nb-Ti alloy containing a dispersion of nanoscale ZrO2 particles is the powder metallurgy route by mechanical alloying Nb-47wt%Ti and ZrO2 powders using high energy ball milling. These powders contain a phase which exhibits superconductivity with 9 K and this value is comparable to = 9.2(1) K observed for pure Nb-47wt%Ti alloy. At the same time, the determined T is slightly higher than 15.3(3) T obtained for Nb-47wt%Ti. In the case of powders prepared using MA of pure Nb, Ti and ZrO2 particles as well as the sample obtained by arc-melting method, the superconducting critical parameters observed for phase are much lower than those for powders B. Additionally, it was found that long milling times result in carbon contamination of the powders A and B, and the formation of non-stoichiometric metallic carbides which crystallize in a rock–salt structure. This contamination is originated from grinding bowl and grinding balls made of hardened stainless steel. It can be proposed, therefore, that the grinding tools for this type of synthesis should be made of a harder material, i.e., tungsten carbide.
Supplementary Materials
The following supporting information can be downloaded at: https://www.mdpi.com/article/10.3390/ma17235946/s1, S1 Additional information: scanning electron microscopy; S2 Additional information: magnetic measurements.
Author Contributions
Conceptualization, R.I.; validation, R.I.; formal analysis, R.I. and W.N.; investigation, R.K., W.N., W.B. and M.B.; writing—original draft preparation, R.I. and W.N.; writing—review and editing, R.I. and W.N.; visualization, R.I. and W.N.; supervision, R.I. All authors have read and agreed to the published version of the manuscript.
Funding
This research received no external funding.
Institutional Review Board Statement
Not applicable.
Informed Consent Statement
Not applicable.
Data Availability Statement
Dataset available on request from the authors.
Conflicts of Interest
The authors declare no conflicts of interest.
References
- Wilms, M.B.; Rittinghaus, S.K.; Goßling, M.; Gökce, B. Additive manufacturing of oxide-dispersion strengthened alloys: Materials, synthesis and manufacturing. Prog. Mater. Sci. 2023, 133, 101049. [Google Scholar] [CrossRef]
- Klueh, R.; Shingledecker, J.; Swindeman, R.; Hoelzer, D. Oxide dispersion-strengthened steels: A comparison of some commercial and experimental alloys. J. Nucl. Mater. 2005, 341, 103–114. [Google Scholar] [CrossRef]
- Fu, J.; Brouwer, J.; Richardson, I.; Hermans, M. Effect of mechanical alloying and spark plasma sintering on the microstructure and mechanical properties of ODS Eurofer. Mater. Des. 2019, 177, 107849. [Google Scholar] [CrossRef]
- Zhong, Y.; Liu, L.; Zou, J.; Li, X.; Cui, D.; Shen, Z. Oxide dispersion strengthened stainless steel 316L with superior strength and ductility by selective laser melting. J. Mater. Sci. Technol. 2020, 42, 97–105. [Google Scholar] [CrossRef]
- Wang, J.; Liu, S.; Xu, B.; Zhang, J.; Sun, M.; Li, D. Research progress on preparation technology of oxide dispersion strengthened steel for nuclear energy. Int. J. Extrem. Manuf. 2021, 3, 032001. [Google Scholar] [CrossRef]
- Luptáková, N.; Svoboda, J.; Bártková, D.; Weiser, A.; Dlouhý, A. The Irradiation Effects in Ferritic, Ferritic–Martensitic and Austenitic Oxide Dispersion Strengthened Alloys: A Review. Materials 2024, 17, 3409. [Google Scholar] [CrossRef]
- Lü, L.; Lai, M.O. Introduction to Mechanical Alloying. In Mechanical Alloying; Springer: Boston, MA, USA, 1998; pp. 1–9. [Google Scholar] [CrossRef]
- Benjamin, J.S. Mechanical Alloying. Sci. Am. 1976, 234, 40–49. [Google Scholar] [CrossRef]
- Suryanarayana, C. Mechanical alloying: A critical review. Mater. Res. Lett. 2022, 10, 619–647. [Google Scholar] [CrossRef]
- Mousavi, T.; Grant, P.S.; Speller, S.C.; Grovenor, C. New nanoscale artificial pinning centres for NbTi superconductors. Mater. Des. 2021, 198, 109285. [Google Scholar] [CrossRef]
- Rietveld, H.M. A profile refinement method for nuclear and magnetic structures. J. Appl. Crystallogr. 1969, 2, 65–71. [Google Scholar] [CrossRef]
- Rodríguez-Carvajal, J. Recent advances in magnetic structure determination by neutron powder diffraction. Phys. B Condens. Matter 1993, 192, 55–69. [Google Scholar] [CrossRef]
- Williamson, G.; Hall, W. X-ray line broadening from filed aluminium and wolfram. Acta Metall. 1953, 1, 22–31. [Google Scholar] [CrossRef]
- Roberge, R. Lattice parameter of niobium between 4.2 and 300 K. J. Less Common Met. 1975, 40, 161–164. [Google Scholar] [CrossRef]
- Nowak, W.; Babij, M.; Hanc-Kuczkowska, A.; Sobota, P.; Pikul, A.; Idczak, R. Effect of the Presence of Structural Defects on the Superconducting Properties of (NbTa)0.67(MoHfW)0.33 and Nb-47wt%Ti. Metals 2023, 13, 1779. [Google Scholar] [CrossRef]
- Wood, R.M. The Lattice Constants of High Purity Alpha Titanium. Proc. Phys. Soc. 1962, 80, 783. [Google Scholar] [CrossRef]
- Mousavi, T.; Hong, Z.; Morrison, A.; London, A.; Grant, P.S.; Grovenor, C.; Speller, S.C. A new approach to fabricate superconducting NbTi alloys. Supercond. Sci. Technol. 2017, 30, 094001. [Google Scholar] [CrossRef]
- Suryanarayana, C. Mechanical alloying and milling. Prog. Mater. Sci. 2001, 46, 1–184. [Google Scholar] [CrossRef]
- Mousavi, T.; Karimzadeh, F.; Abbasi, M. Synthesis and characterization of nanocrystalline NiTi intermetallic by mechanical alloying. Mater. Sci. Eng. A 2008, 487, 46–51. [Google Scholar] [CrossRef]
- Finnemore, D.K.; Stromberg, T.F.; Swenson, C.A. Superconducting Properties of High-Purity Niobium. Phys. Rev. 1966, 149, 231–243. [Google Scholar] [CrossRef]
- Shang, T.; Zhao, J.Z.; Gawryluk, D.J.; Shi, M.; Medarde, M.; Pomjakushina, E.; Shiroka, T. Superconductivity and topological aspects of the rocksalt carbides NbC and TaC. Phys. Rev. B 2020, 101, 214518. [Google Scholar] [CrossRef]
- Szymanski, N.J.; Khatri, I.; Amar, J.G.; Gall, D.; Khare, S.V. Unconventional superconductivity in 3d rocksalt transition metal carbides. J. Mater. Chem. C 2019, 7, 12619–12632. [Google Scholar] [CrossRef]
- Clogston, A.M. Upper Limit for the Critical Field in Hard Superconductors. Phys. Rev. Lett. 1962, 9, 266–267. [Google Scholar] [CrossRef]
- Helfand, E.; Werthamer, N.R. Temperature and Purity Dependence of the Superconducting Critical Field, Hc2. II. Phys. Rev. 1966, 147, 288–294. [Google Scholar] [CrossRef]
- Werthamer, N.R.; Helfand, E.; Hohenberg, P.C. Temperature and Purity Dependence of the Superconducting Critical Field, Hc2. III. Electron Spin and Spin-Orbit Effects. Phys. Rev. 1966, 147, 295–302. [Google Scholar] [CrossRef]
- Maki, K. Effect of Pauli Paramagnetism on Magnetic Properties of High-Field Superconductors. Phys. Rev. 1966, 148, 362–369. [Google Scholar] [CrossRef]
- Collings, E.W. Titanium-Zirconium-Niobium Ternary Alloys. In A Sourcebook of Titanium Alloy Superconductivity; Springer: Boston, MA, USA, 1983; pp. 347–377. [Google Scholar] [CrossRef]
- DeSorbo, W. Effect of Dissolved Gases on Some Superconducting Properties of Niobium. Phys. Rev. 1963, 132, 107–121. [Google Scholar] [CrossRef]
- Koch, C.C.; Scarbrough, J.O.; Kroeger, D.M. Effects of interstitial oxygen on the superconductivity of niobium. Phys. Rev. B 1974, 9, 888–897. [Google Scholar] [CrossRef]
Disclaimer/Publisher’s Note: The statements, opinions and data contained in all publications are solely those of the individual author(s) and contributor(s) and not of MDPI and/or the editor(s). MDPI and/or the editor(s) disclaim responsibility for any injury to people or property resulting from any ideas, methods, instructions or products referred to in the content. |
© 2024 by the authors. Licensee MDPI, Basel, Switzerland. This article is an open access article distributed under the terms and conditions of the Creative Commons Attribution (CC BY) license (https://creativecommons.org/licenses/by/4.0/).