2. Materials and Methods
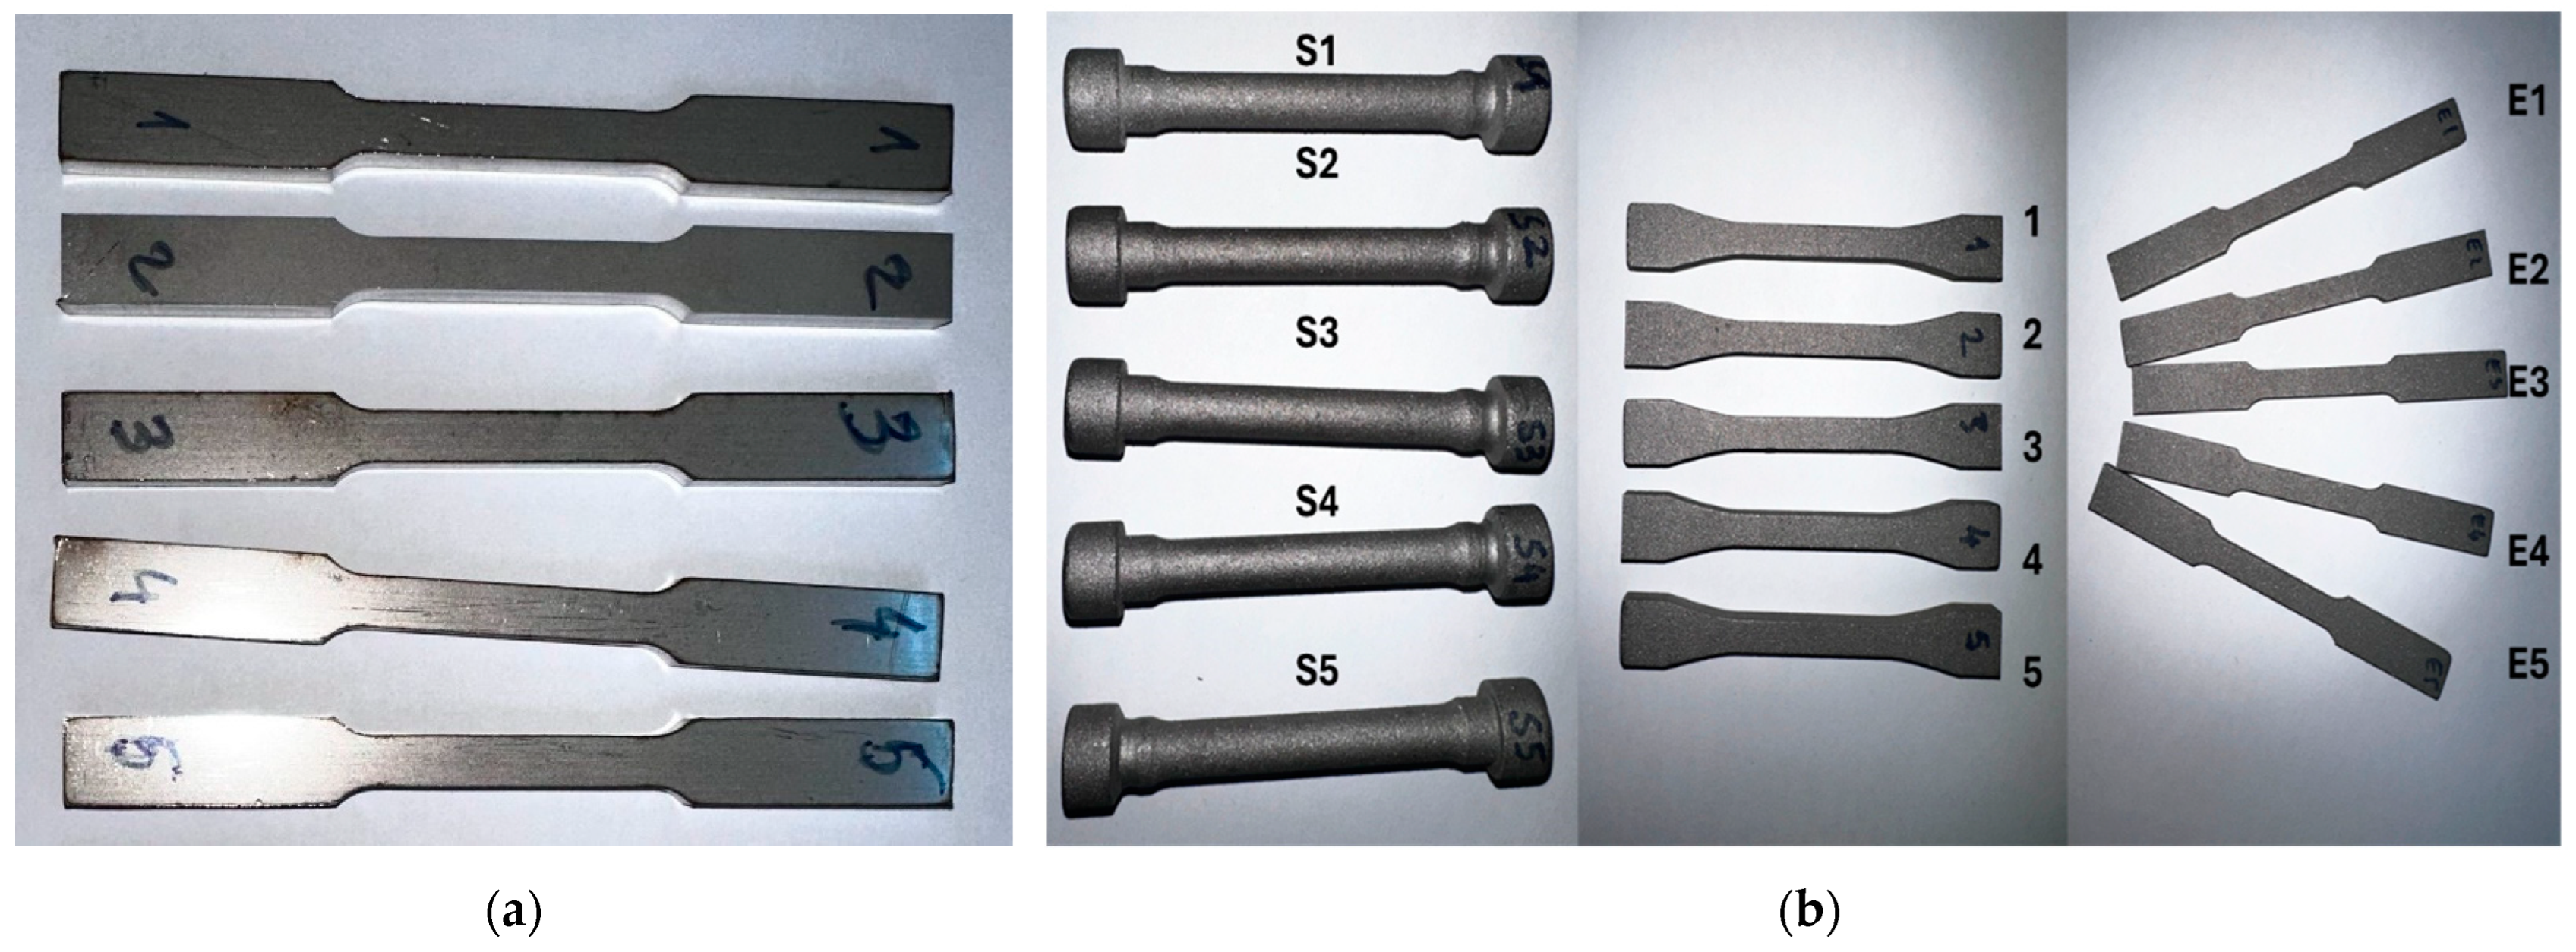
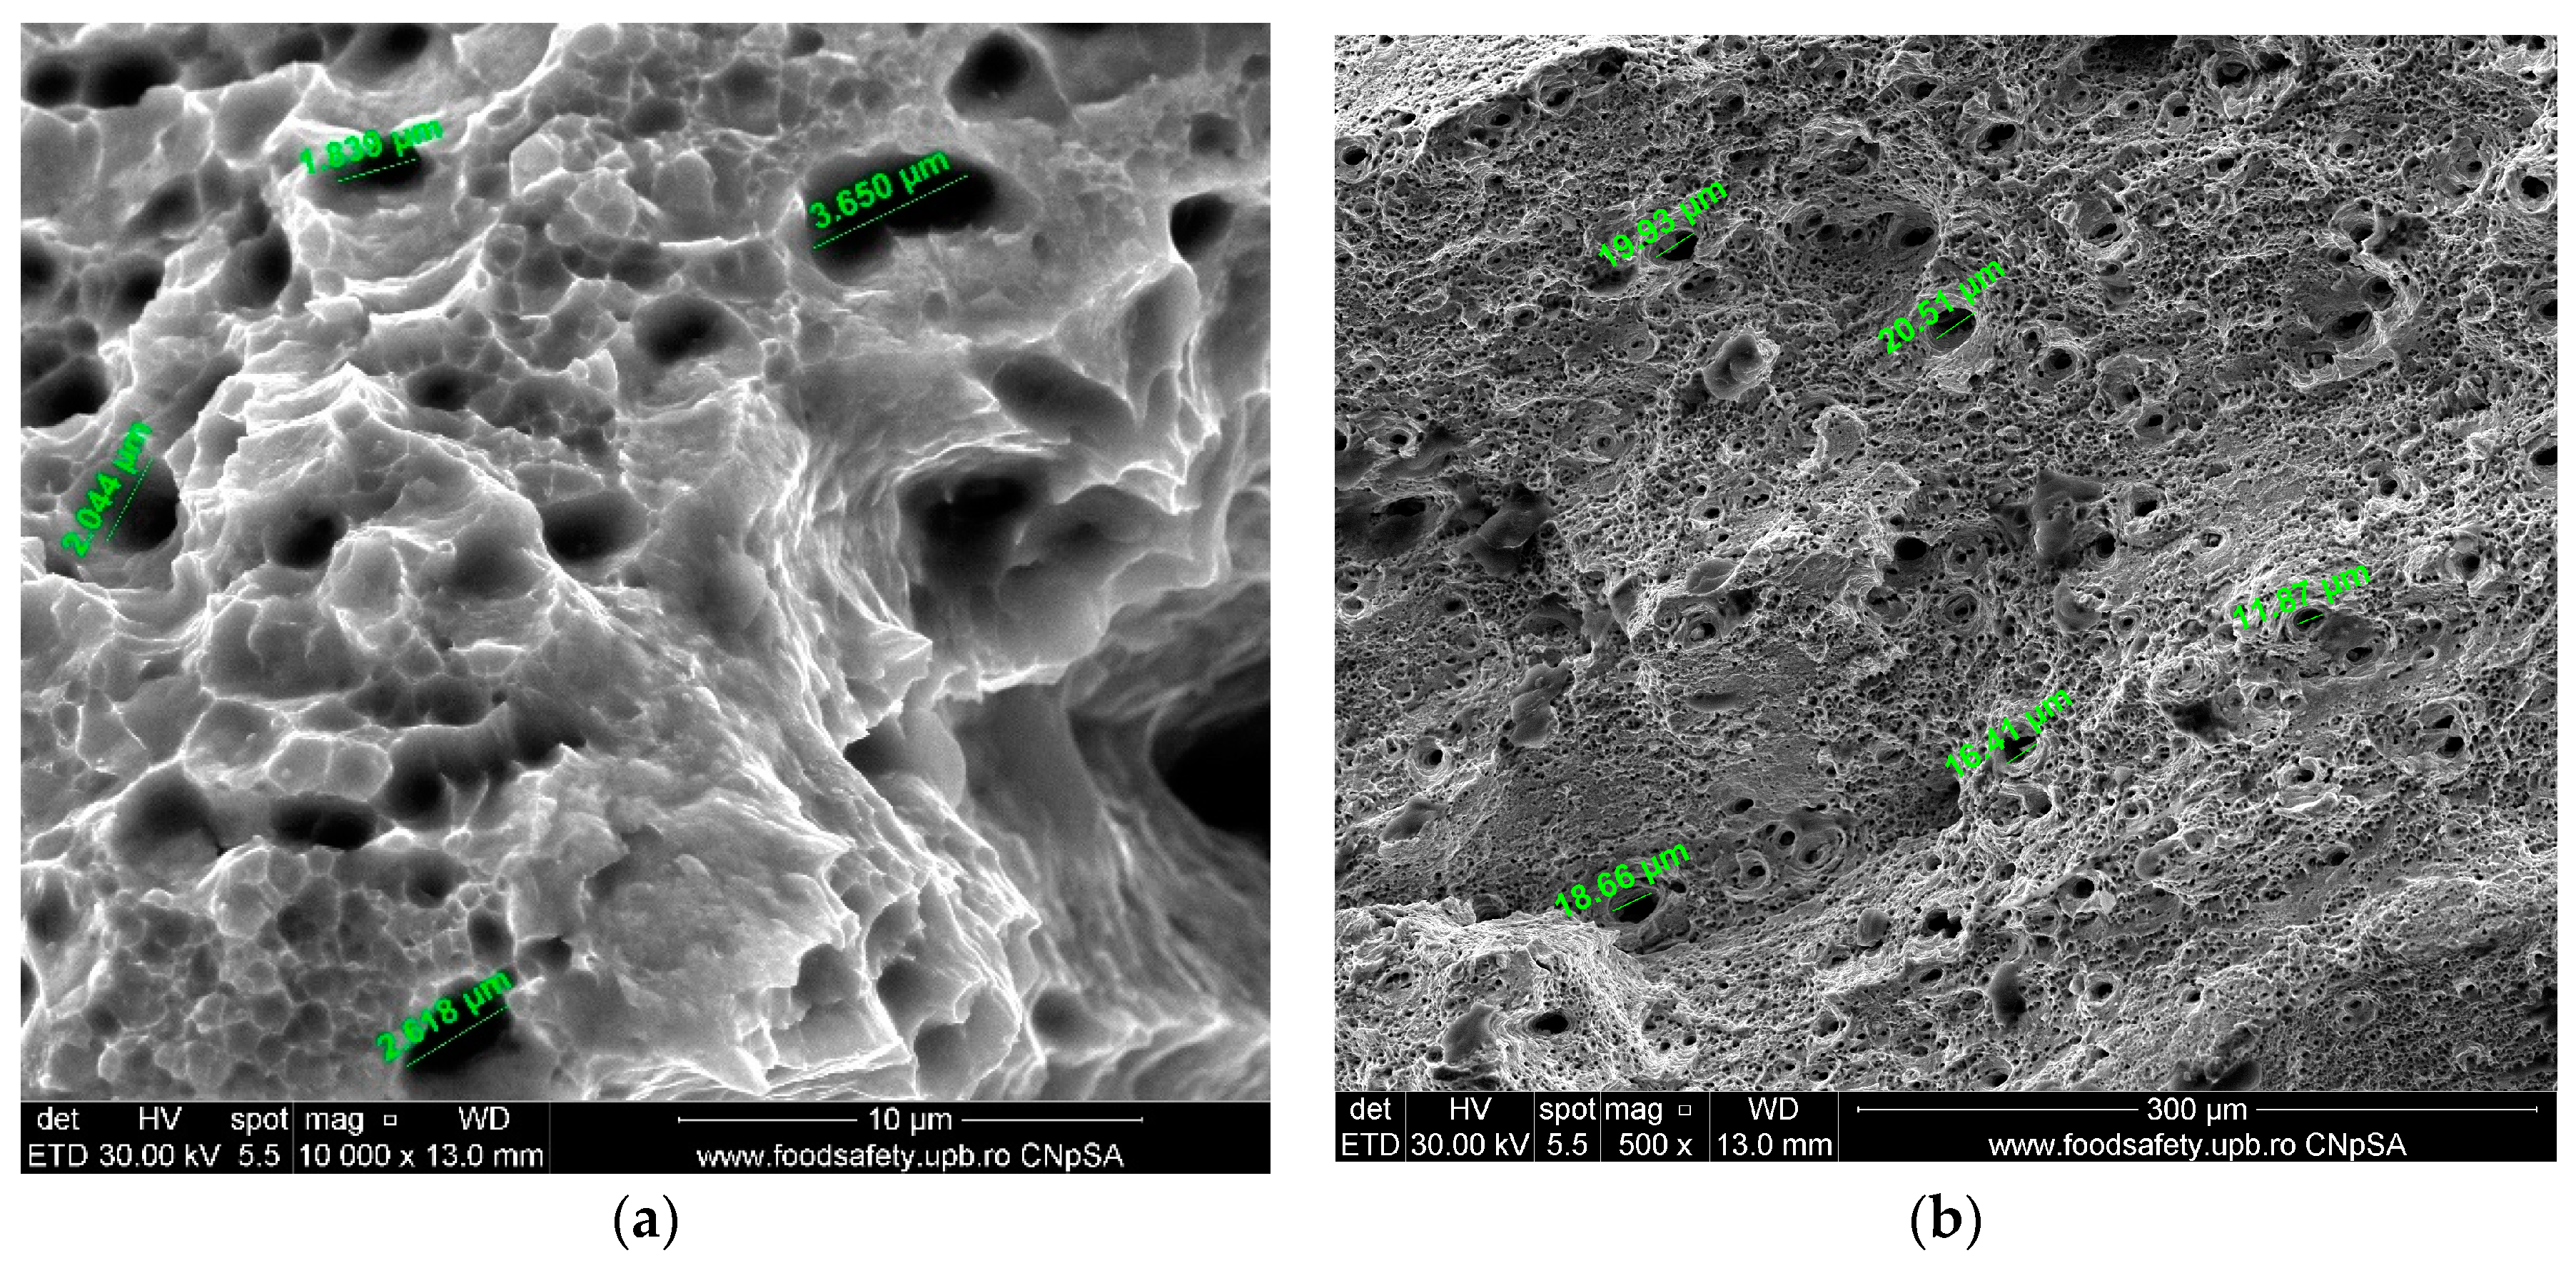
Four sets of SS316L samples were prepared: The first one was made using conventional manufacturing methods (casting and forging) and the other using additive manufacturing (selective laser melting). The first set contains five samples, presented in
Figure 1a; they were produced by melting the alloy and pouring it into sand moulds, followed by hot forging and annealing. Fifteen samples were fabricated using a commercial-grade SS316L powder presented in
Figure 1b using SLM, the AM parts were acquired from a manufacturer named Sculpteo, Paris, France [
7].
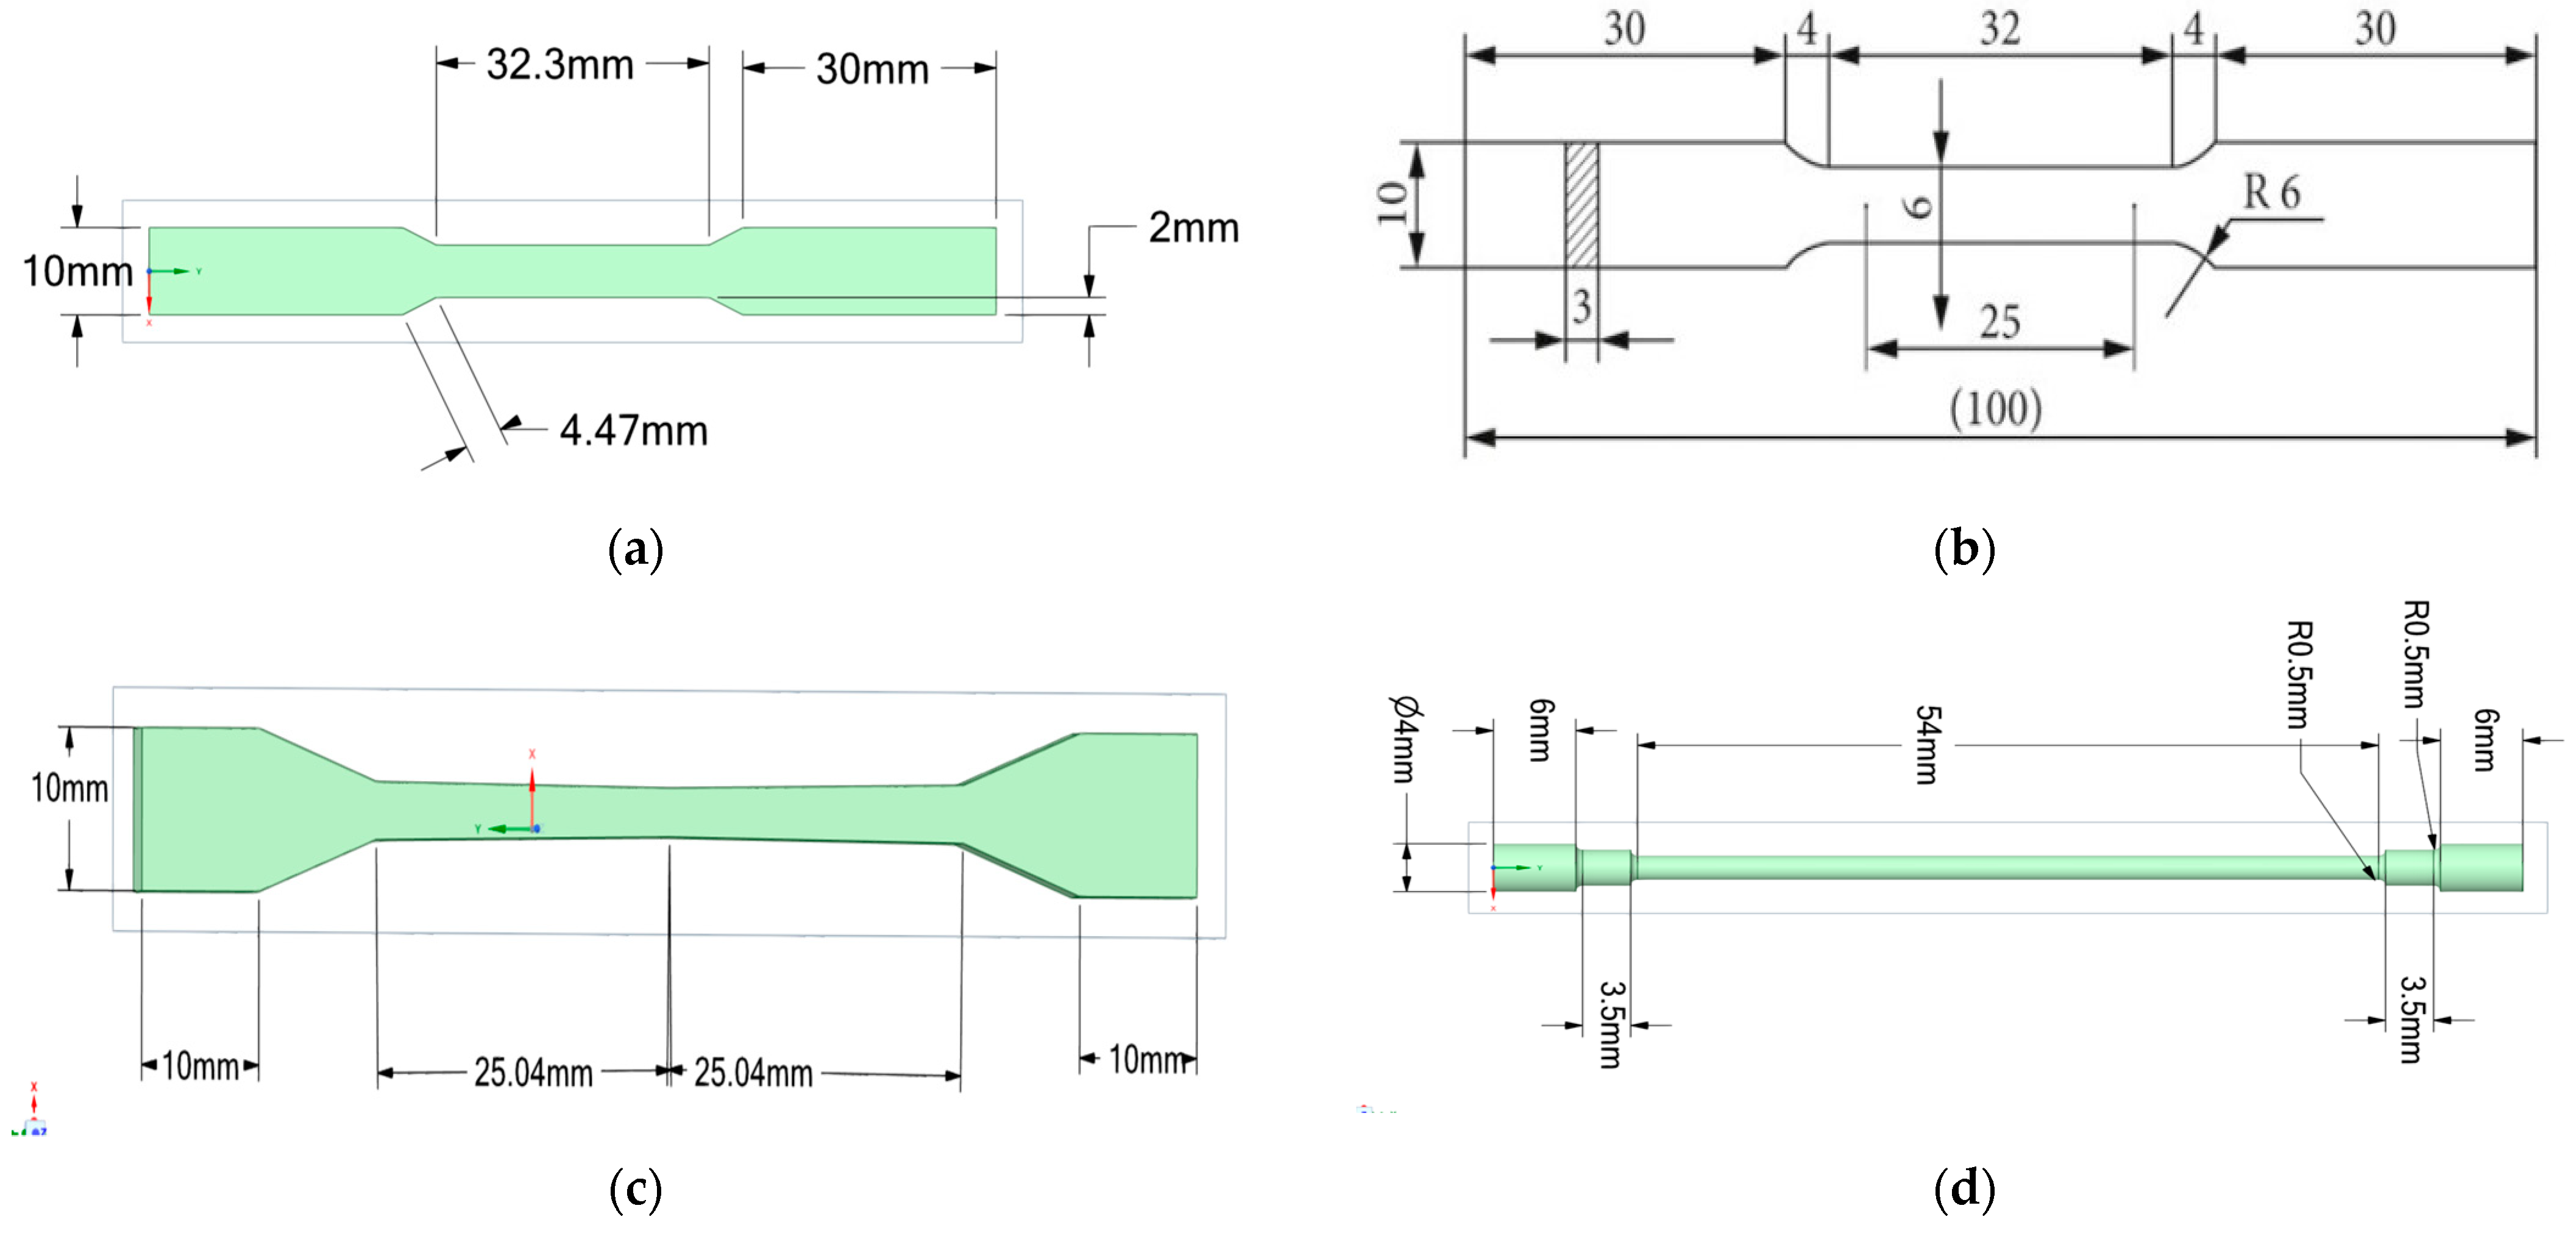
The series samples are used in testing, as specified in
Table 1, with E series samples measuring 100.9 × 3 × 10 mm, S series samples measuring 11 × 11 × 70 mm and numbered series samples measuring 75 × 4 × 10 mm as can be observed in
Figure 2. The samples were manufactured using the laser melting technique used in additive manufacturing, and Stainless Steel 316L was selected for its corrosion resistance and mechanical properties [
7].
The chemical composition for the samples and properties were taken from the manufacturer and are presented in
Table 2 for both conventional manufactured samples and for AM samples.
Tensile testing was performed to assess the mechanical characteristics of both sets of samples. The experiment used a Forta Instron 8800/N as the equipment setup. The Instron machine is equipped with a very accurate load cell and fixtures that have the ability to securely hold the test specimens, ensuring reliable data collection.
The samples were labelled without any particular arrangement being used. The additive manufactured samples were evaluated in three series, each consisting of five samples. The conventional samples were examined in one series, also consisting of five samples.
The AM SS316L samples used for this study were produced using the EOS M280 machine. It utilises SLM technology which uses the systematic construction of components from metal powder through a layer-by-layer process and produces parts with microstructural details and specific mechanical properties, features that are important for the testing and analysis carried out in this research [
7].
3. Results
The first AM set of samples, labelled S1 to S5, exhibits a modulus that varies between 0.01% and 0.1%, with corresponding values ranging from 155,889 MPa to 202,334 MPa. The modulus exhibits a coefficient of variance of 9.47%, indicating a moderate degree of variability in stiffness. The range of the yield stress is between 485 MPa and 644 MPa, with an average value of 565 MPa. The range of ultimate tensile strength is between 646 MPa and 852 MPa, with an average value of 761 MPa.
As specified in
Table 3, the coefficient of variation for tensile strain was calculated at 1.16%. The fracture strain values range from 40.18% to 41.23%, with an average of 40.73%. The tensile strength at the point of fracture shows significant variance, with a coefficient of variation of 15.49%.
The second AM sample series, labelled from 1 to 5, exhibits somewhat reduced modulus values, yield stress values, ultimate tensile strength values and tensile strain values. The range of the ultimate tensile strength is between 738 and 755 MPa, with an average value of 653 MPa. The strain values are elevated, suggesting a high level of consistency, while the tensile strength at the point of fracture is greater, with an average value of 35.07%. The tensile strength at the point of fracture varies between 500 and 607 MPa, with an average of 438 MPa; this indicates a moderate level of variability in the way the material breaks. The results of the second series of tests are presented in
Table 4.
The third AM sample Series, presented in
Table 5, is labelled from E1 to E5. This series of tests presents a moderate level of rigidity compared to the first two series, with a modulus range of 150,600 MPa to 170,991 MPa and an average of 160,649 MPa. The yield stress varies between 427 MPa and 457 MPa, with an average of 446 MPa. The range of the ultimate tensile strength is between 603 MPa and 653 MPa, with an average of 629 MPa. The Poisson’s Ratio readings range from 0.312 to 0.339, with an average of 0.328, showing a moderate level of variation in the material’s capacity to bend laterally.
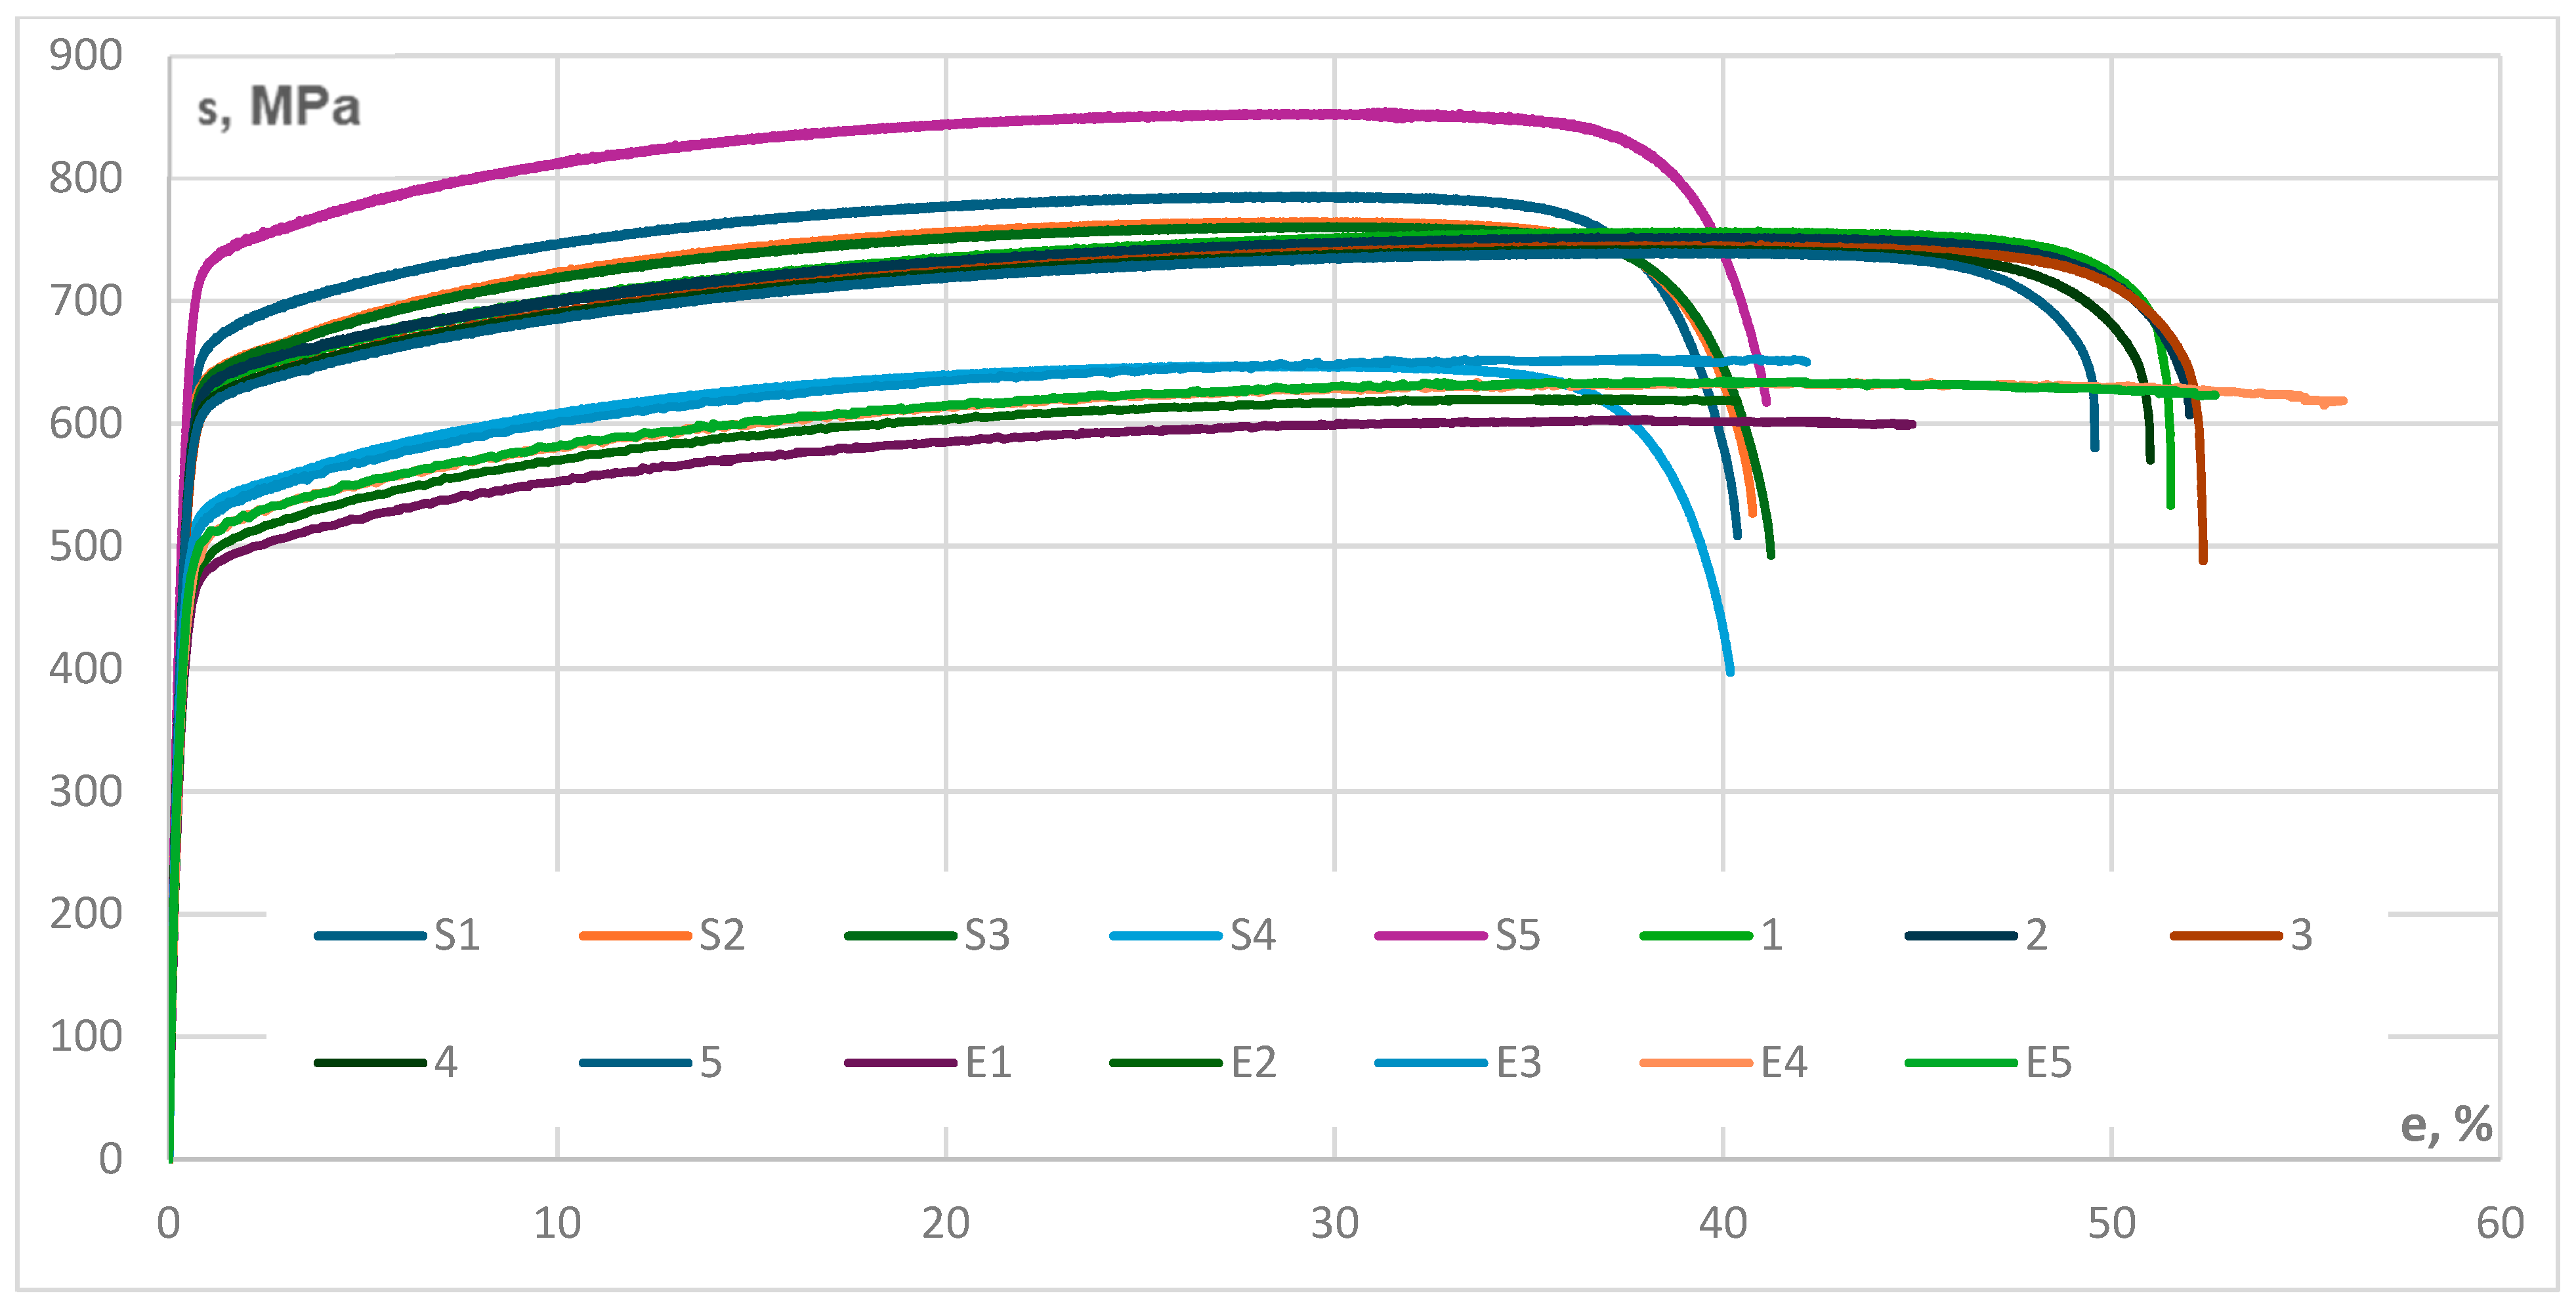
The stress–strain curves that are presented in
Figure 3 illustrate the mechanical response of stainless steel 316L samples produced using additive manufacturing when subjected to tensile stress for all three series of tests. The curves present data regarding mechanical characteristics including the elastic modulus, yield strength, ultimate tensile strength and ductility. The graph provides information on the material performance at the initial elastic region, yield point, plastic deformation, ultimate tensile strength, strain hardening, necking and fracture. By observing the variability in strength and ductility across the samples, a conclusion is that it is necessary to optimise AM process parameters to maintain material properties consistent. The results emphasise on how differences in the additive manufacturing process may affect the mechanical characteristics of 316L stainless steel.
The mechanical properties of 316L stainless steel samples that were manufactured using conventional methods are summarised in
Table 6. The range of elastic modulus (E) values is between 130,527 MPa and 149,796 MPa, with an average value of 141,410 MPa. The Poisson’s ratio (Niu) varies between 0.302 and 0.357, with an average value of 0.328. The range of the ultimate tensile strength (UTS) is between 626.73 MPa and 677.04 MPa, with an average value of 657.25 MPa. The yield strength varies between 303.4 MPa and 350.36 MPa, with an average value of 332.68 MPa. The coefficient of variation suggests that the material’s reaction to applied force may be predicted. The samples demonstrate rigidity and durability, which are necessary for structural purposes. The yield strength indicates that the material will perform effectively in stress conditions commonly encountered in its applications. The Poisson’s ratio of stainless-steel indicates a uniform reaction to tensile pressures.
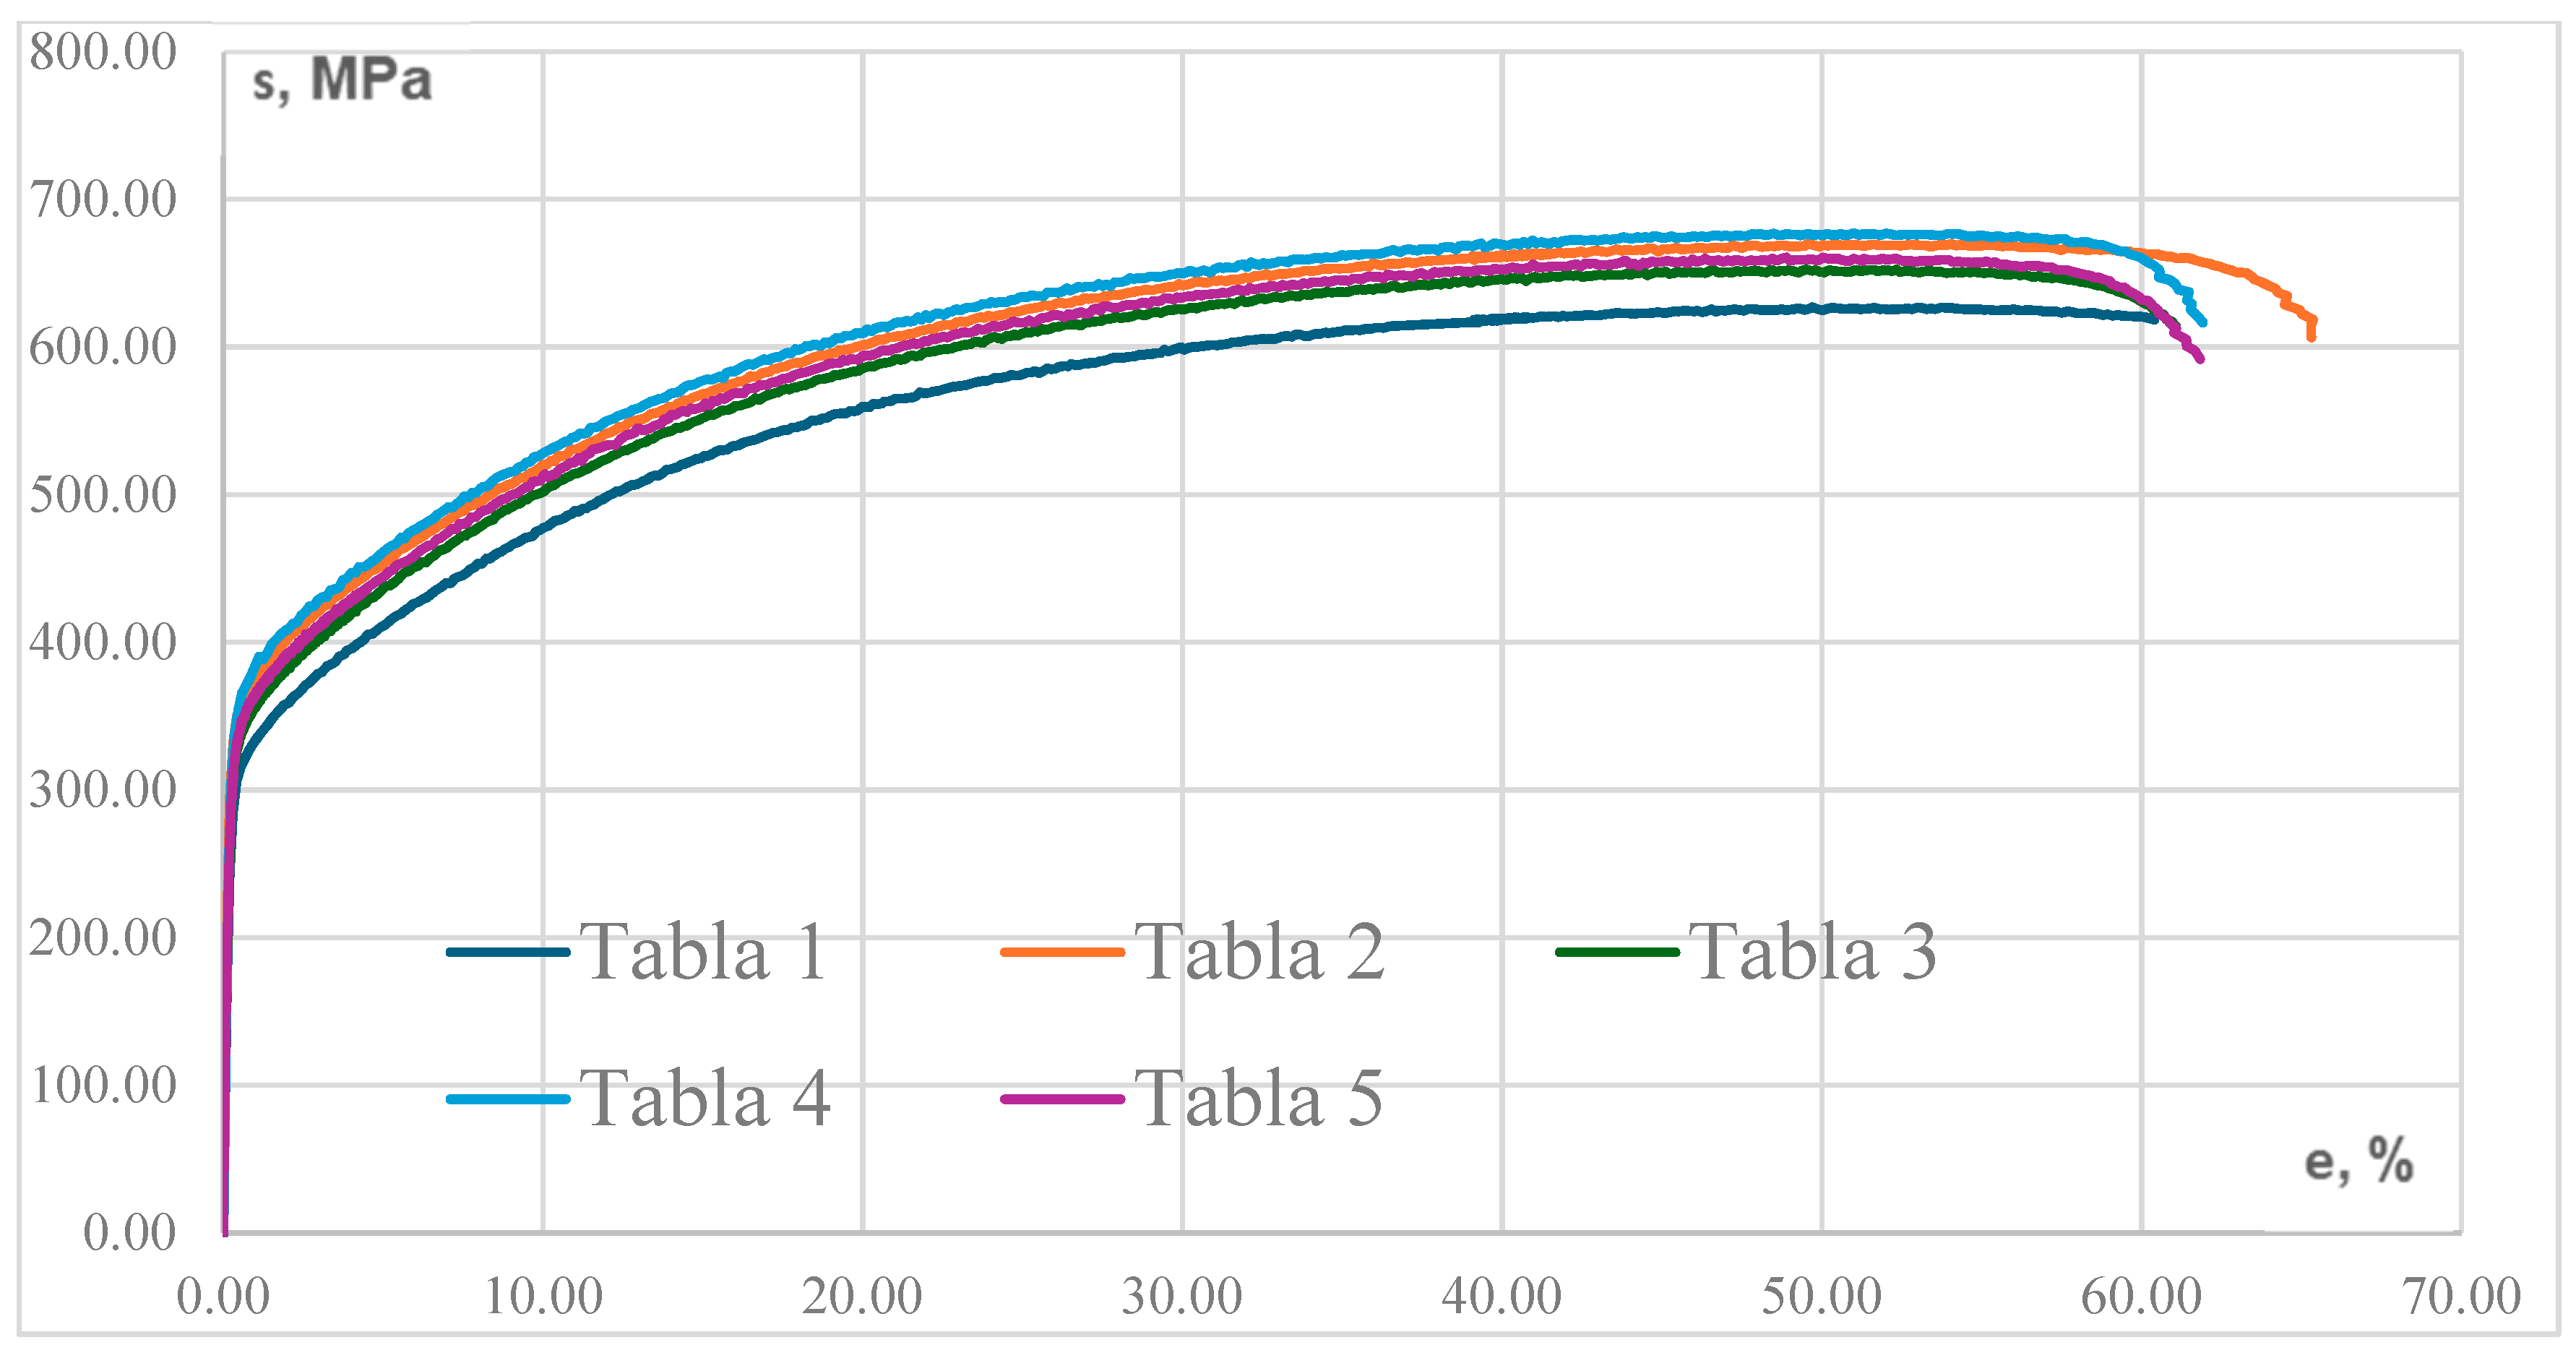
The mechanical properties of 316L stainless steel samples for the conventional T1–T5 series that were tested are represented by the stress–strain curve in
Figure 4. The modulus slightly varies between samples which indicates stiffness consistency and shows sample stress and strain. The samples yielding stress also vary; therefore, each curve deviates from linearity at a slightly different stress level, moderately generating stability.
After yielding, plastic deformation occurs until the material reaches its maximum tensile strength. The samples reach higher UTS before necking and breaking. High material consistency.
Endpoint of curve shows material necking and fracture. The curves’ horizontal extension before dropping off shows constant ductility across samples.
After the tensile tests were performed, the resulting parts and a unfractured sample were analysed using a Scanning Electron Microscope (SEM) to observe and document identified microstructural changes and failure mechanisms induced by mechanical deformation. The analysis was performed at various magnifications to provide a understanding of the material’s behaviour under stress, how the grain structure is affected and fracture characteristics [
8,
9,
10].
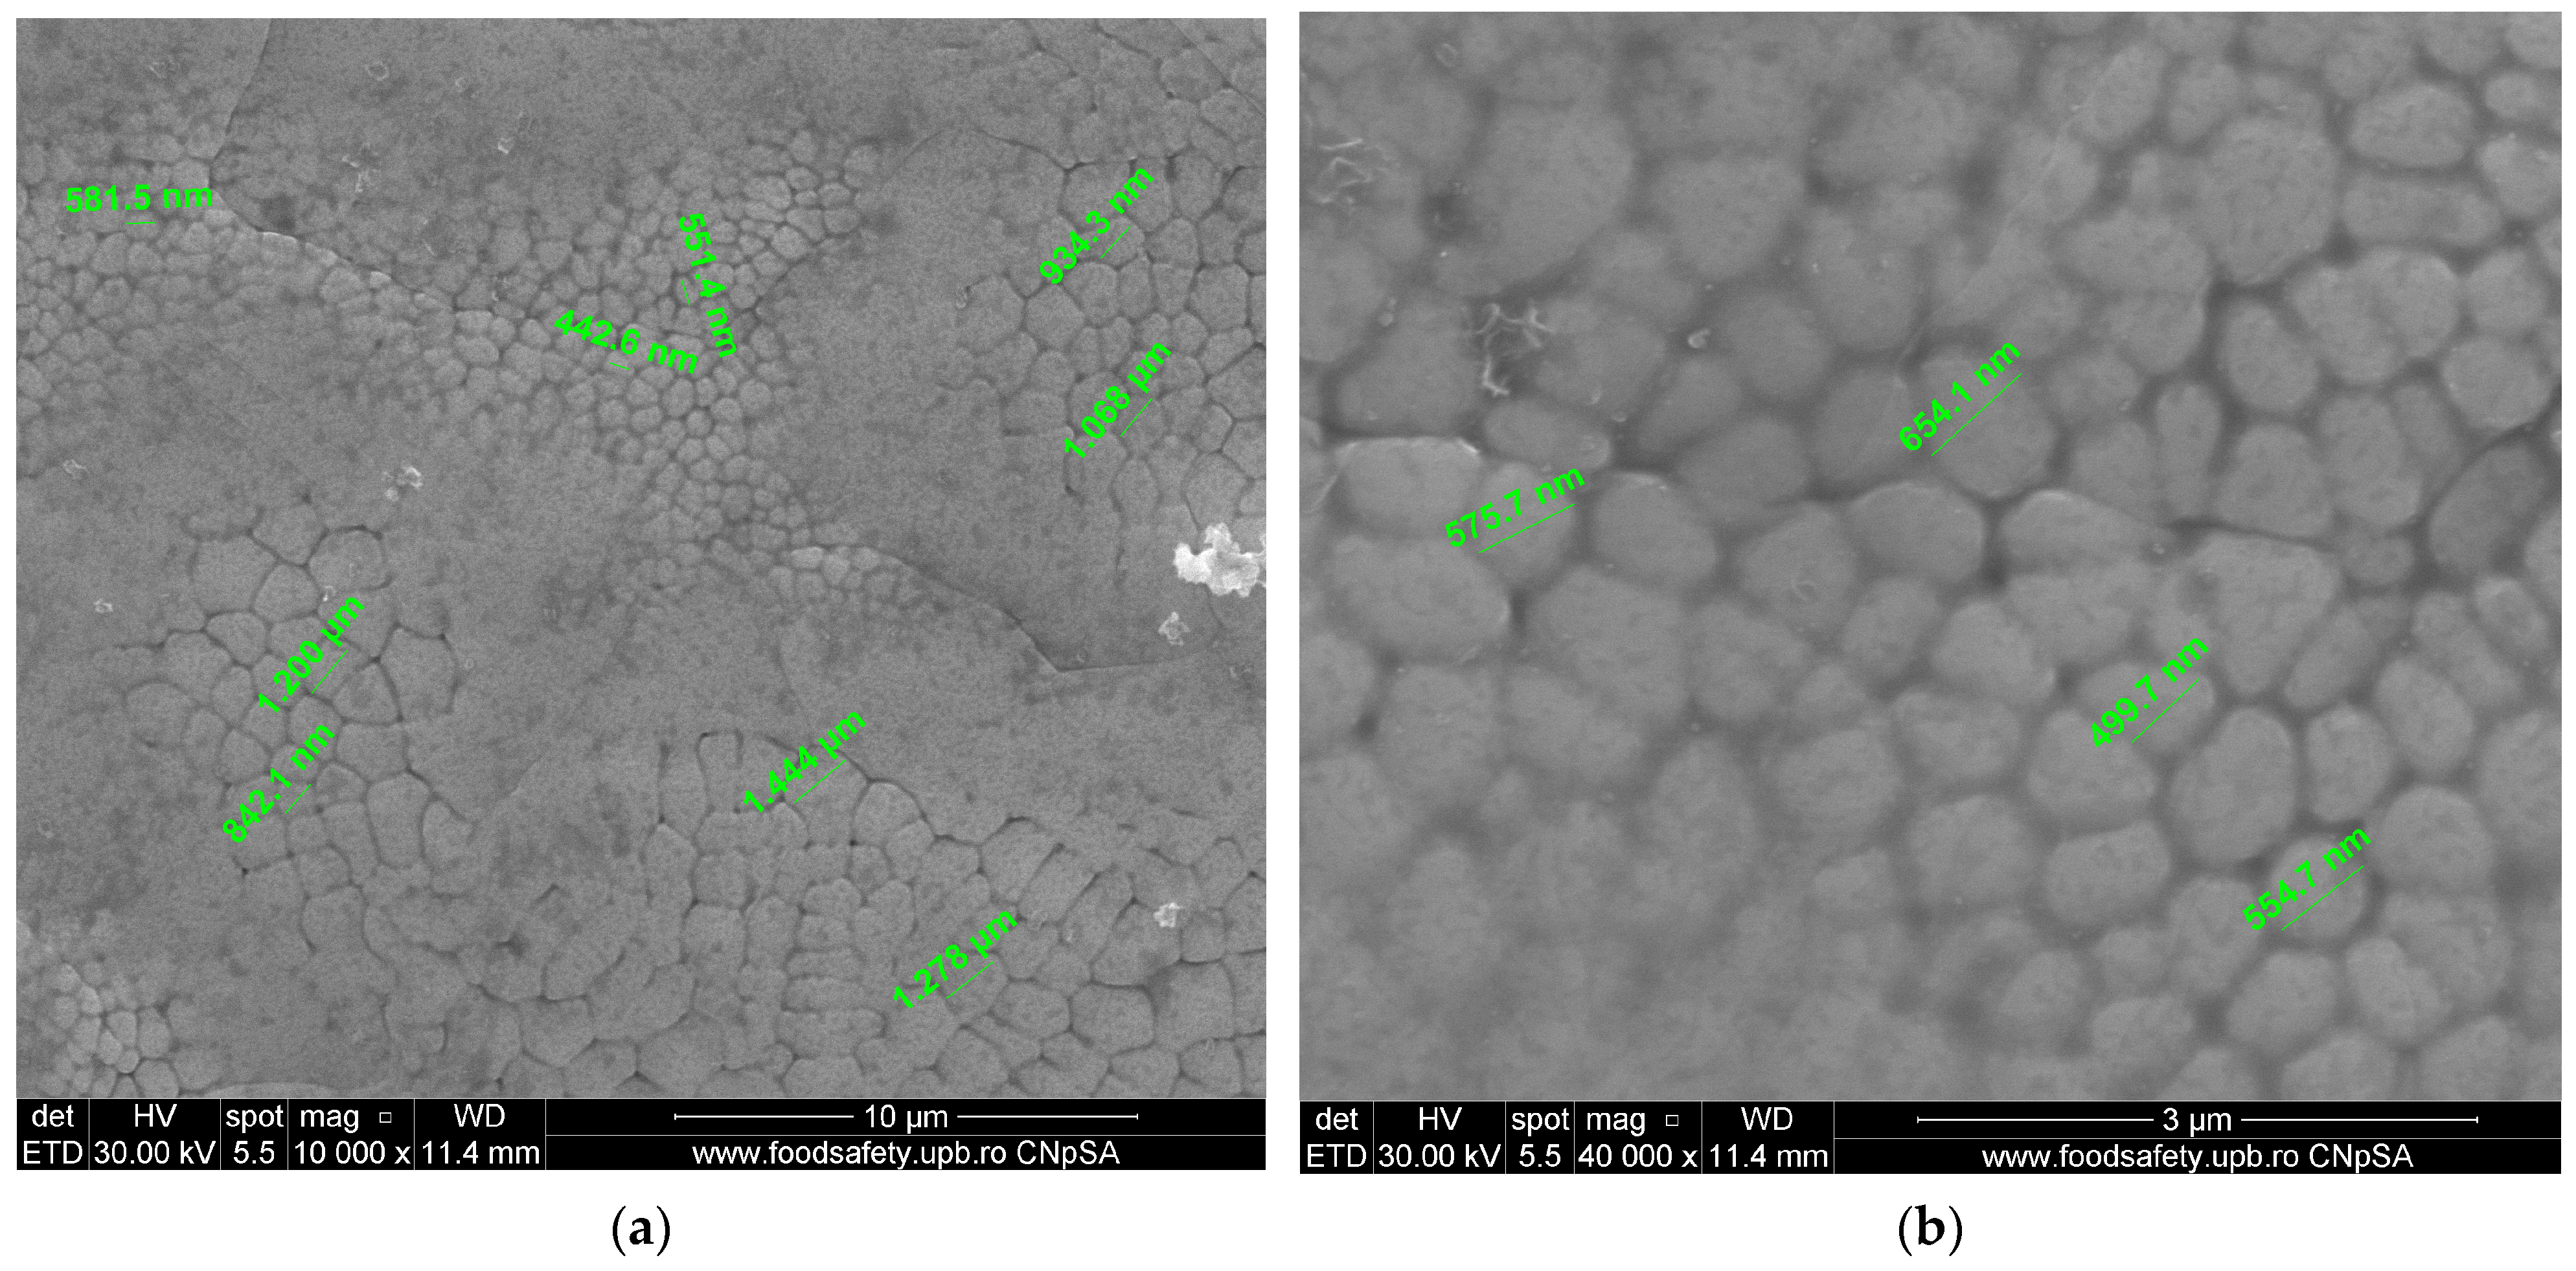
The scanning electron microscope (SEM) was utilised to examine the size and distribution of grains in an intact sample presented in
Figure 5. The analysis has been conducted at magnifications of 10,000× and 40,000×. The SEM images at a magnification of 10,000× revealed a uniform grain structure; however, the diameters of the grains exhibited variation, suggesting diversity. The measured grain sizes that are documented in
Table 7 indicate a non-uniform distribution, ranging from 442.6 nm to 1.444 µm. Under a magnification of 40,000×, scanning electron microscope (SEM) images revealed more detailed microstructural characteristics, including grain sizes ranging from 499.7 to 654.1 nanometres. At both magnifications, the grain size distribution was a mixture of fine and coarse grains.
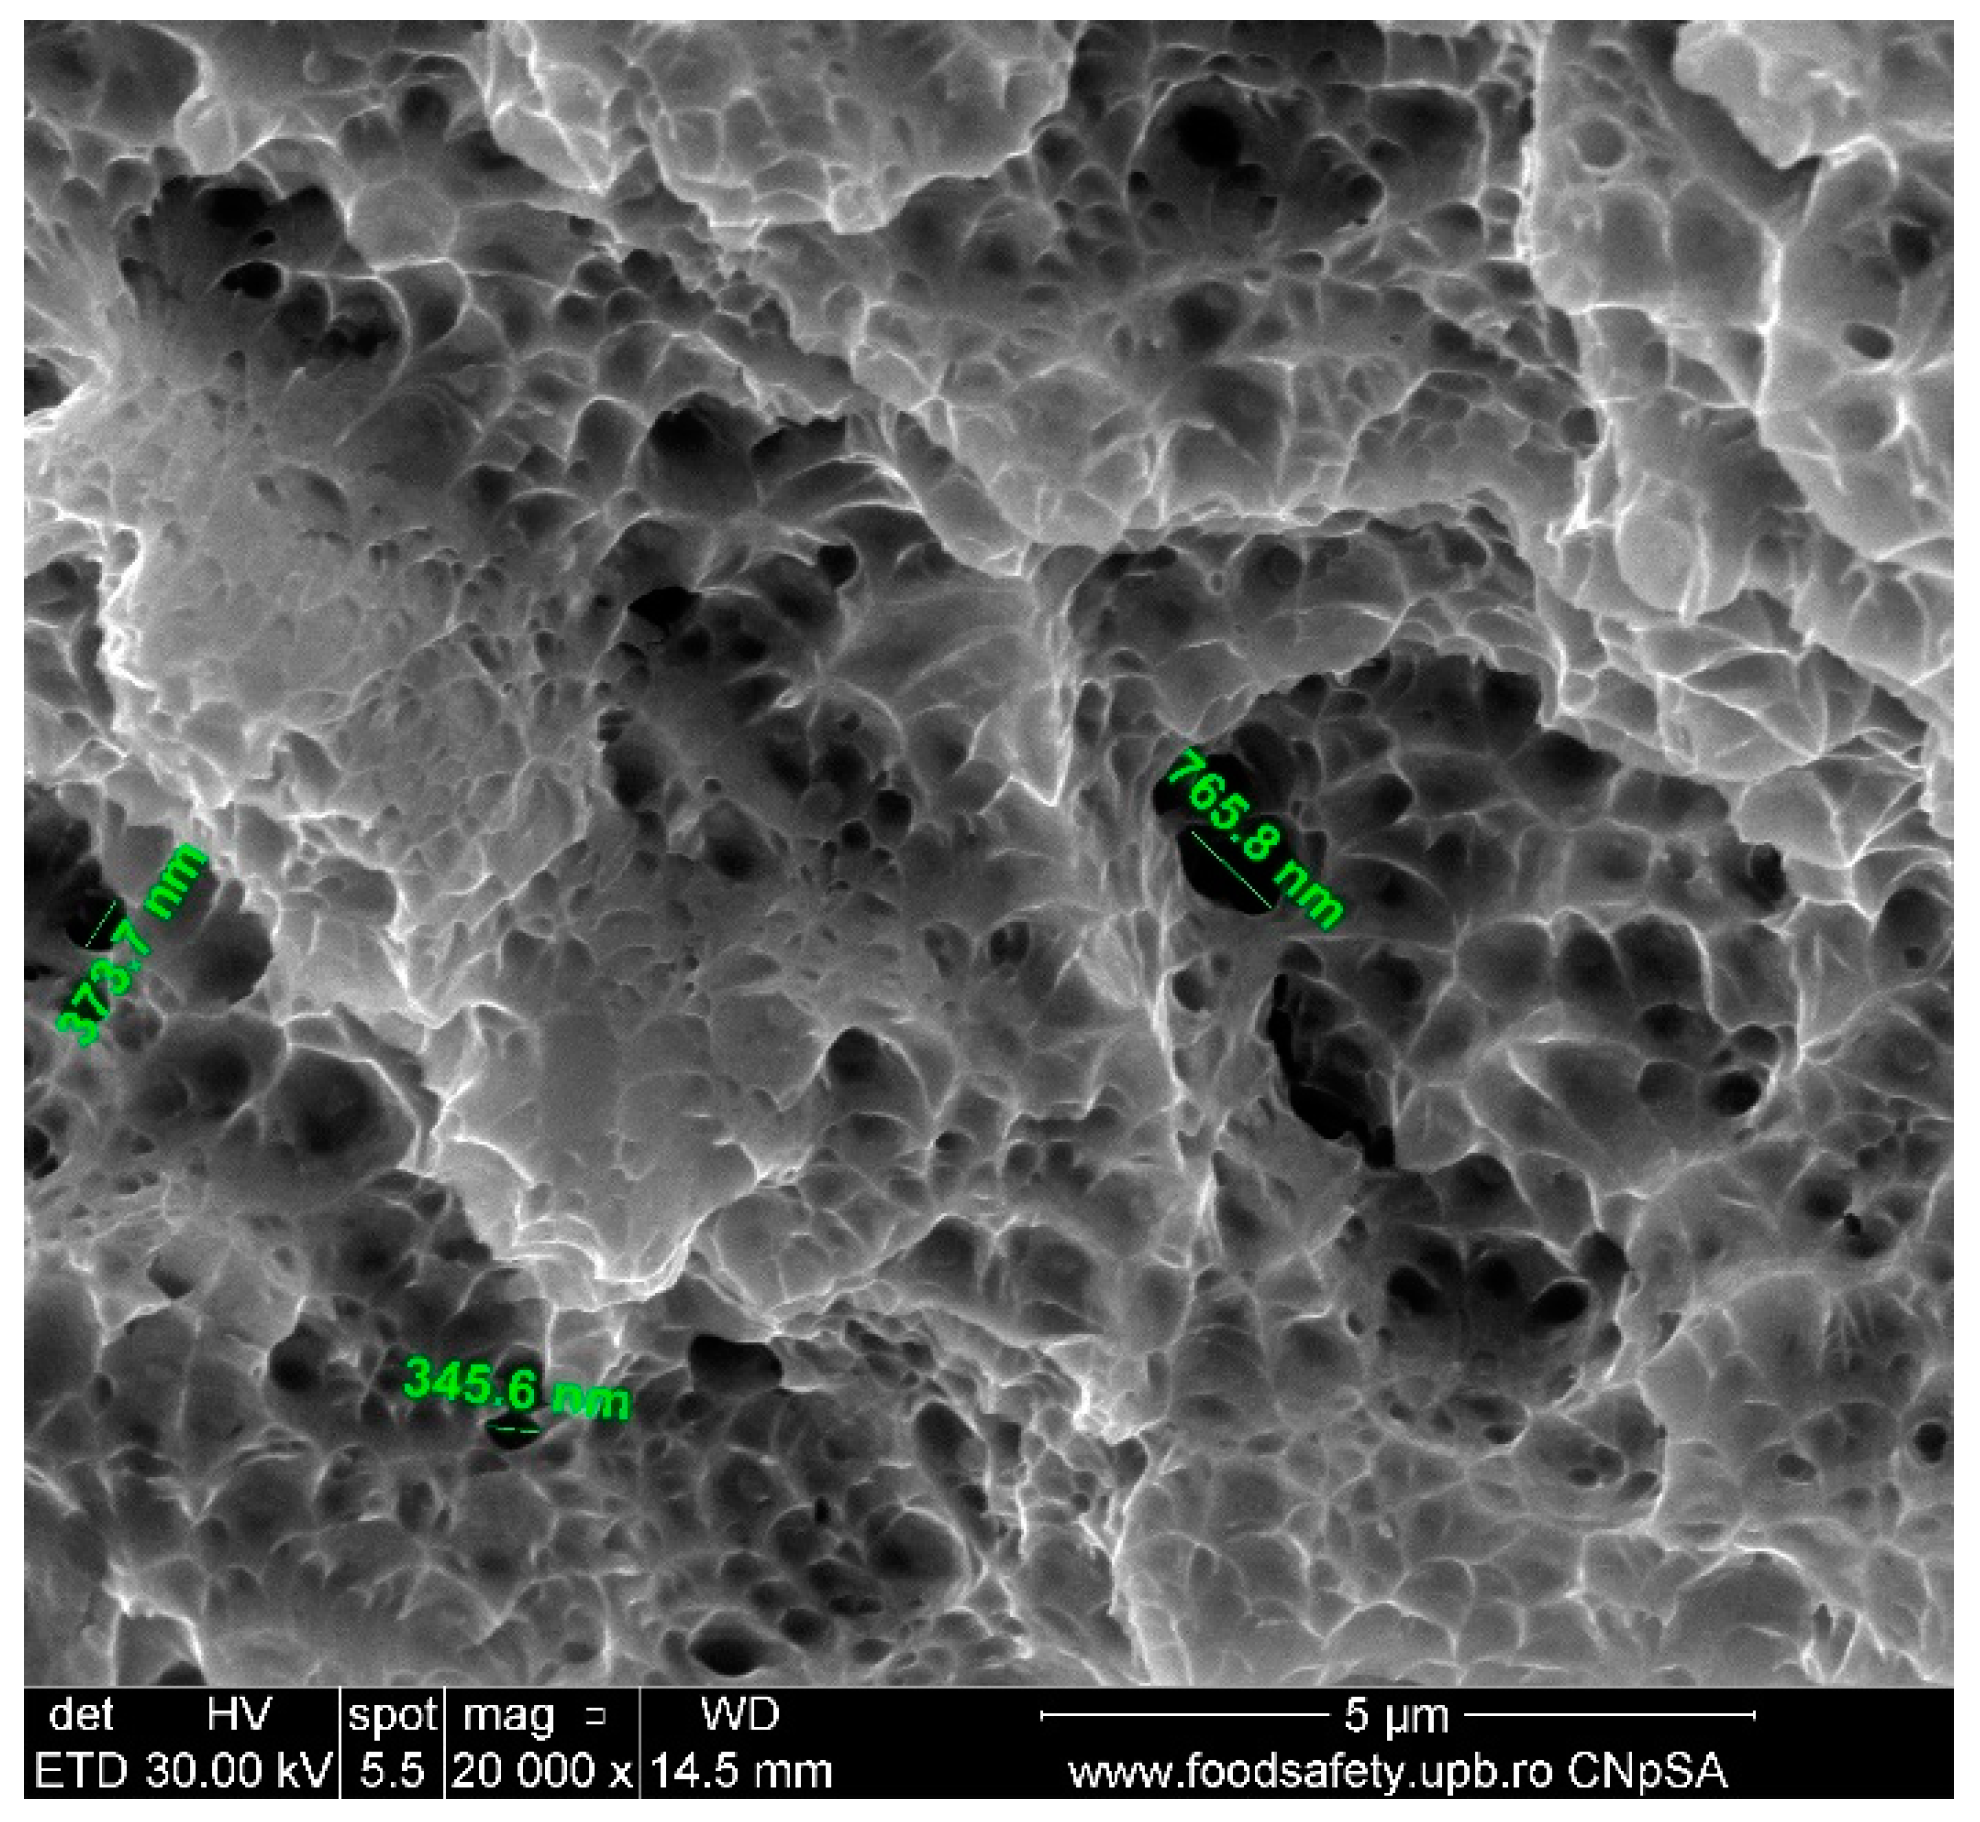
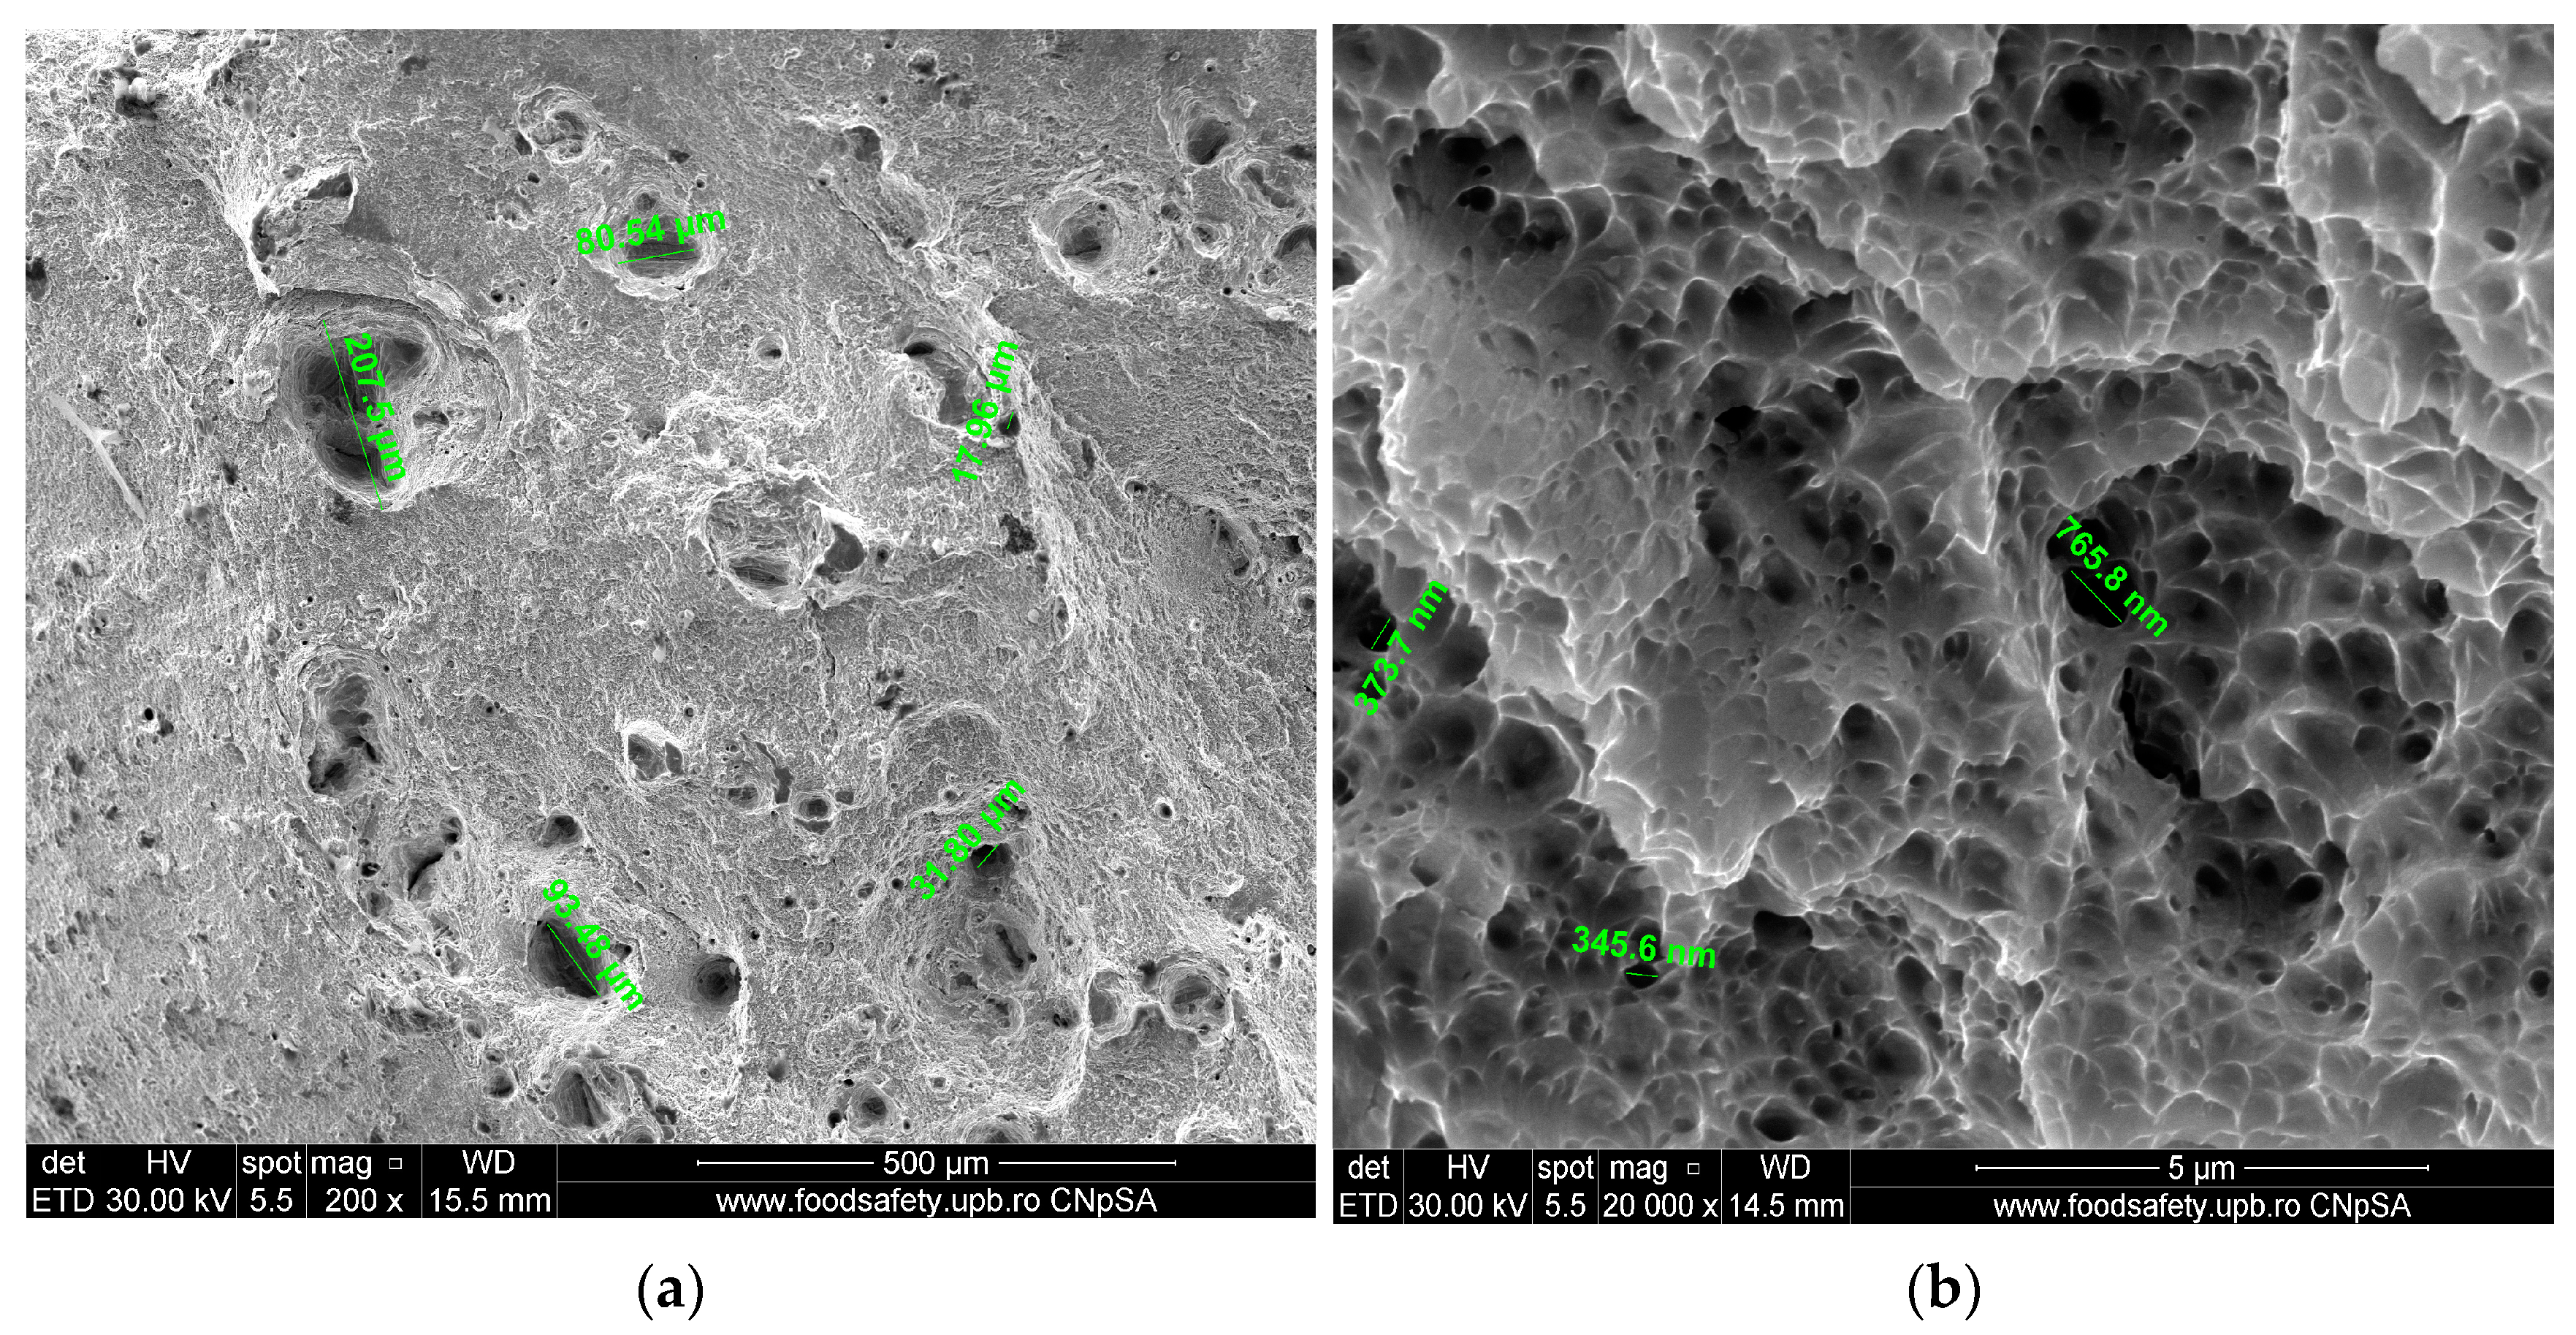
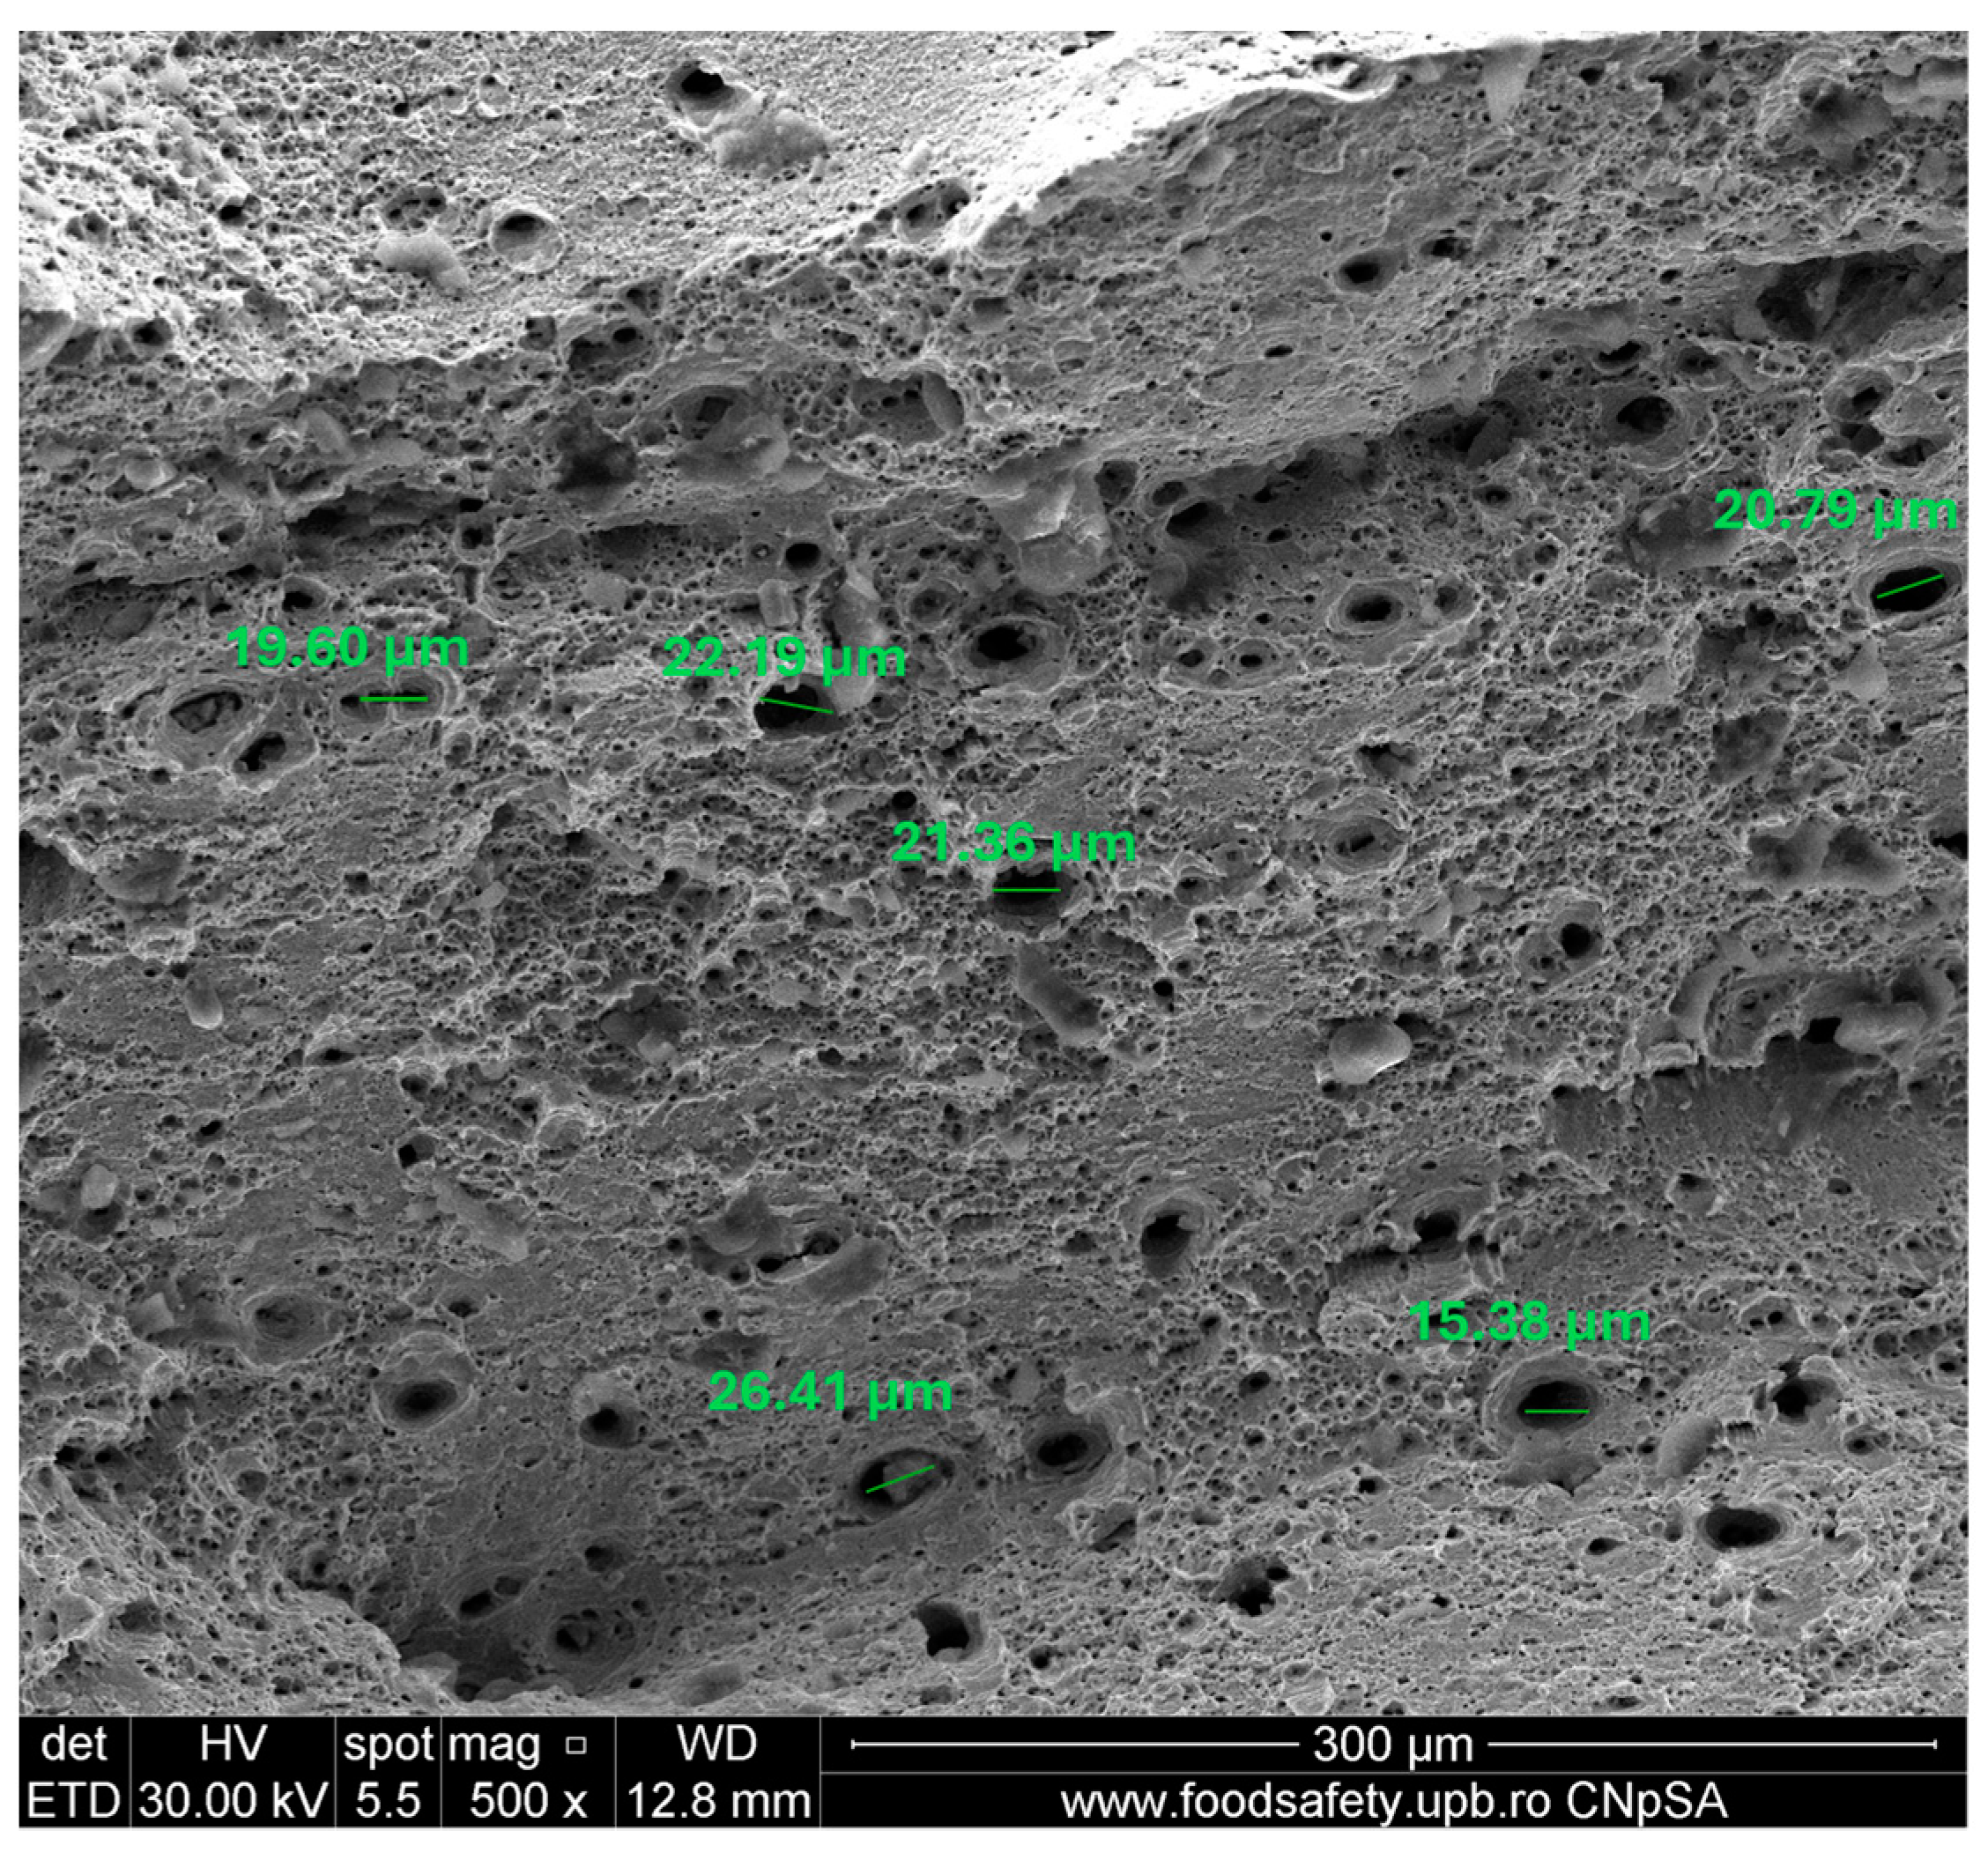
A scanning electron microscopy (SEM) investigation of the fragmented specimen E5 was conducted, and the results are centralised in
Table 8. Sample E5, presented in
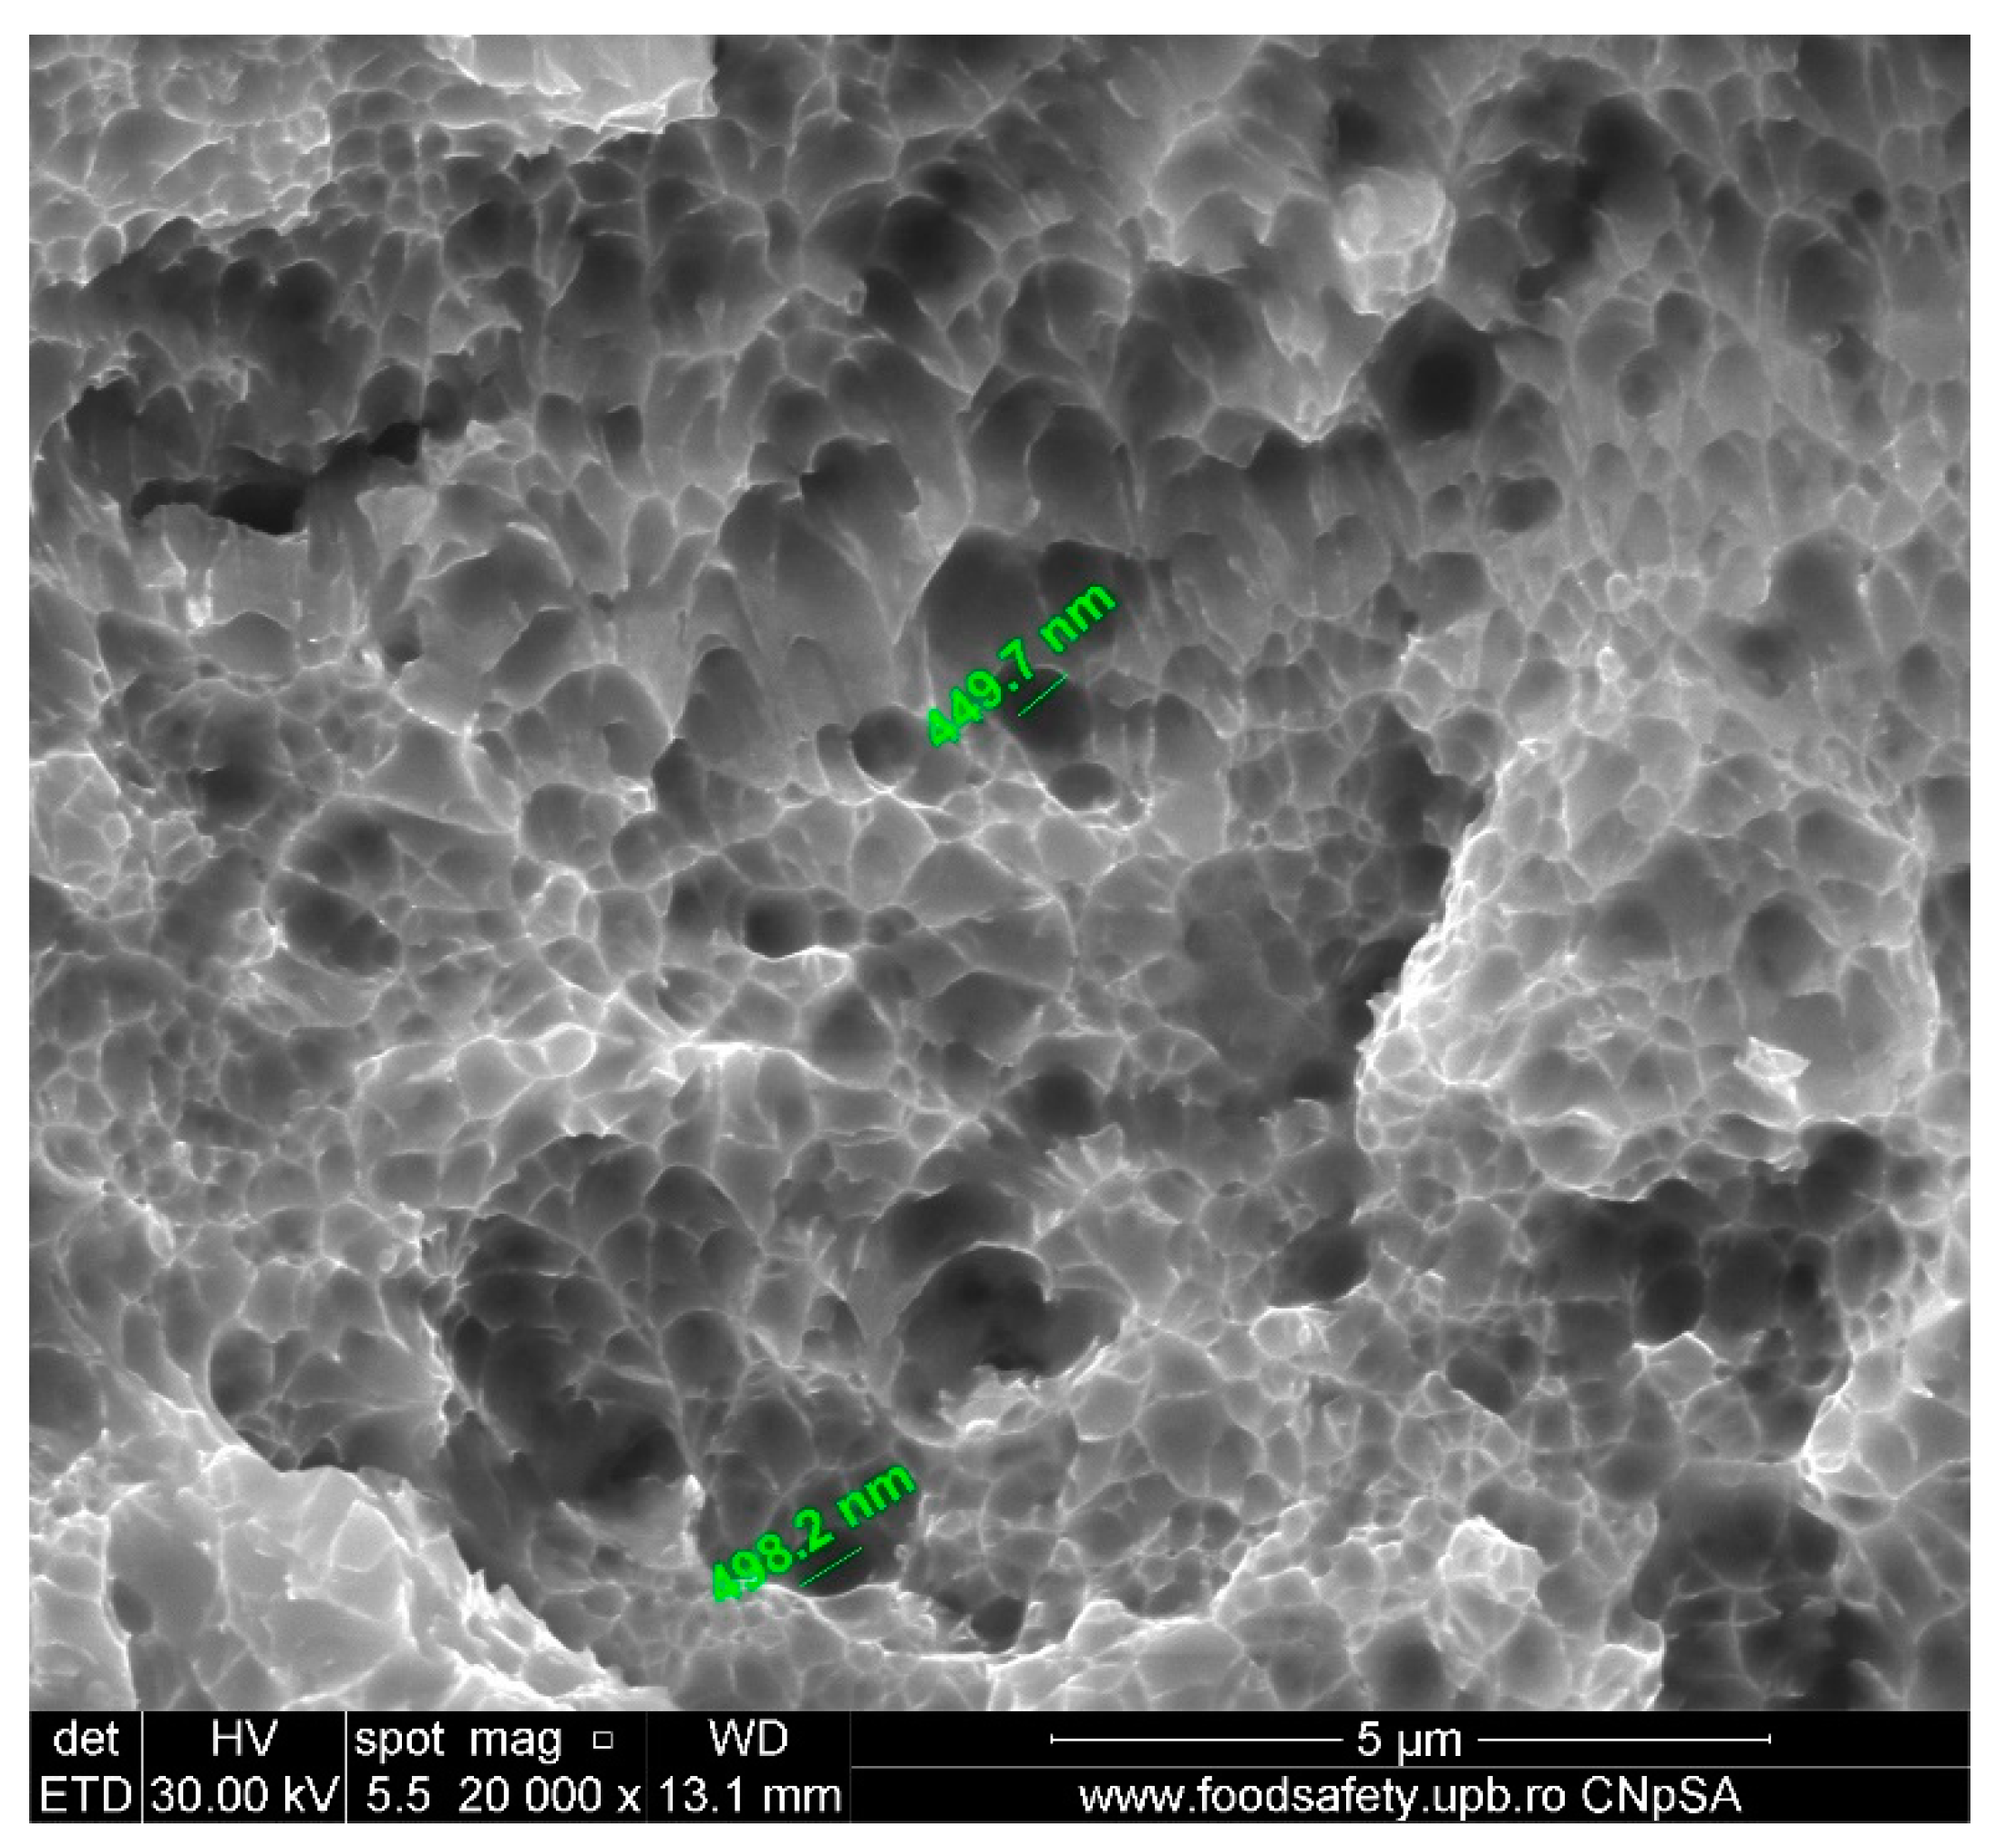
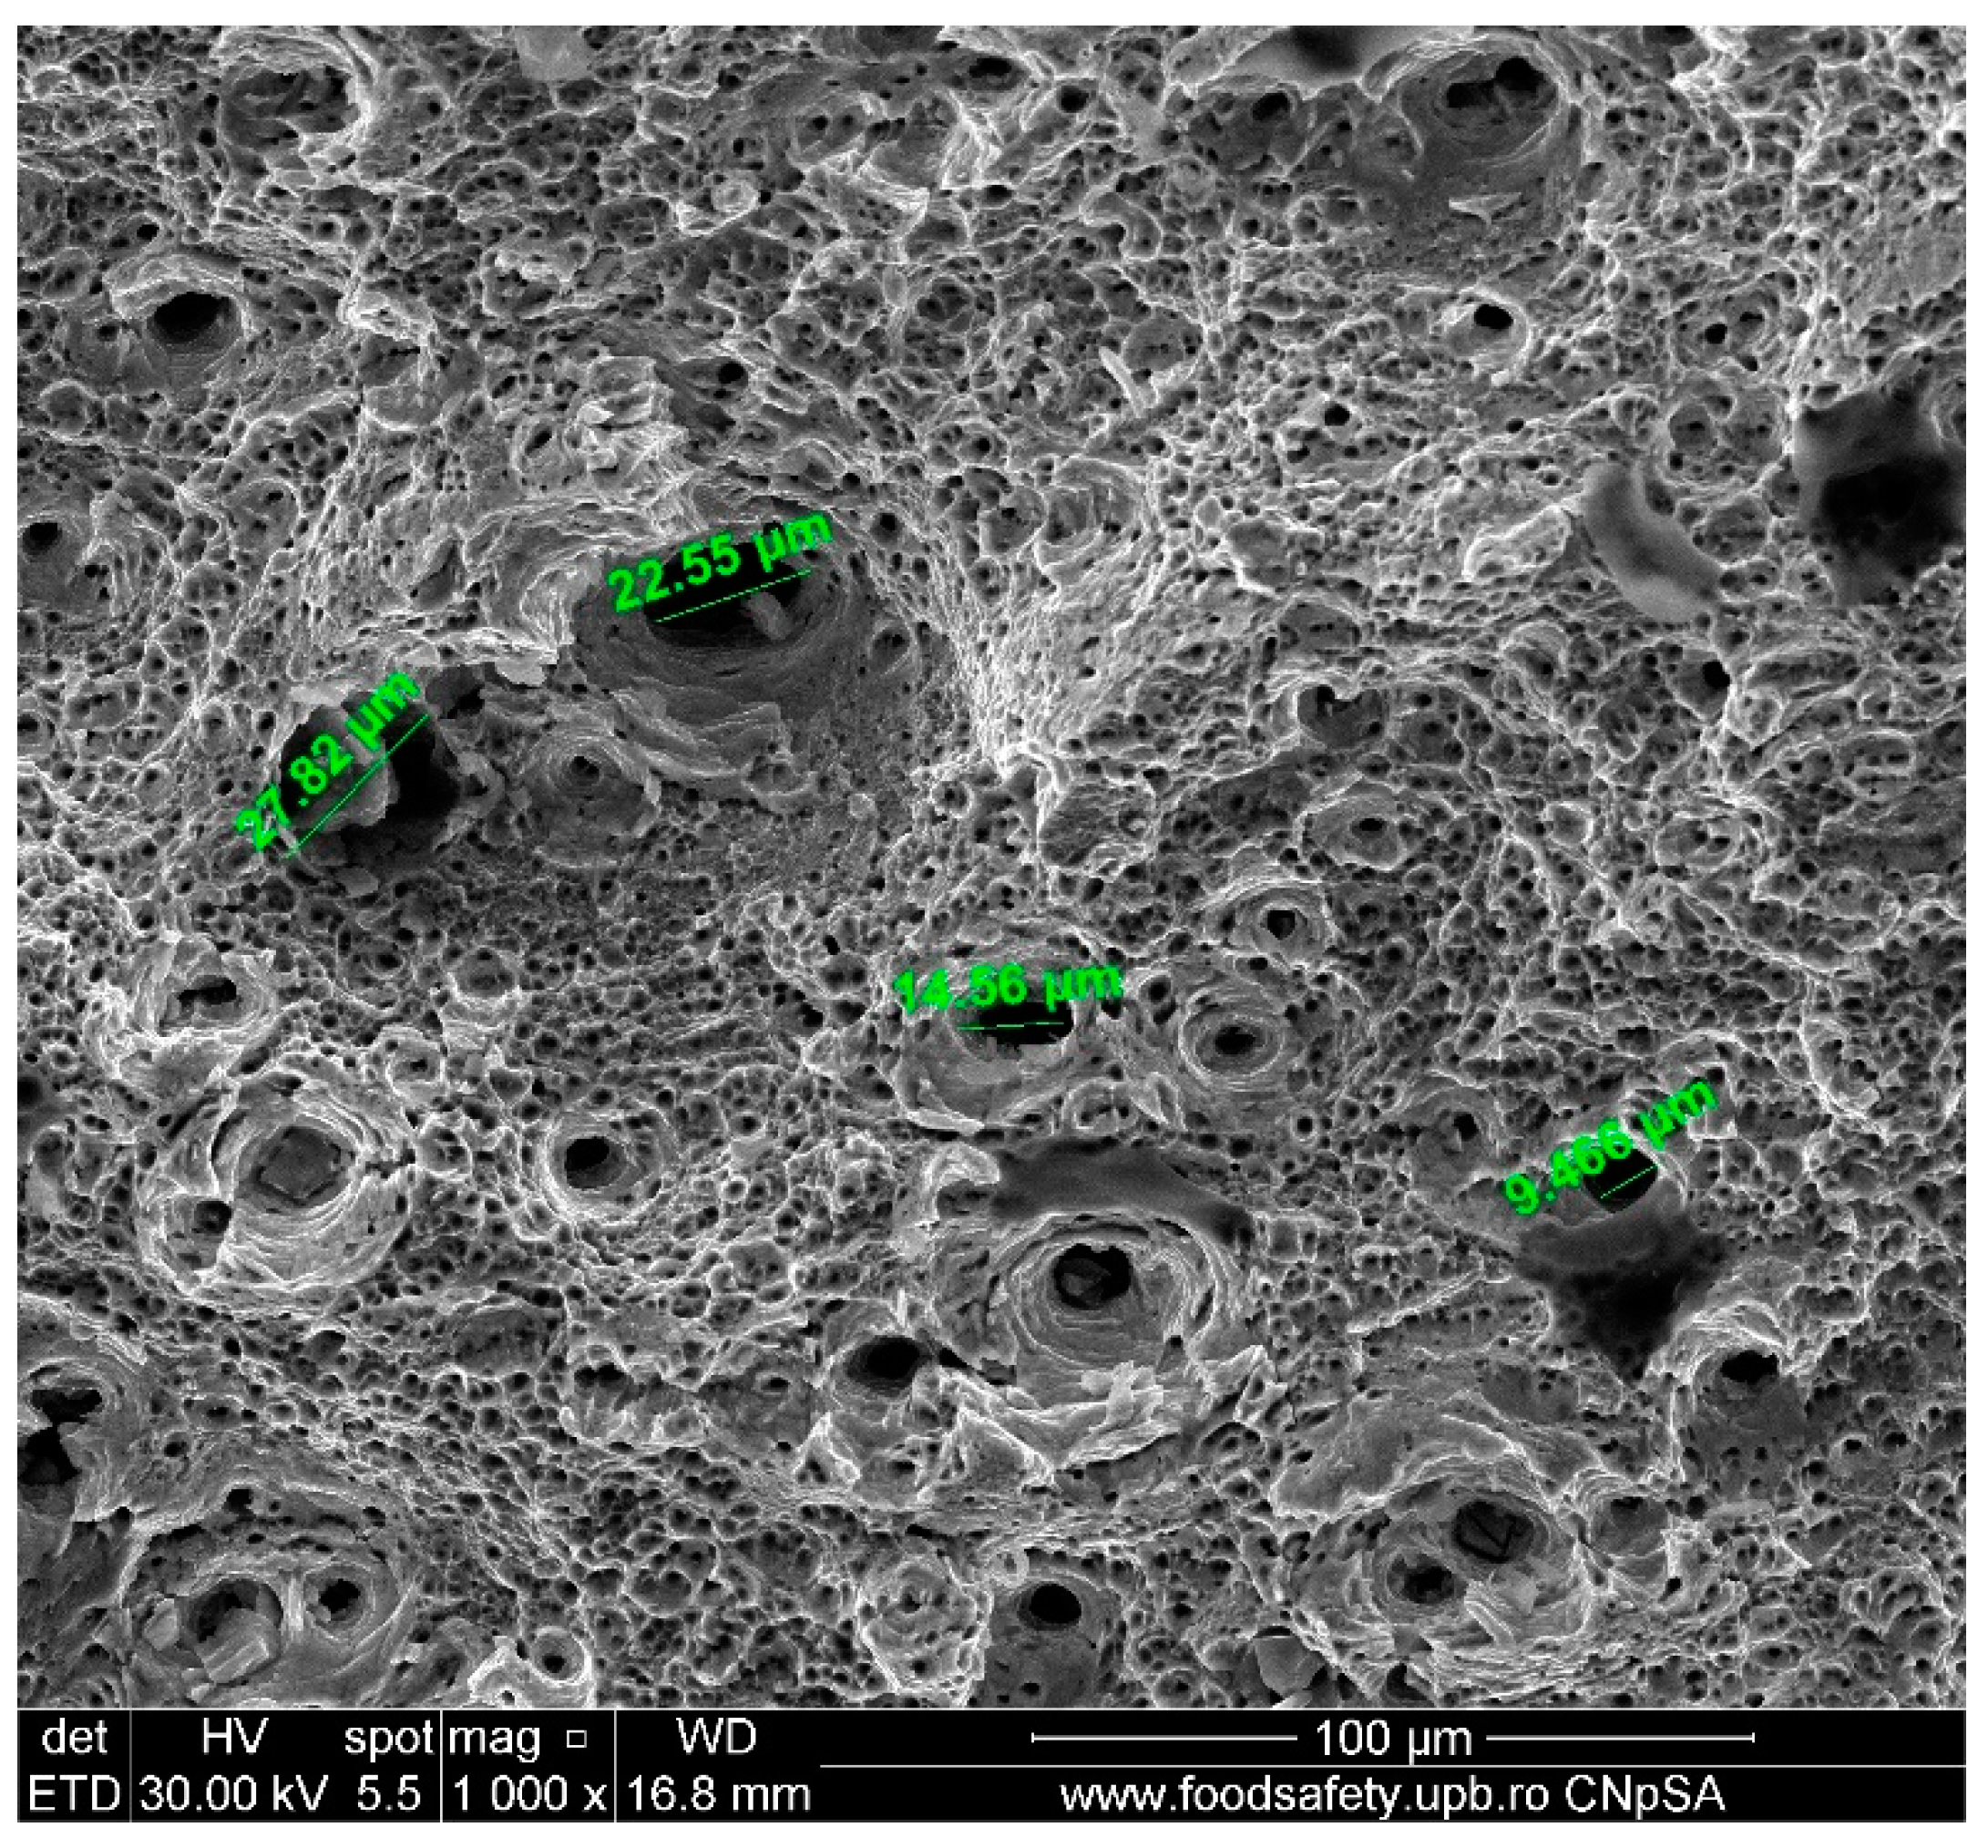
Figure 6, demonstrates a ductile fracture mechanism that is characterised by the creation and merging of empty spaces. The scanning electron microscope (SEM) image, magnified at 20,000 times, reveals cavities of different diameters, suggesting substantial plastic deformation prior to failure. The existence of a coarse pitted fracture surface provides additional evidence of ductile fracture characteristics. The distribution of voids is not uniform, indicating the existence of stress concentrators that triggered the formation of voids. The empty spaces’ different dimensions show the presence of both minor and major deformation causes. The material’s microstructure, which includes factors such as grain size and the presence of inclusions or faults, can have an impact on the size and distribution of voids. The presence of voids and the appearance of the fracture surface suggest that the material possesses high fracture toughness and the capacity to absorb energy by undergoing plastic deformation.
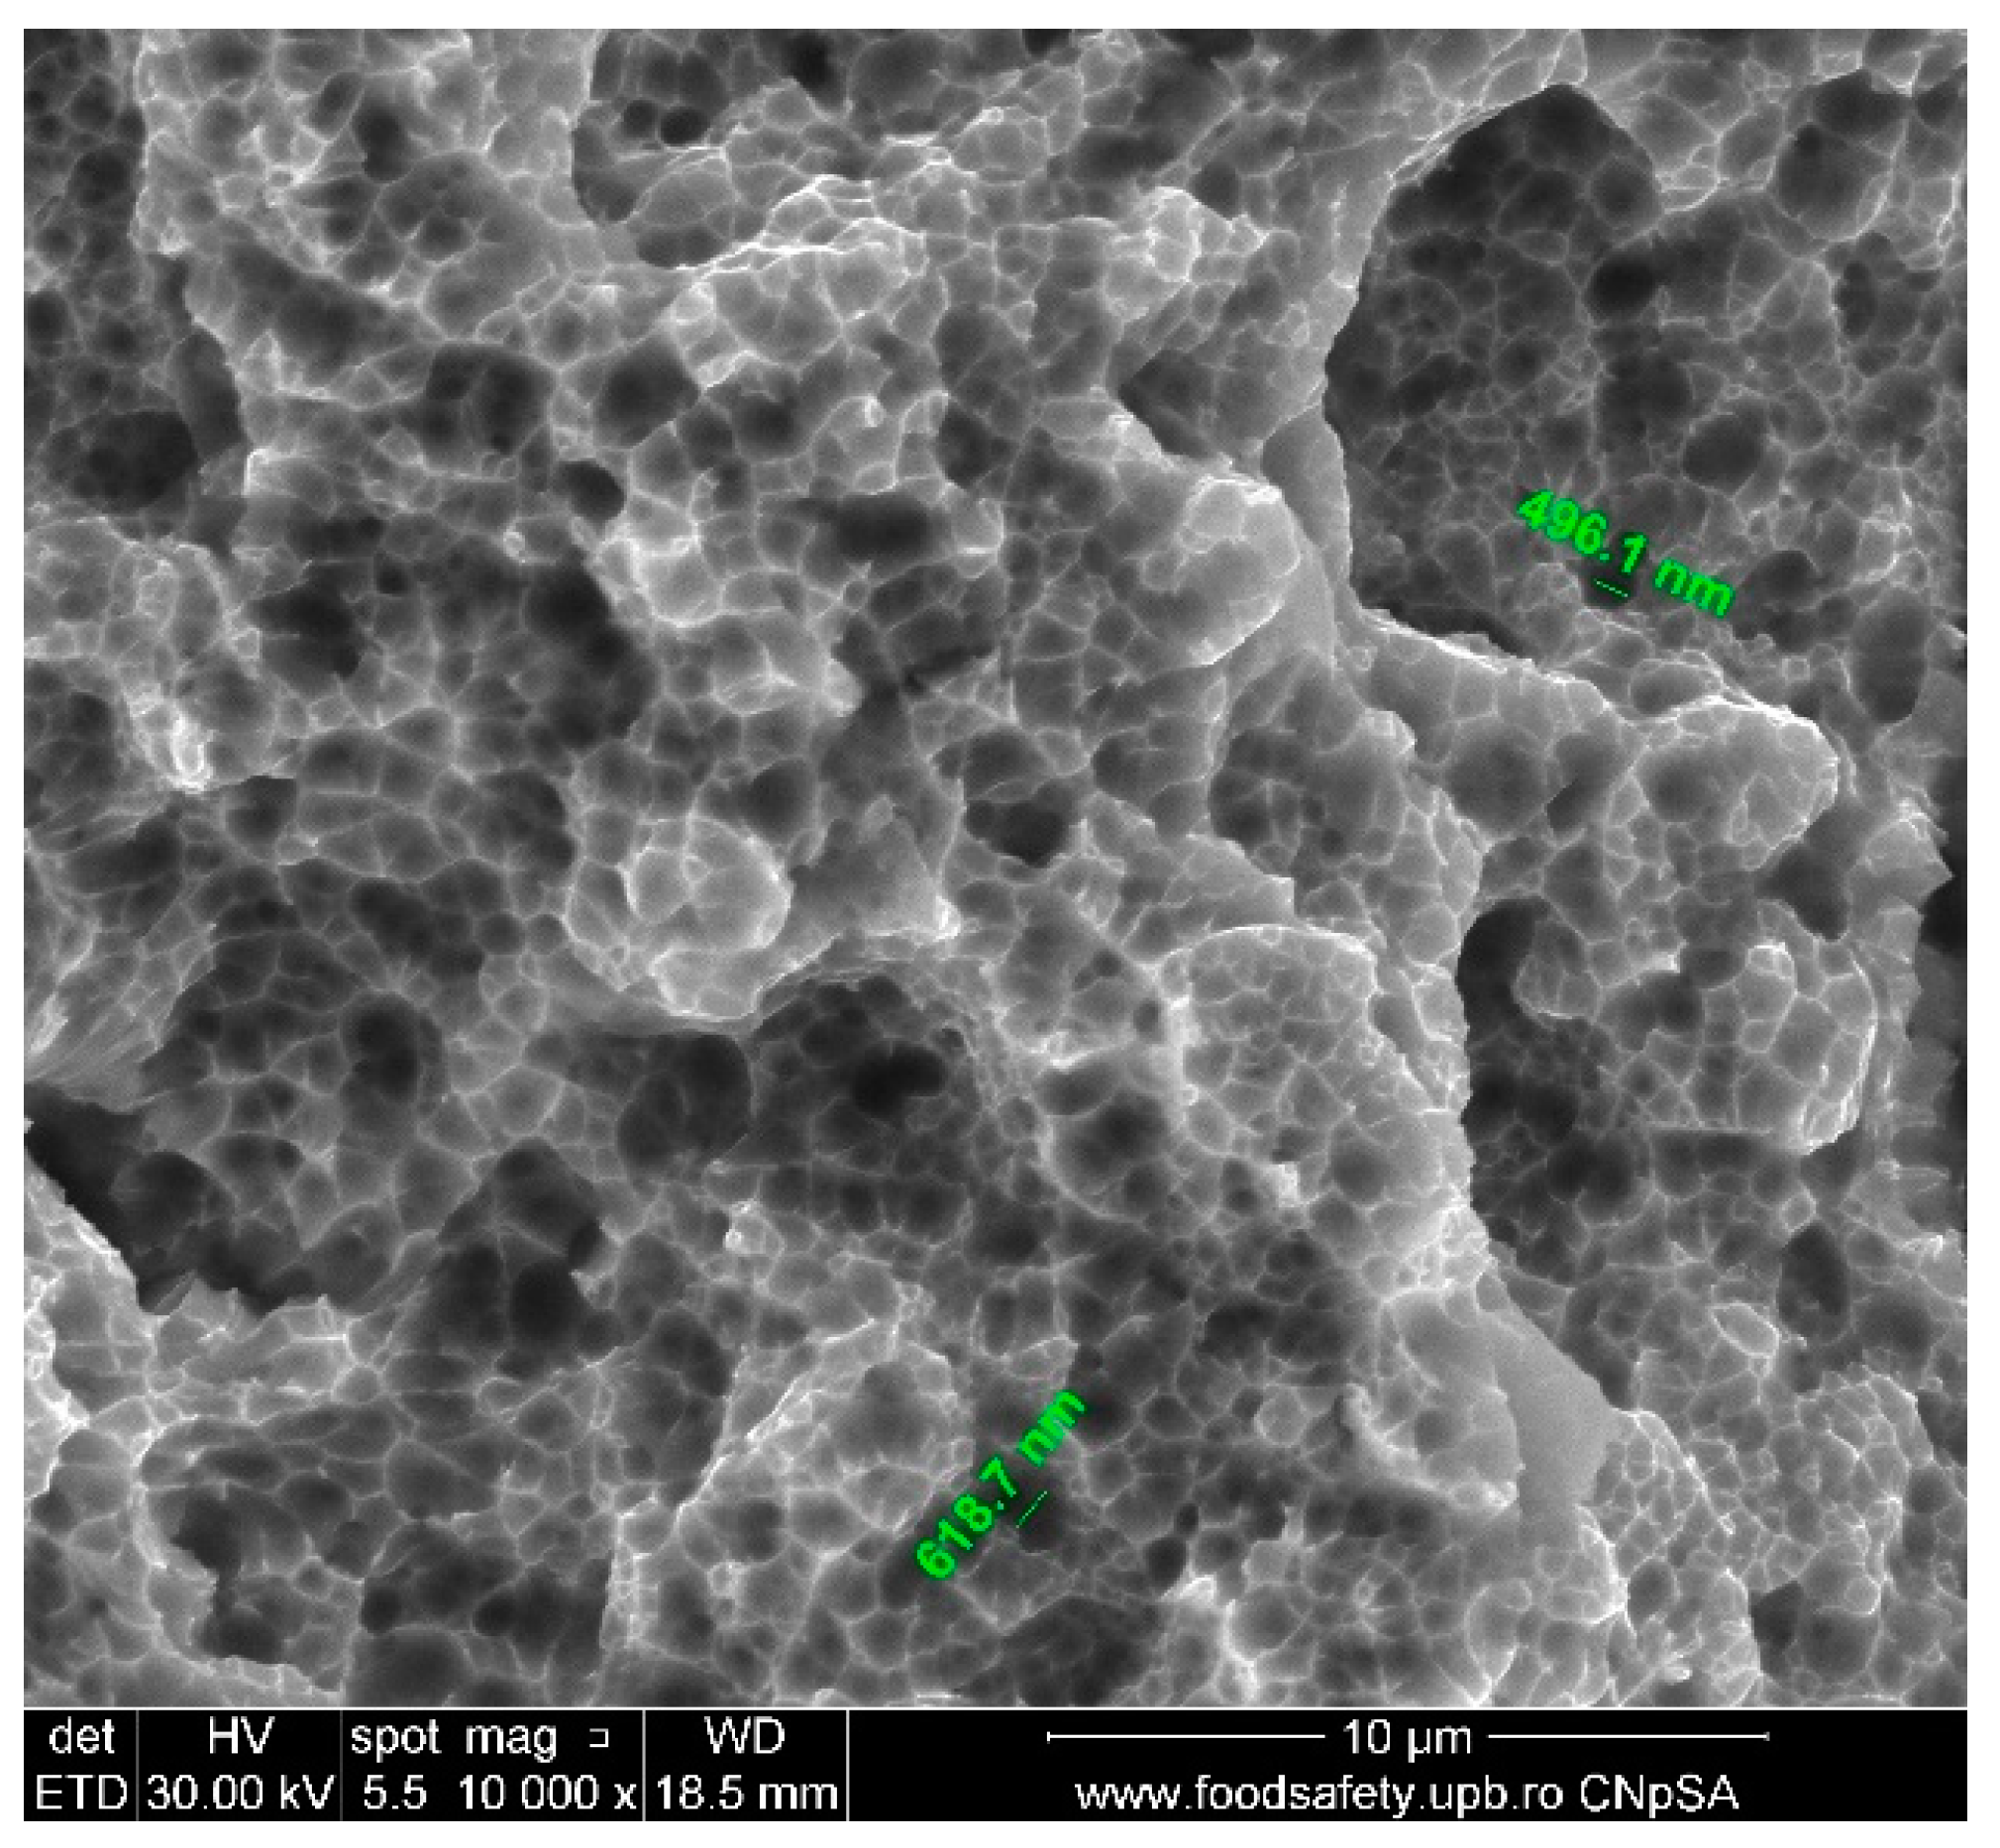
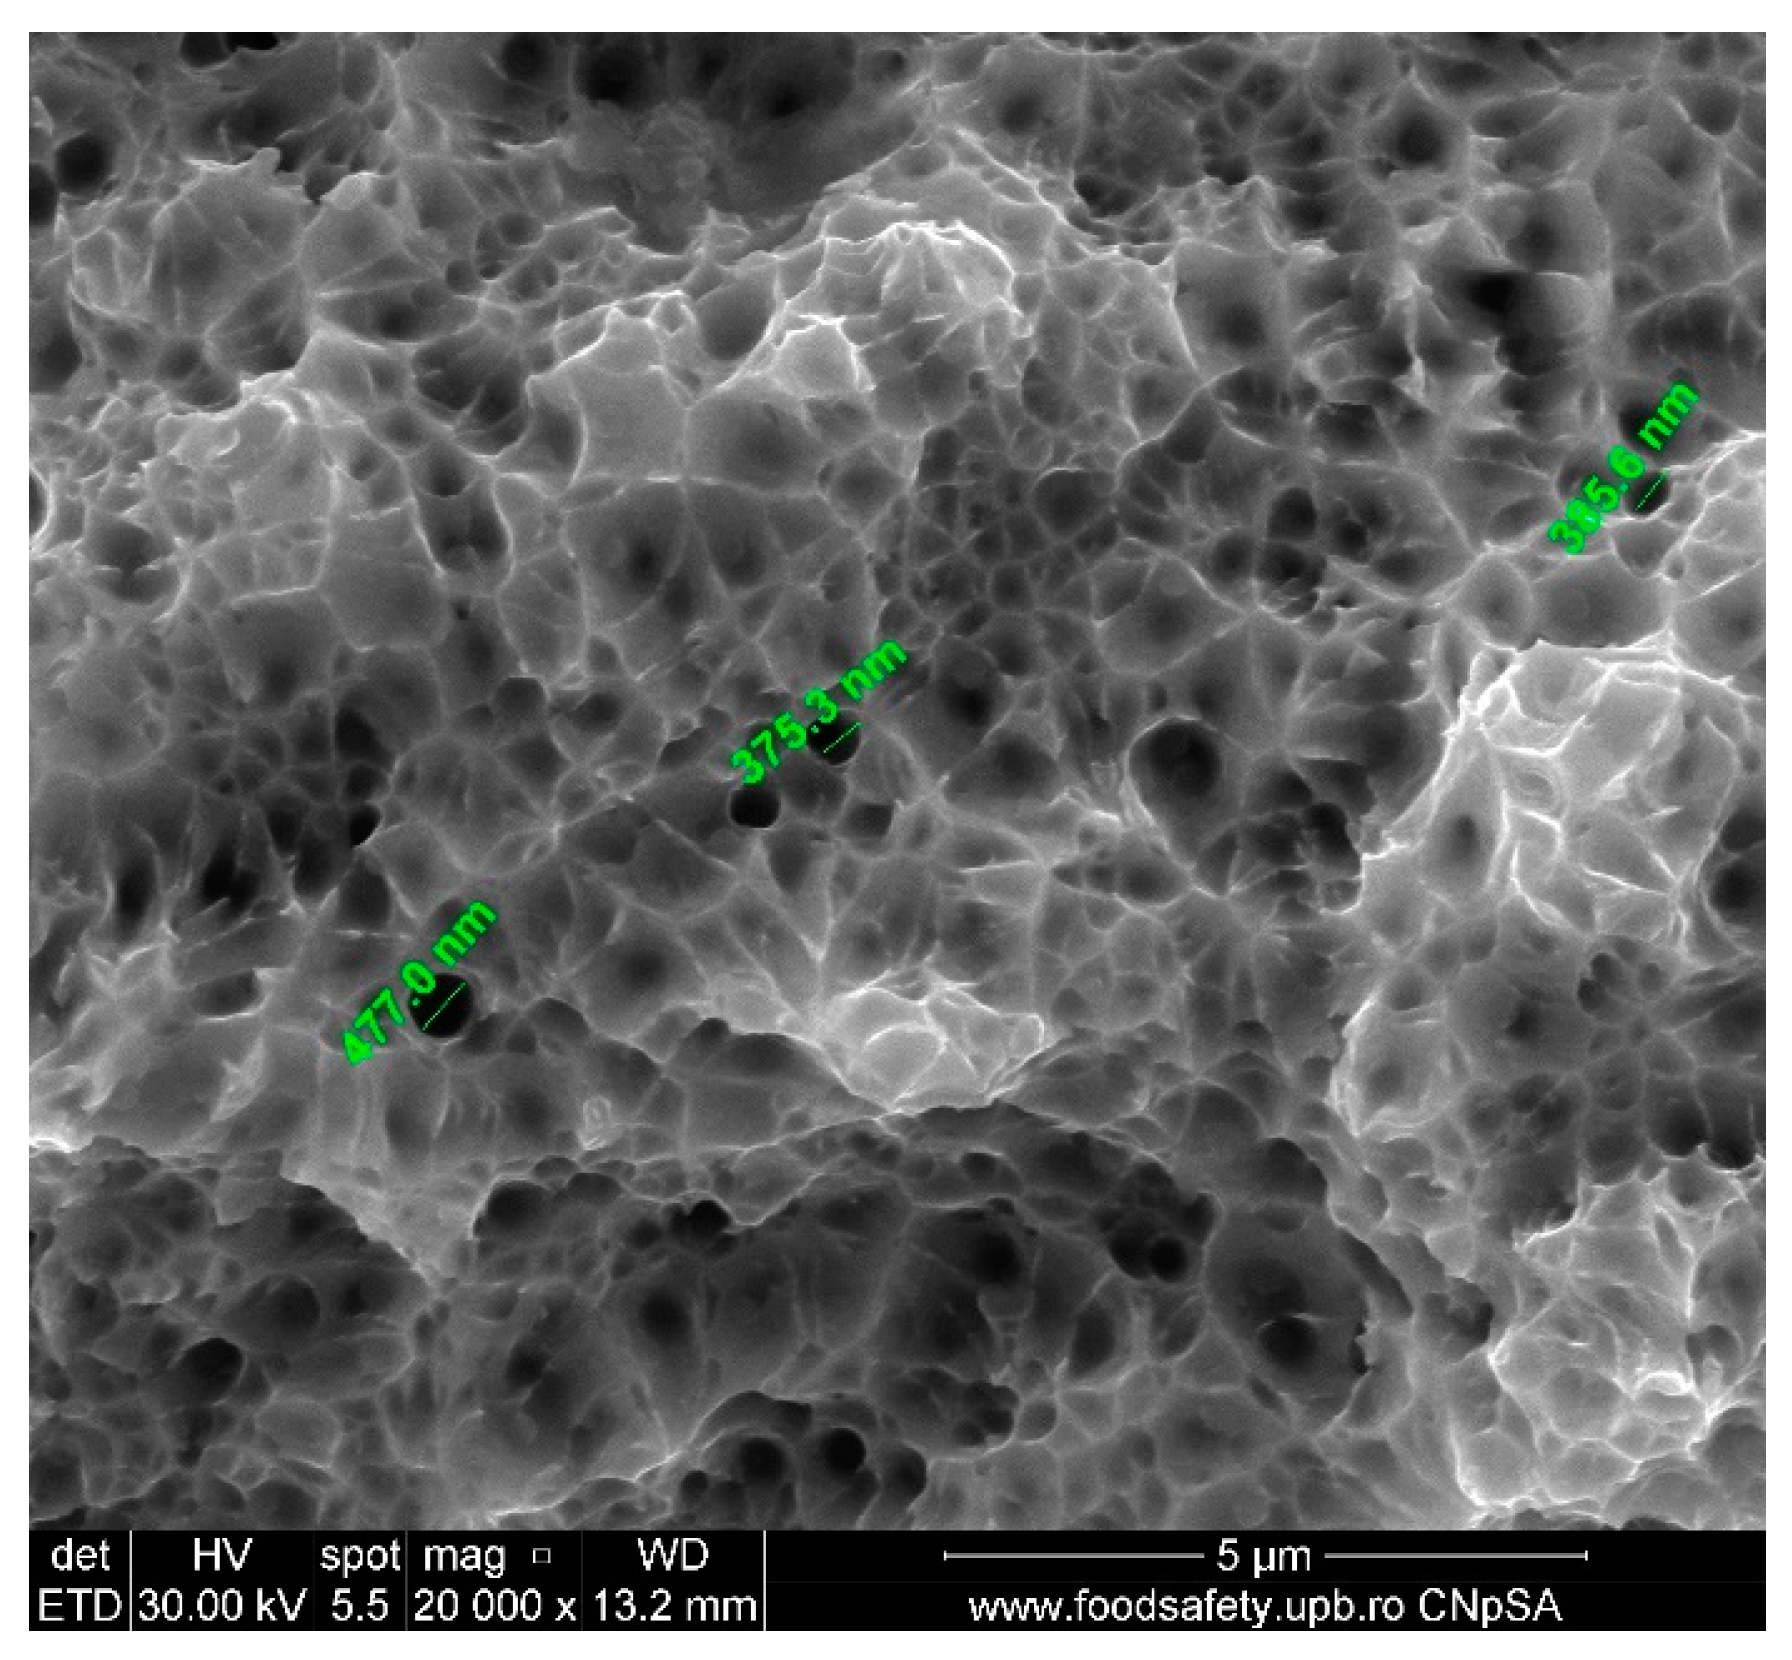
The fractured AM sample E1’s SEM image, presented in
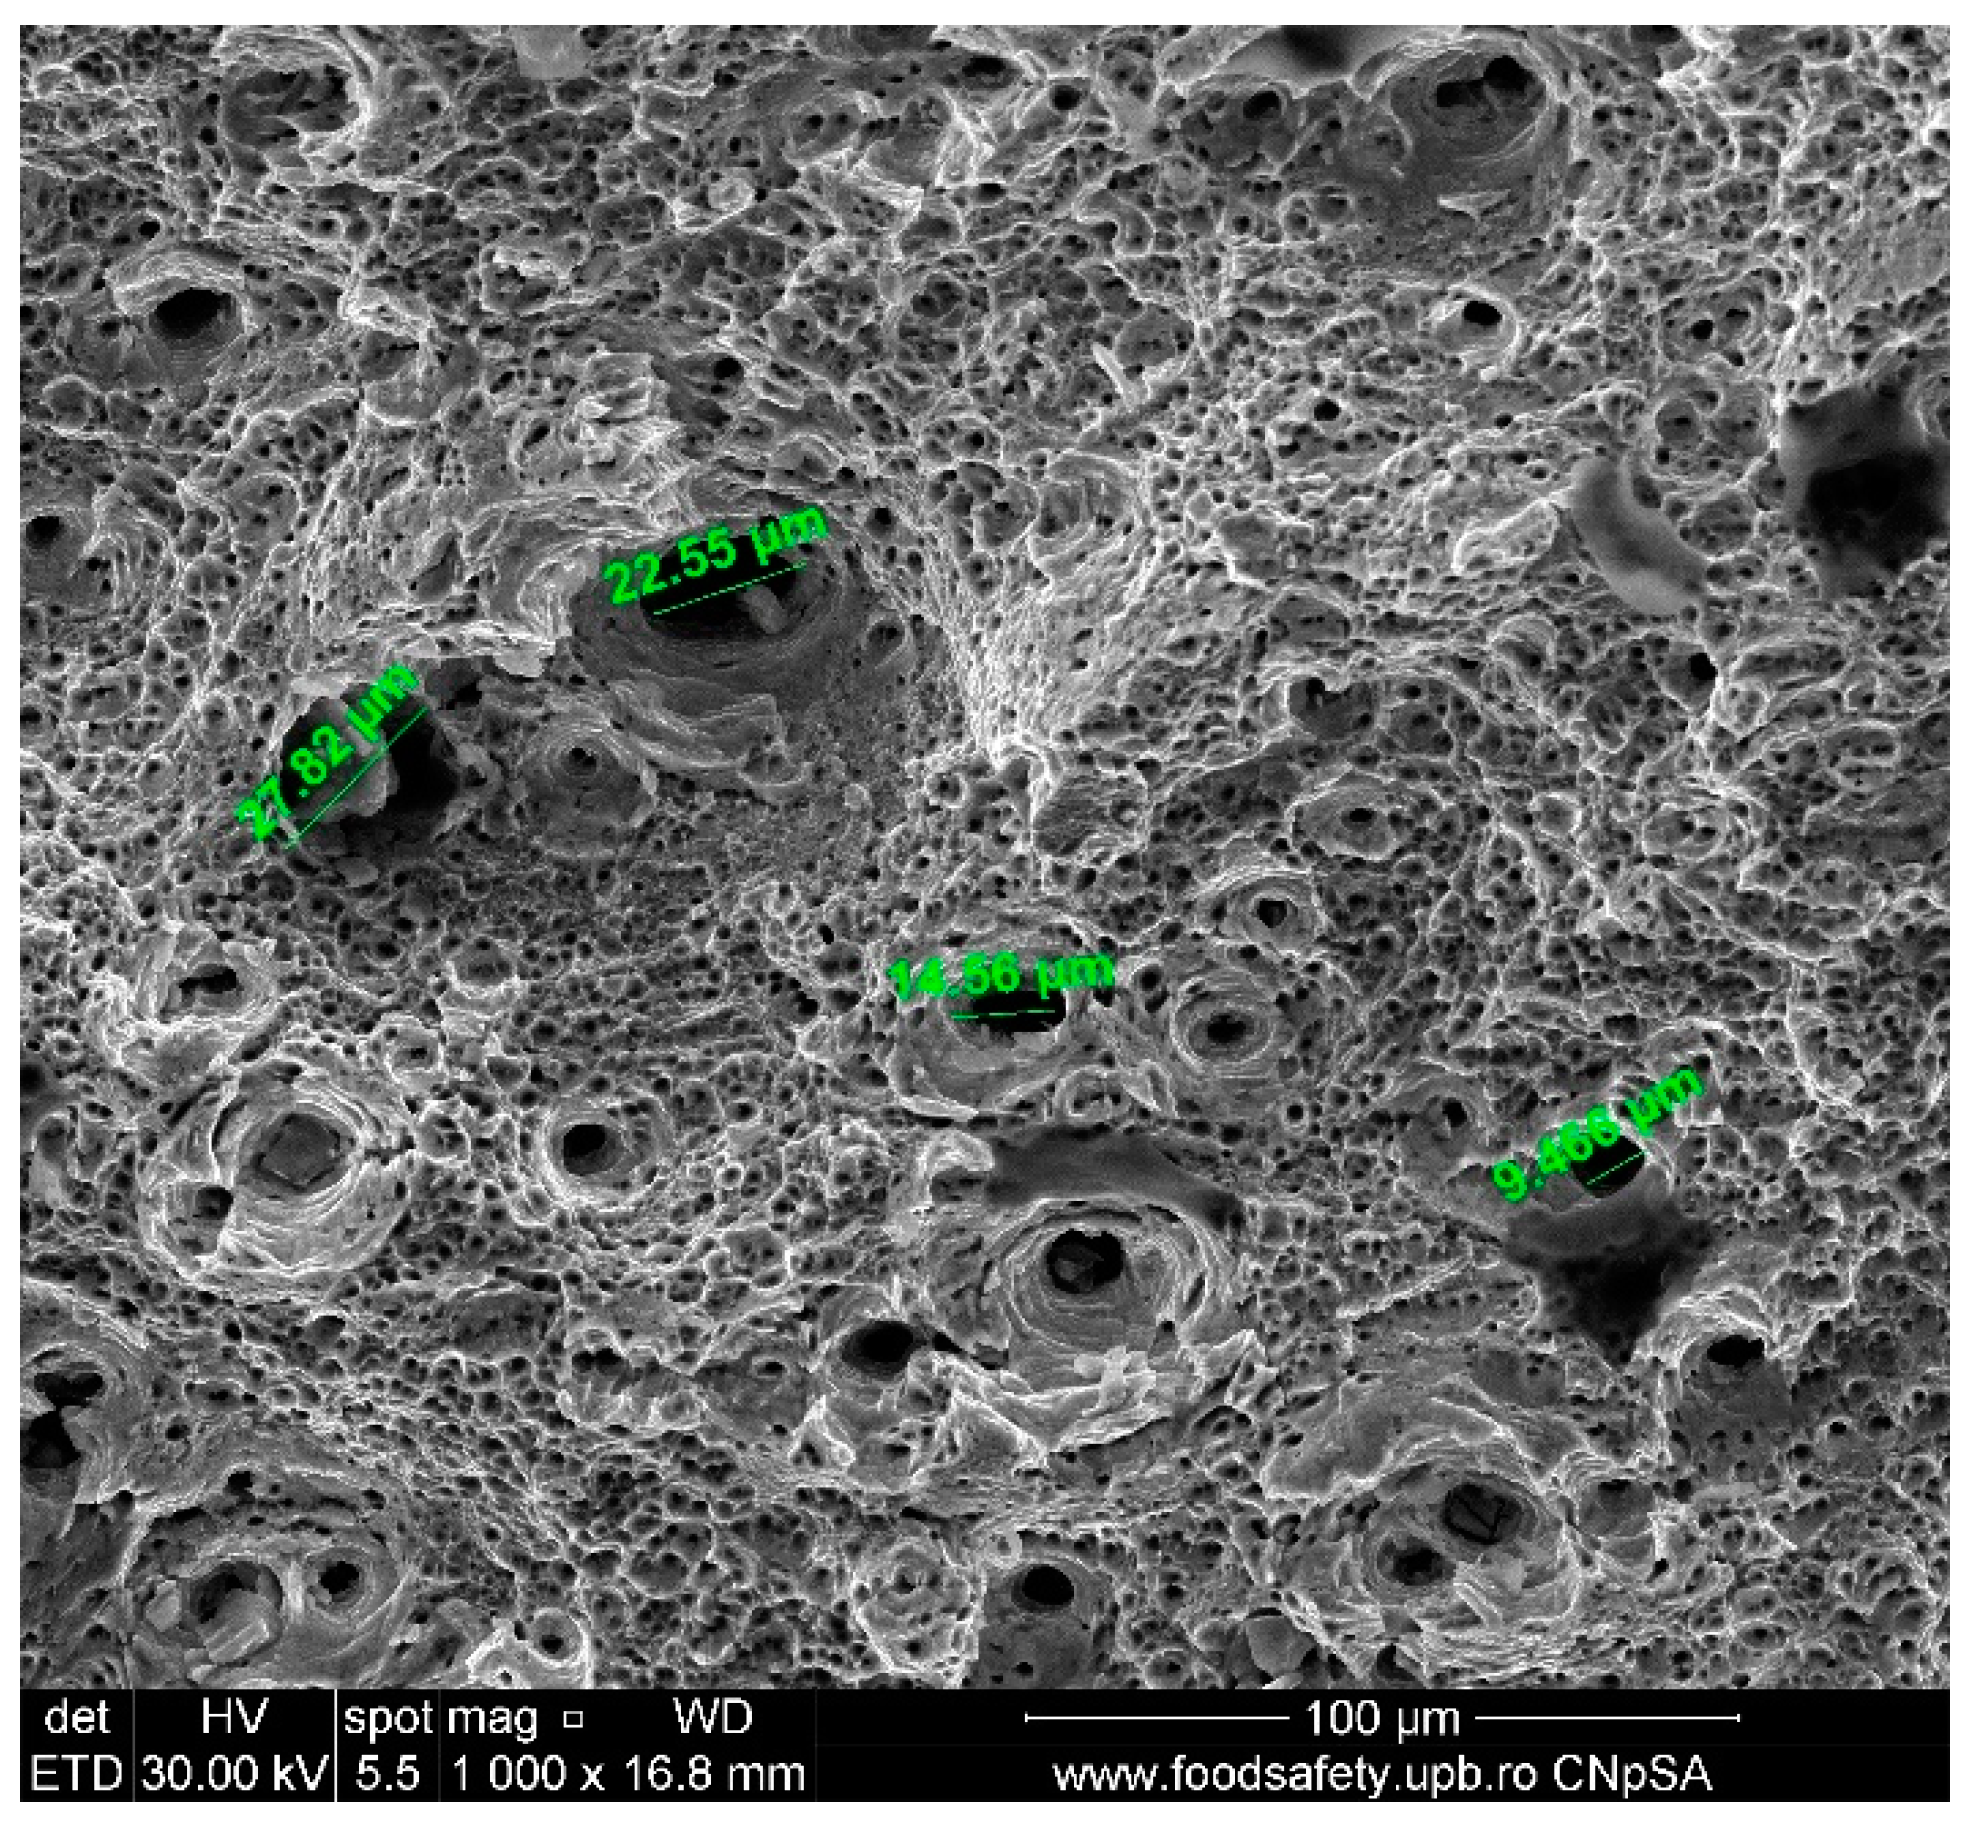
Figure 7 and described in
Table 9, shows the existence of voids on the fracture surface. These voids are distinctive characteristics of ductile fracture. The diameters of the voids are 486.1 nm and 618.7 nm, indicating a precise microstructural response to the stress exerted. The fracture surface is coarse and indented, which is representative of a ductile fracture process. The presence of tiny voids indicates a high fracture toughness, which means that the material is resistant to the initiation and spread of cracks. The intricate microstructure, characteristic of additive manufacturing procedures, is responsible for the observed void dimensions, thereby improving the material’s mechanical characteristics. These findings are essential for comprehending the performance of AM stainless steel 316L in applications where mechanical integrity is of utmost importance.
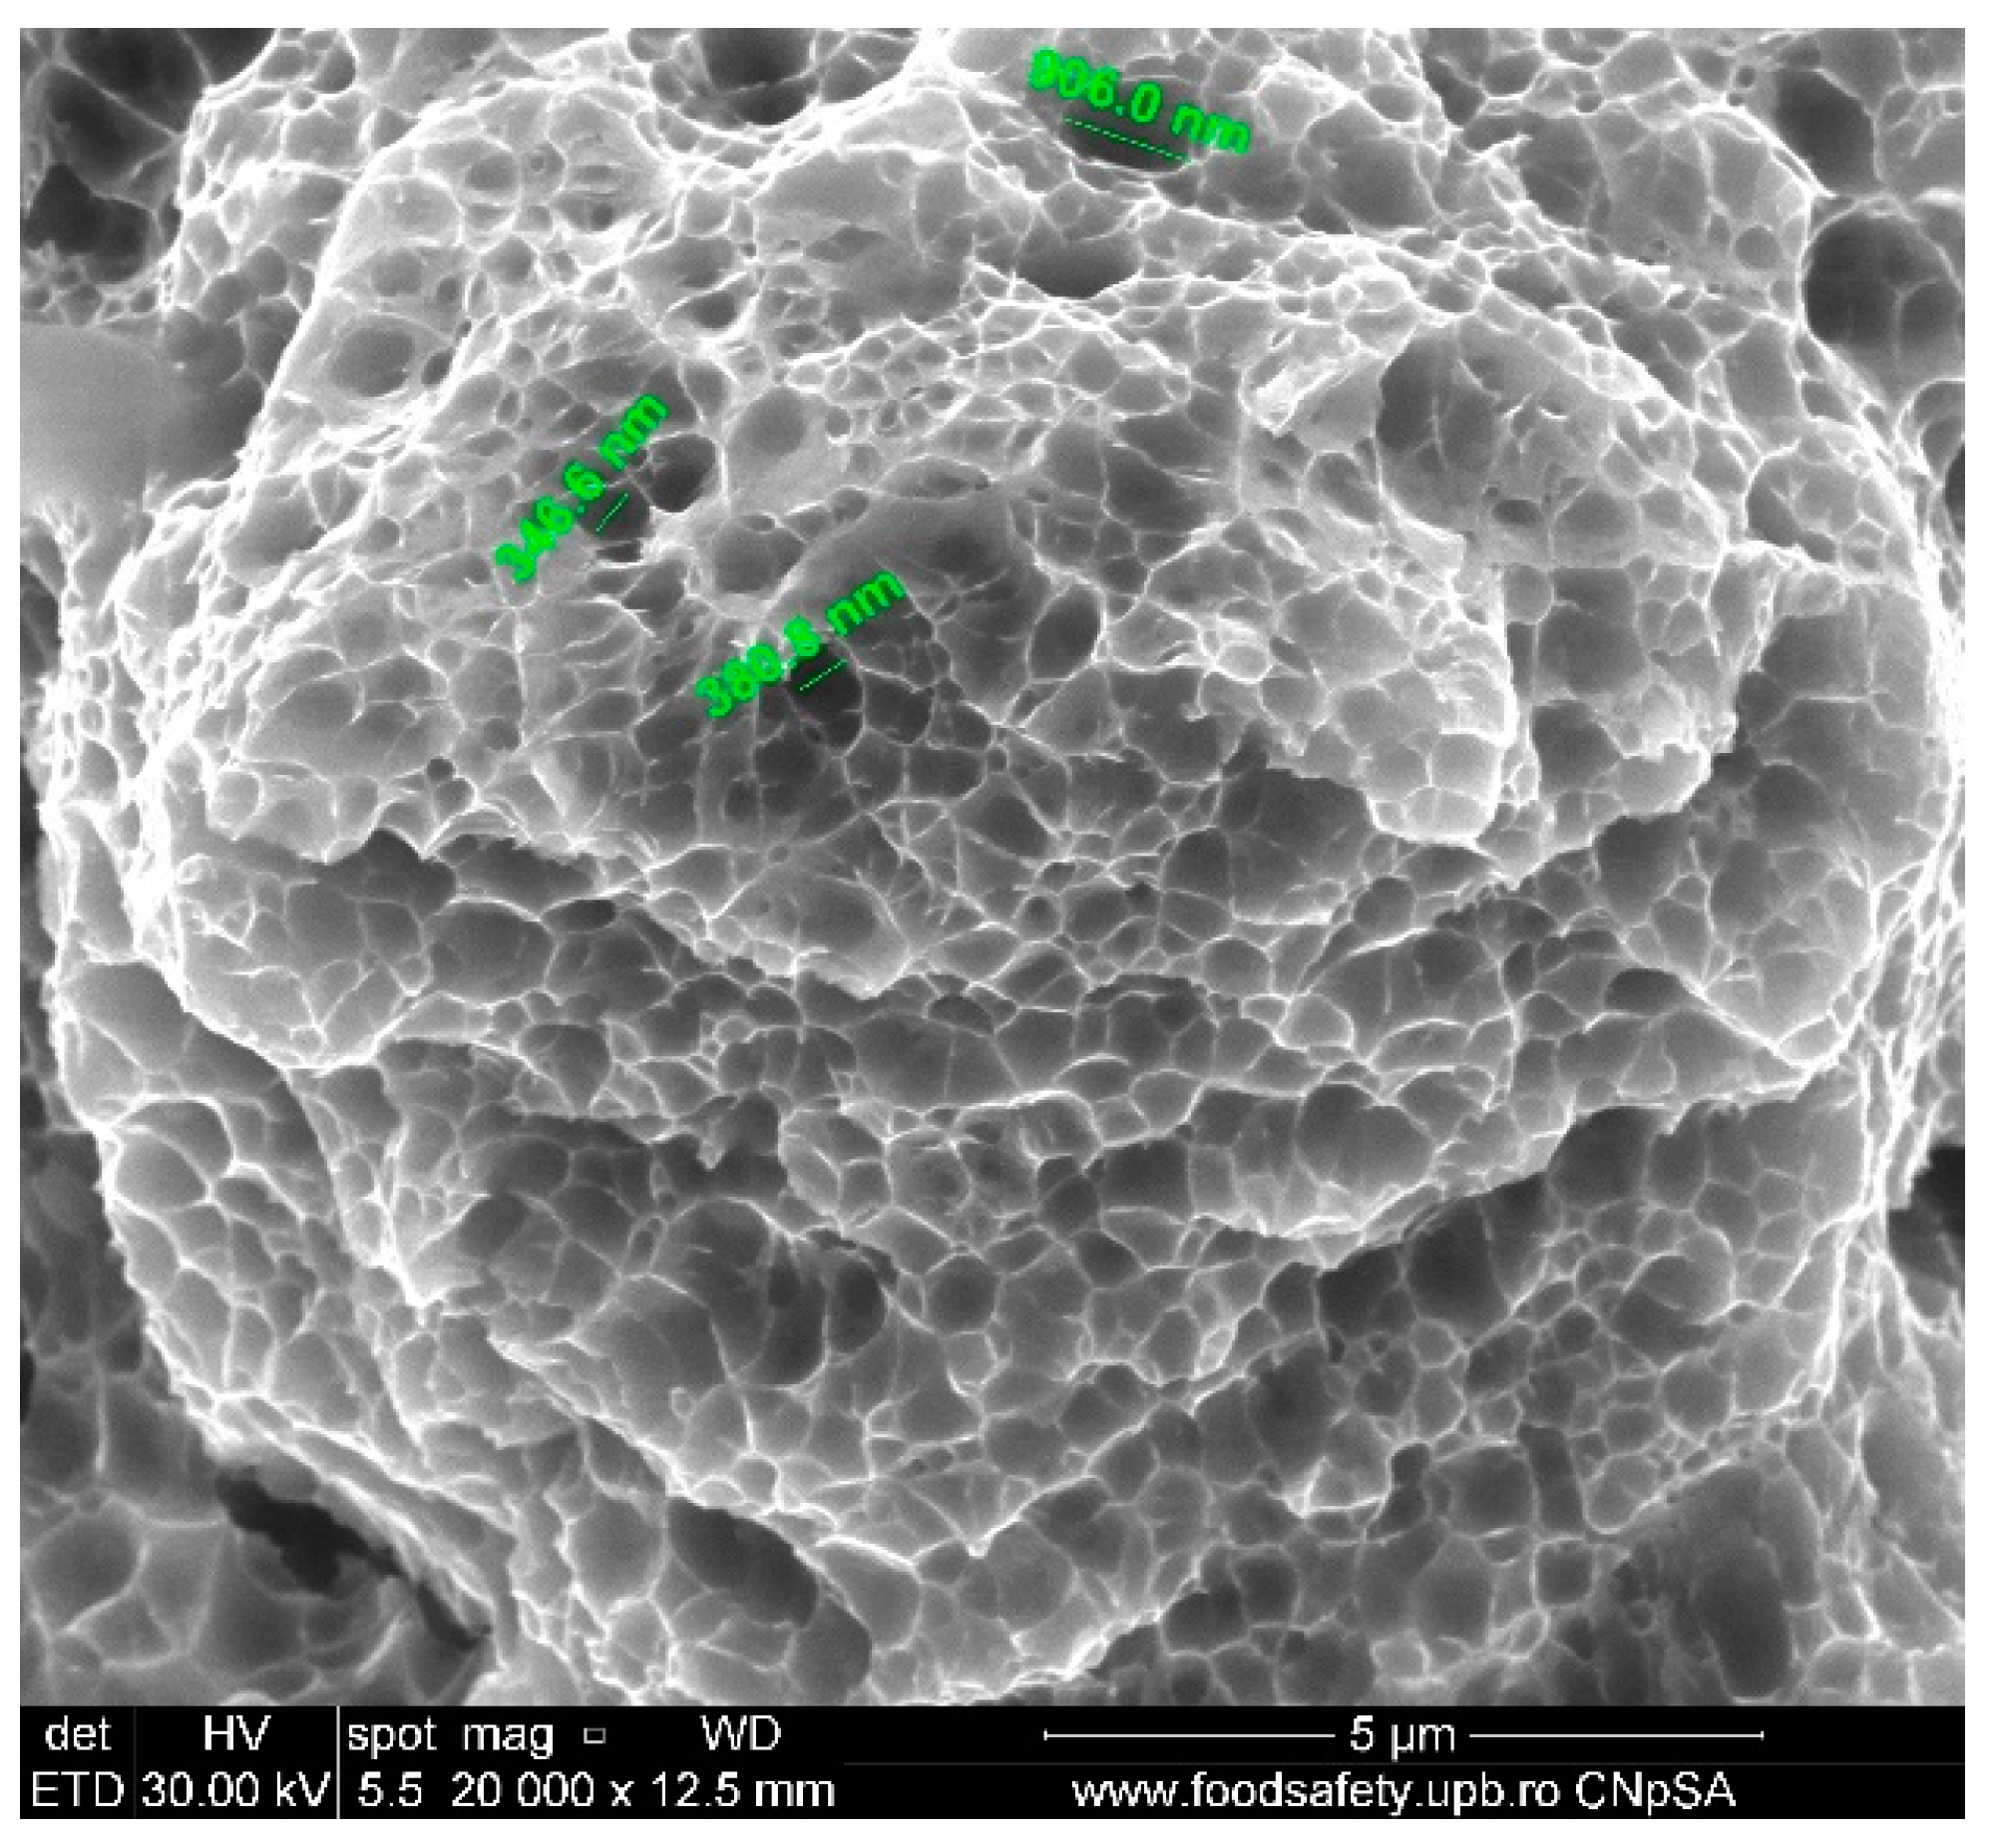
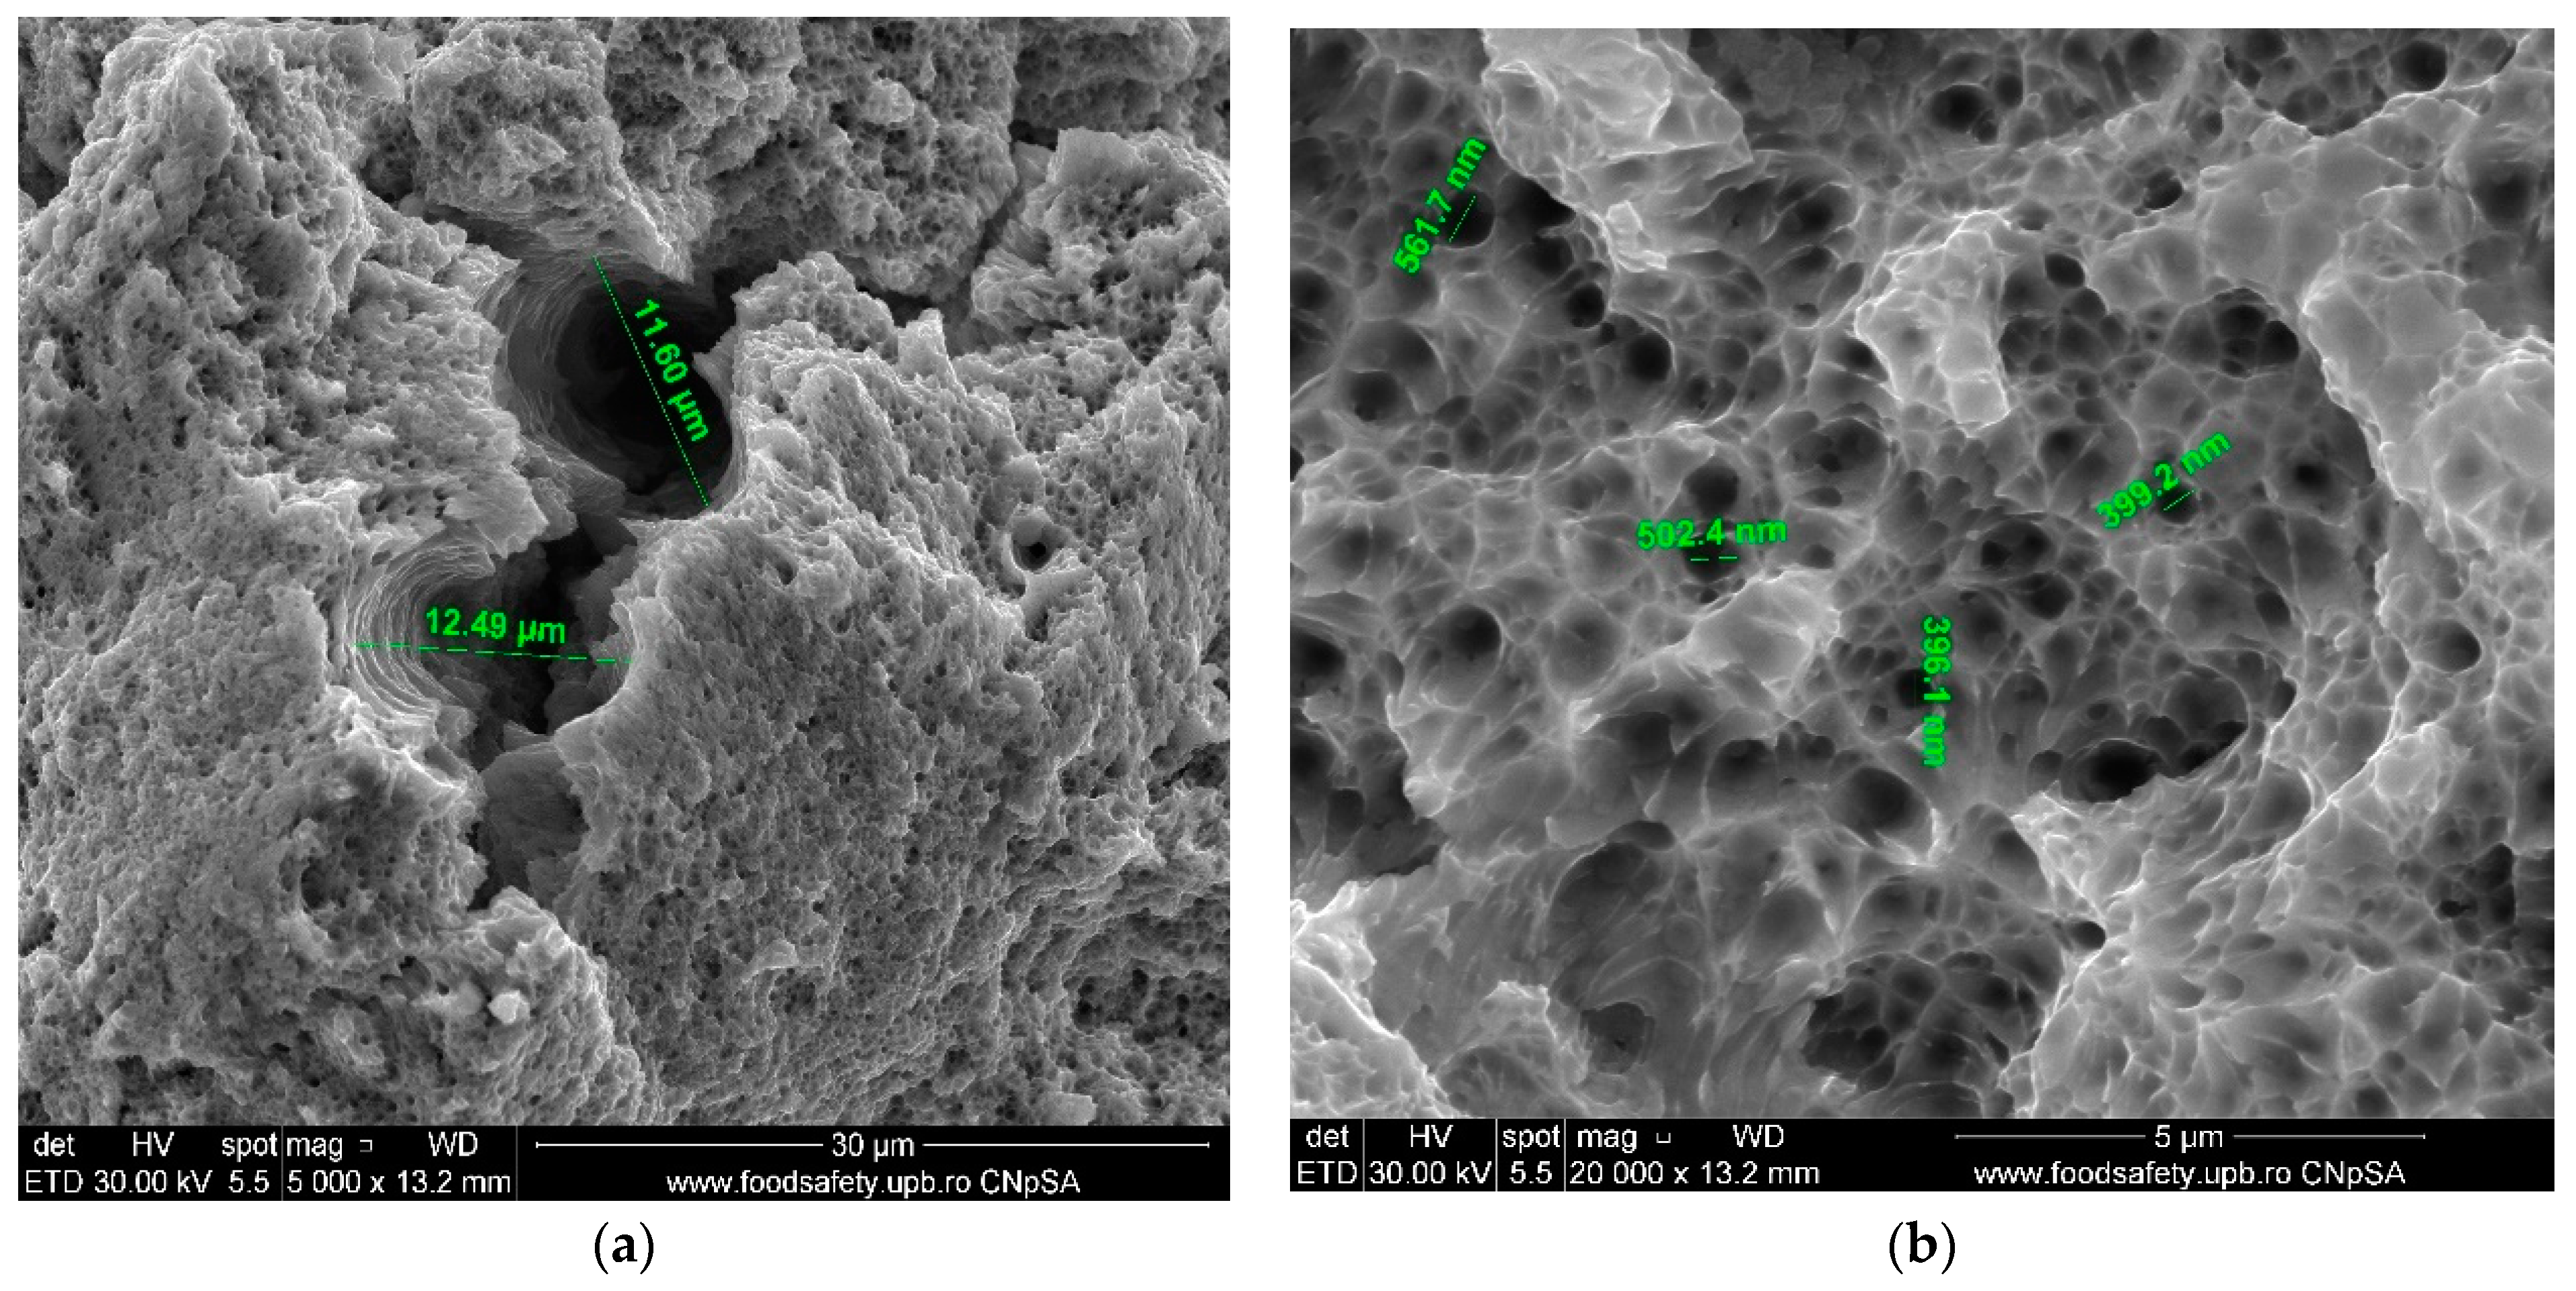
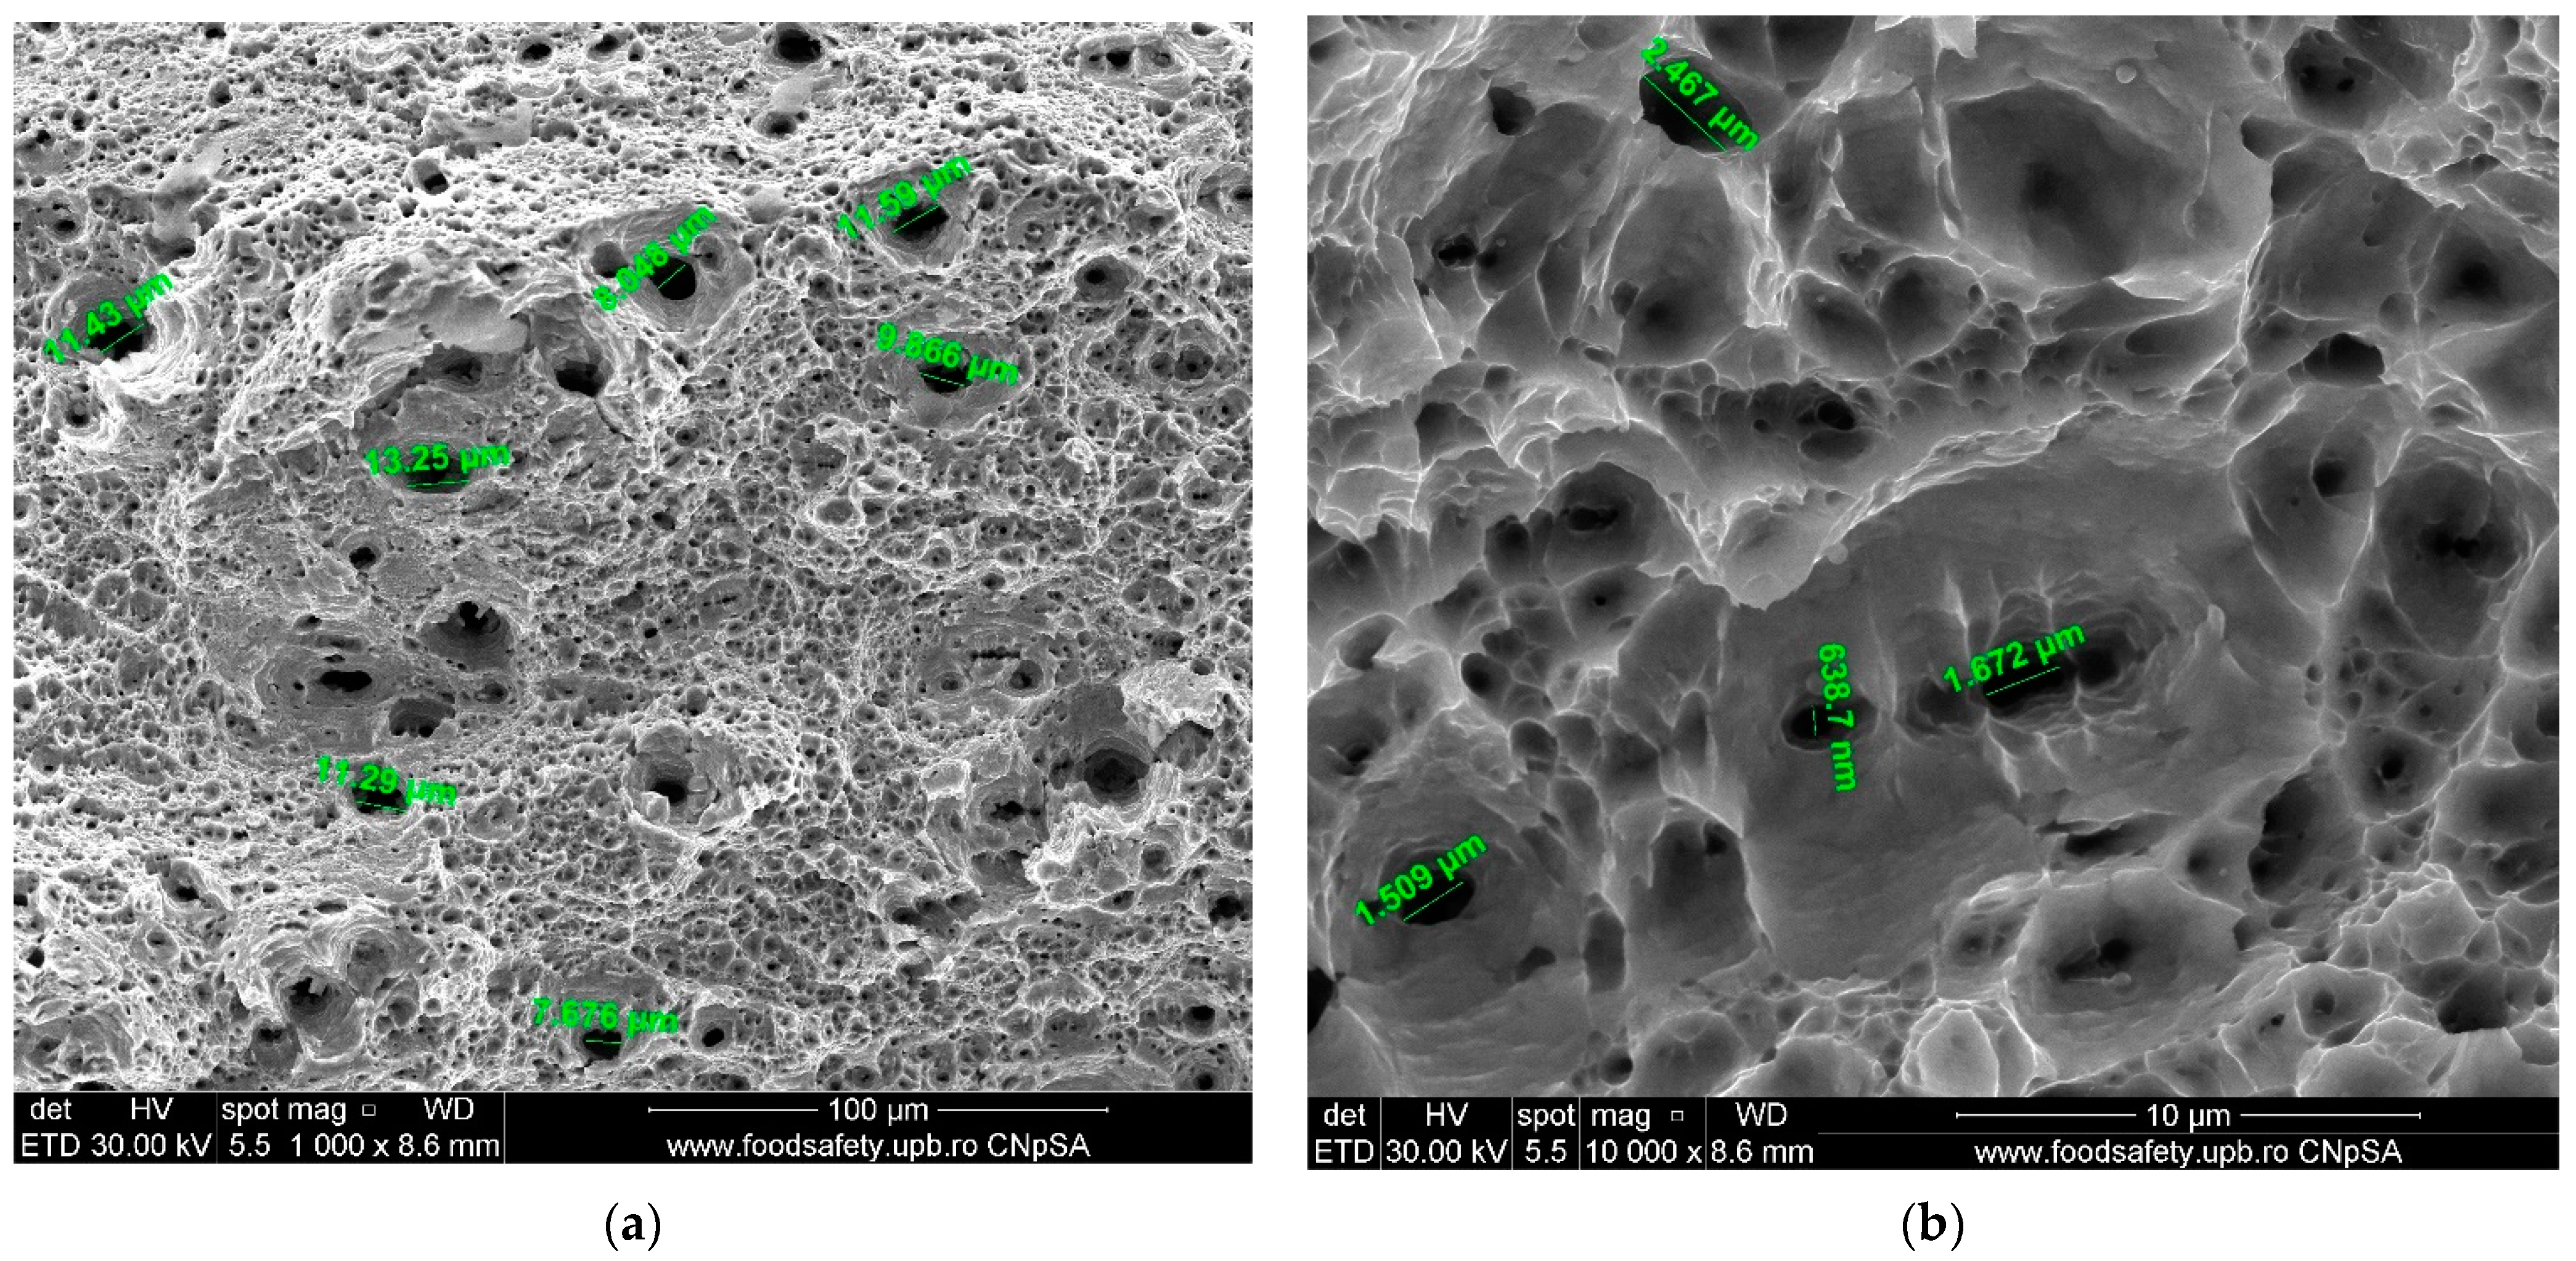
Figure 8 of the fractured AM Sample E2 demonstrates the presence of voids on the fracture surface. These voids are distinctive characteristics of ductile fracture. The diameters of the voids, as presented in
Table 10, are 486.1 nm and 618.7 nm, indicating a precise microstructural response to the stress applied. The fracture surface is grainy and dented, which is consistent with the ductile fracture process. The presence of tiny voids indicates a high fracture toughness, which means that the material is resistant to the initiation and spread of cracks.
The void sizes observed in
Figure 9 for Sample E3 varies between 130.7 nm and 406.7 nm,
Table 11, indicating a small and refined microstructure compared to other fractured samples. The presence of minuscule cavities indicates that the material underwent localised plastic deformation on a smaller scale, which is characteristic of materials with greater strength and microstructures composed of fine grains; overall, this sample material provided better response to stress compared to previous samples.
The presence of small voids, especially the 130.7 nm void, suggests that the fracture in Sample E3 most likely started and spread through a ductile mechanism. The voids formed at a variety of small locations within the material. The presence of varying void sizes suggests that the material may have encountered different degrees of stress concentration along the fracture surface.
Voids of varying sizes, ranging from 130.7 nm to 406.7 nm, demonstrate the material’s ductility. These voids indicate the material’s capacity to undergo plastic deformation prior to fracturing, which is a feature of ductile materials. The discovered voids likely resulted from the merging of micro voids during the material’s deformation, ultimately causing it to fracture.
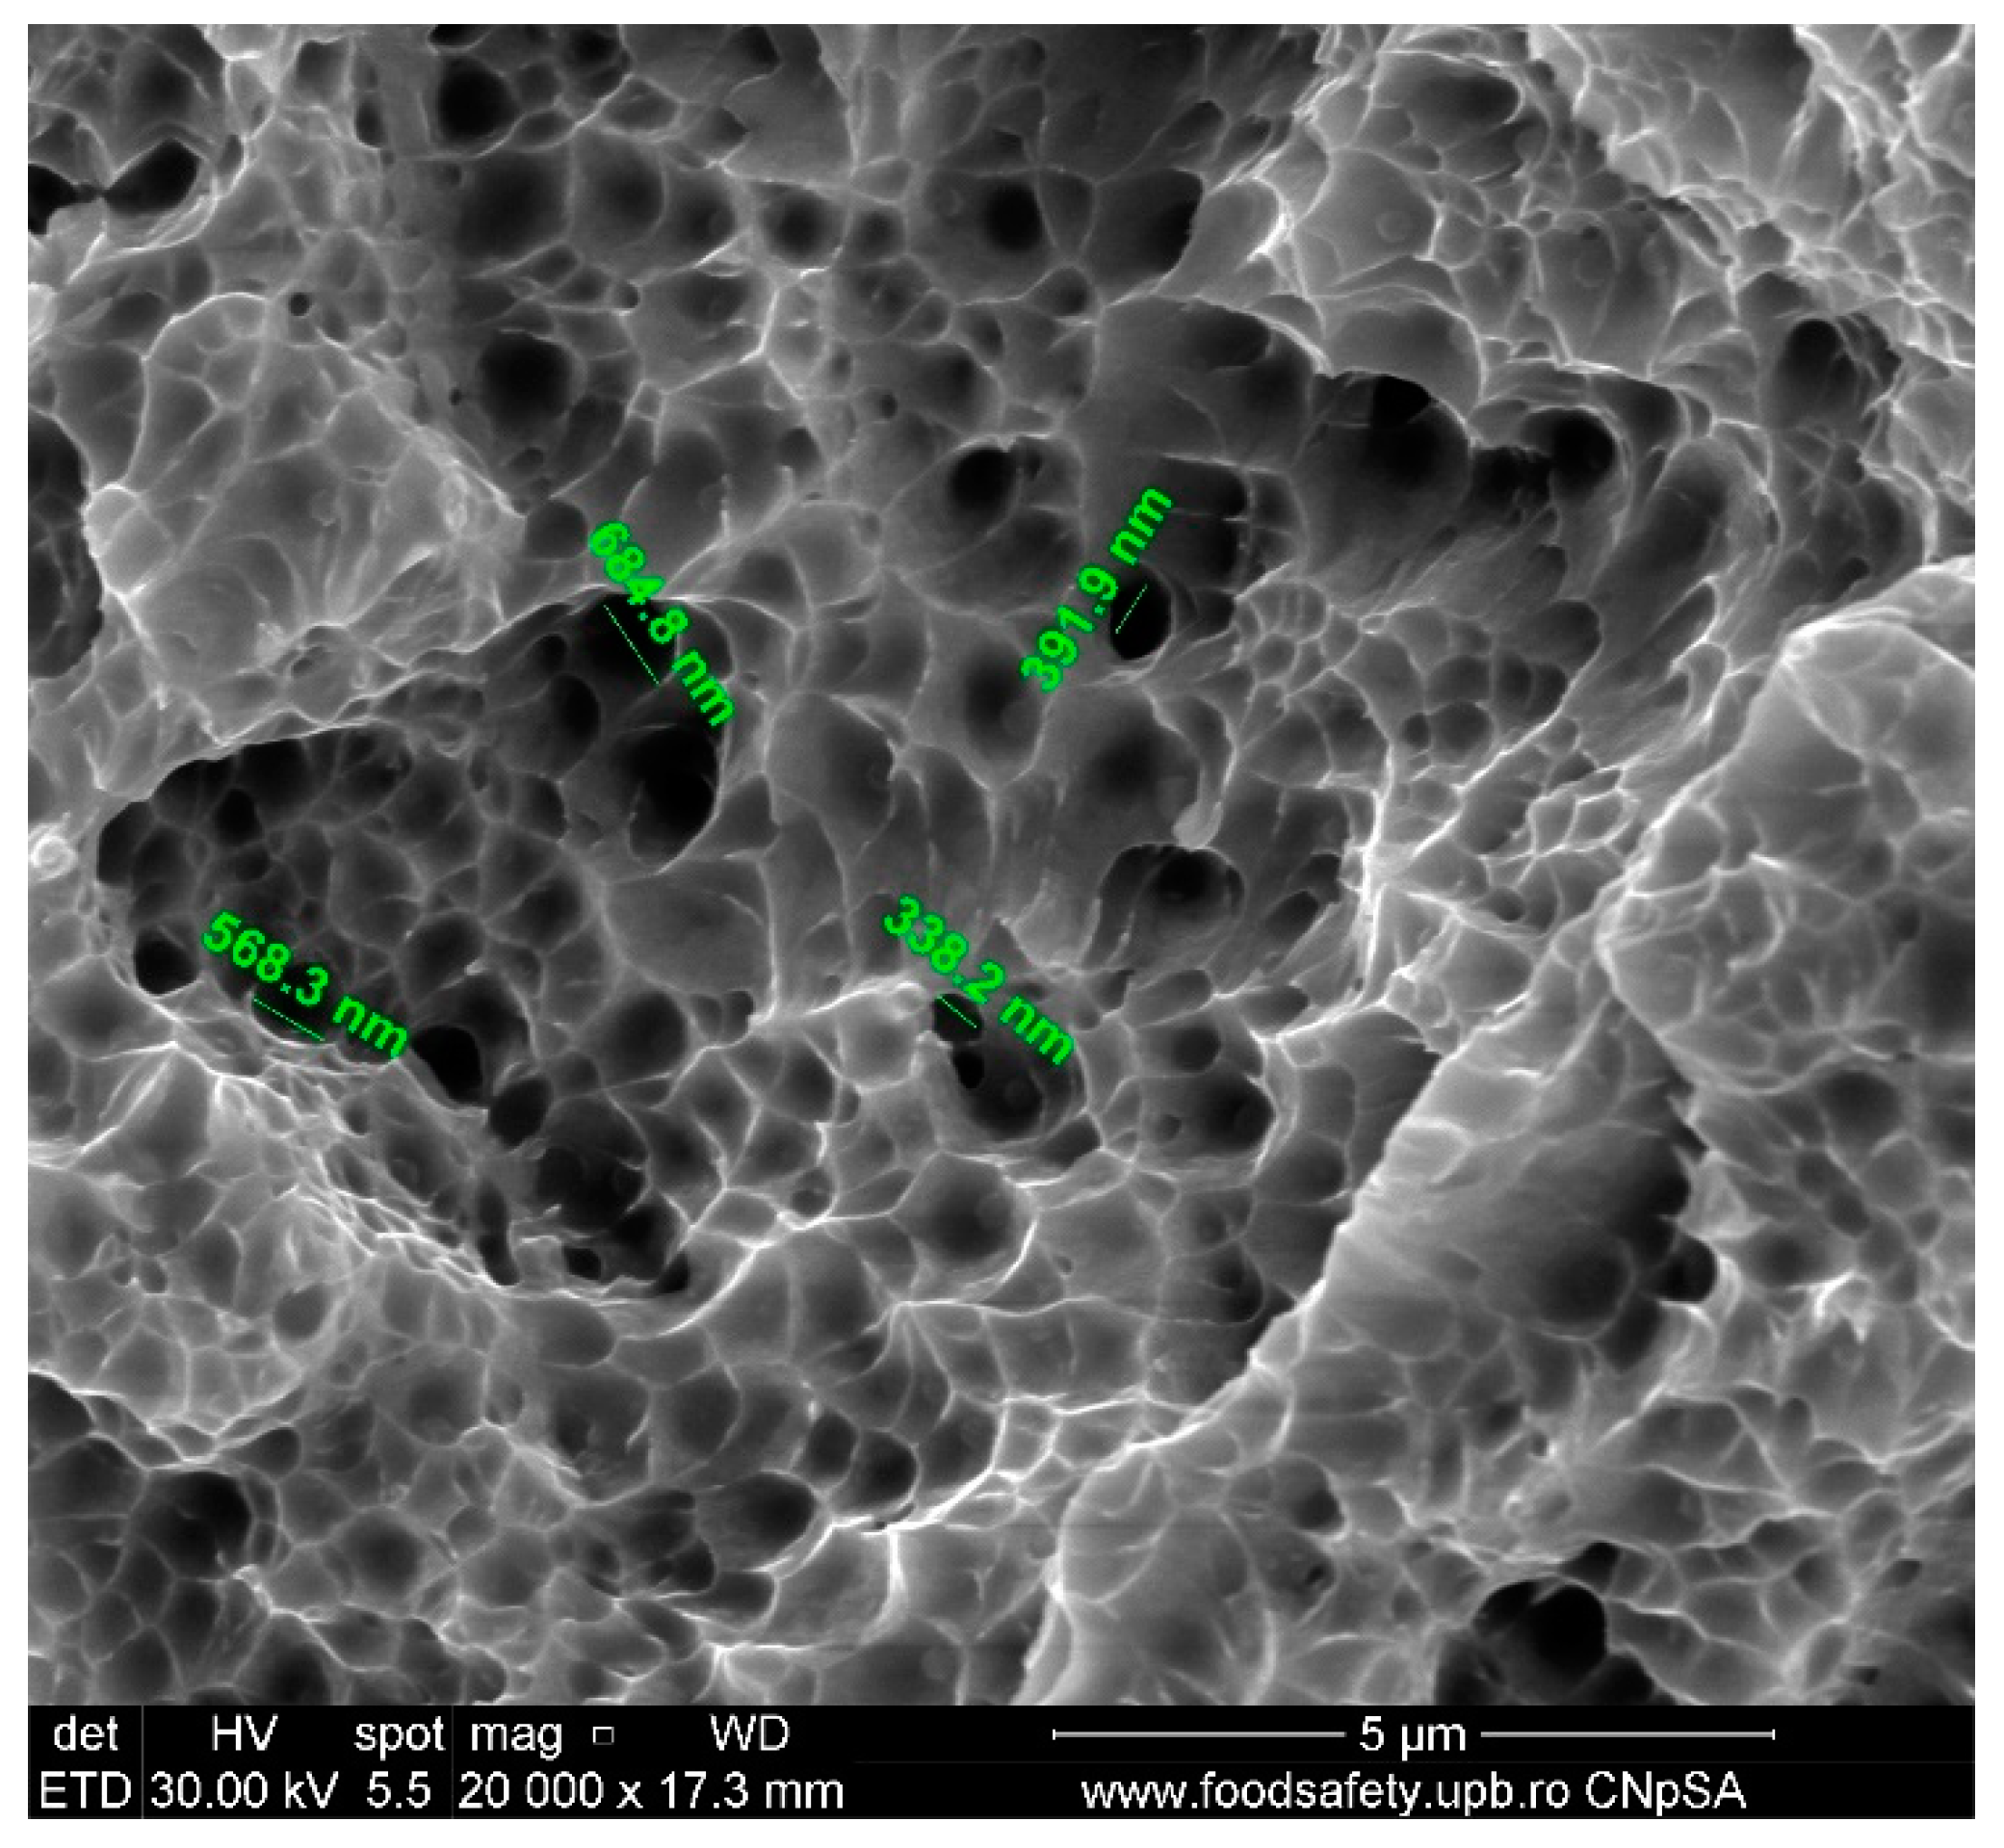
As can be observed in
Figure 10 and documented in
Table 12 for AM sample E4, the voids vary in size from 338.2 nm to 684.8 nm, suggesting a significant variation in the distribution of stress and strain on the fracture surface exhibiting clear characteristics of ductility.
The broken AM Sample E5, presented in
Table 13 also presents a fracture process with voids at various levels, indicating substantial distortion and stress accumulation. These findings, from
Figure 11, align with previous structural findings on other fractured AM samples.
5. Conclusions
The comparison of SS316L samples produced using conventional and additive tech-niques documented the compromises associated with the manufacturing technologies. By creating a more refined microstructure, additive manufacturing improves materials’ ten-sile strength and yield strength coming at the expense of reduced ductility. Conventional production techniques produce materials with lower strength but higher ductility; this means that it is important when choosing the appropriate production method to adapt the manufacturing techniques to the individual requirements of the application. The use of AM offers benefits in terms of high strength for specific uses. However, for applications that require a balance of strength and flexibility, traditional production methods could prove more suitable. Future research is required to focus on improving post-processing techniques for additive manufacturing samples to mitigate the negative effects of reduced ductility.
The relatively fast cooling and solidification rates in AM provide finer grain structure and greater dislocation density, therefore affecting the tensile strength.
Conventionally produced SS316L shows a more evenly distributed grain structure with larger grain sizes compared to the microstructure of AM SS316L which shows finer grains and columnar grain growth aligned in the build direction due to rapid cooling rates of the AM process. While grain refinement in AM samples results in higher strength but decreased ductility, the AM samples have greater porosity and anisotropy than conventionally produced components, which influences mechanical parameters including tensile strength and ductility.
Using the SLM AM process, the fast cooling and solidification speeds inherent in the process define the refined grain architecture improving the microstructure compared to conventional methods. Also, the layer-by-layer construction that creates steep thermal gradients, and promotes columnar grain growth in the build direction also improves the material properties.
The presence of microstructural defects like porosity, anisotropy, and residual stresses lead to a reduced ability for plastic deformation, making the material more brittle. While fine grain structures from rapid solidification increase strength, they also limit the material’s capacity for elongation before failure, resulting in lower ductility.
Larger grain sizes in conventionally manufactured stainless steel 316L are correlated with improved ductility because they allow for greater dislocation movement and plastic deformation. This results in the material being able to stretch and absorb more strain before fracturing, as larger grains reduce grain boundary strengthening, which can contribute to the higher ductility observed [
15,
16].
When considering the results and the conclusions specific limitations must be mentioned:
- -
The results are for this specific manufacturing process (SLM), for this particular material (SS316L) with the material composition mentioned in this article.
- -
The degree of porosity for each sample may vary based on type and model of machine and materials used in the manufacturing process which may influence the values [
16].
- -
The study did not focus particularly on post-processing techniques, only shot peening was used for the post-processing of the samples presented in this study.
As AM technology evolves, and post-processing techniques improve there is a high chance of using AM parts and/or materials used more and more in the nuclear sector for more important components. This would facilitate on-site fabrication of specific components and on-site qualification for the specific environment to be used.
D’Andrea noticed similar behaviour of AM SS316L material properties and documented in their paper that depending on post-processing procedures, the treatments may have a significant impact on hardness of the material and that the austenite stability and build direction affect the fatigue properties of the specimens [
16].
Kedizora et al. also documented that the SS316L material manufactured through the EOS machine models via SLM (DMLS—Direct Metal Laser Sintering) process models presented the greatest fatigue strength when comparing two specimens and identifies that the heat-treated material does not necessarily present increased ductility [
17]. Jeyaprakash focused on the process parameters and how they influenced the microstructural orientation of SS316L during the melt pool formation [
18]. These findings need to be explored more to understand what specific post-processing treatment is best for increasing ductility with minimal compromise of other properties.
Future work should focus on identifying the optimum balance between energy density, laser power, speed, layer thickness and cooling rates. Phase analysis and microstructural characterisation should be used to validate the optimal selection of process parameters [
19,
20].
Another topic to be explored would be to fabricate radial bimetallic structures that present distinctive opportunities for designing and manufacturing parts with superior mechanical properties as described by Dash A. et al. in their paper [
21].
Identified post-processing strategies also comprise of hot isostatic pressing (HIP), which lowers internal porosity and increases material density and heat treatment help with the release of residual stresses. Shot peening or laser remelting also represent methods that can help to reduce stress concentrations and enhance surface quality.
The specific application requirements that were identified so far that might influence the choice between AM and conventional manufacturing techniques for SS316L are:
Geometry requirements;
Material properties requirements;
Cost of maintenance and production;
Possibility of manufacturing unique parts and prototypes.
The choice between AM and conventional manufacturing for SS316L depends on several considerations, particularly in specialised applications like medical implants, aerospace or nuclear technologies.
Overall SS316L represents a decent material and AM a suitable manufacturing method to be used in the industrial environment more specifically in the nuclear sector. The differences in sample results are representative for the variation in sizes and shapes of the samples and show considerable improvement compared to conventional samples. Further research is required to provide a standardised test plan for such materials and methods to be used in the nuclear field.


 ,
, 

