Article

A Photoluminescence Study of Eu3+, Tb3+, Ce3+ Emission in Doped Crystals of Strontium-Barium Fluoride Borate Solid Solution Ba4−xSr3+x(BO3)4−yF2+3y (BSBF)

by
Tatyana B. Bekker
1,2,*,
Alexey A. Ryadun
3,
Sergey V. Rashchenko
1,2,
Alexey V. Davydov
1,2,
Elena B. Baykalova
2 and
Vladimir P. Solntsev
1,2
1
Sobolev Institute of Geology and Mineralogy, Siberian Branch of the Russian Academy of Sciences, 630090 Novosibirsk, Russia
2
Department of Geology and Geophysics, Novosibirsk State University, 630090 Novosibirsk, Russia
3
Nikolaev Institute of Inorganic Chemistry, Siberian Branch of the Russian Academy of Sciences, 630090 Novosibirsk, Russia
*
Author to whom correspondence should be addressed.
Materials 2023, 16(15), 5344; https://doi.org/10.3390/ma16155344
Submission received: 12 June 2023 / Revised: 25 July 2023 / Accepted: 27 July 2023 / Published: 29 July 2023
(This article belongs to the Special Issue Advanced Materials for Optical and Luminescence Applications)

Abstract

:
The present study is aimed at unveiling the luminescence potential of Ba4−xSr3+x(BO3)4−yF2+3y (BSBF) crystals doped with Eu3+, Tb3+, and Ce3+. Owing to the incongruent melting character of the phase, the NaF compound was used as a solvent for BSBF crystal growth. The structure of BSBF: Eu3+ with Eu2O3 concentration of about 0.7(3) wt% was solved in the non-centrosymmetric point group P63mc. The presence of Eu2O3 in BSBF: Eu3+ leads to a shift of the absorption edge from 225 nm to 320 nm. The photoluminescence properties of the BSBF: Ce3+, BSBF: Tb3+, BSBF: Eu3+, and BSBF: Eu3+, Tb3+, Ce3+ crystals have been studied. The unusual feature of europium emission in BSBF is the intensively manifested 5D07F0 transition at about 574 nm, which is the strongest for BSBF: Eu3+ at 370 nm excitation and for BSBF: Eu3+, Tb3+, Ce3+ at 300 nm and 370 nm excitations. No evidence of Tb3+→Eu3+ energy transfer was found for BSBF: Eu3+, Tb3+, Ce3+. The PL spectra of BSBF: Eu3+ at 77 and 300 K are similar with CIE chromaticity coordinates of (0.617; 0.378) at 300 nm excitation and (0.634; 0.359) at 395 nm excitation and low correlated color temperature which implies application prospects in the field of lightning. Due to the high intensity of 5D07F0 Eu3+ transition at 370 nm excitation, the BSBF: Eu3+ emission is yellow-shifted.

1. Introduction

The increasing exploration of borate compounds is motivated mainly by their chemical and physical stability, a wide range of transparency from ultraviolet (UV) to infrared range, and a high laser-induced damage threshold. A number of borates demonstrate high birefringence, e.g., α-BaB2O4, Ba2Na3(B3O6)2F, and outstanding nonlinear optical properties for laser frequency conversion from infrared to UV- and visible ranges, e.g., β-BaB2O4, LiB3O5 [1]. Aside from optical properties, another reason for the continued attention to borates is their remarkable structural variety owing to the dual hybridization of boron atoms and the possibility for polymerization via bridging oxygen atoms.
During the past decades, the luminescence of borates doped with rare earth elements has been intensively analyzed [2,3,4,5,6]. The main areas of their possible exemplification are the components of white light-emitting diodes (WLEDs) required for modern lighting and displays and thermoluminescence phosphors for radiation dosimetry [7,8]. Among the reported borate materials for WLEDs are LiBaBO3: Eu2+, Tb3+, and Eu3+, red phosphor with tunable-color emission implying the Eu2+→Tb3+→Eu3+ energy transfer [9], LaSc3(BO3)4:Eu3+ red phosphor with zero thermal quenching and internal quantum efficiency of 88.3% [4], GdBO3: Ce3+, Tb3+, Eu3+ broadband-excited red phosphor [10], LiBa12(BO3)4F4: Eu3+, Tb3+, Ce3+ single-matrix white phosphor [11].
The main object of this study is highly unconventional non-centrosymmetric (P63mc) solid solution Ba4−xSr3+x(BO3)4−yF2+3y (BSBF) exhibiting both cationic Ba2+↔Sr2+ and anionic [(BO3)F]4−↔[F4]4− isomorphism [12]. Such structural flexibility allows tuning the optical properties, for instance, the value of the absorption edge [13]. Particular emphasis should be laid on the fact that crystals of Ba4−xSr3+x(BO3)4−yF2+3y are characterized by a property completely new to the class of borates. This is a reversible color change upon X-ray irradiation with the possibility of returning the crystals to their original uncolored state by irradiating with intense light in the range of 300–400 nm. X-ray irradiation is accompanied by the formation of induced color centers, which were studied by optical and electron paramagnetic resonance spectroscopy. The combination of properties of the BSBF crystals allows them to be used as a dose indicator [12,13].
The luminescent properties of undoped Ba4−xSr3+x(BO3)4−yF2+3y crystals were discussed in detail in Ref. [12]. The potential employment of fluoroborates can be enhanced by the incorporation of rare earth elements, endowing the crystals with additional luminescence properties. The present study is aimed at unveiling the luminescence potential of Ba4−xSr3+x(BO3)4−yF2+3y doped with Eu3+, Tb3+, and Ce3+ for application in WLEDs as single-matrix or composite phosphors.

2. Materials and Experimental Methods

Crystal Growth. We grew crystals using NaF as a solvent owing to the incongruent melting of Ba4−xSr3+x(BO3)4−yF2+3y; BaCO3, SrCO3, SrF2, H3BO3, NaF, Ce2(CO3)3·5H2O, Tb4O7, E2O3 were used as starting reagents. The growth process was carried out in a platinum crucible 40 mm in diameter in air; the weight of the initial high-temperature solution was 40 g. As it follows from the data in Table 1, the effect of the rare earth elements addition on the liquidus temperature was minimal. Crystals were grown on a platinum loop without rotation and pulling at a cooling rate of 2 °C per day for approximately 15 days. The average weight of the crystals was about 8 g. We included the photographs of 1 mm thick plates made of the grown crystals in Table 1.
Structure solution. To assess the influence of rare earth elements on the structure, we completed a single crystal X-ray diffraction analysis of BSBF: Eu3+, grown from a high-temperature solution with a relatively high europium concentration of 3.5 wt%, using a STOE IPDS diffractometer with graphite-monochromatized MoKα radiation and image plate detector. The ESPERANTO protocol, CrysAlisPro [14], SUPERFLIP, and Jana2020 software [15,16] were used for row data analysis and subsequent refinement of the structure.
Optical Spectroscopy. Transmission spectra of 1 mm thick plates were recorded with UV-VIS-NIR spectrometer sUV-3101 PC, Shimadzu.
The study of photoluminescence properties and lifetime measurements was performed with a Fluorolog 3 (Horiba Jobin Yvon, Kyoto, Japan) spectrofluorometer. Optistat DN was used to investigate the luminescence property at low temperatures. The measurement of the quantum yield was performed using a G8 (GMP SA, Zurich, Switzerland) spectralon-coated integrating sphere connected to a Fluorolog 3 spectrofluorimeter. More details on the equipment used are provided in Ref. [11].
X-ray powder diffraction (XRD) analysis. X-ray powder diffraction analysis was carried out using DRON 8 (Russia) with CuKα (1.5418 Å) radiation, Mythen2 R1 D detector (Switzerland) with a step width of 0.1° and 5 s of exposure time per position.
Energy-dispersive X-ray (EDX) microanalysis. In order to estimate europium and terbium concentration in grown crystal, the samples were examined on an MIRA 3 LMU scanning electron microscope (Tescan Orsay Holding, Brno, Czech Republic) in combination with an INCA 450 energy dispersive X-ray microanalysis system. It is worth noting that due to the intersection of the Lα lines for barium (4.84 keV) and cerium (4.47 keV), measurements of the cerium concentration were not possible. The detection (three sigma) limit for rare earth element measurements was 0.51 wt%.

3. Results and Discussion

Crystal Structure. The results of X-ray single crystal analysis show that BSBF: Eu3+ is characterized by the same point symmetry as the undoped BSBF crystal, P63mc. The details about the X-ray diffraction structural analysis and its results are presented in Table S1 and the CIF file (CCDC deposition number 2254976). The X-ray powder diffraction pattern of BSBF: Eu3+ is shown in Figure S1. The suggested geterovalent isomorphic scheme is as follows: 3(Ba, Sr)2+←2Eu3+ + □, □–vacancy in cationic sites. We believe that this substitution scheme is also valid for terbium and cerium ions. Refined stoichiometry of the compound ‘B3.703662Ba3.172464F2.889012O11.11099Sr3.827532’ may be represented as [Ba3Sr3(BO3)3](Ba1−xSrx)[(BO3)1−yF1+3y] with x ≈ 0.8, y ≈ 0.3.
In the structure of BSBF crystal, there are three nonequivalent crystallographic cationic positions: Ba2+, Sr2+ (both with Cs symmetry), and isomorphic position M (C3v symmetry), in which barium and strontium are statistically distributed. The coordination number of Ba, Sr, and M positions is 15, 13, and 16, respectively (Figure 1). The possibility of the presence of Ba2+, Sr2+, Eu3+, and a vacancy in the cationic positions does not make it possible to unambiguously determine the concentration of these species when refining the structure. To assess which of the positions is the most favorable for the incorporation of Eu3+ ions, we used the bond valence sum method (Table S2). Corresponding calculations taking into account the positional disorder in X1O/X1F and X2O/X2F sites were performed using bond-valence parameters R = 2.076 for Eu3+−O and R = 1.961 Eu3+−F (R = 1.961) [17]. The resulting values for Sr2+, Ba2+, and mixed M2+ positions are 1.8, 1.0, and 1.5, respectively (see Table S2). As the bvs for the Sr2+ position is closer to the Eu3+ valence, this position is slightly more favorable for substitution.
Optical properties.
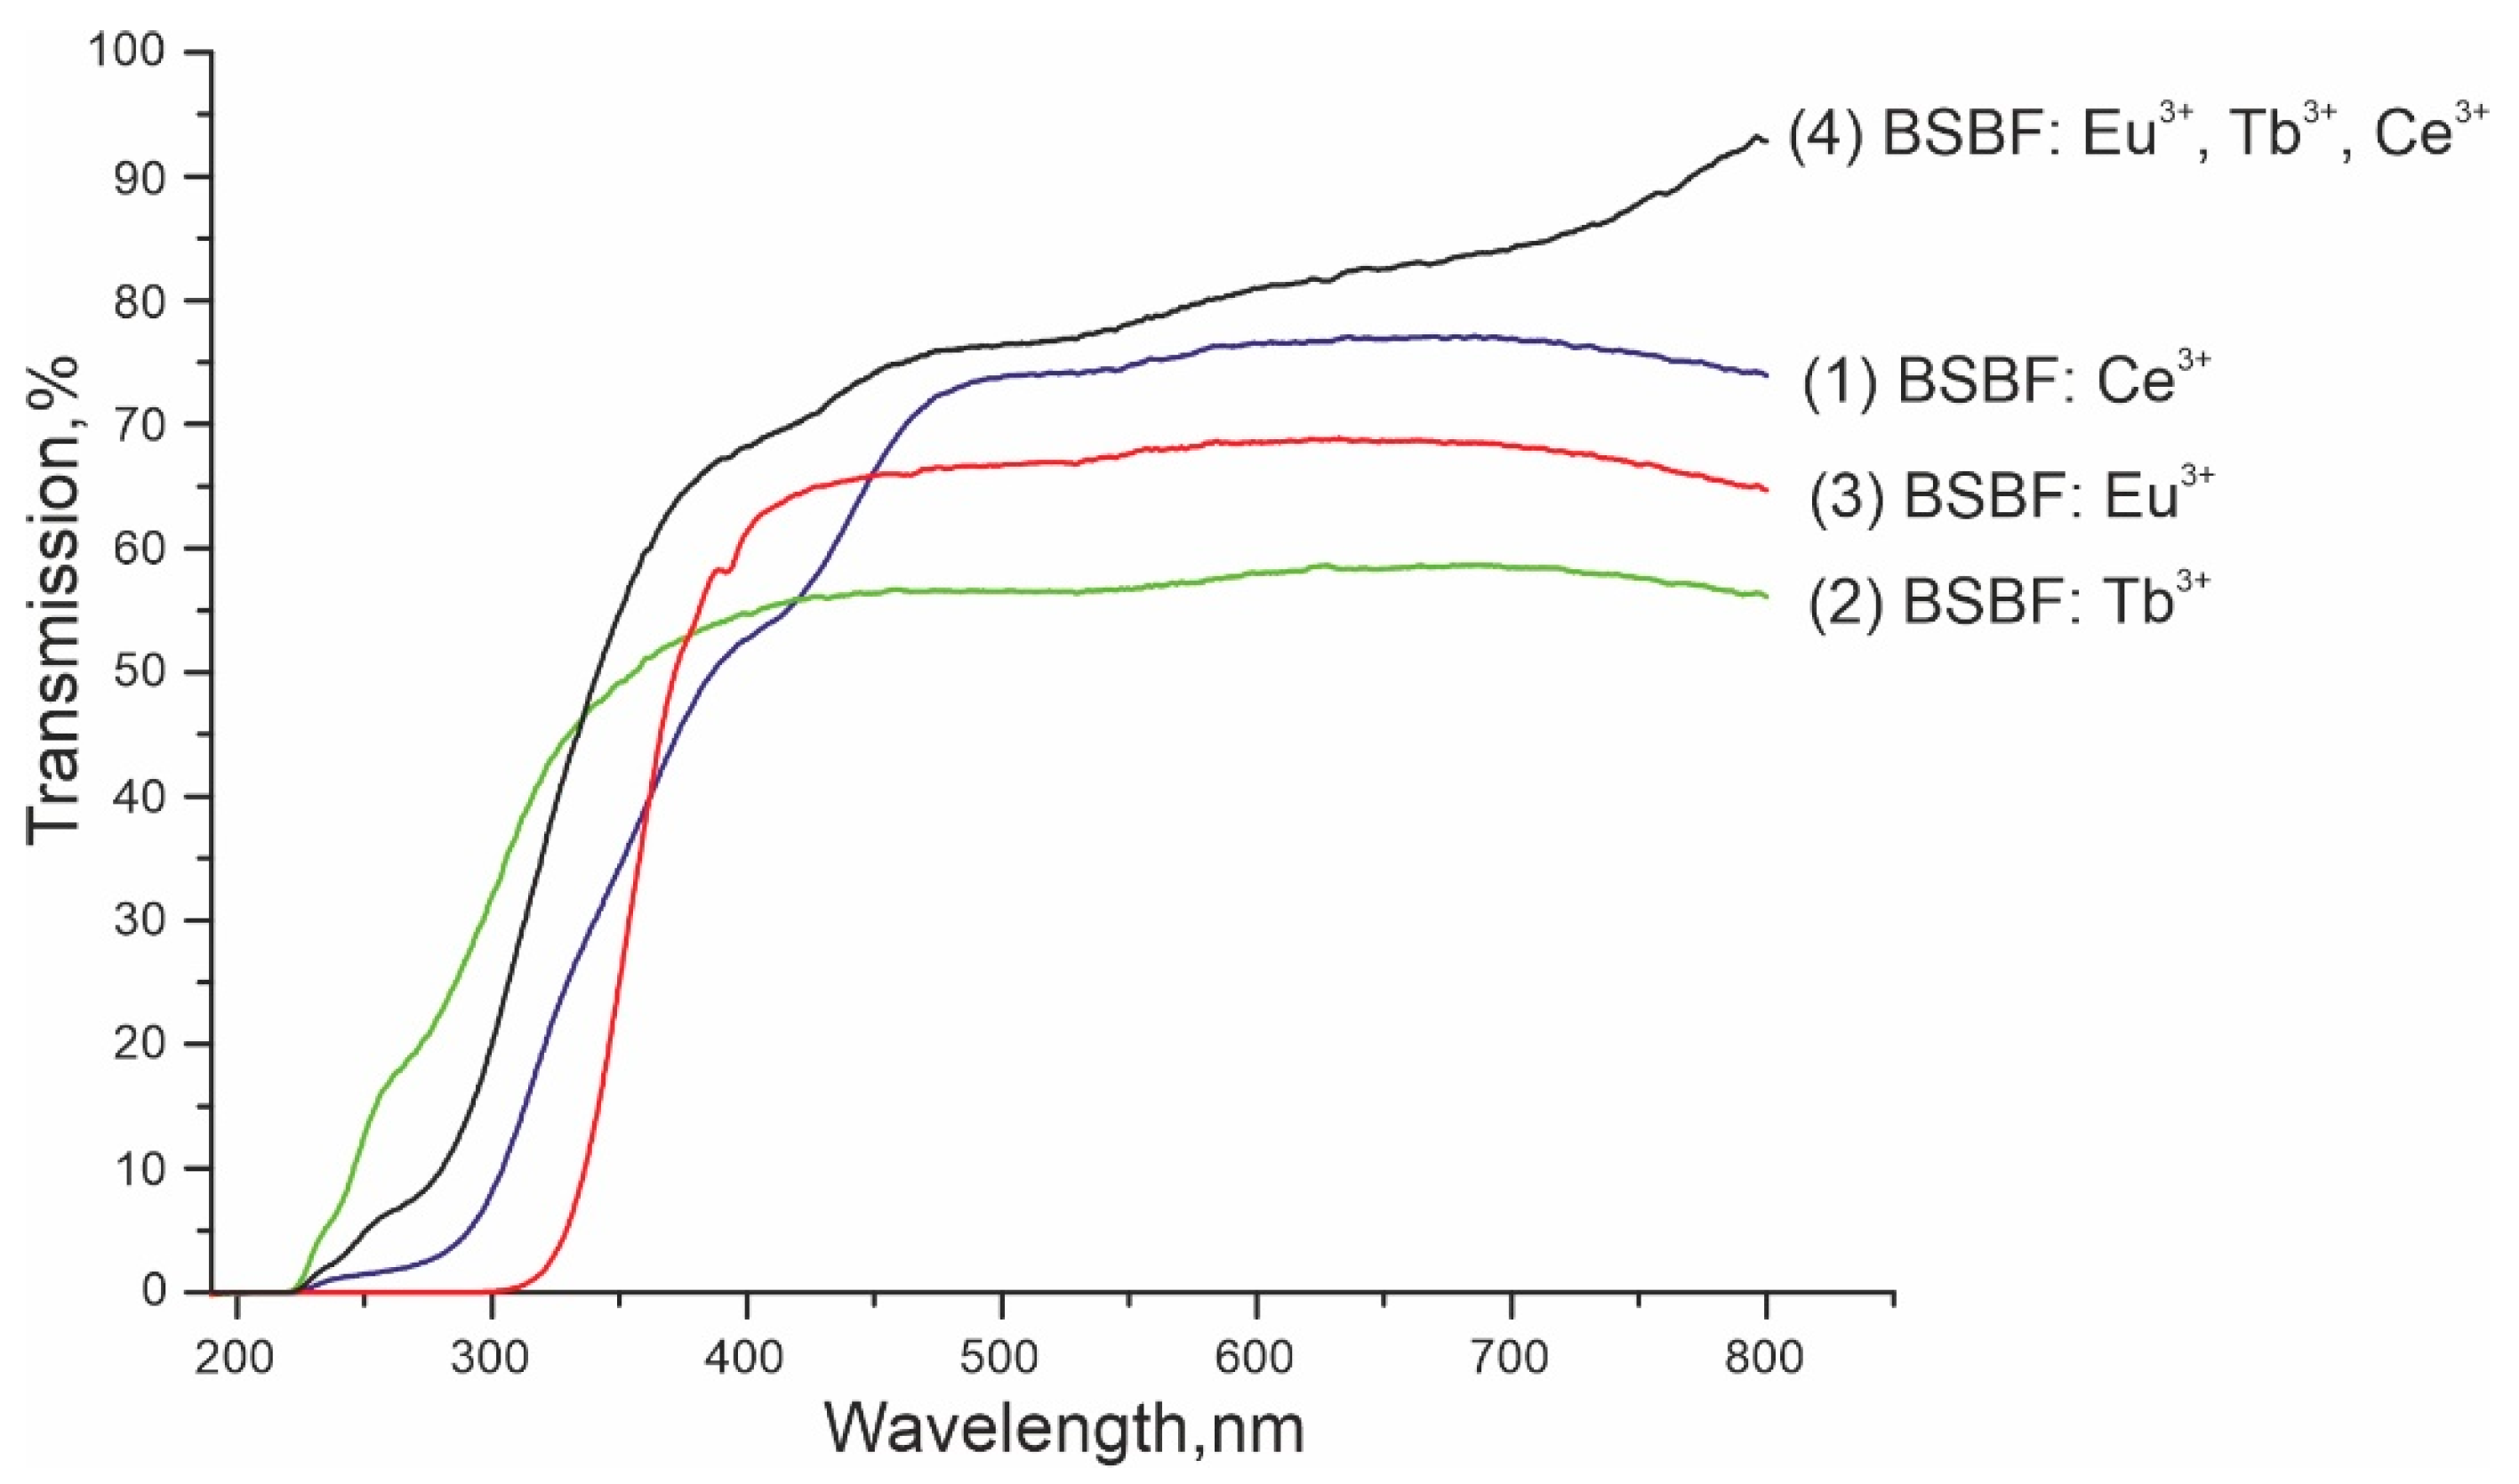
Transmission spectra of the plates made of doped BSBF crystals are depicted in Figure 2. The optical absorption edge of BSBF: Ce3+, BSBF: Tb3+, and BSBF: Eu3+, Tb3+, Ce3+ approximately coincides and corresponds to 225 nm, while BSBF: Tb3+ demonstrates the best transparency in the UV range. This value coincides with the absorption edge of the undoped Ba4Sr3(BO3)4F2 crystal, which is 225 nm (5.517 eV) for 0.5 thick plate at 300 K [13]. According to EDX microanalysis, the concentration of Tb2O3 and Eu2O3 in BSBF: Tb3+ and BSBF: Eu3+, Tb3+, Ce3+ is below the limit of detection, the concentration of Eu2O3 in BSBF: Eu3+ is about 0.7(3) wt%. It can be seen that an increase in the Eu3+ concentration in BSBF: Eu3+ leads to a shift of the absorption edge to the long wavelength region up to 320 nm, which might be accounted for by the high intensity of charge transfer transitions [18].
BSBF: Ce3+. The 5d1→4f1 luminescence of Ce ions sufficiently depends on the nature of the matrix and is in the range from the ultraviolet to the red region of the visible spectrum [19,20,21,22]. In the photoluminescence (PL) spectra of BSBF: Ce3+, weak nicely resolved bands corresponding to the Ce3+ 5D3/22F7/2, 2F5/2 transitions are detected at 400–500 nm under 360–390 nm excitation at 77 K (Figure 3a). Transitions in the same spectral range assigned to cerium ions were reported for Ba2Y5B5O17: Ce3+ phosphor [21]. It is also possible to distinguish an additional band with a maximum of around 460 nm, most clearly at 360–390 nm excitation. For emission at 460 nm, the maximum of the excitation band is about 360 nm (Figure 3b). A similar broadband at 400–500 nm associated with intrinsic defects is observed in the luminescence spectra of undoped crystals at 365 nm excitation [13].
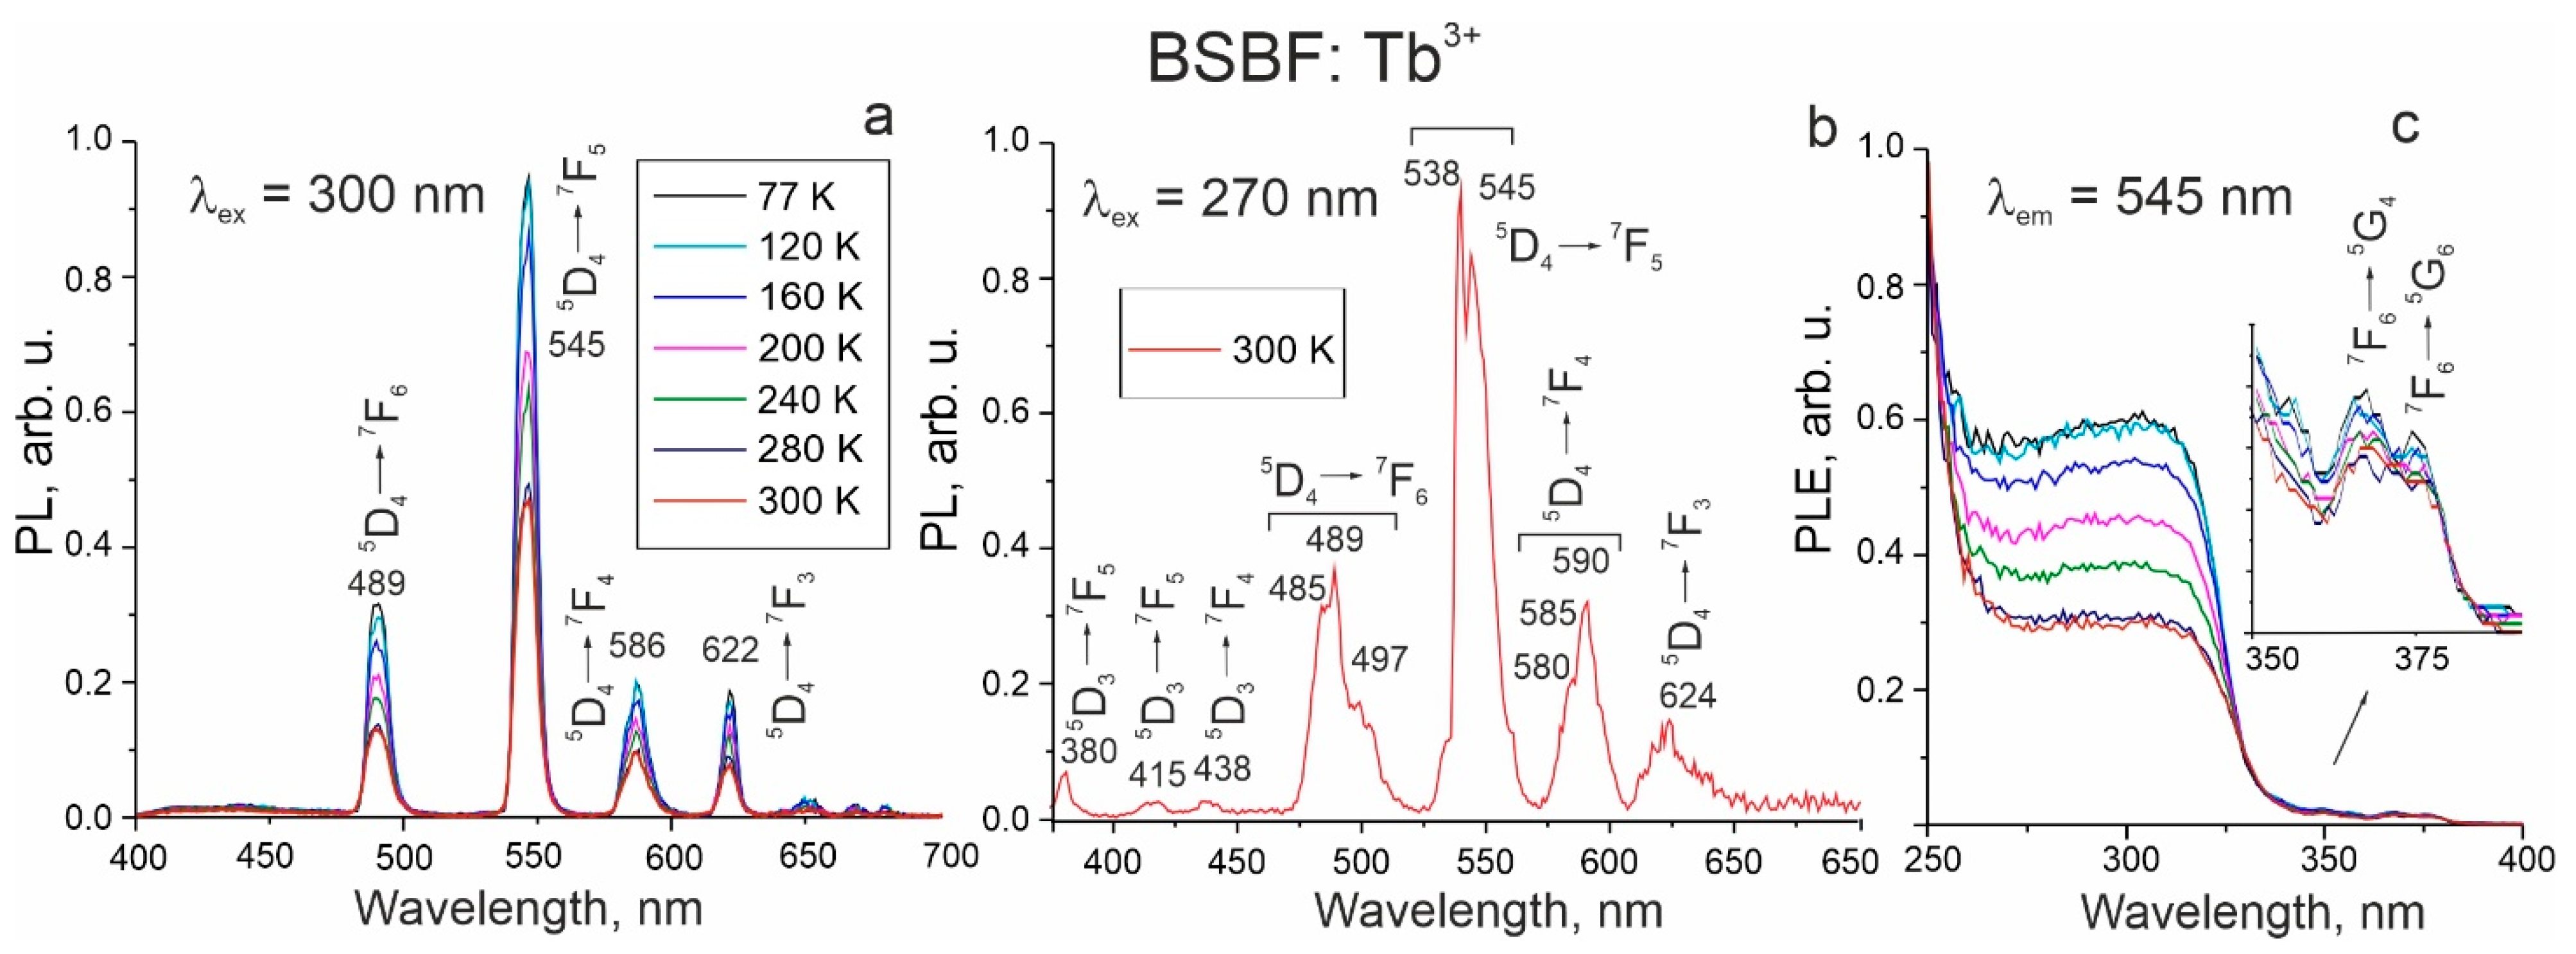
BSBF: Tb3+. The PL spectra of Tb3+ ions are due to 4f8-4f8 transitions, shielded from the host crystal field by electrons of outer 5s and 5p shells, and, therefore, practically insensitive to the matrix. Luminescent spectra of BSBF: Tb3+ at 300 nm excitation consist of four relatively narrow peaks arising from 5D47F6,5,4,3 transitions [23], located in our case at about 489, 545, 586, and 622 nm, respectively (Figure 4a). As the temperature increases from 77 K to 300 K, the intensity of PL decreases monotonically. The spectrum observed at 270 nm excitation distinctively reveals the transition from both 5D3 and 5D4 energy levels. The essential feature of the spectrum is the broadening and splitting of the bands, which is most pronounced for the 5D47F6 (485, 489, and 497 nm), 5D47F5 (538 and 545 nm), and 5D47F4 (580, 585, and 590 nm) transitions (Figure 4b). This may be due to the presence of Tb3+ ions in several cationic positions.
The PLE spectra for emission at 545 nm consist of bands with a sharp edge at around 325 nm (Figure 4c). The observed shape of the spectra is characteristic of transitions between the valence and conduction bands. In the range of 360–380 nm, the weak Tb3+ transitions are revealed (Figure 4c).
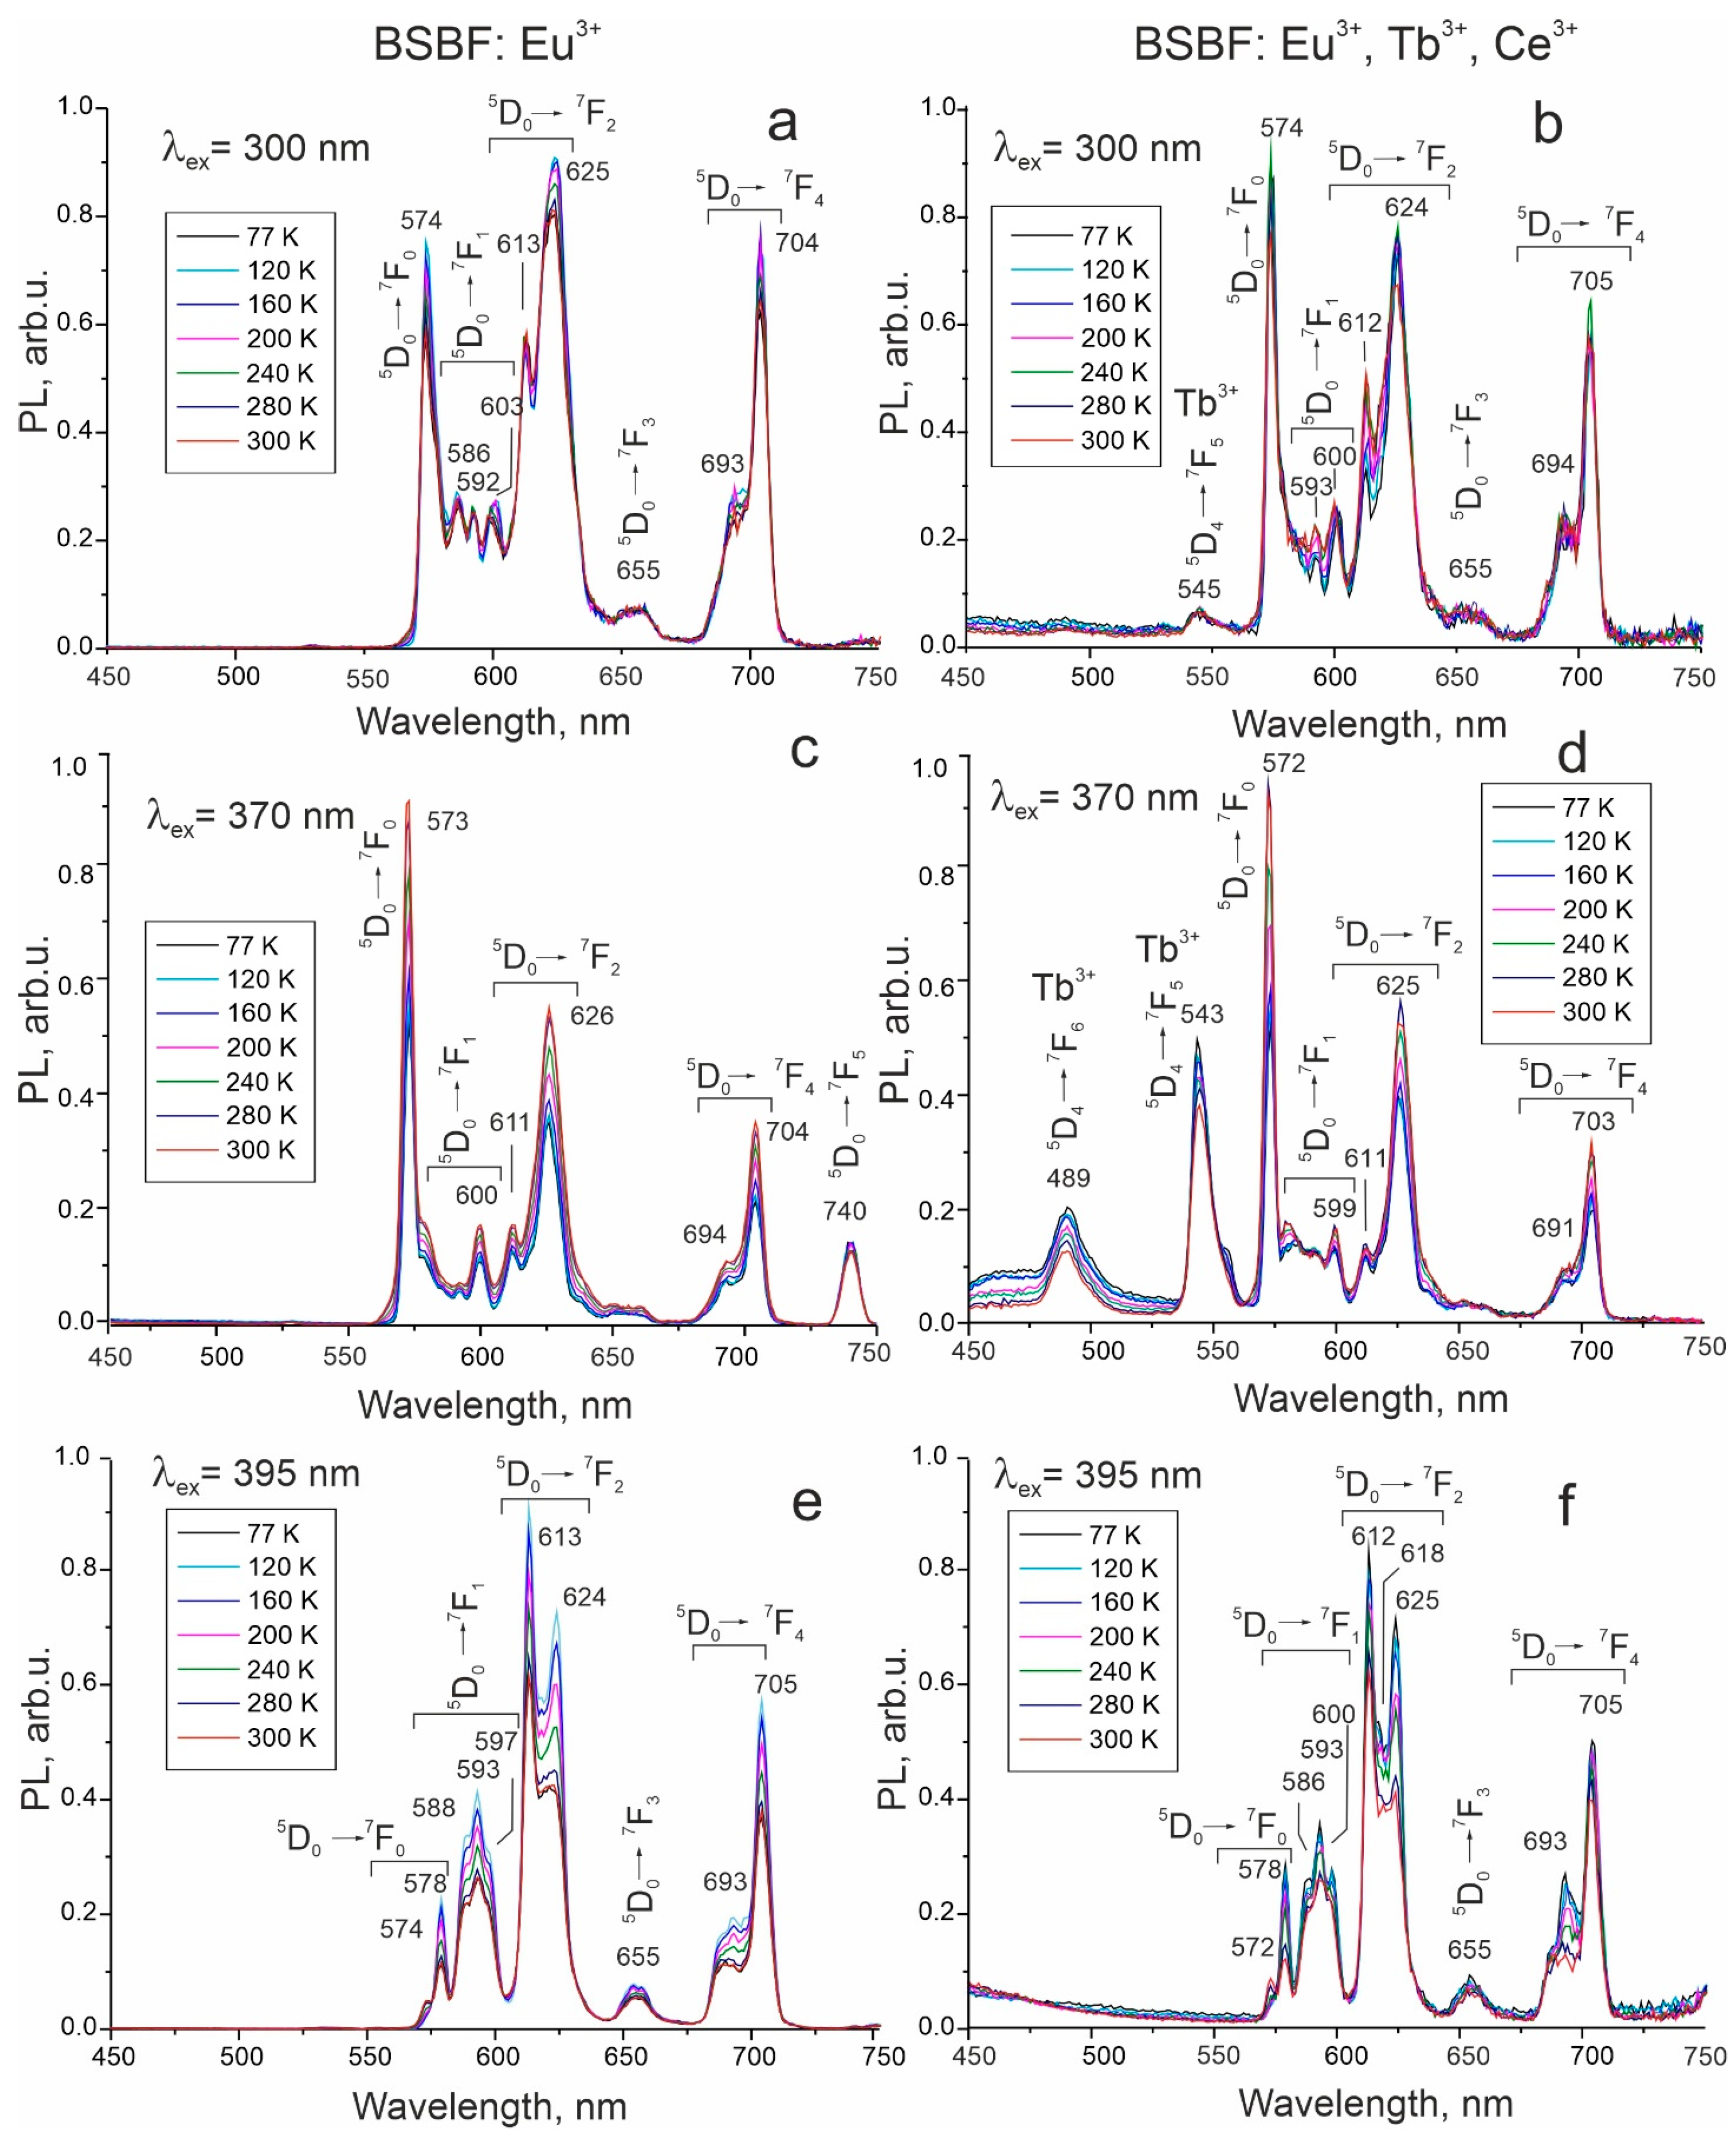
BSBF: Eu3+ and BSBF: Eu3+,Tb3+,Ce3+. In the case of Eu3+, 4f6-4f6 transitions take place between the lowest excited state 5D0 and seven multiplets of 7FJ (J = 0–6) ground term. Transitions to the 7F5 and 7F6 multiplets are at 740–770 nm and 810–840 nm, respectively [24], and often lie outside of the investigated spectral range. The PL spectra of both crystals at 300, 370, and 395 nm excitation reveal broadened and split bands, which might be caused by the presence of rare earth elements in nonequivalent crystallographic sites and crystal field splitting (Figure 5, Table 2).
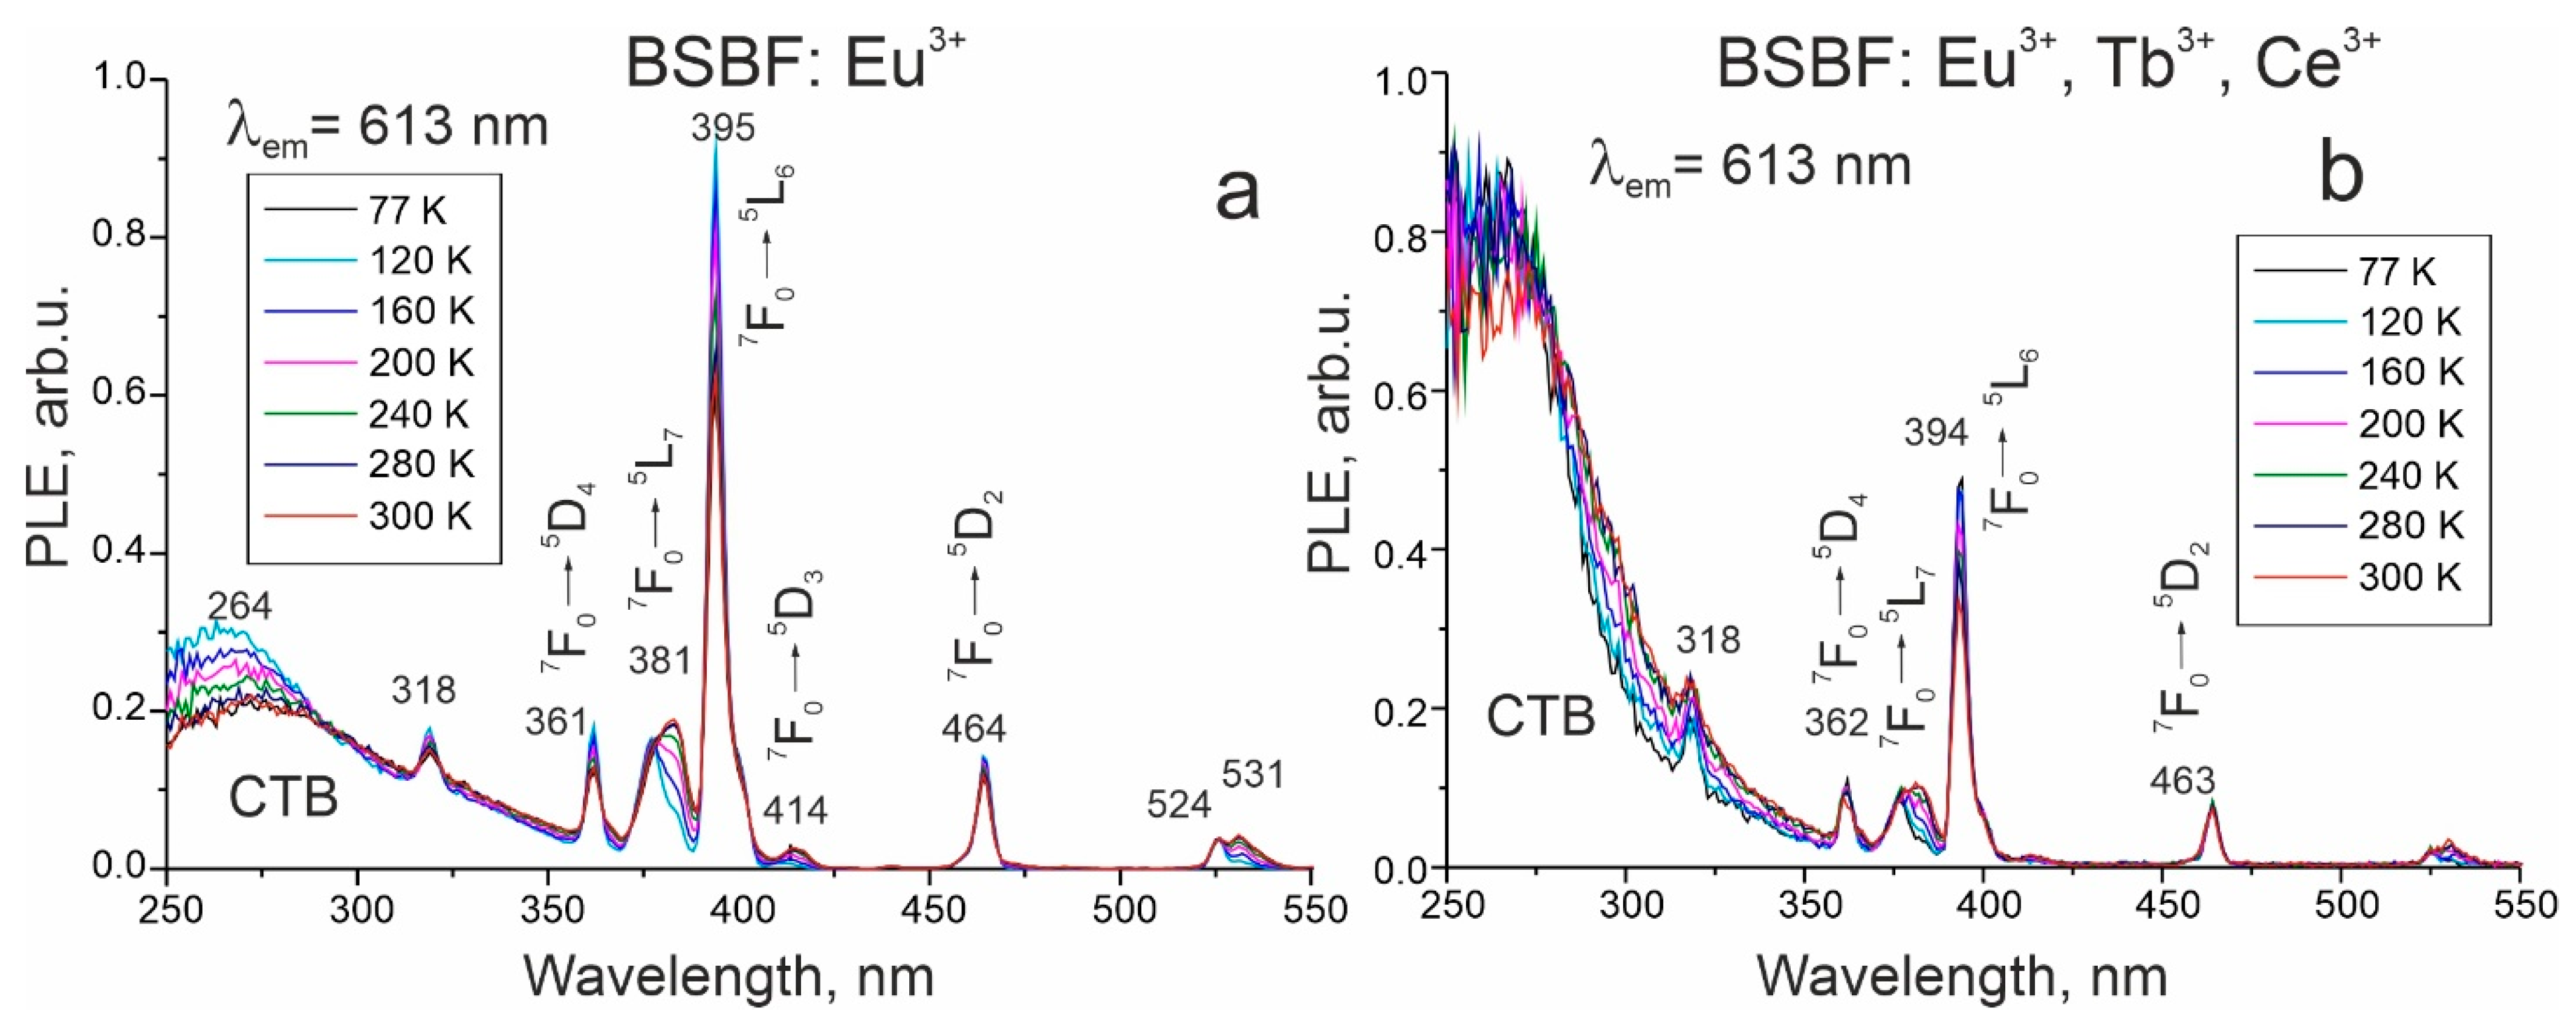
The prominent feature of PL spectra at 300 nm excitation is the high intensity of the 5D07F0 transition at about 574 nm. Such 0-0 transitions are forbidden according to the ΔJ selection rule. The explanations proposed so far for the breakdown of this rule assume crystal filed induced J-mixing [25,26,27] and mixing of charge-transfer state [28] into the 4f6 wavefunctions. It is worth noting that these two mechanisms are inversely related. In Ref. [26], the authors admit that charge transfer states of Eu3+ lie near the 4f6 levels and, therefore, may sufficiently affect the electronic structure of Eu3+. Charge transfer bands (CTB) are due to electron transfer. This process implies the formal reduction in trivalent europium to bivalent state and is accompanied by a change in the ionic radius of europium and strong lattice relaxation. Since CTB in all Eu-containing BSBF crystals has a pronounced intensity (Figure 6), we believe that charge-transfer state mixing is the key factor causing the high intensity of the above-mentioned transition.
Among the compounds with the strong intensity of the 5D07F0 transition are LaOBr [29], Sr5(PO4)3F [30], Ca10(PO4)6(OH)2 [29,31], BaFCl [26,28]. The ratio of intensities of 5D07F0/5D07F1 listed in Ref. [26] for LaOBr, Sr5(PO4)3F, Ca10(PO4)6(OH)2, and BaFCl compounds is 2.5, >20, ~10, and 35, respectively. For BSBF: Eu3+ and BSBF: Eu3+, Tb3+, Ce3+, this value is about 2.9 and 3.4, respectively. The 5D07F1 transition, which is of a magnetic-dipole nature, is chosen for the comparison as its intensity is nearly insensitive to site symmetry. According to Binnemans and GorllerWarland [32], the 5D07F0 transition manifests itself only if Eu3+ ions occupy the site with the symmetry of Cnv, Cn, or Cs, which agrees with the symmetry of cationic positions in BSBF.
Transitions with J > 0 depend on the site symmetry [33]. According to Ref. [34], the number of components for 5D07Fj (J = 0–4) transitions is 1, 3, 5, 7, and 9 for the site with Cs symmetry, and 1, 2, 3, 3, and 5 for the C3v site. It is worth noting that the major difficulty in unambiguous assignment of the peaks is their overlap due to a small crystal field splitting. The symmetry-sensitive 5D07F1 of magnetic-dipole nature and 5D07F2 of electric-dipole nature transitions are usually taken into consideration to establish a connection between site symmetry and band splitting [24,35]. In both BSBF: Eu3+ and BSBF: Eu3+, Tb3+, Ce3+, the splitting of the bands related to these transitions is observed (Figure 5). Thus, the BSBF: Eu3+ crystal at 300 nm excitation exhibits three well-resolved peaks at about 586, 592, and 603 nm associated with the 5D07F1 transition (Figure 5a). The intensity of various transitions in the spectra of BSBF: Eu3+ nonmonotonically changes with temperature (Figure 5a,c,e).
In addition to the discussed peaks associated with the transitions of Eu3+ ions, the BSBF: Eu3+, Tb3+, Ce3+ crystal reveals weak peaks at around 545 nm under 300 nm excitation related to the 5D47F5 transition of Tb3+ ions (Figure 5b). The emission of cerium ions expected in the region 400–450 nm is virtually absent (Figure 5d), which differs dramatically from the luminescence spectra observed in LiBa12(BO3)4F4 (LBBF): Eu3+, Tb3+, Ce3+ crystal grown from the high-temperature solution with exactly the same concentration of Eu3+, Tb3+, and Ce3+ [11]. In the latter case, strong emission of cerium ions is observed at 77 K.
At 370 nm excitation, the most intense band is attributed to 5D07F0 Eu3+ transition in both BSBF: Eu3+ and BSBF: Eu3+, Tb3+, Ce3+ crystals. Relatively strong transitions at 489 nm and 543 nm of Tb3+ are present in BSBF: Eu3+, Tb3+, and Ce3+ (Figure 5d).
The intensity ratio of the charge transfer band and transitions in Eu3+ ions differs significantly for BSBF: Eu3+ and BSBF: Eu3+, Tb3+, Ce3+ (Figure 6). For BSBF: Eu3+ for emission at 613 nm, Eu3+ transitions have a dominant intensity, which is accounted for by a relatively higher concentration of Eu3+ in BSBF: Eu3+.
In order to verify the realization of energy transfer from terbium to europium, reported for a number of compounds such as La3GaGe5O16:Tb3+, Eu3+ [36], La0.02Tb0.90Eu0.08PO4 [37], A3Tb0.90Eu0.10(PO4)3 (A = Sr, Ba) [38], WO3: Tb3+xEu3+y [39], we measured decay times for the BSBF: Eu3+, BSBF: Tb3+, and BSBF: Eu3+, Tb3+, Ce3+ crystals. The decay time for BSBF: Eu3+ for emission at 613 nm after excitation at 395 nm is 2.2 ms (Figure 7a). Decay times for BSBF: Tb3+ (Figure 7b) and BSBF: Eu3+, Tb3+, Ce3+ (Figure 7c) for emission at 545 nm after excitation at 300 nm are typical of terbium ions and close enough in value, 2.58 ms and 2.64 ms, respectively, which cast doubt on the implementation of energy transfer.
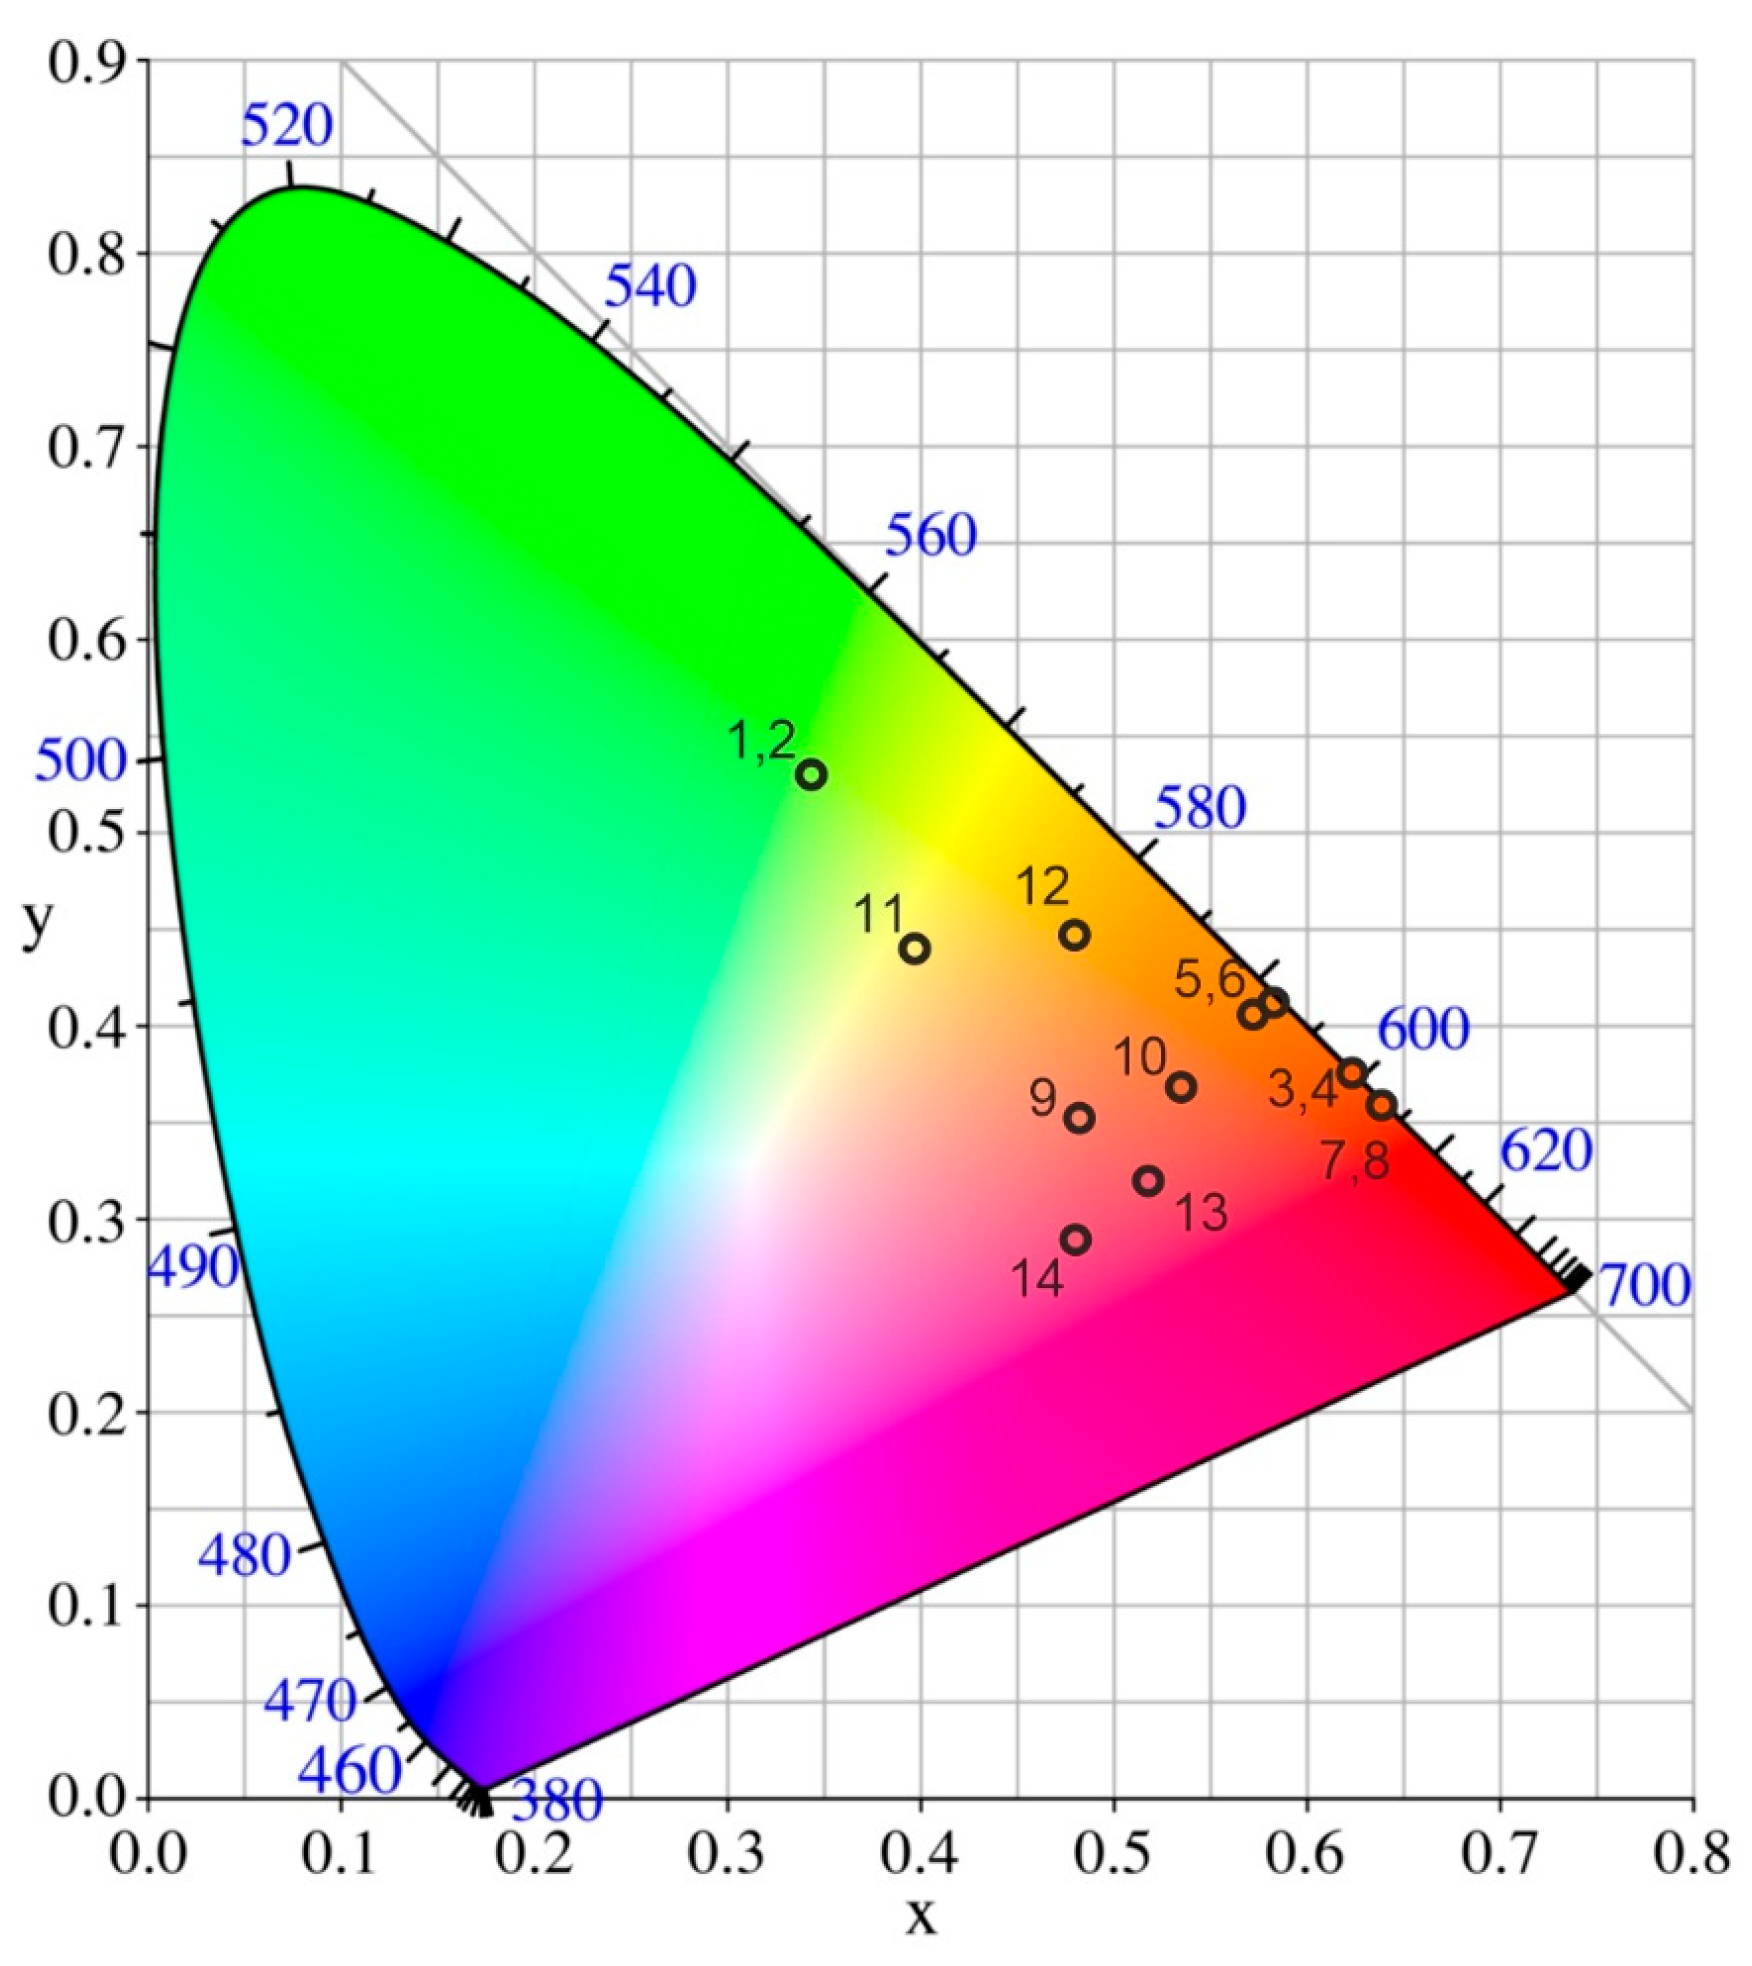
The CIE chromaticity coordinates and correlated color temperature of BSBF: Tb3+, BSBF: Eu3+, and BSBF: Eu3+, Tb3+, and Ce3+ crystals are provided in Figure 8 and Table 3. The spectra of BSBF: Eu3+ at temperatures of 77 K and 300 K are quite similar, which results in the close values of CIE coordinates. Due to the high intensity of 5D07F0 Eu3+ transition at 370 nm excitation, the BSBF: Eu3+ emission is yellow shifted (points 5, 6, Figure 8) in comparison with emission at 300 nm (points 3, 4, Figure 8) and 370 nm (points 7, 8, Figure 8) excitation. The quantum yield for BSBF: Eu3+ at 395 nm excitation is about 10.6%. Thus, of special interest is the dependence of luminescence intensity and quantum yield on Eu3+ concentration, which requires further study.
Unlike the LBBF: Eu3+, Tb3+, Ce3+ [10] and LBBF: Eu3+, Tb3+ [40] crystals, which exhibit white emission close to daylight at 370 nm excitation, the BSBF: Eu3+, Tb3+, Ce3+ emission at 370 nm excitation is yellow shifted (points 11, 12, Figure 8). This might be due to the different ability of europium, terbium, and cerium to enter the BSBF structure (as we mentioned above, the emission of cerium ions in BSBF: Eu3+, Tb3+, Ce3+ is practically absent). The BSBF: Eu3+, Tb3+, Ce3+ emission under 300 nm (points 9, 10, Figure 8) and 395 nm (points 13, 14, Figure 8) excitations are in the red area as the Eu3+ transitions are the most prominent.

4. Conclusions

The Ba4−xSr3+x(BO3)4−yF2+3y (BSBF) crystals doped with Eu3+, Tb3+, and Ce3+ were grown using NaF as a solvent. The structure of the BSBF: Eu3+ crystal was solved in the same group P63mc as the undoped BSBF crystal. It reveals three nonequivalent crystallographic cationic positions: (15)Ba, (13)Sr, and isomorphic position (16)M, statistically occupied by Ba and Sr. The presence of Eu2O3 in BSBF: Eu3+ in a concentration of about 0.7(3) wt% leads to a shift of the absorption edge from 225 nm to 320 nm. The results of the study of luminescence properties of BSBF: Ce3+, BSBF: Tb3+, BSBF: Eu3+, and BSBF: Eu3+, Tb3+, Ce3+ show that terbium and europium can be effectively doped into the host while cerium emission is very weak. The observed broadening and splitting of the emission peaks can be associated both with splitting in accordance with the position symmetry and with the fact that impurity atoms occupy crystallographically nonequivalent positions in the structure. Decay times for BSBF: Tb3+ and BSBF: Eu3+, Tb3+, Ce3+ for emission at 545 nm after excitation at 300 nm are rather close, 2.58 ms and 2.64 ms, respectively, which cast doubt on the implementation of Tb3+→Eu3+ energy transfer. The PL spectra of BSBF: Eu3+ at 77 and 300 K are similar with CIE chromaticity coordinates of (0.617; 0.378) at 300 nm excitation and (0.634; 0.359) at 395 nm excitation and low correlated color temperature which implies application prospects in the field of lighting. Due to the high intensity of 5D07F0 Eu3+ transition at 370 nm excitation, the BSBF: Eu3+ emission is yellow-shifted. The quantum yield for BSBF: Eu3+ at 395 nm excitation is about 10.6%. The dependence of the luminescence intensity and quantum yield on the concentration of rare earth elements in BSBF requires further study.

Supplementary Materials

The following supporting information can be downloaded at: https://www.mdpi.com/article/10.3390/ma16155344/s1, Table S1: Details of data collection and structure refinement for Ba4−xSr3+x(BO3)4−yF2+3y:Eu3+ crystal; Table S2: Bond valence calculations according to Brese and O’Keeffe (1991) for Eu3+ substitution in Sr, Ba, and M sites in the Ba4−xSr3+x(BO3)4−yF2+3y solid solution; Figure S1: X-ray powder diffraction pattern of the BSBF: Eu3+ crystal.

Author Contributions

Conceptualization, T.B.B.; Investigation, A.A.R., S.V.R., A.V.D., E.B.B. and V.P.S.; Writing—original draft, E.B.B.; Writing—review & editing, E.B.B.; Funding acquisition, T.B.B. All authors have read and agreed to the published version of the manuscript.

Funding

This work was supported by the Russian Science Foundation, grant No. 21-19-00097, https://www.rscf.ru/project/21-19-00097/ (accessed on 1 April 2021).

Institutional Review Board Statement

Not applicable.

Informed Consent Statement

Not applicable.

Data Availability Statement

Data are currently unavailable (no publicly archived datasets created) but can be sent if anybody is interested in.

Conflicts of Interest

The authors declare no conflict of interest.

References

  1. Mutailipu, M.; Poeppelmeier, K.R.; Pan, S. Borates: A Rich Source for Optical Materials. Chem. Rev. 2021, 121, 1130–1202. [Google Scholar] [CrossRef] [PubMed]
  2. Diaz, A.; Keszler, D.A. Eu2+ luminescence in the borates X2Z (BO3)2 (X = Ba, Sr; Z = Mg, Ca). Chem. Mater. 1997, 9, 2071–2077. [Google Scholar] [CrossRef]
  3. Spassky, D.A.; Levushkina, V.S.; Mikhailin, V.V.; Zadneprovski, B.I.; Tret’yakova, M.S. Luminescence of borates with yttrium and lutetium cations. Phys. Solid State 2013, 55, 150–159. [Google Scholar] [CrossRef]
  4. Wang, S.; Xu, Y.; Chen, T.; Jiang, W.; Liu, J.; Zhang, X.; Liang, W.; Wang, L. A red phosphor LaSc3(BO3)4:Eu3+ with zero-thermal-quenching and high quantum efficiency for LEDs. Chem. Eng. J. 2021, 404, 125912. [Google Scholar] [CrossRef]
  5. Li, Y.; Zhang, J.; Zhang, X.; Luo, Y.; Lu, S.; Ren, X.; Wang, X.; Sun, L.; Yan, C. Luminescent Properties in Relation to Controllable Phase and Morphology of LuBO3:Eu3+ Nano/Microcrystals Synthesized by Hydrothermal Approach. Chem. Mater. 2009, 21, 468–475. [Google Scholar] [CrossRef]
  6. Gaffuri, P.; Salaün, M.; Gautier-Luneau, I.; Chadeyron, G.; Potdevin, A.; Rapenne, L.; Ibanez, A. Rare-earth-free zinc aluminium borate white phosphors for LED lighting. J. Mater. Chem. C 2020, 8, 11839–11849. [Google Scholar] [CrossRef]
  7. Khan, Z.S.; Ingale, N.B.; Omanwar, S.K. Synthesis and thermoluminescence properties of rare earth-doped NaMgBO3 phosphor. Environ. Sci. Pollut. Res. 2016, 23, 9295–9302. [Google Scholar] [CrossRef]
  8. Nagpure, P.A.; Omanwar, S.K. Synthesis and luminescence characteristics of terbium (III) activated NaSrBO3. J. Rare Earths 2012, 30, 856–859. [Google Scholar] [CrossRef]
  9. Xu, S.; Li, P.; Wang, Z.; Li, T.; Bai, Q.; Sun, J.; Yang, Z. Luminescence and energy transfer of Eu2+/Tb3+/Eu3+ in LiBaBO3 phosphors with tunable-color emission. J. Mater. Chem. C 2015, 3, 9112–9121. [Google Scholar] [CrossRef]
  10. Zhang, X.; Zhou, L.; Pang, Q.; Gong, M. A broadband-excited and narrow-line GdBO3: Ce3+, Tb3+, Eu3+ red phosphor with efficient Ce3+→(Tb3+) n→ Eu3+ energy transfer for NUV LEDs. Opt. Mater. 2014, 36, 1112–1118. [Google Scholar] [CrossRef]
  11. Bekker, T.B.; Ryadun, A.A.; Davydov, A.V.; Solntsev, V.P.; Grigorieva, V.D. Luminescence properties of rare-earth-doped fluoride borate crystals. J. Alloys Compd. 2022, 900, 163343. [Google Scholar] [CrossRef]
  12. Rashchenko, S.V.; Bekker, T.B.; Bakakin, V.V.; Seryotkin, Y.V.; Shevchenko, V.S.; Kokh, A.E.; Stonoga, S.Y. New Fluoride Borate Solid-solution Series Ba4−xSr3+x(BO3)4−yF2+3y. Cryst. Growth Des. 2012, 12, 2955–2960. [Google Scholar] [CrossRef]
  13. Bekker, T.B.; Solntsev, V.P.; Yelisseyev, A.P.; Rashchenko, S.V. Fluoride borates with [(BO3)F]4−↔ [F4]4− anionic isomorphism and X-ray sensitivity. Cryst. Growth Des. 2016, 16, 4493–4499. [Google Scholar] [CrossRef]
  14. Rothkirch, A.; Gatta, G.D.; Meyer, M.; Merkel, S.; Merlini, M.; Liermann, H.-P. Single-crystal diffraction at the extreme conditions beamline P02.2: Procedure for collecting and analyzing high-pressure single-crystal data. J. Synchrotron Radiat. 2013, 20, 711–720. [Google Scholar] [CrossRef] [Green Version]
  15. Palatinus, L.; Chapuis, G. SUPERFLIP–a computer program for the solution of crystal structures by charge flipping in arbitrary dimensions. J. Appl. Crystallogr. 2007, 40, 786–790. [Google Scholar] [CrossRef] [Green Version]
  16. Petříček, V.; Dušek, M.; Palatinus, L. Crystallographic computing system JANA2006: General features. Z. Krist.—Cryst. Mater. 2014, 229, 345–352. [Google Scholar] [CrossRef]
  17. Brese, N.E.; O’Keeffe, M. Bond-Valence Parameters for Solids. Acta Crystallogr. B Struct. Sci. Cryst. Eng. Mater. 1991, 47, 192–197. [Google Scholar] [CrossRef]
  18. Blasse, G. The Influence of Charge-Transfer and Rydberg States on the Luminescence Properties of Lanthanides and Actinides, Spectra and Chemical Interactions; Braterman, P.S., Blasse, G., Müller, A., Baran, E.J., Carter, R.O., Eds.; Springer: Berlin/Heidelberg, Germany, 1976; pp. 43–79. [Google Scholar]
  19. Putaj, P.; De Haas, J.T.M.; Kramer, K.W.; Dorenbos, P. Optical and Scintillation Properties of the Thermal Neutron Scintillator Li3YCl6:Ce. IEEE Trans. Nucl. Sci. 2010, 57, 1675–1681. [Google Scholar] [CrossRef]
  20. Tong, X.; Zhang, X.; Wu, L.; Zhang, H.; Seo, H.J. On the photoluminescence of multi-sites Ce3+ in T-phase orthosilicate and energy transfer from Ce3+ to Tb3+. J. Alloys Compd. 2018, 748, 871–875. [Google Scholar] [CrossRef]
  21. Xiao, Y.; Hao, Z.; Zhang, L.; Xiao, W.; Wu, D.; Zhang, X.; Zhang, J. Highly efficient green-emitting phosphors Ba2Y5B5O17 with low thermal quenching due to fast energy transfer from Ce3+ to Tb3+. Inorg. Chem. 2017, 56, 4538–4544. [Google Scholar] [CrossRef]
  22. Lazarowska, A.; Lesniewski, T.; Mahlik, S.; Grinberg, M.; Liu, R.S. Thermal quenching of Ce3+ luminescence in the cuspidine-type oxide nitride compounds Y4Si2−xAlxO7+xN2−x. J. Lumin. 2018, 193, 125–132. [Google Scholar] [CrossRef]
  23. Linganna, K.; Sreedhar, V.B.; Jayasankar, C.K. Luminescence properties of Tb3+ ions in zinc fluorophosphate glasses for green laser applications. Mater. Res. Bull. 2015, 67, 196–200. [Google Scholar] [CrossRef]
  24. Binnemans, K. Interpretation of europium (III) spectra. Coord. Chem. Rev. 2015, 295, 1–45. [Google Scholar] [CrossRef] [Green Version]
  25. Porcher, P.; Caro, P. Influence of J-mixing on the phenomenological interpretation of the Eu3+ ion spectroscopic properties. J. Lumin. 1980, 21, 207–216. [Google Scholar] [CrossRef]
  26. Tanaka, M.; Kushida, T. Effects of static crystal field on the homogeneous width of the 5D07F0 line of Eu3+ and Sm2+ in solids. Phys. Rev. B 1995, 52, 4171–4178. [Google Scholar] [CrossRef]
  27. Malta, O.L.; Azevedo, W.M.; Gouveia, E.A.; de Sa, G.F. On the 5D07F0 transition of the Eu3+ ion in the {(C4H9)4N}3Y(NCS)6 host. J. Lumin. 1982, 26, 337–343. [Google Scholar] [CrossRef]
  28. Chen, X.Y.; Liu, G.K. The standard and anomalous crystal-field spectra of Eu3+. J. Solid State Chem. 2005, 178, 419–428. [Google Scholar] [CrossRef]
  29. Holsa, J.; Porcher, P. Crystal field effects in REOBr:Eu3+. J. Chem. Phys. 1982, 76, 2790. [Google Scholar] [CrossRef]
  30. Wright, A.O.; Seltzer, M.D.; Gruber, J.B.; Chai, B.H.T. Site-selective spectroscopy and determination of energy levels in Eu3+-doped strontium fluorophosphates. J. Appl. Phys. 1995, 78, 2456. [Google Scholar] [CrossRef]
  31. Ternane, R.; Panczer, G.; Cohen-Adad, M.T.; Goutaudier, C.; Boulon, G.; Kbir-Ariguib, N.; Trabelsi-Ayedi, M. Relationships between structural and luminescence properties in Eu3+-doped new calcium borohydroxyapatite. Opt. Mater. 2001, 16, 291. [Google Scholar] [CrossRef]
  32. Binnemans, K.; Görller-Walrand, C. Application of the Eu3+ ion for site symmetry determination. J. Rare Earths 1996, 14, 173–180. [Google Scholar]
  33. Bunzli, J.C.G.; Pradervand, G.O. The Eu(III) ion as luminescent probe: Laser-spectroscopic investigation of the metal ion sites in an 18-crown-6 complex. J. Chem. Phys. 1986, 85, 2489–2497. [Google Scholar] [CrossRef]
  34. Tanner, P.A. Some misconceptions concerning the electronic spectra of tri-positive europium and cerium. Chem. Soc. Rev. 2013, 42, 5090–5101. [Google Scholar] [CrossRef]
  35. Gupta, S.K.; Reghukumar, C.; Kadam, R.M. Eu3+ local site analysis and emission characteristics of novel Nd2Zr2O7:Eu phosphor: Insight into the effect of europium concentration on its photoluminescence properties. RSC Adv. 2016, 6, 53614. [Google Scholar] [CrossRef]
  36. Zhou, J.; Xia, Z. Multi-color emission evolution and energy transfer behavior of La3GaGe5O16: Tb3+, Eu3+ phosphors. J. Mater. Chem. C. 2014, 2, 6978–6984. [Google Scholar] [CrossRef]
  37. Luo, Y.; Liu, Z.; Wong, H.T.; Zhou, L.; Wong, K.L.; Shiu, K.K.; Tanner, P.A. Energy transfer between Tb3+ and Eu3+ in LaPO4: Pulsed versus switched-off continuous wave excitation. Adv. Sci. 2019, 6, 1900487. [Google Scholar] [CrossRef] [Green Version]
  38. Carneiro Neto, A.N.; Moura, R.T.; Andrii, S.; Paterlini, V.; Piccinelli, F.; Bettinelli, M.G.; Malta, O.L. Theoretical and experimental investigation of the Tb3+-Eu3+ energy transfer mechanisms in cubic A3Tb0.90Eu0.10({PO}4)3 (A = Sr, Ba) materials. J. Phys. Chem. C 2020, 124, 10105–10116. [Google Scholar] [CrossRef]
  39. Rastogi, C.K.; Sharma, S.K.; Sasmal, S.; Pala, R.G.S.; Kumar, J.; Sivakumar, S. Terbium ion-mediated energy transfer in WO3: Tb3+ and Eu3+ phosphors for UV-sensitized white light emission. J. Phys. Chem. C 2021, 125, 6163–6175. [Google Scholar] [CrossRef]
  40. Bekker, T.B.; Ryadun, A.A.; Davydov, A.V.; Rashchenko, S.V. LiBa12(BO3)7F4 (LBBF) crystals doped with Eu3+, Tb3+, Ce3+: Structure and luminescence properties. Dalton Trans. 2023, 52, 8402–8413. [Google Scholar] [CrossRef]
Figure 1. Coordinated environment of three different cationic positions, Ba, Sr, and M, in the Ba4−xSr3+x(BO3)4−yF2+3y (P63mc) solid solution. Position M is statistically populated with Ba and Sr.
Materials 16 05344 g001
Figure 2. Transmission spectra of 1 mm thick plates made of doped Ba4−xSr3+x(BO3)4−yF2+3y (BSBF) crystals: (1) BSBF: Ce3+, (2) BSBF: Tb3+, (3) BSBF: Eu3+, (4) BSBF: Eu3+, Tb3+, Ce3+. Photographs of the corresponding plates are given in Table 1.
Materials 16 05344 g002
Figure 3. PL spectrum of BSBF: Ce3+ under excitation in 270–390 nm range (a) and PLE spectrum of BSBF: Ce3+ for emission at 460 nm (b), 77 K.
Materials 16 05344 g003
Figure 4. PL spectra of BSBF: Tb3+ crystal at 300 nm (a) and 270 nm (b) excitation and PLE spectra for emission at 545 nm (c). Spectra coloring for (c) is the same as it is in (a).
Materials 16 05344 g004
Figure 5. PL spectra of BSBF: Eu3+ at 300 nm (a), 370 nm (c), and 395 nm (e) excitation and PL spectra of BSBF: Eu3+, Tb3+, Ce3+ at 300 nm (b), 370 nm (d), and 395 nm (f) excitation.
Materials 16 05344 g005
Figure 6. PLE spectra of BSBF: Eu3+ (a) and BSBF: Eu3+, Tb3+, Ce3+ (b) for emission 613 nm, CTB—charge transfer band.
Materials 16 05344 g006
Figure 7. Decay curves for BSBF: Eu3+ at 613 nm emission under excitation at 395 nm (a); BSBF: Tb3+ at 545 nm emission under excitation at 300 nm (b), and BSBF: Eu3+, Tb3+, Ce3+ crystal at 545 nm emission under excitation at 300 nm (c), 300 K.
Materials 16 05344 g007
Figure 8. CIE chromaticity diagram for BSBF: Tb3+ at 300 nm excitation at (1) 77 and (2) 300 K; BSBF: Eu3+ at 300 nm excitation at (3) 77 K and (4) 300 K, at 370 nm excitation at (5) 77 K and (6) 300 K, and at 395 nm excitation at (7) 77 K and (8) 300 K; BSBF: Eu3+, Tb3+, Ce3+ at 300 nm excitation at (9) 77 K and (10) 300 K, at 370 nm excitation at (11) 77 K and 300 K (12), and at 395 nm excitation at (13) 77 K and (14) 300 K. Corresponding CIE chromaticity coordinates and correlated color temperature are given in Table 3.
Materials 16 05344 g008
Table 1. Compositions of high-temperature solutions used for Ba4−xSr3+x(BO3)4−yF2+3y (BSBF) crystal growth.
Composition
Crystal
Ba3Sr4(BO3)4F2
(mol%)
NaF
(mol%)
Eu3+
(wt%)
Tb3+
(wt%)
Ce3+
(wt%)
Tliq
(°C)
Plate Made of Grown Crystal
BSBF: Ce3+75250.4998Materials 16 05344 i001
BSBF: Tb3+75250.25992Materials 16 05344 i002
BSBF: Eu3+75253.5999Materials 16 05344 i003
BSBF: Eu3+, Tb3+, Ce3+75250.10.250.4998Materials 16 05344 i004
Table 2. Observed bands in the BSBF: Eu3+ and BSBF: Eu3+, Tb3+, Ce3+ crystals under 300 nm, 370 nm, and 395 nm excitations.
Band Maximum, nm
BSBF: Eu3+BSBF: Eu3+, Tb3+, Ce3+
Excitation Wavelength, nmExcitation Wavelength, nm
300370395300370395
5D47F6 Tb3+489
5D47F5 Tb3+545543
5D07F0 Eu3+574573 *574, 578574572572, 578
5D07F1 Eu3+586, 592, 603600588, 593, 597593, 600599586, 593, 600
5D07F2 Eu3+613, 625611, 626613, 624612, 624611, 625612, 618, 625
5D07F3 Eu3+655655655655
5D07F4 Eu3+693, 704694, 704693, 705694, 705691, 703693, 705
5D07F5 Eu3+750
*—the most intense band in the spectra is underlined and in bold.
Table 3. CIE chromaticity coordinates and correlated color temperature (CCT) for BSBF: Tb3+, BSBF: Eu3+, and BSBF: Eu3+, Tb3+, Ce3+ crystals.
λex, nmCIE CoordinatesCCT, K
77 K300 K77 K300 K
Ba3Sr4(BO3)4F2: Tb3 +
300(1)
(0.345; 0.530)
(2)
(0.344; 0.524)
52635278
Ba3Sr4(BO3)4F2: Eu3 +
300(3)
(0.617; 0.378)
(4)
(0.617; 0.378)
18361831
370(5)
(0.570; 0.406)
(6)
(0.585; 0.410)
17561732
395(7)
(0.634; 0.359)
(8)
(0.633; 0.359)
21852176
Ba3Sr4(BO3)4F2: Eu3+, Tb3+, Ce3+
300(9)
(0.484; 0.349)
(10)
(0.538; 0.373)
18221851
370(11)
(0.399; 0.439)
(12)
(0.481; 0.452)
39462728
395(13)
(0.513; 0.327)
(14)
(0.477;0.291)
66654849
Disclaimer/Publisher’s Note: The statements, opinions and data contained in all publications are solely those of the individual author(s) and contributor(s) and not of MDPI and/or the editor(s). MDPI and/or the editor(s) disclaim responsibility for any injury to people or property resulting from any ideas, methods, instructions or products referred to in the content.