Abstract
In this study, the silica fume replacement rate, fly ash replacement rate, and curing temperature were regarded as the independent variables, and the compressive and flexural strengths were regarded as the response values. The response surface method was used to construct the response surface polynomial regression model and obtain the optimal preparation parameters of a steel slag cement-based gel slurry (SCGS). The univariate and multivariate effects on the SCGS’s strength were investigated via analysis of variance and a three-dimensional surface model, and the hydration products and strength development law were characterized via scanning electron microscopy and X-ray diffraction. The actual compressive strengths at 3 and 28 d of age were 31.78 and 53.94 MPa, respectively, which were close to the predicted values (32.59 and 55.81 MPa, respectively), demonstrating that the optimized strengths were accurate and reliable. Further, the hydration reaction rate of SiO2 in the silica fume and the physical filling effect of the inert components of fly ash and steel slag under the optimal parameters were the key factors for the early strength of the material. Moreover, continuous C3S hydration in steel slag and the continuous excitation of the volcanic ash properties of fly ash were important factors for the later strength.
1. Introduction
For many years, China has been among the major steel-producing countries in the world [1]. Steel slag is the main industrial waste in the steelmaking process; in 2020 alone, the output reached 161 million tons, but the utilization rate was only 30%. The low utilization rate of steel slag causes its accumulation, which is detrimental to environmental protection [2,3]; hence, research on the comprehensive utilization of steel slag is necessary. In large-scale infrastructure, Portland cement is the main building material, and its production requires large amounts of coal and limestone; moreover, its emissions include harmful gases, such as CO2 and SO2 [4]. Many scholars have proposed steel slag as a mineral admixture in the production of cement concrete by replacing part of the cement [5,6]; this can not only solve many environmental problems caused by the massive accumulation of local steel slag but can also contribute to the achievement of carbon neutralization goal [7,8]. However, when steel slag is used as a mineral admixture, the active minerals, namely, dicalcium silicate (C2S) and tricalcium silicate (C3S), are not fully hydrated and a high content of free calcium oxide (f-CaO) leads to the poor volume stability of concrete, resulting in the poor working performance and limited durability of a steel slag cement system [9]. Therefore, making full use of steel slag requires stimulating its activity and solving the problem of stability.
At present, the mechanical activation method and active fine admixture compound method have been widely used to stimulate the activity of steel slag. In particular, mechanical grinding increases the specific surface area of steel slag and hydrates it fully. Furthermore, the Ca(OH)2 produced during the f-CaO hydration in steel slag is consumed by active SiO2 and Al2O3 in a fine admixture, thereby hindering the concrete expansion caused by f-CaO [10]. The synergistic effect of fine admixture facilitates the production of high-performance concrete, the effective utilization of industrial waste, the development of strengths, and the elimination of weaknesses [11,12]. Several scholars have studied the mix proportion design of composite cementitious materials prepared by replacing part of the cement with fine mineral admixtures [13,14,15], the microstructure [16], the hydration mechanism [17], the working performance [18], etc. Zhang et al. [19] attained strong mechanical properties of concrete by compounding steel slag powder and fly ash in a 2:1 ratio; moreover, the carbonation resistance and chloride ion penetration resistance are significantly improved [20]. Wang et al. [21] mixed steel slag and furnace slag in a 3:7 ratio to replace 50% of cement to prepare concrete, demonstrating that the strength and hydration heat can be significantly improved. The addition of a fine active mineral admixture can subject the cement to secondary hydration, reduce Ca(OH)2, promote the gel formation of calcium silicate hydrate (C–S–H) and calcium aluminate hydrate (C–A–H), enhance the compactness of the transition zone of the reinforced interface, and improve the mechanical properties and durability of materials [22,23]. Du et al. [24] adopted a steel-slag-to-cement ratio of 3:7 and added 4% silica fume and 1% desulfurized gypsum; they observed increased contents of C–S–H and ettringite (AFt) in cementitious materials and the 28 d strength of the slurry was increased by 32.4%. Miah et al. [25] claimed that the alkaline environment provided by the hydration of highly alkaline steel slag can promote the release of glass in fly ash and the cementitious activity of C2S and C3S in steel slag powder. Zhao et al. [26] used X-ray diffraction (XRD) and gas chromatography analysis to study the effect of the specific surface area of steel slag on the activity of cementitious materials. The results showed that the fine grinding of steel slag obviously increased the hydration activity of materials; moreover, for a specific surface area of 450 m2/kg, the strength was significantly enhanced. With the help of the Krstulovic–Dabic kinetic model, Wu et al. [27] found that as the steel slag content increases, both the hydration heat release rate of the steel slag cementitious system and the compactness of the slurry structure decrease. Hu et al. [28] found that the steel slag–silica fume complex can yield high-impermeability concrete under the condition of a high water-to-binder ratio. At present, in the field of building materials developed from bulk industrial waste, the control variable method is often used in the preparation of steel slag cement-based gel slurry (SCGS) to study the influence of a single factor on the mechanical properties of materials; however, this method cannot reflect the influence of the interaction between various factors. There are two problems associated with the optimal preparation parameters: the lack of comprehensiveness of test conclusions and the low model accuracy.
To remedy the abovementioned shortcomings, we introduced the response surface method [29,30,31] into the whole process of SCGS preparation and research and systematically designed the experimental protocol. Subsequently, we analyzed the results and explored the influence of the interaction of various factors on the strength of SCGS. Afterward, we established the response surface regression model and optimized the parameters to achieve the optimal strength. Further, we characterized the material microstructure using scanning electron microscopy (SEM) and XRD and identified the strength formation mechanism from a microscopic perspective. Thus, the findings of this study could provide theoretical support for the application of industrial waste to SCGS.
2. Materials and Methods
2.1. Raw Materials
The cement used in the test was an ordinary Portland cement of strength class 42.5 from Horse Racing, which complies with the Chinese national standard (GB 175-2007). The steel slag (SS) was converter steel slag provided by a steel plant in Shizuishan City, Ningxia Province, China; the moisture content was 0.27% after half a year, the average particle size reached 35.18 μm after drying and grinding in a YXQM-20L planetary mill for 50 min, and the Burt’s specific surface area was 439.2 m2/kg. The silica fume (SF) was provided by Ningxia Ketong New Material Co., Ltd. (Shizuishan, China); the particle size was less than 1 μm for more than 81%, the average particle size was 0.1–0.4 μm, the Burt’s specific surface area was 28 m2/g, and the 28 d activity index was 103. The fly ash (FA) was provided by Ningxia Ketong New Material Co., Ltd.; the average particle size was 6 μm, the density was 2.9 g/cm3, and the fineness modulus of fine aggregate was 2.9 complying with the Chinese national standard (GSB08—1337). The water-reducing agent was a high-efficiency polycarboxylic acid (PA) powder and the water used was the tap water of the laboratory. The chemical composition of raw materials was analyzed via X-ray fluorescence spectrometry and the results are listed in Table 1.

Table 1.
Main chemical compositions of the raw materials (%).
The XRD pattern and SEM diagram of steel slag are shown in Figure 1. As shown in Figure 1a, the main mineral phases of steel slag were found to be C2S, C3S, C4AF, and RO (solid solution composed of divalent metal oxides). As shown in Figure 1b, the steel slag particles exhibited irregular polyhedra with sharp angles and a denser but slightly uneven texture on the surface. The morphologies of C2S, C3S, and RO phases were round granular leaf-like, hexagonal plate-like, and irregular, respectively; these mineral phases were about 0.5~1.7 μm long and 0.2~0.9 μm wide. Based on the evaluation formula of slag alkalinity M proposed by Mason [32], the slag alkalinity was calculated to be 2.59, which indicated a highly alkaline slag. The calculation formula is as follows:
where ω represents the mass fraction.
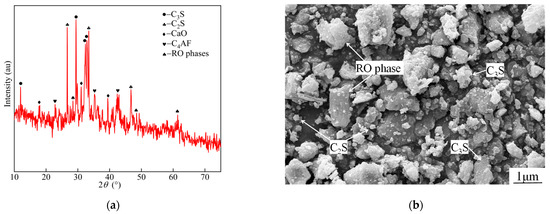
Figure 1.
Steel slag physical properties analysis: (a) XRD and (b) SEM.
2.2. Box–Behnken Experimental Design
The compressive and flexural strengths of the SCGS at 3 and 28 d of age were used as the response values with the silica fume substitution rate, fly ash substitution rate, and curing temperature as the influencing factors to reveal the effect law of the single factors and interactions of independent variables on the strength of the SCGS. The Box–Behnken experimental design was applied in Design-Expert software, where three factors and three levels were selected. The codes and levels of each factor are listed in Table 2. The second-order polynomial model expressions that were used to predict the optimal preparation parameters of the SCGS were as follows:
where Yi is the predicted response of compressive strength and flexural strength at each age; b0 is a constant; Xi and Xj are the coded values of the independent process variables; k is the number of independent variables, i.e., k = 3; bi is the linear coefficient; bii is the quadratic coefficient; bij is the interaction coefficient; and ε is the random error of the prediction.
Table 2.
Factor codes and levels.
2.3. Test Methods
2.3.1. Macroscopic Test Method
According to [33] and the test results of the preliminary trial, the steel slag dose was 15%, the water-to-cement ratio was 0.4, and the water-reducing agent dose was 0.14% of the amount of cementitious material. The cementitious materials were weighed according to the Box–Behnken test design. They were first mixed dry in a JJ-5 planetary type cementitious sand mixer for 120 s. Afterward, the water-reducing agent was dissolved in the required water and poured into the mixer for 120 s. Finally, the standard sand was poured into the mixer and mixed for 180 s. The cementitious materials were poured into a 40 × 40 × 160 mm mold and vibrated to test the compressive strength and flexural strength. The test was carried out in a standard curing box at a temperature of 20 ± 2 ℃ and relative humidity of 95% or more for 24 h. After demolding, each mold was placed in a curing box at the specified curing temperature (20, 50, or 80 ℃) and relative humidity (95% or more) until 3 or 28 d of age.
The KZL-5000 cement electric flexural testing machine was used to perform flexural strength testing and the YAW-300D electronic pressure testing machine was used to perform compressive strength testing; the vertical loading speed for testing was 0.5 kN/s. Three parallel specimens were prepared for each mixing ratio.
2.3.2. Microscopic Test Method
According to the optimal mixing ratio determined by the optimized parameter plate in Design-Expert, the cementitious materials were weighed and the pure slurry of the SCGS optimized group was prepared with a water-to-cement ratio of 0.4. The pure slurry of the reference group was prepared with 15% steel slag, 85% cement, and a 0.4 water-to-cement ratio. The hydration mechanism was studied by pouring the cementitious materials into a 40 × 40 × 40 mm mold for vibration molding. The optimized group was cured at a temperature set according to the optimal preparation parameters and relative humidity greater than 95%, whereas the reference group was cured under standard conditions. Each sample was taken out after 3 or 28 d of hydration for compressive strength testing. After the compressive strength test, the central broken block was taken as the microscopic test sample and placed in anhydrous ethanol to terminate the hydration. The samples were dried in a vacuum drying oven at 60 ℃ to constant weight before the XRD and SEM tests. Subsequently, they were pressed into powder with an agate mortar and then subjected to XRD analysis, and another flat sample was selected for SEM analysis after gold plating. XRD analysis was performed using a D8 Advance X-ray diffractometer from Bruker, Germany, with Cu as the anode target and a scanning range of 10° to 73° at intervals of 0.02°. The SEM analysis was carried out using a Zeiss EVO 18 scanning electron microscope.
3. Results and Discussion
3.1. Experimental Results
The results based on the Box–Behnken experimental design and response values are listed in Table 3.
Table 3.
Box–Behnken experimental design and response values.
3.2. RSM Analysis of Variance (ANOVA) and Reliability Assessment
The results of the response values were analyzed by performing a regression analysis with the quadratic RSM using Design-Expert software to establish the regression models of compressive strength and flexural strength of the SCGS at 3 and 28 d of age with silica fume replacement rate, fly ash replacement rate, and curing temperature. The resulting multivariate quadratic response surface regression models are expressed as follows:
where Y1 and Y2 are the 3 and 28 d compressive strengths, respectively, and Y3 and Y4 are the 3 and 28 d flexural strengths, respectively.
Y1 = 36.857 − 0.93092X1 − 0.281617X2 − 0.101403X3 − 0.0783X1X2 + 0.0246X1X3 + 0.0074X2X3 + 0.10038X12 + 0.00516X22 − 0.001162X32,
Y2 = 30.605 + 3.08554X1 − 0.07645X2 + 0.366X3 + 0.0825X1X2 + 0.008042X1X3 + 0.00735X2X3 + 0.39275X12 − 0.00944X22 − 0.004098X32,
Y3 = 7.774 − 0.91063X1 + 0.15925X2 + 0.004361X3 + 0.04075X1X2 + 0.01175X1X3 + 0.0008X2X3 + 0.014687X12 − 0.01465X22 − 0.000649X32, and
Y4 = 6.531 − 0.28304X1 + 0.08495X2 + 0.04444X3 + 0.03925X1X2 + 0.00233X1X3 + 0.0042X2X3 + 0.004312X12 − 0.01751X22 − 0.00075X32,
ANOVA was performed on the established response surface regression models Y1 and Y2, with the results presented in Table 4.
Table 4.
Analysis of variance of response surface regression model.
The significances of the linear, quadratic, and interaction effects of the influencing factors in the response surface regression model equation were determined by both the F- and P-values of the model. The larger the F-value is and the smaller the P-value is, the more significant the influence effect is. When P < 0.05, the relationship between the response surface Yi and the regression model and the relationship between each effect term and the response surface Yi are significant, otherwise the opposite is true. The reliability of the regression model fit is assessed using the correlation coefficient R2, which represents the degree of difference between the measured and predicted values; the closer its value is to 1, the higher the reliability of the fit is.
As shown in Table 4, model Y1 had an F-value of 20.88 with a P-value of 0.0003, and model Y2 had an F-value of 26.26 with a P-value of 0.0001. The fact that the P-values were less than 0.05 indicated that the regression effects of models Y1 and Y2 were highly significant. The P-values corresponding to X1, X2, and X3 in model Y1 were 0.0073, 0.009, and less than 0.0001, respectively. The P-values corresponding to X1, X2, and X3 in model Y2 were 0.0002, 0.0001, and 0.0006, respectively. The fact that the P-values were less than 0.05 indicated that every single factor had a significant effect on the compressive strength of the SCGS at 3 and 28 d of age. Because P(X2) > P(X1) > P(X3) in model Y1, the single-factor significance was X3 > X1 > X2. Because P(X3) > P(X1) > P(X2) in model Y2, the single-factor significance was X2 > X1 > X3. The P-values of the interaction terms X1X2, X1X3, and X2X3 in model Y1 were 0.0130, 0.0004, and 0.0022, respectively, i.e., less than 0.05, indicating that the interaction of the three factors had a significant effect on the compressive strength of the SCGS at 3 d of age. The P-values of the interaction terms X1X2, X1X3, and X2X3 in model Y2 were 0.1074, 0.3161, and 0.0430, respectively. Except for P(X2X3), the P-values were all greater than 0.05; hence, except for the interaction of X2X3, the interaction of the factors had no significant effect on the compressive strength of the SCGS at 28 d of age.
The correlation coefficient R2 = 0.9642, modified correlation coefficient RAdj2 = 0.9179, and predicted correlation coefficient Rpred2 = 0.9102 for model Y1, as well as the correlation coefficient R2 = 0.9712, modified correlation coefficient RAdj2 = 0.9343, and predicted correlation coefficient Rpred2 = 0.9161 for model Y2, were all close to 1; this confirmed that models Y1 and Y2 had high accuracy and reliability regarding the prediction. The x–y scatter plots were drawn with the measured and predicted values of models Y1 and Y2 as the horizontal and vertical coordinates, respectively, as shown in Figure 2. As shown in Figure 2, the scatter points were uniformly distributed around the y = x line; thus, the measured and predicted values were in high agreement, indicating that the model was fitted with high accuracy and corroborated the results of the response surface regression model ANOVA.
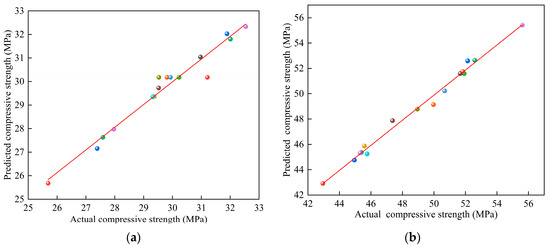
Figure 2.
The relationship between the experimental values and predicted values: (a) Y1 and (b) Y2.
3.3. Analysis of Response Surface Influencing Factors
3.3.1. Influence and Interaction of Compressive Strength of the SCGS at 3 d of Age
To intuitively study the effect of the interaction of silica fume replacement rate, fly ash replacement rate, and curing temperature on the strength, the three-dimensional (3D) surface plot of the the SCGS compressive strength at 3 d of age at the three-factor level was drawn according to the regression model. The results are shown in Figure 3.
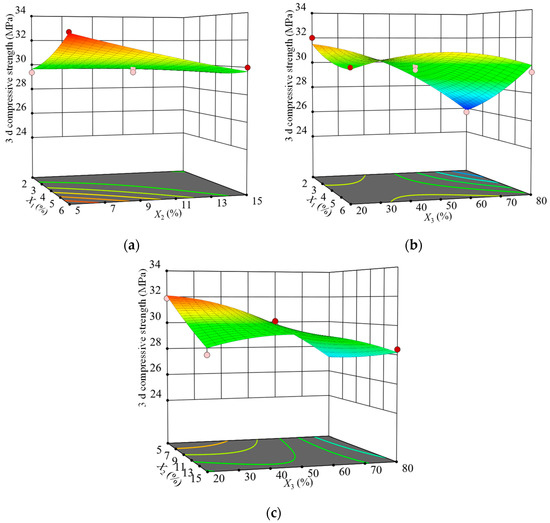
Figure 3.
Influences of the interactions of various factors on the 3 d compressive strength: (a) X1 and X2, (b) X1 and X3, and (c) X2 and X3.
Figure 3a depicts the effect of the interaction between the silica fume and fly ash on the SCGS’s strength at a fixed maintenance temperature of 50 ℃. The 3D surface plot was obviously twisted, indicating that the interaction between silica fume and fly ash had a significant effect on the early strength. When the fly ash substitution rate was low, the strength increased with the silica fume substitution rate and the curve increased significantly, indicating that the silica fume promoted the early strength. Further, the hydration of cement and steel slag in the matrix ensures an alkaline environment, and silica fume, which is rich in highly reactive SiO2, is constantly in contact with the solution at the early stage of hydration. Consequently, a Si-rich and Ca-poor gel adhesive layer is formed on the surface of the particles. As the hydration reaction proceeds, the layer gradually dissolves and reacts with the hydration product Ca(OH)2 crystals in a volcanic ash reaction to generate C–S–H gels. This limits the Ca(OH)2 inhibitory effect on growth and improves the interface between steel slag micronized fly ash and the C–S–H gel transition zone. Conversely, fly ash has a microaggregate effect and plays a physical filling role, together with silica fume and the unhydrated steel slag micropowder, which do not participate in the volcanic ash reaction to optimize the pore structure, leading to a large increase in the early strength.
According to Figure 3a, the strength decreased as the fly ash substitution rate increased, which indicated that the early volcanic ash activity of fly ash was low after replacing part of the cement and the hydration of steel slag micronized powder in the SCGS system itself was slow. Thus, the prehydration reaction had a limited ability to provide OH−, which made it difficult to cause the fly ash reticulation structure to break, the volcanic ash effect occurred slowly, and the consumption rate of Ca(OH)2 crystals was slow, resulting in a lower strength in the early stage. In addition, the microaggregate effect of fly ash fills between cement and steel slag powder, which, to some extent, hinders the contact of water molecules with cement and steel slag powder, and the slow hydration process of cementitious materials lead to the slow hardening of the slurry.
Figure 3b shows the effect of the interaction between silica fume and maintenance temperature on the SCGS’s strength at a fixed fly ash substitution rate of 15%. The twist degree of the 3D surface plot was more obvious, indicating that the interaction between silica fume and maintenance temperature had a highly significant effect on the early strength, which is consistent with the ANOVA results. At a higher silica fume substitution rate, as the curing temperature increased, the strength first increased, and then decreased, with its peak occurring around 50 ℃. The reason was that, when warming to a certain temperature, the average molecular chain length of the cement hydration product C–S–H gel grows significantly compared to that at 20 ℃. Moreover, warming accelerates the excitation of fly ash and silica fume volcanic ash activity, consumes Ca(OH)2 crystals, and provides space for the growth of C–S–H chains [34], which effectively fills the pores of the interfacial transition zone and increases the SCGS’s strength. In addition, warming accelerates the early hydration rate of cement, increases the production of hydration products, and increases the SCGS’s strength. However, the strength decreased when the temperature increased to 80 ℃. This may have been due to the fact that, at the late stage of hydration, the paste was solid, the hydration reaction slowed down, and the temperature was no longer a key factor for strength. At lower temperatures, the strength increase did not change much with the silica fume replacement rate. At higher temperatures, the SCGS’s strength increased linearly with the silica fume substitution rate.
Figure 3c shows the effect of the interaction between fly ash and maintenance temperature on the SCGS’s strength at a fixed silica fume replacement rate of 4%. Obviously, the 3D surface plot twisting trend was similar to that in Figure 3b, but the degree of twisting was slightly lower than that in Figure 3b, indicating that the interaction of the fly ash and maintenance temperature had a significant effect on the early strength, which was consistent with the ANOVA results. At lower temperatures, the strength decreased linearly as the fly ash replacement rate increased. However, fly ash mainly played the role of a microaggregate in the early stage and contributed less to the strength. Conversely, the cement replacement with fly ash reduced the number of gels generated by the hydration reaction, such as high-density C–S–H and C–A–H, and reduced the strength. At higher temperatures, the strength increased linearly with the fly ash substitution rate, but the increase was not significant.
3.3.2. Effect and Interaction of Compressive Strength of the SCGS at 28 d of Age
The 3D surface plots of the compressive strength of the SCGS at 28 d of age at the three-factor level were drawn according to the regression model. The results are shown in Figure 4.
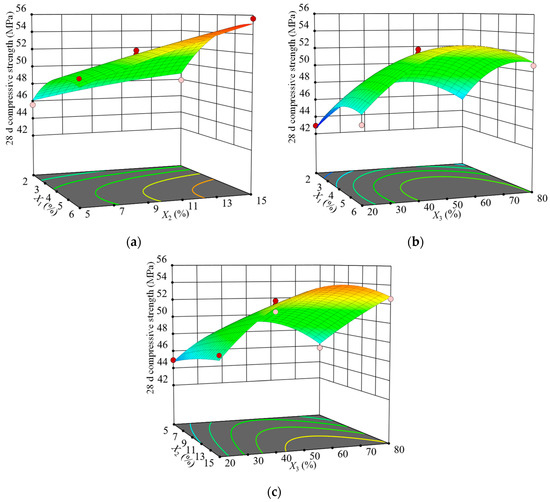
Figure 4.
Influences of the interactions of various factors on the 28 d compressive strength: (a) X1 and X2, (b) X1 and X3, and (c) X2 and X3.
Figure 4a shows the effect of the interaction between silica fume and fly ash on the SCGS’s strength at a fixed maintenance temperature of 50 °C. The 3D surface plot was not obviously twisted, indicating that the interaction between the silica fume and fly ash had no significant effect on the later strength, which was consistent with the ANOVA results. At lower fly ash replacement rates, as the silica fume replacement rate increased, the strength first increased and then leveled off, but its growth was small, indicating that the silica fume contribution to the later strength was weaker than the earlier one. At higher fly ash replacement rates, the superposition effect of silica fume and fly ash caused the strength to increase rapidly. The strength increased with the fly ash replacement rate, which indicated that the fly ash contributed to the later strength growth. The steel slag and cement hydration process and the high alkalinity of the liquid phase contribute to the depolymerization of [SiO4] and [AlO4] tetrahedra in the fly ash and the secondary hydration reaction with Ca(OH)2, which generates C–S–H and C–A–H gels to fill the pores between the primary hydration products of cement [34]; this makes the slurry denser and thus increases the strength.
Figure 4b shows the effect of the interaction between the silica fume and curing temperature on the SCGS’s strength at a fixed fly ash substitution rate of 15%. The surface plot had a downward opening and convex shape and included great values for optimal analysis. However, the interaction between the silica fume and curing temperature had no significant effect on the later strength, which was consistent with the ANOVA results. In the range of the silica fume substitution rate, as the curing temperature increased, the strength first increased and then decreased, with its peak occurring around 50 °C, and the reason for this was consistent with the abovementioned effect of temperature on strength. In the range of the curing temperature, as the silica fume substitution rate increased, the strength first increased and then decreased, with its peak occurring around a 4% rate. The reason was that, although the volcanic ash effect and filling effect of silica fume made the internal structure of the slurry denser and the strength increased, the amount of silica fume was too large for the later strength growth.
Figure 4c shows the effect of the interaction between fly ash and maintenance temperature on the SCGS’s strength at a fixed silica fume replacement rate of 4%. The 3D surface was significantly twisted, indicating that the interaction of the fly ash and curing temperature had a significant effect on the later strength, which was consistent with the ANOVA results. At higher temperatures, the strength increased significantly with the fly ash substitution rate because such temperatures excited the volcanic ash activity of fly ash, and more fly ash reacted with Ca(OH)2, thereby generating gels, such as C–S–H and AFt. Consequently, the highly crystalline Ca(OH)2 was consumed, making the pore structure denser and the strength higher. Regardless of the value of the fly ash substitution rate, as the temperature increased, the strength first increased and then decreased, with its peak occurring around 55 ℃.
3.4. Parameter Optimization and Validation
Based on the compressive strength optimization of the SCGS mortar at 3 and 28 d of age using Design-Expert, the strength optimization scheme of the SCGS mortar was obtained by combining the interaction analysis of various factors. To verify the results of the response surface optimization, three sets of parallel tests were conducted to determine the mechanical properties of the SCGS mortar at each age, where the test results are listed in Table 5.
Table 5.
Measured and predicted values of the SCGS’s strength.
As shown in Table 5, the error between the predicted and measured values of the compressive strengths at 3 and 28 d of age were 2.51% and 3.35%, respectively. The errors were all less than 5%, showing that the optimal preparation parameters obtained using the response surface method were of high precision in terms of both practice and theory, further verifying the rationality of the regression model and supporting the promotion of the SCGS mortar’s strength value and reference significance.
4. Microscopic Mechanism of Action Analysis
4.1. XRD Analysis
The pure paste specimens of the SCGS optimized group at each age were selected for XRD tests. The content changes of hydration products were qualitatively analyzed according to age for both groups and were compared with the pure paste specimens of the reference group at each age. The results are shown in Figure 5.
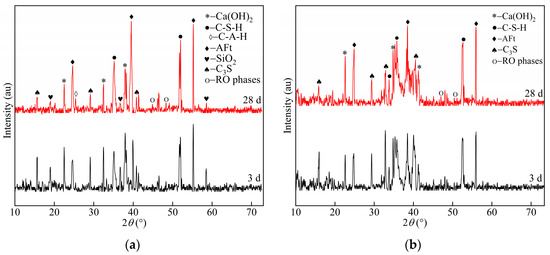
Figure 5.
XRD patterns at 3 and 28 d of age according to the (a) optimized group samples and (b) reference group samples.
Figure 5a shows the XRD patterns of the optimized specimens at 3 and 28 d of age. The hydration products were dominated by calcium alumina (AFt), calcium silicate hydrate (C–S–H), calcium hydroxide (CH), silica (SiO2), RO phase, unhydrated dicalcium silicate (C2S), and other mineral phases. RO phases, as inert minerals in the steel slag, played a filling role in the system and did not participate in the hydration process; hence, their diffraction peaks remained stable with age.
At 3 d of age, the specimens of the optimized group showed obvious peak packets at diffraction angles within the range 33°–38°, and the diffraction peak widths of the AFt and C–S–H phases were wider; in addition, the peak values and widths of the AFt and C–S–H diffraction peaks increased with the curing time, indicating that the production of AFt and C–S–H in the hardened slurry was increasing. At a diffraction angle near 18°, i.e., the SiO2 characteristic peak, which mainly originated from the silica fume and fly ash, the diffraction peaks of C3S and Ca(OH)2 in 3 d were higher, but the peaks and widths of C3S and Ca(OH)2 gradually became weaker with the progress of the hydration reaction. The above results indicated that C3S in cement and steel slag had high hydration and continuously generated Ca(OH)2. However, the XRD pattern reflected the fact that the peak of Ca(OH)2 decreased. This occurred because the secondary hydration of SiO2 accelerated the Ca2+ absorption, and Ca(OH)2 consumption was greater than its generation; the more rapid the reaction was, the more the paste’s early strength increased. In addition, the hydration of C3S in steel slag generated Ca(OH)2, which was absorbed by fly ash as the hydration process proceeded because of its relatively low crystallinity; thus, the diffraction peak corresponding to Ca(OH)2 was weak in the XRD pattern.
The weak C–A–H diffraction peaks of the optimized specimens at 28 d of age indicated that, under a high temperature and alkaline environment, the fly ash structure gradually dissociated and a certain number of Si and Al atoms dissolved and reacted with Ca2+ in the solution to form C–S–H and C–A–H gels, respectively. However, the intensity of the C–A–H diffraction peak was weak because the liquid phase of SO42− and C–A–H’s structural instability gradually increased the amount of AFt. As the age increased, the hydration products C–S–H and AFt of the hardened slurry continued to increase, which ensured the increasing strength of the slurry.
Figure 5b shows the hydration products of the specimens in the reference group. The XRD patterns show the diffraction peaks of AFt, Ca(OH)2, and C–S–H gels at 3 and 28 d of hydration in the reference group, where the peaks and widths of the diffraction peaks of AFt, Ca(OH)2, and C–S–H gels increased gradually with the curing age. The C3S diffraction broad peak, which mainly originated from cement and steel slag, appeared near 32° and weakened in the late hydration period. The diffraction peak of Ca(OH)2 at 28 d of age was obviously stronger than that of the optimized group because the late hydration of C2S and C3S mineral activity in steel slag did not consume Ca(OH)2 but hydrated to produce Ca(OH)2 and C–S–H gels. Furthermore, the cement Ca(OH)2 was continuously produced in the late stage of hydration, which gradually strengthened the diffraction peaks. The precipitation of large Ca(OH)2 crystals in the interfacial transition zone of the steel slag cement system caused the matrix strength degradation owing to the large porosity.
4.2. SEM Analysis
To further investigate the SCGS’s strength development law, the microscopic morphology inside the hardened slurry was observed via SEM. Figure 6 shows the SEM results of the optimized group, and Figure 7 shows the SEM results of the reference group.
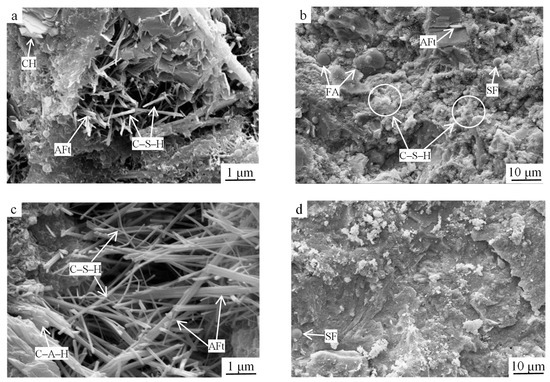
Figure 6.
SEM images of the optimized group samples at (a,b) 3 d of age and (c,d) 28 d of age. SF: silica fume, FA: fly ash.
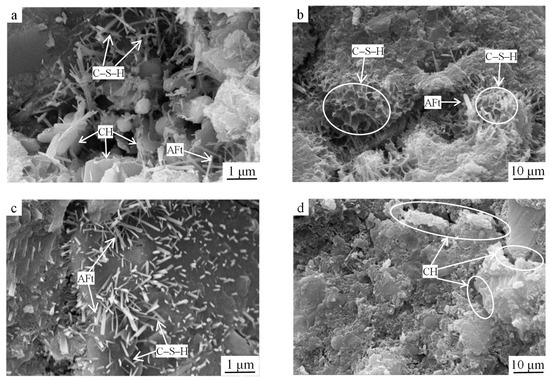
Figure 7.
SEM images of the reference group samples at (a,b) 3 d of age and (c,d) 28 d of age.
At 3 d of age, the observed hydration products were flocculent fibrous C–S–H gels, rodlike AFt crystals, hexagonal platelike Ca(OH)2, unhydrated cement particles, and steel slag micronized powder. The rodlike AFt crystals were interspersed with fibrous C–S–H and interwoven to fill the pores between the unhydrated cement and steel slag particles, and the mesh structure of the hardened slurry was formed (Figure 6a). The spherical fly ash particles with smooth surfaces did not participate in the hydration process at the early stage but played the role of aggregate filling; they were wrapped by the deposited hydration products one by one and were tightly bonded to the surrounding slurry (Figure 6b). Thus, the early strength of the slurry reached 31.78 MPa compared to the 27.63 MPa of the reference group, which was an increase of 15.02%.
At 28 d of age, with the continuous development of the gel system, the number of Ca(OH)2 crystals decreased, and the hydration products were dominated by C–S–H gels and rodlike Aft, which both grew significantly in size and had a higher degree of crystallization (Figure 6c). On the one hand, this was because the Si–O and Al–O bonds in the fly ash structure were mainly in the form of a 3D network linked by [SiO4] and [AlO4] tetrahedra, and the hydration of cement and steel slag increased the pH of the liquid phase, prompting the rapid depolymerization of the low-strength O–Si–O and Si–O–Al chemical bonds [15]. At that time, the solution contained a large amount of Ca2+, OH−, SO42−, H3SiO4−, and H3AlO42− ions, providing a material basis for the formation of AFt. On the other hand, the fly ash gradually increased its participation in the hydration reaction, and secondary hydration occurred, producing Ca(OH)2 to generate C–S–H and C–A–H gels. As the hydration process proceeded, SO42− reacted with C–A–H gel under the action of Ca2+ to form AFt crystals. Under certain temperature and highly alkaline conditions, the steel slag surface was severely eroded and wrapped by flocculent C–S–H gel and the hydration of steel slag gradually increased; thus, C–S–H gel and Ca(OH)2 were generated, and the concentrations of Ca and Si increased, leading to thicker AFt crystals, C–S–H gelling, and further AFt generation, which formed a tight mesh structure. Subsequently, silica fume particles that were not involved in the pozzolanic reaction filled the slurry and bonded with the hydration products into a whole, forming a dense microstructure (Figure 6d). As a result, the 28 d strength of the slurry reached 53.94 MPa compared to the 44.85 MPa of the reference group, which was an increase of 11.96%.
As shown in Figure 7a, at 3 d of age, the contents of C–S–H gel and AFt of the reference group specimens were significantly reduced compared to those in Figure 6a. One reason for this was that the system was subjected to only one hydration cycle, generating relatively few hydration products. Another reason was that the earlier cement hydration generated limited Ca(OH)2, and the insufficient alkalinity in the liquid phase resulted in the low hydration rate of steel slag. Steel slag on the RO phase particles’ surfaces attached some of the gel and smaller steel slag particles, affecting the strength of the particles and surrounding hydration products’ association; meanwhile, more internal macropores and connected pores were created since the hydration-generated C–S–H gelation was mainly honeycomb-structured, which was loose (Figure 7b) and thus not conducive to the growth of the early strength of the specimen, and hence the reference group strength was low. With the extension of the hydration time, the hydration products generated in the system at 28 d increased significantly, perhaps because the alkaline environment generated by the hydration of the cement excited the steel slag activity and started the hydration reaction and the contents of the C–S–H gel and AFt in the system increased; however, compared to the optimized group at the same age, the contents of the C–S–H gel and rodlike AFt were low and loosely distributed (Figure 7c). It is noteworthy that the lamellar Ca(OH)2 crystals in the reference group were enriched in the interfacial transition zone and had large crystalline grains (Figure 7d) and their loose interlayer stacking connections weakened the bond strength in the interfacial transition zone, which was the weak link of the hardened slurry; thus, the strength of the reference group was lower than that of the optimized group.
5. Conclusions
The effects of silica fume substitution rate, fly ash substitution rate, and curing temperature on the compressive strength of the SCGS at 3 and 28 d of age were investigated via the RSM. The hydration products and microscopic morphology of the pure slurry were analyzed based on the optimal preparation parameters obtained using Design-Expert, and the following conclusions were drawn.
(1) The regression models for the compressive strength of the SCGS at 3 and 28 d of age were established via response surface regression analysis. From the ANOVA and 3D surface plots, it was found that the interaction between the three factors had a significant effect on the compressive strength of the SCGS at 3 d of age and the interaction of fly ash and maintenance temperature had a significant effect on the compressive strength of the SCGS at 28 d of age.
(2) The sensitivity ranking of the single factor response to the compressive strength of the SCGS at 3 d of age was curing temperature > silica fume > fly ash; the effect of curing temperature and silica fume on the early strength of the SCGS was significant within a certain range, whereas the contribution of fly ash was limited. The sensitivity ranking of the single factor response to the compressive strength of the SCGS at 28 d of age was fly ash > silica fume > curing temperature; the effect of fly ash on the later strength of the slurry was significant.
(3) The optimal preparation parameters for the compressive strength of the SCGS at 3 d of age were obtained from the prediction model established via response surface analysis. These were as follows: 5.8% silica fume substitution rate, 5.2% fly ash substitution rate, and 43.3 ℃ curing temperature. The optimal preparation parameters for the compressive strength of the SCGS at 28 d of age were as follows: 4.2% silica fume substitution rate, 15% fly ash substitution rate, and 59.2 ℃ curing temperature. The actual compressive strengths at 3 and 28 d of age were 31.78 and 53.94 MPa, respectively, which were close to the predicted values (32.59 and 55.81 MPa, respectively), demonstrating that the RSM-optimized SCGS strengths were accurate and reliable.
(4) The hydration reaction rate of SiO2 in the silica fume and the physical filling effect of the inert components of the fly ash and steel slag under the optimal parameters were the key factors for the early strength of the material. The continuous hydration of C3S in the steel slag and the continuous excitation of the volcanic ash properties of the fly ash were important factors for the later strength. The hydration of active SiO2 and Al2O3 in the fly ash consumed Ca(OH)2, which, in turn, was significantly reduced in content and crystal size; this generated a thick fibrous S–C–H gel and rod-like Aft, which formed a dense network structure, improving the early strength of the cementitious system. The precipitation of large Ca(OH)2 crystalline particles in the interfacial transition zone of the steel slag cement system gradually deteriorated the matrix strength because of the large porosity between the layers.
Author Contributions
Conceptualization, X.Z. and H.L.; methodology, H.L.; software, S.L.; validation, X.Z., H.L. and Y.D.; formal analysis, H.Z.; investigation, S.H. and Y.T.; resources, H.L.; data curation, X.Z.; writing—original draft preparation, X.Z.; writing—review and editing, H.L.; visualization, H.Z.; supervision, H.L.; project administration, S.H.; funding acquisition, H.L. All authors have read and agreed to the published version of the manuscript.
Funding
We gratefully acknowledge the National Natural Science Foundation of China (52069025), Natural Science Foundation of Ningxia (2021AAC03080, 2020AAC03004), Key Research and Development Program of Ningxia (2021BDE92002), and First-Level Discipline (hydraulic engineering discipline) of Ningxia Universities (NXYLXK2021A03).
Data Availability Statement
The data supporting the findings of this study are available from the corresponding author upon reasonable request.
Conflicts of Interest
The authors declare no conflict of interest. The funders had no role in the design of the study; in the collection, analyses, or interpretation of data; in the writing of the manuscript; or in the decision to publish the results.
References
- Zhao, L.J.; Zhang, F. Comprehensive Utilization and Development Prospect of Steel Slag Resources. Mater. Rep. 2020, 34, 1319–1322+1333. [Google Scholar]
- Guo, W.; Xi, B.D.; Huang, C.H.; Li, J.X.; Tang, Z.R.; Li, W.; Ma, C.Y.; Wu, W.X. Solid waste management in China: Policy and driving factors in 2004–2019. Resour. Conserv. Recycl. 2021, 173, 105727. [Google Scholar] [CrossRef]
- Wu, Y.D.; Peng, B.; Wu, L.; Lv, W.; Zhang, G.H. Review on Global Development of Treatment and Utilizatiom of Steel Slag. Environ. Eng. 2021, 39, 161–165. [Google Scholar] [CrossRef]
- Emad, B.; Ezzatollah, S.; Muhammad, I.R. Challenges Against CO2 Abatement Strategies in Cement Industry: A Review. J. Environ. Sci. 2020, 104, 84–101. [Google Scholar]
- Wang, Q.; Yan, P.Y. Early Hydration Characteristics and Paste Structure of Complex Binding Material Containing High-Volume Steel Slag. J. Chin. Ceram. Soc. 2008, 10, 1406–1410+1416. [Google Scholar]
- Song, Q.F.; Guo, M.Z.; Wang, L.; Ling, T.C. Use of Steel Slag as Sustainable Construction Materials: A Review of Accelerated Carbonation Treatment. Resour. Conserv. Recycl. 2021, 173, 105740. [Google Scholar] [CrossRef]
- Li, Z.; Zhang, D.J.; Pan, L.Y.; Li, T.X.; Gao, J.W. Low-Carbon Transition of China’s Energy Sector and Suggestions with the Carbon-Peak and Carbon-Neutrality’Target. J. Chin. Soc. Power Eng. 2021, 41, 905–909+971. [Google Scholar] [CrossRef]
- Das, P.; Upadhyay, S.; Dubey, S.; Singh, K.K. Waste to wealth: Recovery of Value-Added Products from Steel Slag. J. Environ. Chem. Eng. 2021, 9, 105640. [Google Scholar] [CrossRef]
- Gencel, O.; Karadag, O.; Oren, O.H.; Bilir, T. Steel Slag and its Applications in Cement and Concrete Technology: A Review. Constr. Build. Mater. 2021, 283, 122783. [Google Scholar] [CrossRef]
- Wu, S.P.; Cui, P.D.; Xie, J.; Liu, Q.T.; Pang, L. Expansive Inhibition Method of Steel Slag Aggregate and Volume Stability of Mixture: A Review. China J. Highw. Transp. 2021, 34, 166–179. [Google Scholar] [CrossRef]
- Zhang, L.L.; Lu, Z.F. Comparative Analysis of Evaluation Methods for Steel Slag Soundness. Environ. Eng. 2022, 40, 235–239. [Google Scholar]
- Li, Y.; Zhang, Y.; Li, Z. Research on the Mechanical Properties of Composite Admixture Concrete. IOP Conf. Ser. Earth Environ. Sci. 2021, 768, 012104. [Google Scholar] [CrossRef]
- Martins, A.C.P.; Franco, D.C.J.M.; Costa, L.C.B.; Andrade, H.D.; Melo, T.V.; Ribeiro, J.C.L.; Pedroti, L.G.; Peixoto, R.A.F. Steel Slags in Cement-Based Composites: An Ultimate Review on Characterization, Applications and Performance. Constr. Build. Mater. 2021, 291, 123265. [Google Scholar] [CrossRef]
- Cui, X.W.; Ni, W.; Ren, C. Hydration Mechanism of All Solid Waste Cementitious Materials Based on Steel Slag and Blast Furnace Slag. Chin. J. Mater. Res. 2017, 31, 687–694. [Google Scholar]
- Li, Y.; Wu, B.H.; Ni, W.; Mou, X.L. Synergies in Early Hydration Reaction of Slag-Steel Slag-Gypsum System. J. Northeast. Univ. (Nat. Sci.) 2020, 41, 581–586. [Google Scholar]
- Lang, L.; Song, C.Y.; Xue, L.; Chen, B. Effectiveness of Waste Steel Slag Powder on the Strength Development and Associated Micro-Mechanisms of Cement-Stabilized Dredged Sludge. Constr. Build. Mater. 2020, 240, 117975. [Google Scholar] [CrossRef]
- Xu, C.W.; Ni, W.; Li, K.Q.; Zhang, S.Q.; Li, Y.; Xu, D. Hydration Mechanism and Orthogonal Optimisation of Mix Proportion for Steel Slag–Slag-Based Clinker-Free Prefabricated Concrete. Constr. Build. Mater. 2019, 228, 117036. [Google Scholar] [CrossRef]
- Li, R.G.; Zhou, S.Y.; Tian, K.; Yao, P. The Application of the Steel Slag in the Radiation Shield Heavy Concrete. Mater. Sci. Forum 2013, 744, 258–268. [Google Scholar] [CrossRef]
- Zhang, Z.Z.; He, J.C.; Bai, J.F.; Zhang, J.; Jing, Q. Study on the Mechanical Properties of Mixed Cementitious System of Steel slag. J. Water Resour. Water Eng. 2018, 29, 178–185. [Google Scholar]
- Papachristoforou, M.; Anastasiou, E.K.; Papayianni, I. Durability of Steel Fiber Reinforced Concrete with Coarse Steel Slag Aggregates Including Performance at Elevated Temperatures. Constr. Build. Mater. 2020, 262, 120569. [Google Scholar] [CrossRef]
- Wang, Q.; Yan, P.Y.; Mi, G. Effect of Blended Steel Slag–GBFS Mineral Admixture on Hydration and Strength of Cement. Constr. Build. Mater. 2012, 35, 8–14. [Google Scholar] [CrossRef]
- Babalola, O.E.; Awoyera, P.O.; Le, D.H.; Bendezú, R.L.M. A Review of Residual Strength Properties of Normal and High Strength Concrete Exposed to Elevated Temperatures: Impact of Materials Modification on Behaviour of Concrete Composite. Constr. Build. Mater. 2021, 296, 123448. [Google Scholar] [CrossRef]
- Li, K.; Wei, Z.Q.; Qiao, H.X.; Lu, C.G.; Guo, J. Research Progress of the Influence of Four Kinds of Admixtures on the Properties of Polymer Cement-based Materials. Mater. Rep. 2021, 35, 654–661. [Google Scholar]
- Du, J.; Liu, J.X. Compound Effect of Dihydrate Gypsum and Silica Fume on Strength of Steel Slag-Cement Binding Materials. J. Civ. Environ. Eng. 2013, 35, 131–136. [Google Scholar]
- Jihad, M.M.; Kawsar, A.M.; Lo, M.F.; Chandra, P.S.; John, B.A.; Šavija, B. The effect of Furnace Steel Slag Powder on the Performance of Cementitious Mortar at Ambient Temperature and After Exposure to Elevated Temperatures. Structures 2021, 33, 2811–2823. [Google Scholar] [CrossRef]
- Zhao, S.R.; Zhang, K.F.; Jiao, G.F.; Yao, Y.; Wang, N. Activity of Steel Slag Composite Gelled Material and its Influence on Concrete Performance. Mater. Rep. 2015, 29, 463–467. [Google Scholar]
- Wu, W.J.; Liu, J.X.; Qi, L.Q.; Jia, R.Q. Hydration Heat of Steel Slag Cement Composite Materials and Dynamics Research. J. Beijing Univ. Chem. Technol. (Nat. Sci. Ed.) 2016, 43, 40–45. [Google Scholar] [CrossRef]
- Hu, J.; Wang, Q.; Yang, J.W. Influence of Steel Slag-silica Fume Complex Binder on the Properties of Concrete. J. Tsinghua Univ. (Sci. Technol.) 2015, 55, 145–149. [Google Scholar] [CrossRef]
- Bandari, F.; Safa, F.; Shariati, S. Application of Response Surface Method for Optimization of Adsorptive Removal of Eriochrome Black T Using Magnetic Multi-Wall Carbon Nanotube Nanocomposite. Arab. J. Sci. Eng. 2015, 40, 3363–3372. [Google Scholar] [CrossRef]
- Claver, P.; Sara, R.; António, V.F.; Ana, F.J.; Nuno, C. Application of the Response Surface Method to Optimize Alkali Activated Cements Based on Low-Reactivity Ladle Furnace Slag. Constr. Build. Mater. 2020, 264, 120271. [Google Scholar] [CrossRef]
- Maryam, S.; Mohammadali, R.; Sayyed, M.A.; Sayyed, M.H. Optimization of Carpet Waste Fibers and Steel Slag Particles to Reinforce Expansive Soil Using Surface Methodology. Appl. Clay Sci. 2016, 142, 185–192. [Google Scholar] [CrossRef]
- Guan, J.F.; Zhang, Y.L.; Yao, X.H.; Li, L.L.; Zhang, L.; Yi, J.H. Experimental Study on the Effect of Compound Activator on the Mechanical Properties of Steel Slag Cement Mortar. Crystals 2021, 11, 658. [Google Scholar] [CrossRef]
- Zhang, G.Z.; Ge, J.C.; Zhang, C.X.; Yang, J.; Liu, K.W.; Wang, A.G.; Sun, D.S. Review on the Microstructure Formation Mechanism in Concrete Material Under Different Curing Regimes. Mater. Rep. 2021, 35, 15125–15133. [Google Scholar]
- Lu, Z.; Feng, Z.G.; Yao, D.D.; Ji, H.R.; Qin, W.J. Analysis of Influencing Factors on Workability and Strength of Ultra-high Performance Concrete. Mater. Rep. 2020, 34, 203–208. [Google Scholar]
Publisher’s Note: MDPI stays neutral with regard to jurisdictional claims in published maps and institutional affiliations. |
© 2022 by the authors. Licensee MDPI, Basel, Switzerland. This article is an open access article distributed under the terms and conditions of the Creative Commons Attribution (CC BY) license (https://creativecommons.org/licenses/by/4.0/).