Article

SnS2 Nanosheets as a Template for 2D SnO2 Sensitive Material: Nanostructure and Surface Composition Effects

1
Chemistry Department, Moscow State University, 119991 Moscow, Russia
2
Faculty of Materials Science, Moscow State University, 119991 Moscow, Russia
3
School of Microelectronics, Key Lab of Liaoning for Integrated Circuits Technology, Dalian University of Technology, Dalian 116024, China
*
Author to whom correspondence should be addressed.
Materials 2022, 15(22), 8213; https://doi.org/10.3390/ma15228213
Submission received: 7 November 2022 / Revised: 15 November 2022 / Accepted: 17 November 2022 / Published: 18 November 2022
(This article belongs to the Special Issue Nanomaterials and Sensors for Analysis and Detection)

Abstract

:
Two-dimensional nanosheets of semiconductor metal oxides are considered as promising for use in gas sensors, because of the combination of a large surface-area, high thermal stability and high sensitivity, due to the chemisorption mechanism of gas detection. In this work, 2D SnO2 nanosheets were synthesized via the oxidation of template SnS2 nanosheets obtained by surfactant-assisted one-pot solution synthesis. The 2D SnO2 was characterized using transmission and scanning electron microscopy (TEM, SEM), X-ray diffraction (XRD), low-temperature nitrogen adsorption, X-ray photoelectron spectroscopy (XPS) and IR spectroscopy. The sensor characteristics were studied when detecting model gases CO and NH3 in dry (RH25 = 0%) and humid (RH25 = 30%) air. The combination of high specific-surface-area and increased surface acidity caused by the presence of residual sulfate anions provides a high 2D SnO2 sensor’s signal towards NH3 at a low temperature of 200 °C in dry air, but at the same time causes an inversion of the sensor response when detecting NH3 in a humid atmosphere. To reveal the processes responsible for sensor-response inversion, the interaction of 2D SnO2 with ammonia was investigated using diffuse reflectance infrared Fourier transform spectroscopy (DRIFTS) in dry and humid air at temperatures corresponding to the maximum “positive” and maximum “negative” sensor response.

1. Introduction

Two-dimensional (2D) semiconductor nanomaterials have attracted a great deal of research interest due to their unique dimension-dependent electronic properties. Two-dimensional semiconductors may find a variety of applications, such as high-mobility transistors [1] and sensitive photodetectors [2], as well as gas sensors [3,4]. The family of 2D materials significantly increased in 2010–2020, and now includes materials that are diverse in nature: phosphorene, an analog of graphene consisting of atomically thin layers of phosphorus [5,6]; a group of materials with the common name MXenes, including 2D carbides, nitrides and carbonitrides [7,8]; boron nitride [9]; molybdenum, tungsten and rhenium dichalcogenides [10,11]; layered semiconductor chalcogenides GaS, GaSe, SnS2 [12,13,14] and layered oxides (MoO3) [15]. It should be noted that for practical application in the field of gas sensors, 2D materials such as graphene and its derivatives or MoS2, MoSe2, WS2, WSe2 have a number of significant limitations [16,17,18]. The main disadvantage of 2D materials is their low stability and fully saturated surface. Temperature rise and thermal cycling in air, to clean the surface of layered chalcogenides, phosphorene, and carbides (MXenes) leads to surface oxidation, degradation of adsorption properties and increased resistance. A common disadvantage of 2D materials is their reasonably low sensitivity due to the primary contribution of physical adsorption instead of chemisorption into the sensor signal.
The 2D nanosheets of semiconductor metal oxides may be considered as promising for use in gas sensors, since the combination of a large surface-area, high thermal stability and high sensitivity, due to the chemisorption mechanism of gas detection, is expected. However, the semiconductor oxides ZnO, SnO2, In2O3, WO3, most commonly used as gas-sensitive materials, do not have a layered structure, which makes it difficult to synthesize them in the form of 2D nanosheets by traditional methods such as the exfoliation route. For example, various methods of hydrothermal synthesis have been proposed to obtain SnO2 [19,20,21,22,23,24,25,26], but they allow the acquirement only of hierarchical 3D structures (of the nanoflowers type) formed by 2D nanosheets. An interesting example is the synthesis of 2D indium oxide, InO, in the spatial confinement between SiC and graphene using the MOCVD method [27]. It was found that the predicted atomic arrangement of intercalated In atoms is consistent with the In–In distances predicted for the stable 2D InO structure [28]. The authors of [28] also reported on the structural and electronic properties of In2O3 2D structures with planar hexagonal geometry.
An alternative approach may be template synthesis, in which 2D nanosheets of layered sulfide are oxidized to form an oxide while preserving the morphology of the particles. The recent works in this direction are the articles by V. Paolucci et al. [29,30], presenting SnSe2 2D nanosheets as a template for obtaining amorphous SnO2 layers.
Tin disulfide SnS2, a widely known layered material, is an indirect semiconductor with an energy gap of approximately 2.07 eV [31]. It has attracted interest in photovoltaic [32], photocatalytic [33,34] and sensor [35] applications and also as a material for Li-ion batteries [36,37]. Recently, SnS2 nanoparticles with a morphology of nanoflowers [33,34] or nanosheets [36,37] were synthesized using surfactant-assisted hydrothermal routes. Growth of SnS2 nanoplatelets in nonpolar solutions using the solvotermal method starting from SnCl4·5H2O [32] or by the thermal decomposition of Sn(S2CNEt2)4 single-molecular precursor [38] with the use of oleylamine as the surfactant, was reported.
Here, we report a simple method of producing 2D SnO2 nanosheets via the oxidation of template SnS2 nanosheets obtained by surfactant-assisted one-pot solution synthesis. The 2D SnO2 was characterized in detail, in terms of microstructure parameters and surface composition, and also tested as a gas-sensitive material when detecting CO and NH3.

2. Materials and Methods

All chemicals were purchased from Sigma Aldrich in the purest form available and used for the syntheses without further purification.
Colloidal SnS2 nanosheets were synthesized under argon atmosphere, following the protocol outlined here. Tin (IV) acetate Sn(CH3COO)4 (0.023 mmol) and oleic acid (0.09 mmol) were added to 1-octadecene (2 mL) followed by heating at 200 °C for approximately 1 h under argon flow to remove the acetic acid and form the tin oleate complex. The solution was then cooled to room temperature, and dodecylamine (0.09 mmol) and elemental sulfur (0.045 mmol) were added. The mixture was heated again to 220 °C under vigorous stirring and held at this temperature for approximately 5 min. As the desired temperature was reached, the initial colorless solution changed to yellow and then to turbid orange. The resultant solution was cooled, mixed with an equal volume of acetone, and centrifuged at 6000 rpm for 10 min. The supernatant was discarded, and the sediment nanosheets were redispersed in toluene. The SnS2 nanosheets were additionally precipitated using an equal volume of acetone, separated by centrifugation, and redispersed in the toluene. The resultant orange dispersion was slightly turbid and was stable to aggregation for several days.
The conditions of complete SnS2 to SnO2 oxidative transformation were determined by thermogravimetric analysis with mass spectral analysis of gaseous products (TG-MS), using a NETZSCH STA 409 PC/PG instrument (heating in air, 5K/min) (Figure 1). The oxidation of organic stabilizers (oleic acid and dodecylamine) occurs in the temperature range of 250–600 °C, as evidenced by a symbiotic increase in ionic currents, corresponding to the mass numbers m/z = 18 (H2O), 44 (CO2) and 30 (NO). The oxidation of sulfide anions, which is accompanied by the release of SO2 (m/z = 64) occurs in a narrower temperature range of 250–550 °C. To obtain 2D SnO2, the SnS2 sol was dried in air at room temperature until the solvent was removed. The SnS2 powder was annealed at 500 °C for 6 h. The annealing temperature of 500 °C was chosen to obtain 2D SnO2 with high specific-surface- area.
The size and morphology of the SnS2 nanoparticles were determined by transmission electron microscopy (TEM), with the LEO19 AB OMEGA microscope operated at 100 kV and the JEOL JEM2100 microscope operated at 200 kV. The morphology of the SnS2 and 2D SnO2 powders was studied with scanning electron microscopy (SEM), using a Carl Zeiss SUPRA 40 FE-SEM instrument with Inlens SE detector (accelerating voltage 5 kV, aperture 30 μm). The specific surface area of 2D SnO2 was measured by the low-temperature nitrogen adsorption, using a Chemisorb 2750 instrument (Micromeritics).
The phase composition was analyzed using X-ray diffraction (XRD) and Raman spectroscopy. A Panalytical Aeris Research diffractometer (CuKα radiation, Bragg–Brentano geometry, PiXCel detector, with a total angular range of 3.000–60.000° 2θ, a step size of ca. 0.005° and variable exposure time) was used for X-ray-powder-diffraction measurements. For this investigation, concentrated solutions of the purified nanocrystals were spread on top of a silicon wafer. The SnO2 crystallite size was estimated using the Scherrer formula. Raman spectra of SnS2 were acquired on a Renishaw InVia Raman microscope equipped with a 514 nm argon laser. Raman spectra of 2D SnO2 were collected on the i-Raman Plus spectrometer (BW Tek) equipped with a BAC 151C microscope and a 532 nm laser.
The surface composition was analyzed using X-ray photoelectron spectroscopy (XPS) and Fourier transform infrared (FTIR) spectroscopy. XP spectra were obtained on Omicron ESCA+ (monochromatic AlKα anode, E = 1486.6 eV) using a neutralizer (scanning step 0.1 eV/s, transmission energy 20 eV). The spectra were processed using the UNIFIT software. The peaks were approximated by convolution of the Gauss and Lorentz functions, with the simultaneous optimization of the background parameters. The FTIR spectra were registered in transmission mode using a Frontier (Perkin Elmer) spectrometer in the 4000–400 cm−1 region, with a step of 1 cm−1. For these experiments, 0.3–0.5 mg of the powder was ground with 40 mg KBr (FT-IR grade, Sigma-Aldrich, St. Louis, MO, USA) and pressed into tablets (~0.5 mm thick, 12 mm in diameter). The baseline was preliminarily taken from pure KBr.
Diffuse reflectance infrared fourier-transformed (DRIFT) spectra were recorded on a Frontier (Perkin Elmer) spectrometer using a DiffusIR annex and heated-flow chamber HC900 (Pike Technologies, Fitchburg, WI, USA) sealed by a ZnSe window. DRIFT spectra were registered in the 4000–1000 cm−1 region with resolution 4 cm−1 and with accumulation of 30 scans with automatic H2O/CO2 compensation. The 2D SnO2 powder (30 mg) was placed in alumina crucibles (5 mm diameter). The measurements were performed under 100 mL/min flow of dry (relative humidity at 25 °C RH25 = 0%) or humid (RH25 = 30%) air, containing 100 ppm NH3 at 200 °C and at 350 °C.
To manufacture the 2D SnO2 sensors, concentrated SnS2 sol in toluene was deposited dropwise on the alumina substrates with Pt contacts and Pt heaters (Figure 2). To form a sensitive film, the deposition of SnS2 was repeated three times. After each deposition, the layer was dried in air at room temperature until the solvent evaporated, and then slowly heated to 500 °C, using a substrate heater. To oxidize SnS2 into 2D SnO2, the formed films were additionally annealed in air at 500 °C for 6 h. The selected annealing temperature of 500 °C allows for complete oxidation of the SnS2, and provides the necessary thermal stability of 2D SnO2 during sensor measurements in the temperature range of 50–500 °C. Certified gas mixtures containing 2530 ppm CO in N2 and 240 ppm NH3 in N2 were used as gas sources. The concentration of the target gas in the air was set and controlled using EL-FLOW mass-flow controllers (Bronkhorst). The flow rate through the measuring cell in all measurements was constant 100 ± 0.5 mL/min. The humidity of the gas mixture (relative humidity at 25 °C RH25 = 0% for dry conditions and RH25 = 30% for humid conditions) was set and controlled by a P-2 Humidifier (Cellkraft). The sensor resistance was measured at 1.3 V DC-voltage at a temperature fixed in the range of 50–500 °C, with the step of 50 °C. For each temperature, three cycles of measurements (15 min in pure air, 15 min in the presence of air containing the target gas), were performed. The sensor response was calculated as S = (Ggas − Gair)/Gair, where Gair is the sensor conductance in air, and Ggas is the sensor conductance in the CO- or NH3-containing gas mixture.

3. Results

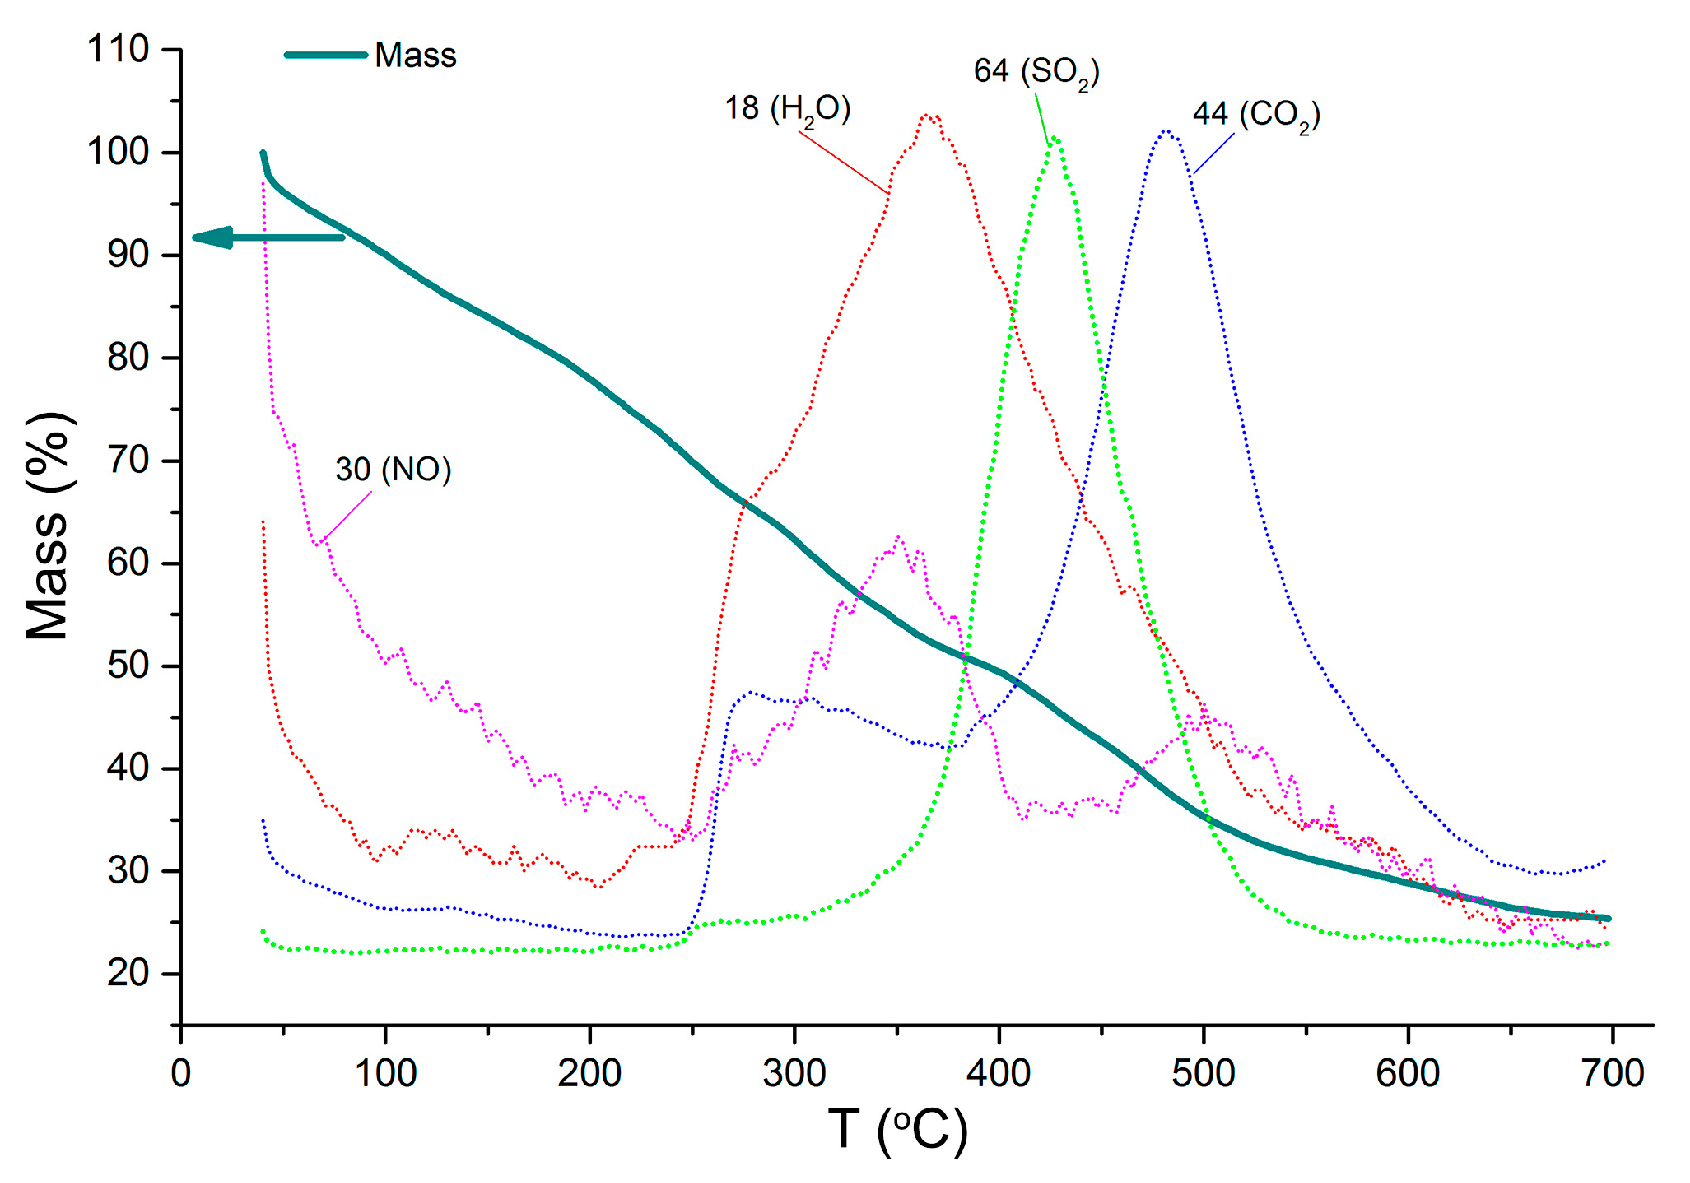
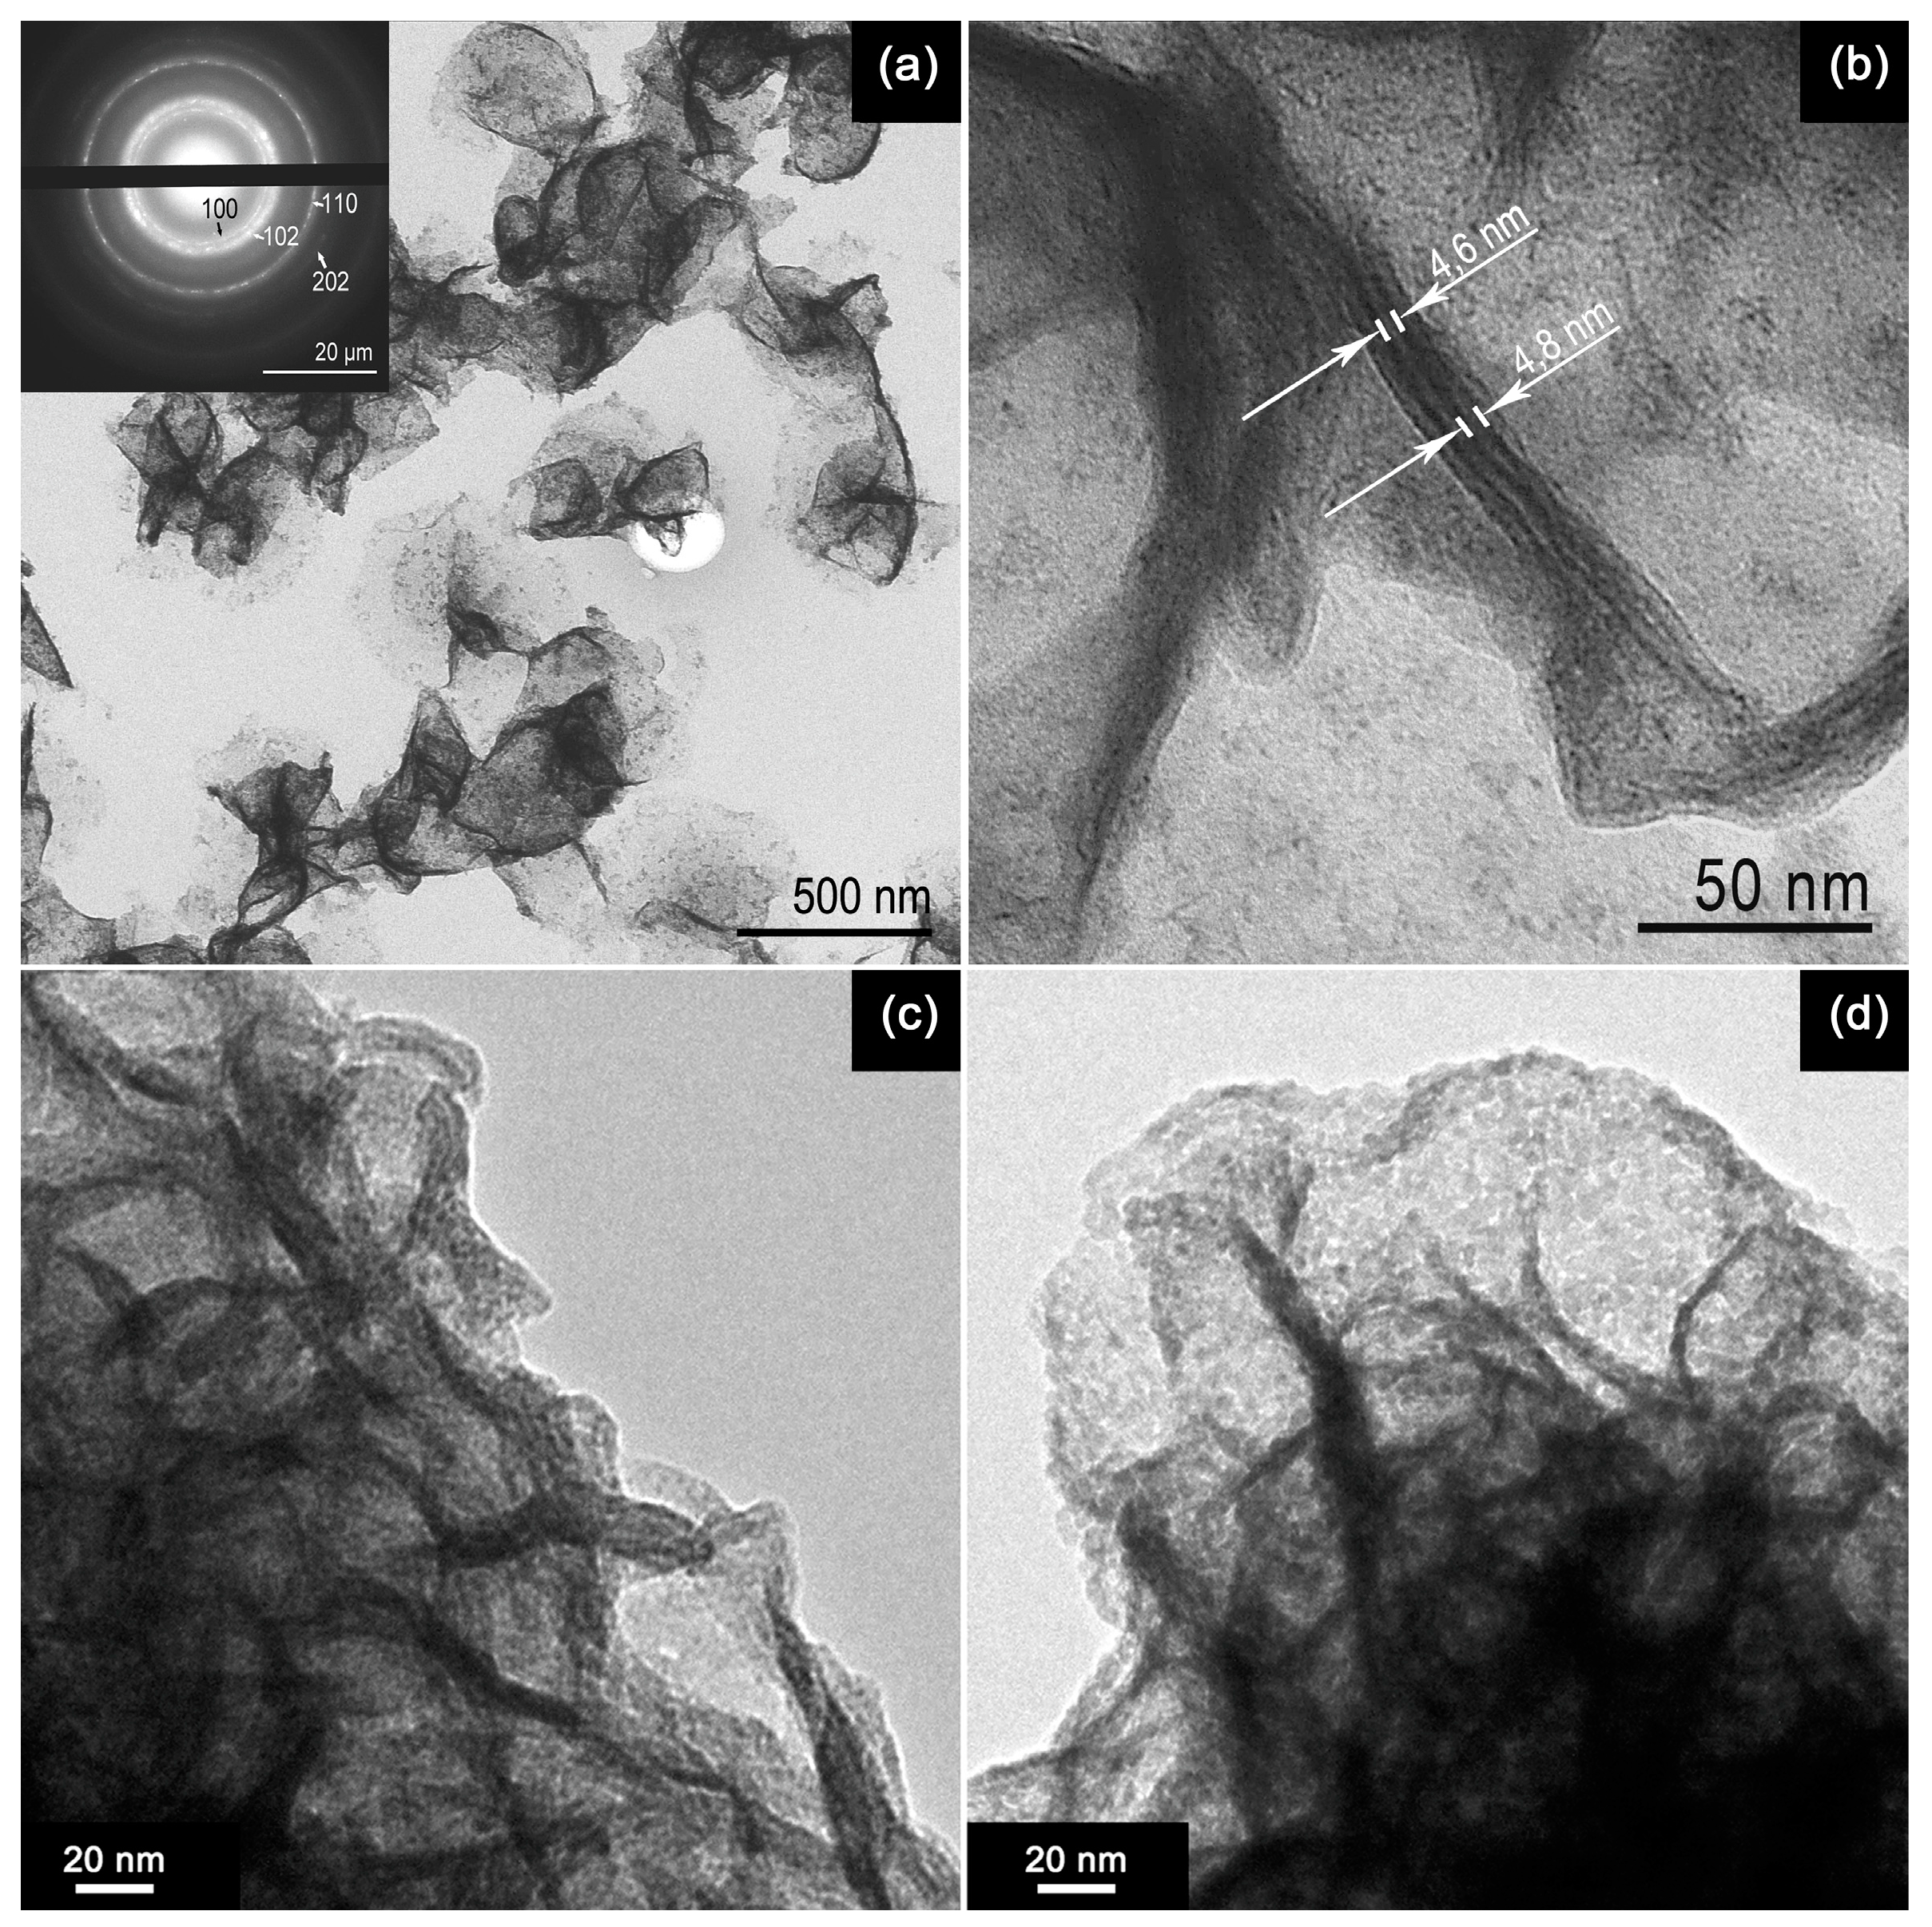
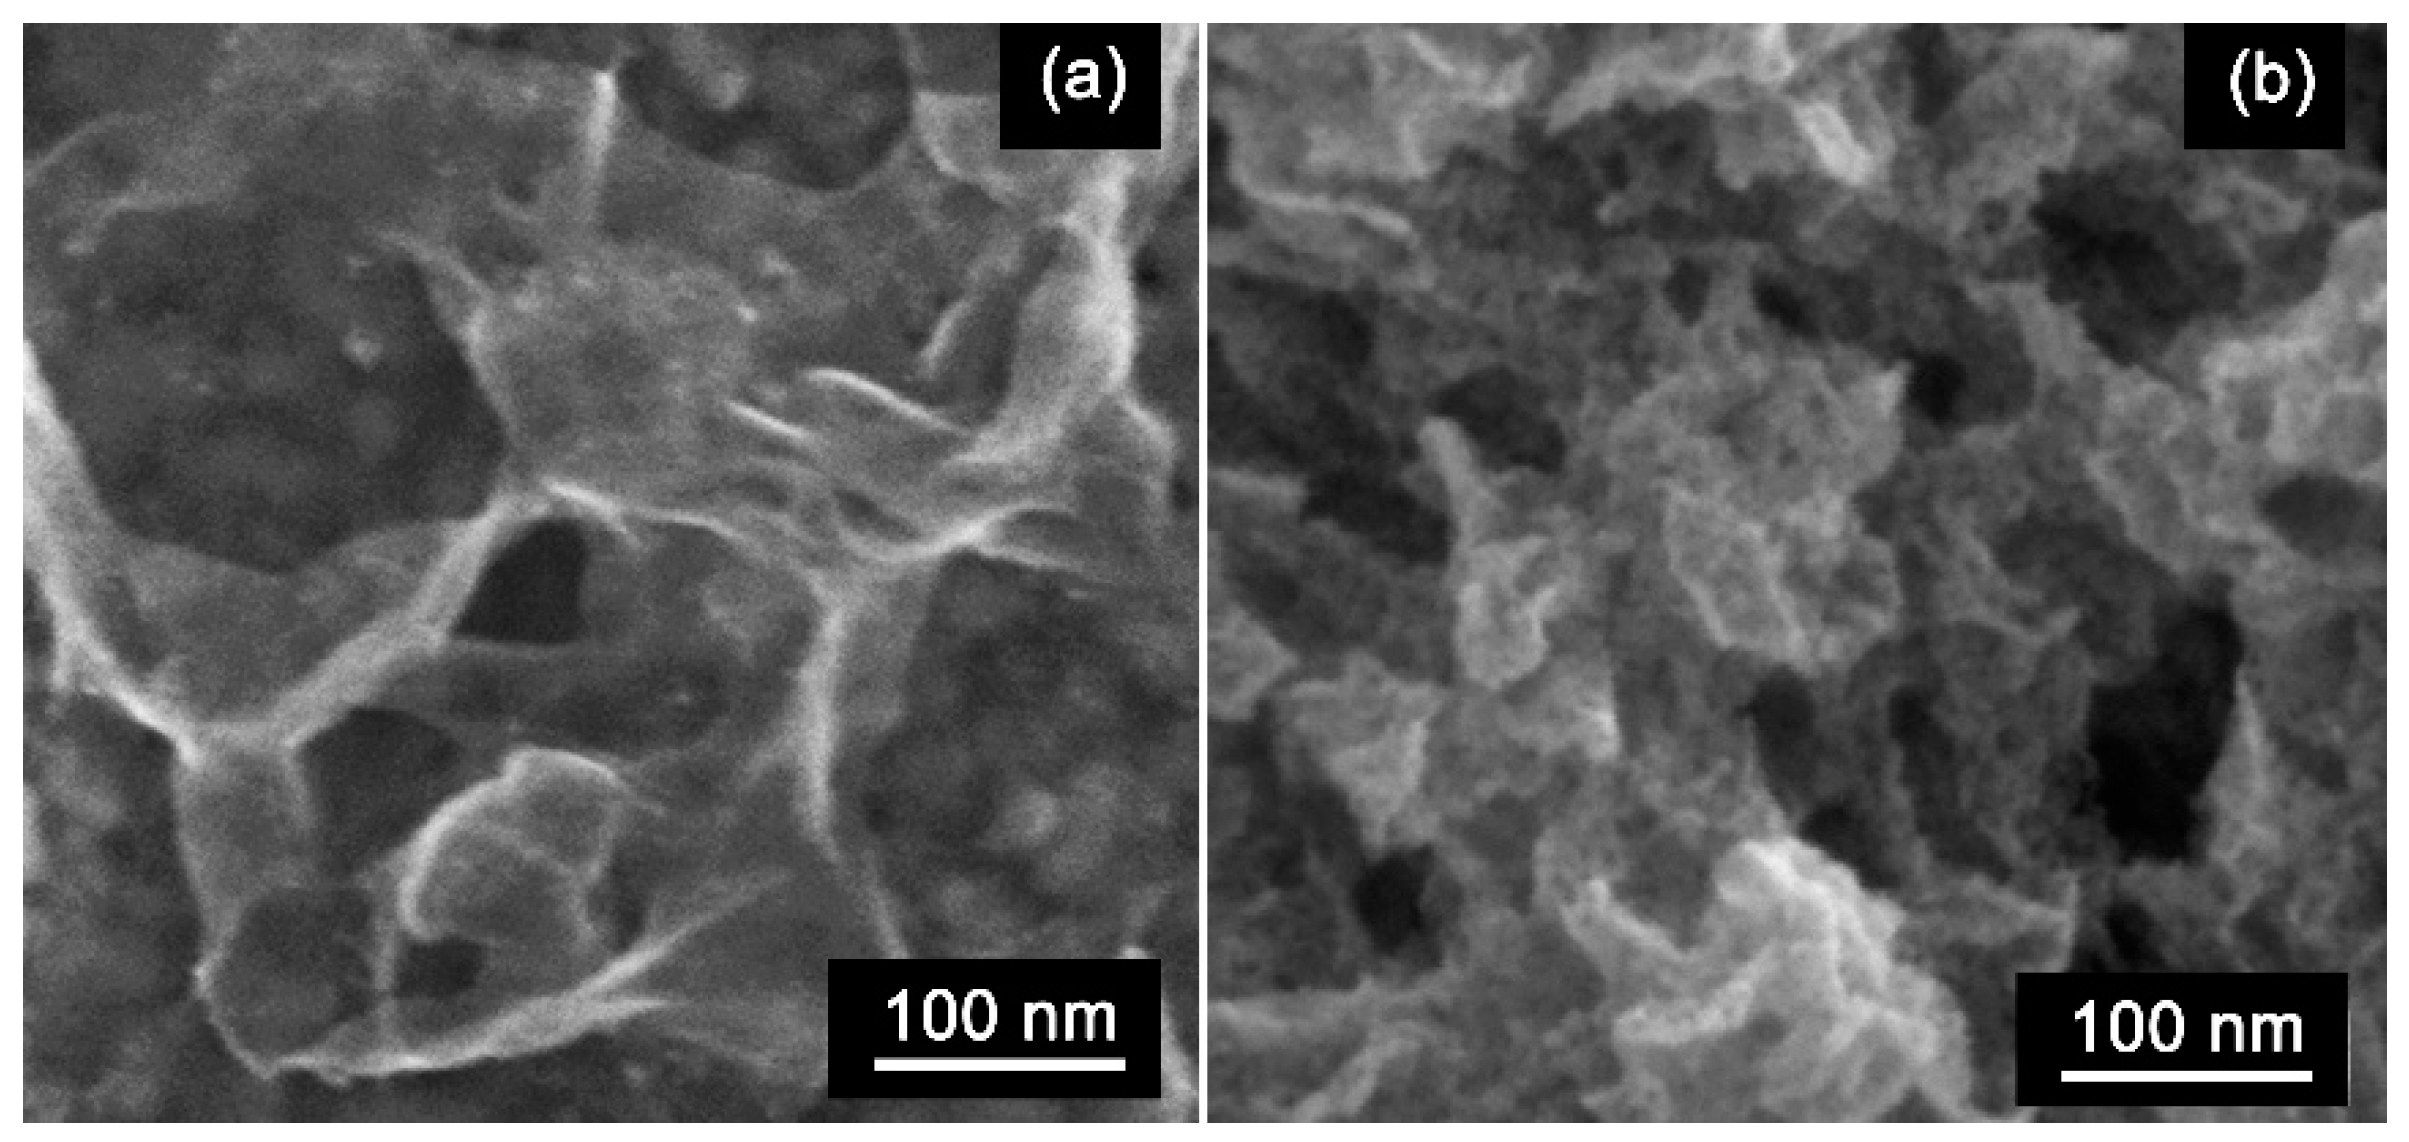
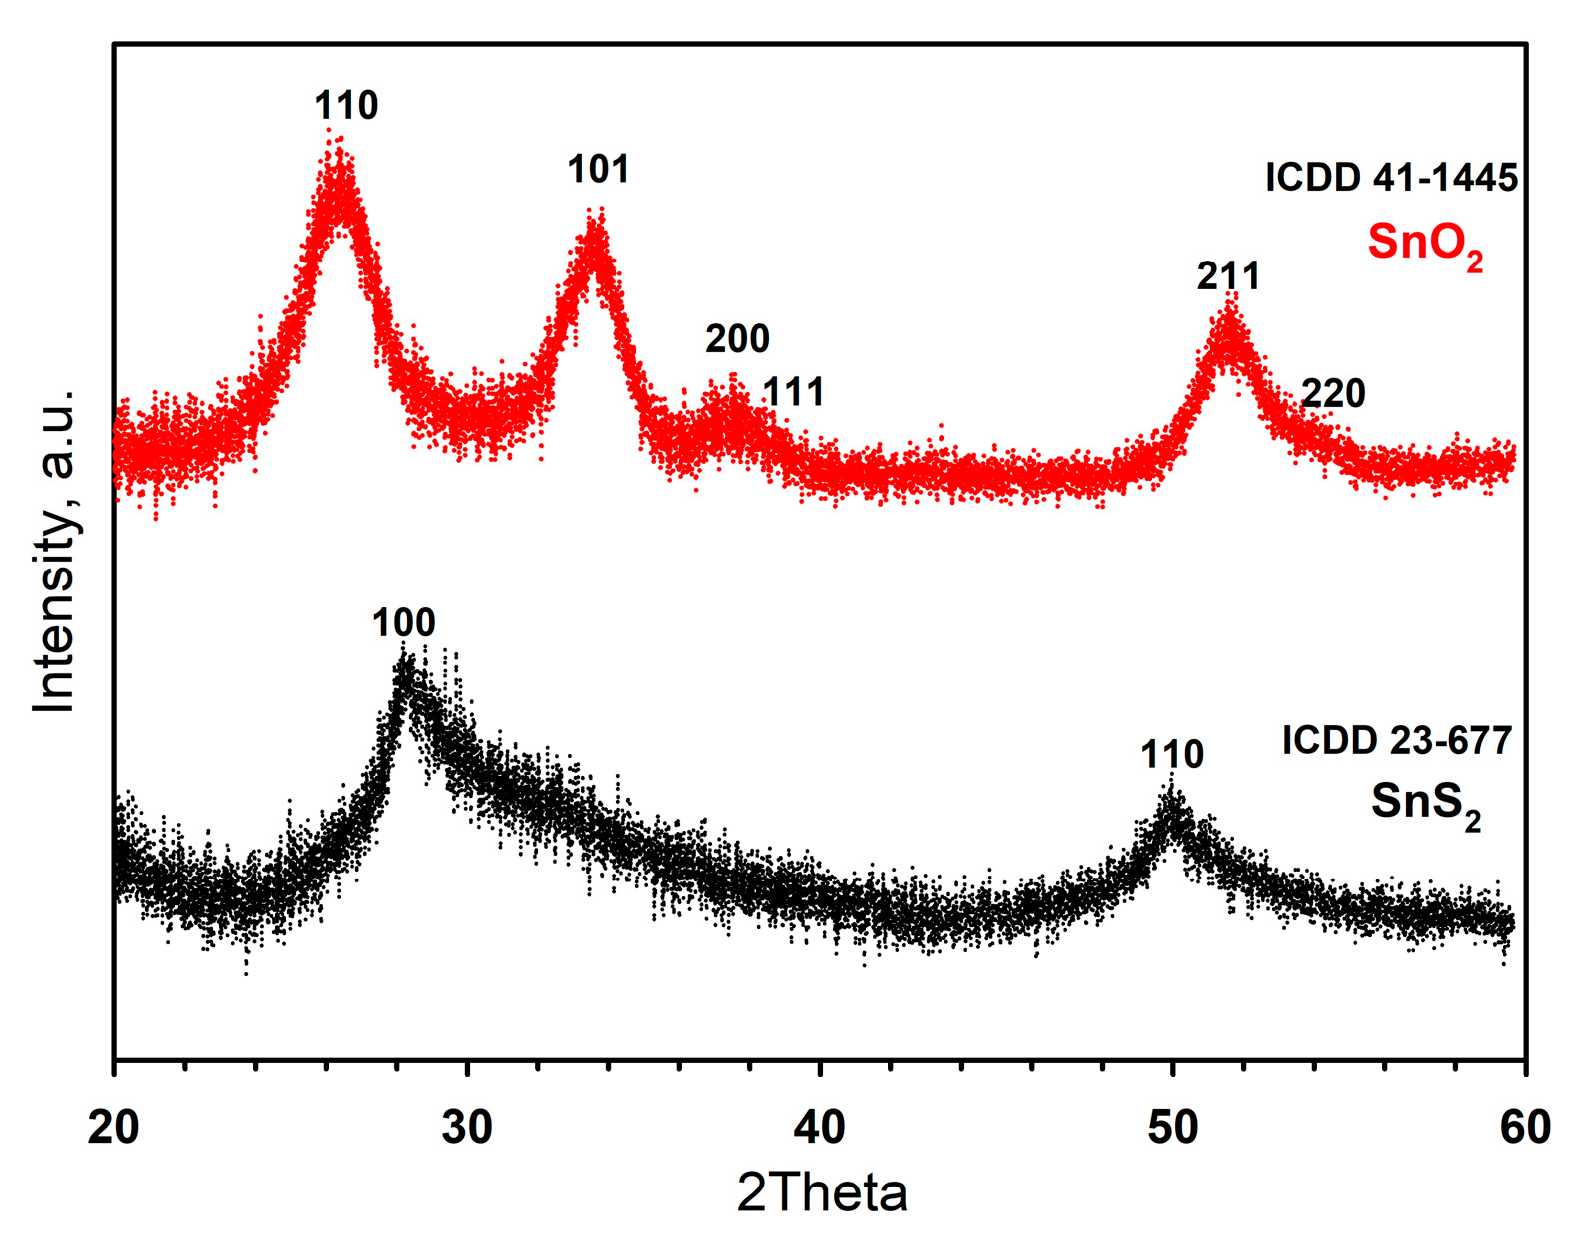
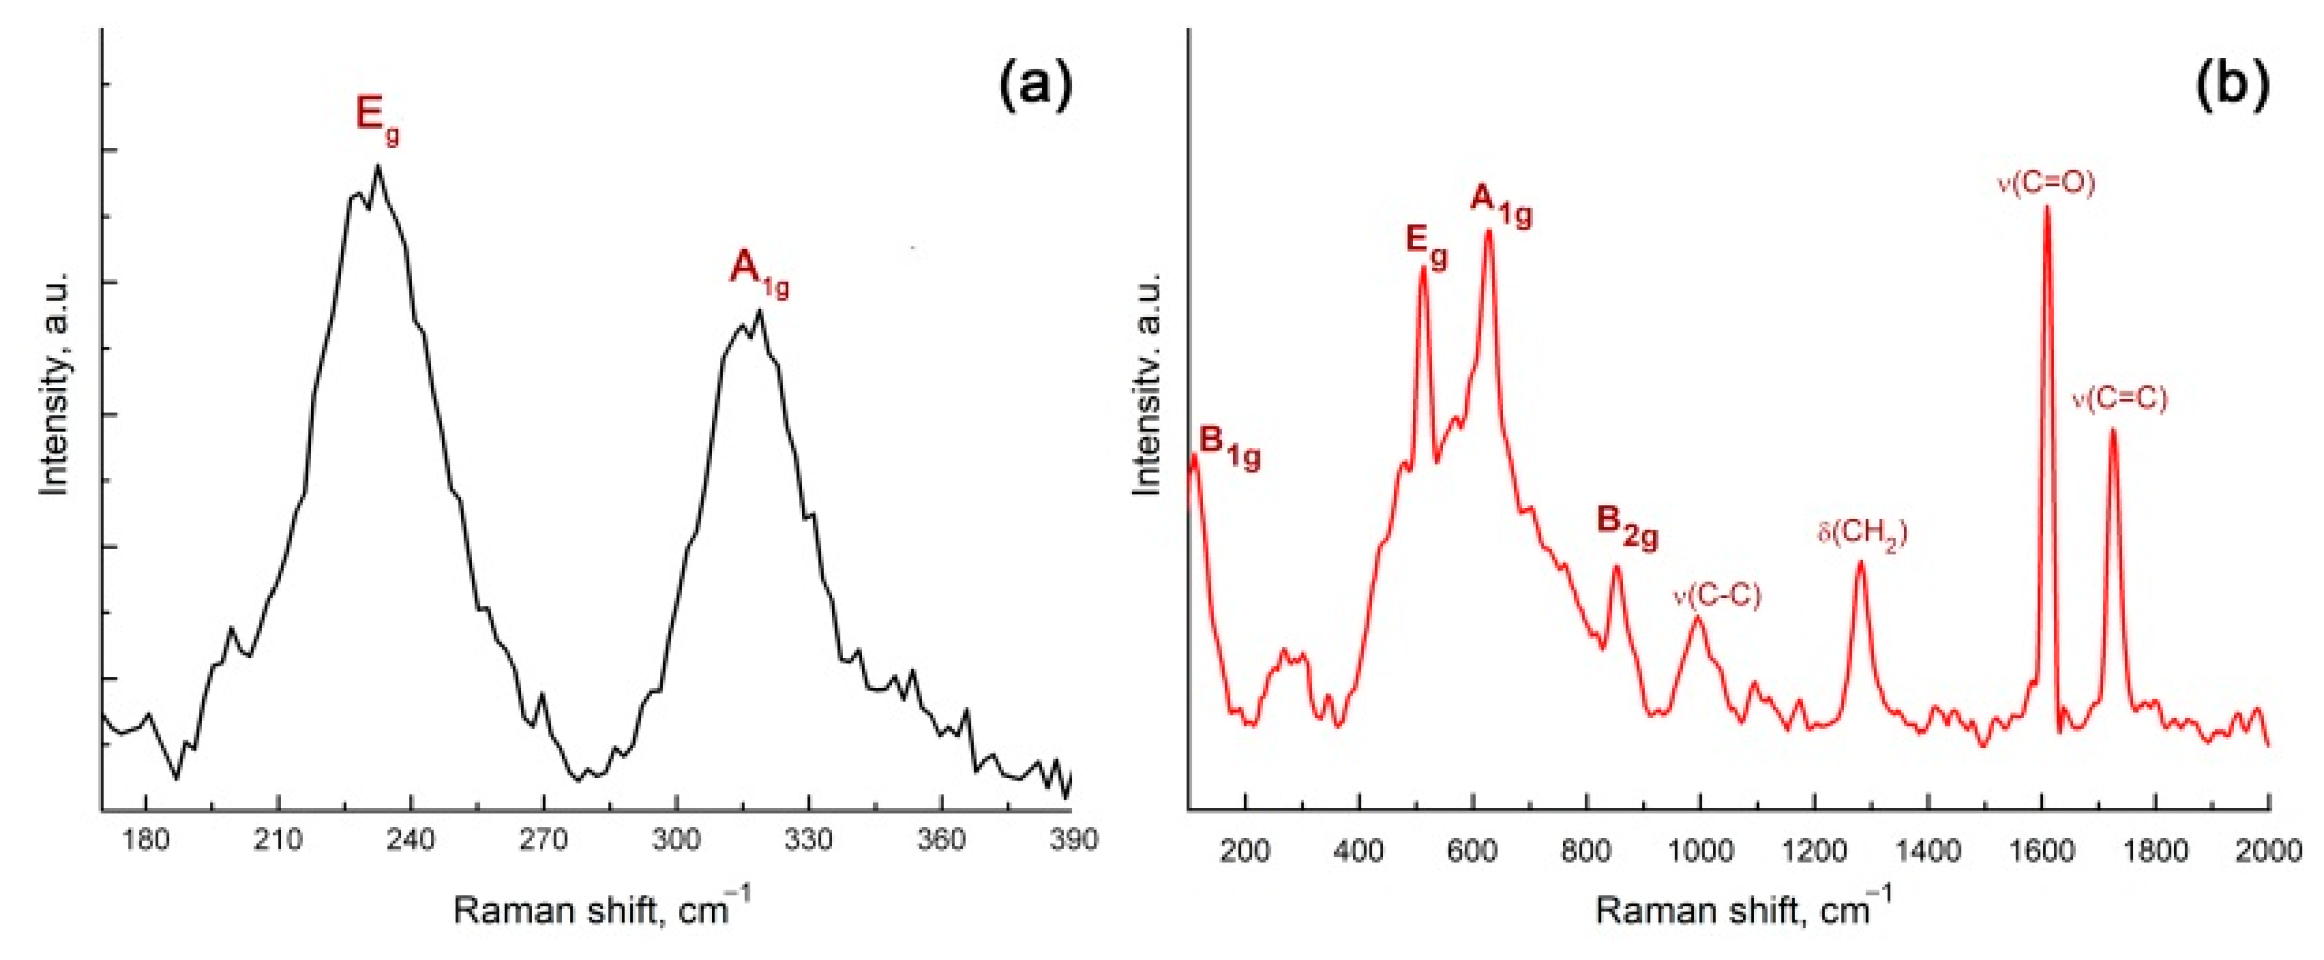
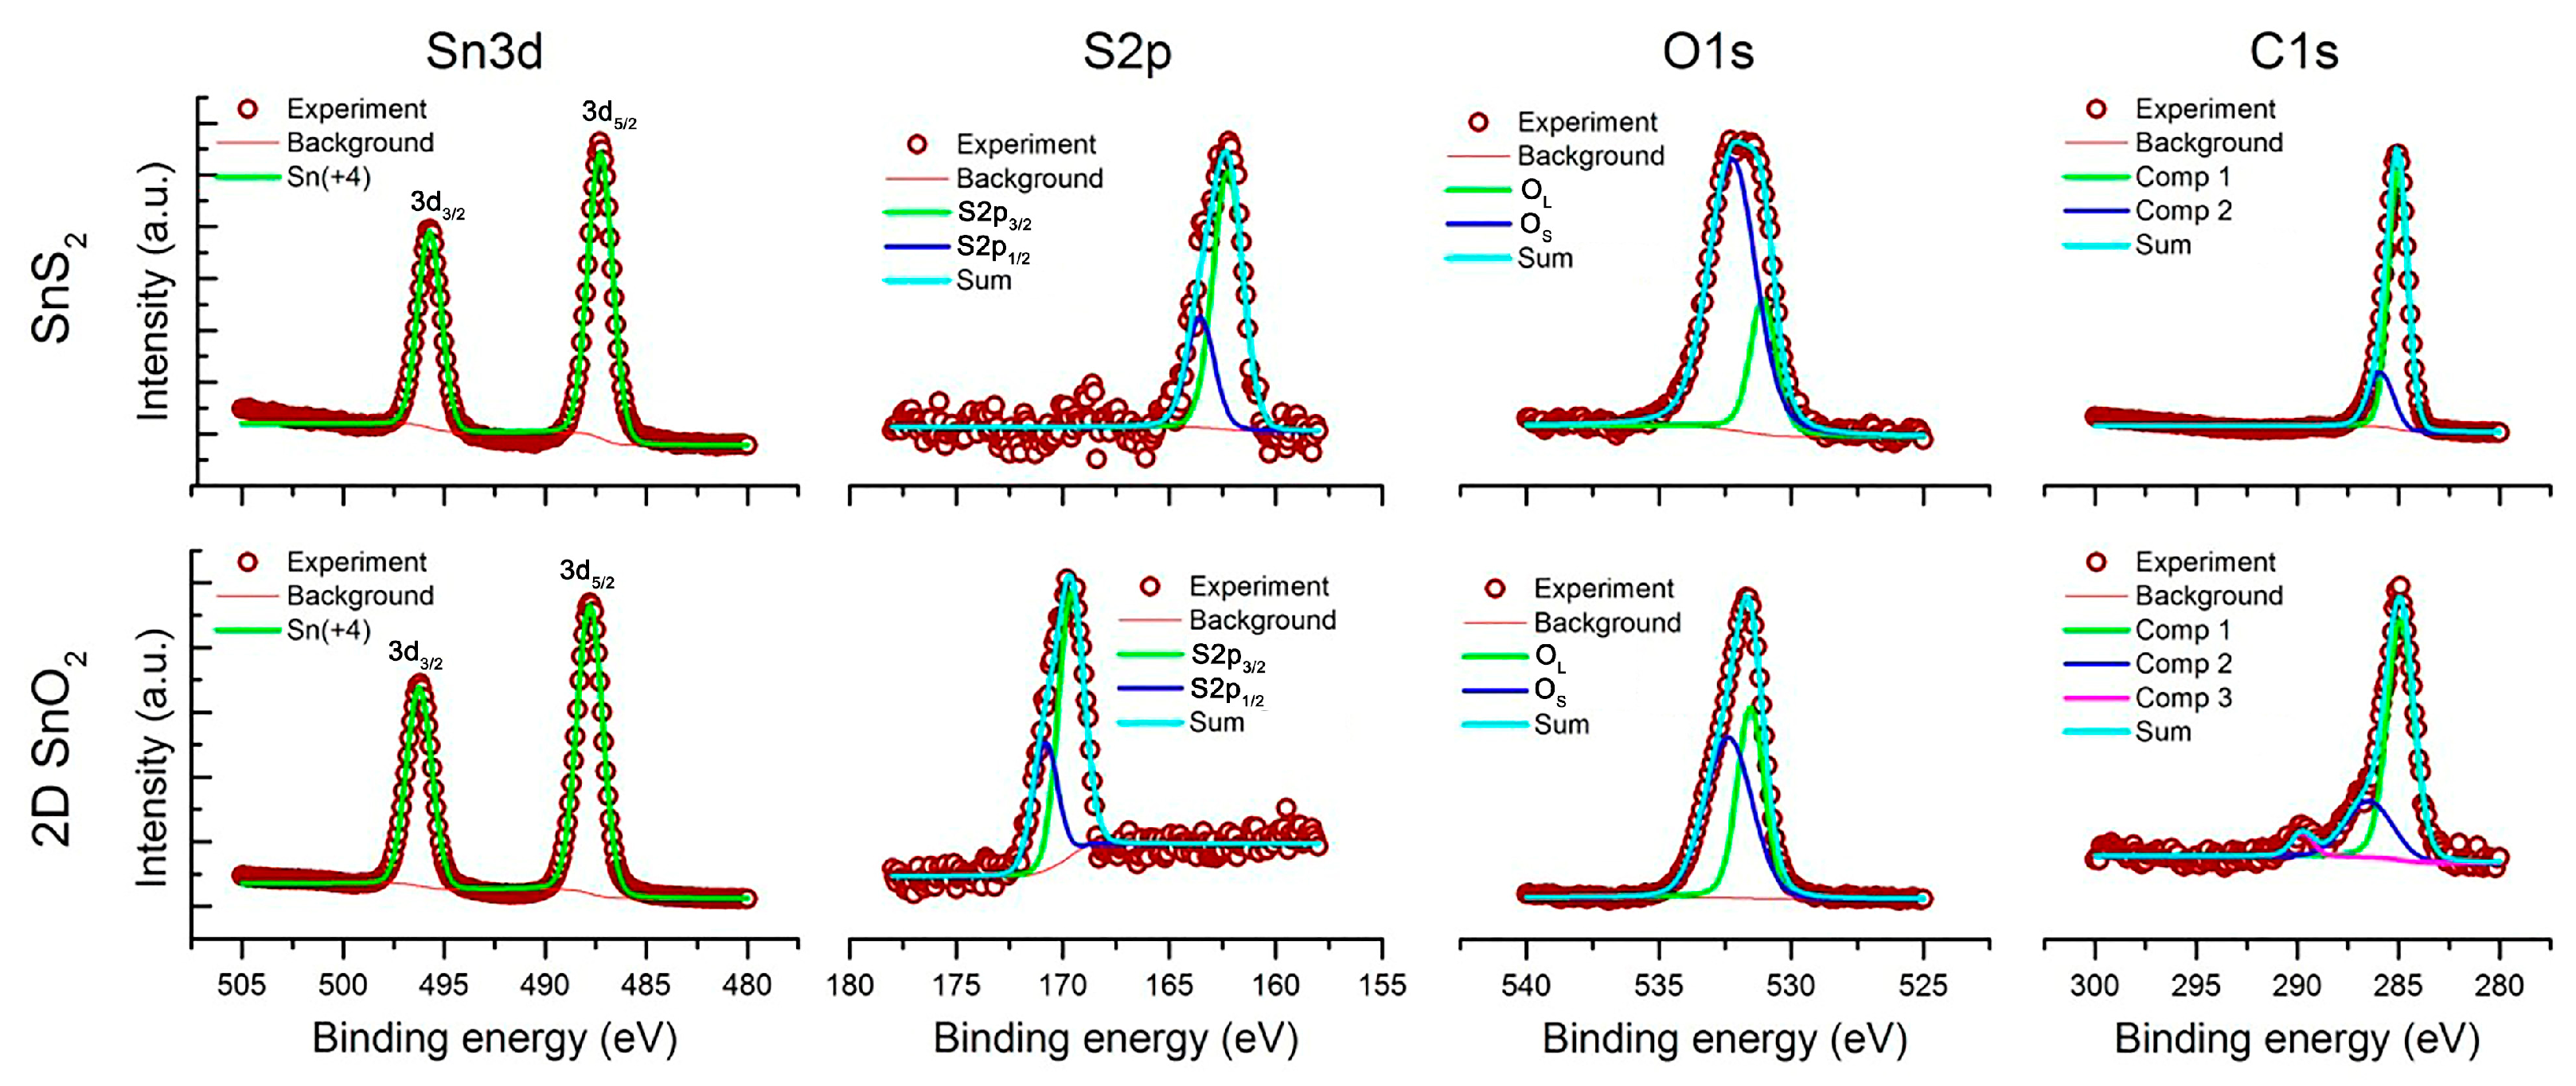
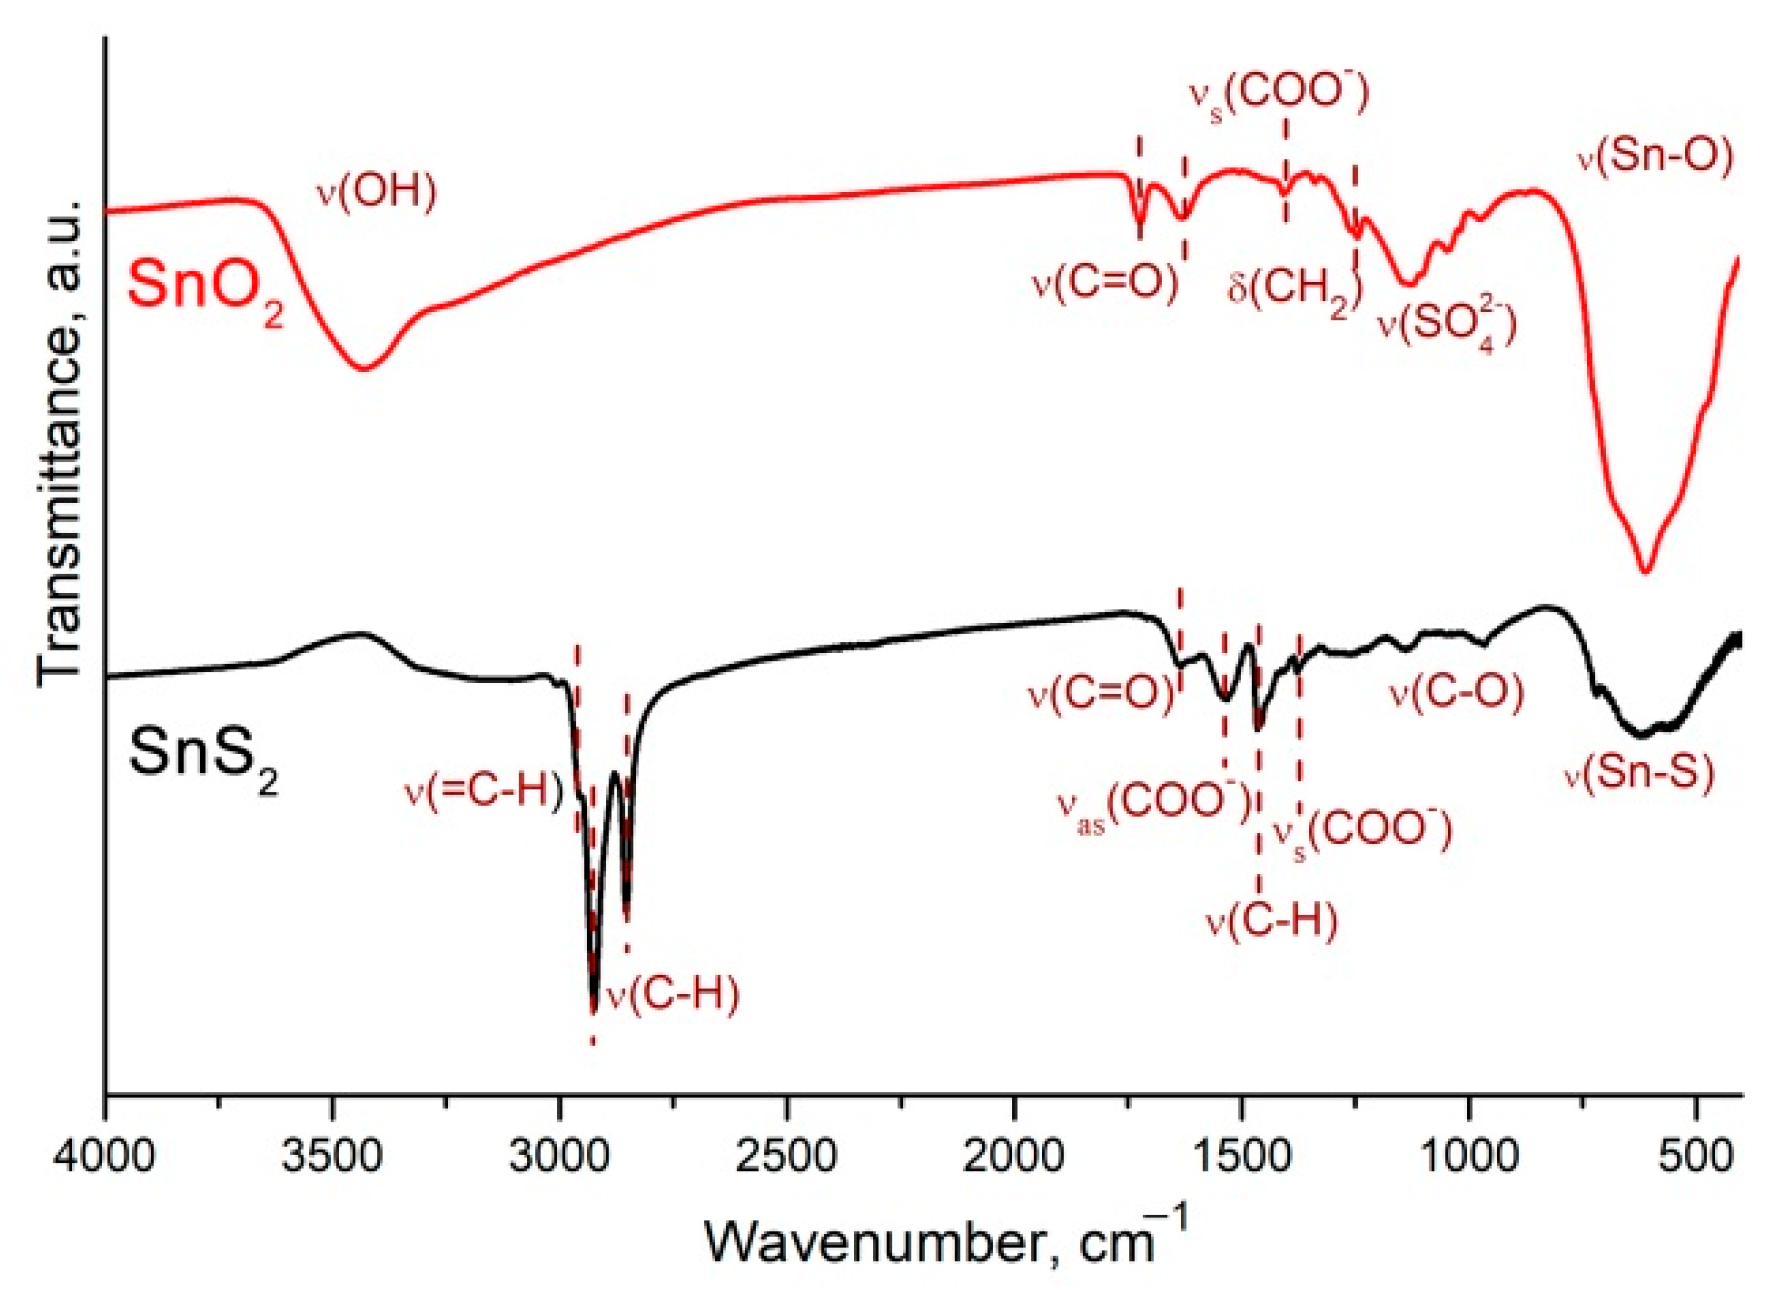
3.1. Microstructure, Phase Composition and Surface Composition

The nanosheet morphology was studied using the transmission and scanning electron microscopy (TEM and SEM) methods. Figure 3 shows a series of representative TEM images of the SnS2 sample. The SnS2 nanosheets have 2D morphology. The sample is formed by~ 5 nm thick nanosheets packed in agglomerates of 4–5 pieces (Figure 3b). The electron-diffraction pattern (inset in Figure 3a) taken from an ensemble of nanosheets shows that particles have the crystal structure of SnS2 (berndtite). When oxidized at 500 °C, the structure of the 2D nanosheets is mostly preserved. (Figure 3c,d). SEM images (Figure 4) reveal the formation of nanosheets with lateral lengths > 500 nm.
The X-ray diffraction pattern of the SnS2 nanosheets (Figure 5) is close to the diffractogram of the SnS2 Berndtite-2T standard (ICDD No. 23-677). The diffraction pattern contains broadened reflections (100) and (110), which refer to the directions lying in the plane of the sheet. At the same time, the reflection (001) corresponding to the normal to the plane of the sheet does not appear. This may be due to the extremely small thickness of the sheet that indicates the implementation of a 2D structure. The oxidation of the SnS2 nanosheets leads to the formation of SnO2 with a cassiterite structure (ICDD No. 41-1445). The diffraction maxima of 2D SnO2 are greatly broadened, which indicates the small size of the crystal grains. The crystallite size of the 2D SnO2 calculated using Sherrer’s formula with (110) and (101) reflections is 4.0 ± 0.5 nm, which correlates with the high specific area of 44 ± 2 m2/g.
Figure 6 compares the Raman spectra of the SnS2 and 2D SnO2 nanosheets. Assignments of Raman vibrational modes are presented in Table 1. Two peaks with maxima at 230 cm−1 and 317 cm−1 are observed in the Raman spectrum of the SnS2 nanosheets (Figure 6a). The latter corresponds to the A1g mode of SnS2 [39]. The line at 230 cm−1 is shifted towards large wavenumbers compared with Eg SnS2 (205–210° cm−1 for a single crystal [39,40]) and is very intense, compared with A1g. Such modification of the spectrum may be due to the dimensional effect and the formation of a 2D structure [41]. In the Raman spectrum of the 2D SnO2 sample (Figure 6b), there are A1g, Eg, B2g, B1g tin dioxide modes as well as a wide band in the range of 400–700 cm−1, corresponding to the superposition of surface modes [42]. The assignment of Raman bands corresponding to volume modes is made on the basis of the literature data [43]. The appearance of surface modes is associated with the small size of the SnO2 particles, and may be due to the manifestation of symmetry-forbidden oscillations, due to a disturbance of the long-range order in systems of reduced dimension [42]. An alternative explanation is the formation of a highly defective near-surface layer, the contribution of which is maximal for materials with the smallest particle size [44]. In the range of 900–2000 cm−1 in the spectrum of 2D SnO2, there are lines corresponding to the residues of the oleic acid stabilizer used in the synthesis of the SnS2 nanosheets (Table 1).
XP-spectra SnS2 and 2D SnO2 are shown in Figure 7. In both cases, tin is present in the oxidation state +4. The positions of the S2p lines correspond to the sulfide anion (162.3 eV, 163.5 eV) in the case of SnS2, and the sulfate anion (169.6 eV, 170.8 eV) in the case of 2D SnO2. The ratio of the integral intensities of the sulfur and tin signals is [S]/[Sn] = 0.24 and 0.04 for SnS2 and 2D SnO2, respectively. This indicates that in 2D SnO2, sulfates are surface residues. The O1s spectra contain two components corresponding to oxygen of the oxide (OL, 530.7–531.2 eV) and oxygen from the surface oxygen-containing species (OS, 532.0–532.4 eV). The ratio of the integral intensities of oxygen and tin signals [O]/[Sn] = 0.37 and 0.24 for SnS2 and 2D SnO2, respectively. Such a large amount of oxygen from oxygen-containing particles on the SnS2 surface is due to the presence of an organic stabilizer, oleic acid. The C1s spectrum is also complex, and contains two or three components corresponding to the presence of C-C bonds (C1, 284.8–285.0 eV), C-OH and C-O-C bonds (C2, 285.9–286.5 eV) and carboxyl groups COO (C3, 289.1–289.8 eV). The C3 component appears only in the 2D SnO2 spectrum. The ratio of the carbon and tin signal-intensities is [C]/[Sn] = 2.22 and 0.04 for SnS2 and 2D SnO2, respectively. The main part of the carbon on the surface of the SnS2 is obviously represented by a long-chain hydrocarbon radical of oleic acid.
The FTIR spectra shown in Figure 8 are consistent with the results of the Raman spectroscopy and XPS. The assignment of absorption bands is presented in Table 1 [45]. There are many hydrocarbon fragments and carboxylic groups which may be attributed to oleic acid ligands covering the SnS2 surface. On the surface of the 2D SnO2, only residues of the organic-stabilizer oxidation products and sulfate anions were found.

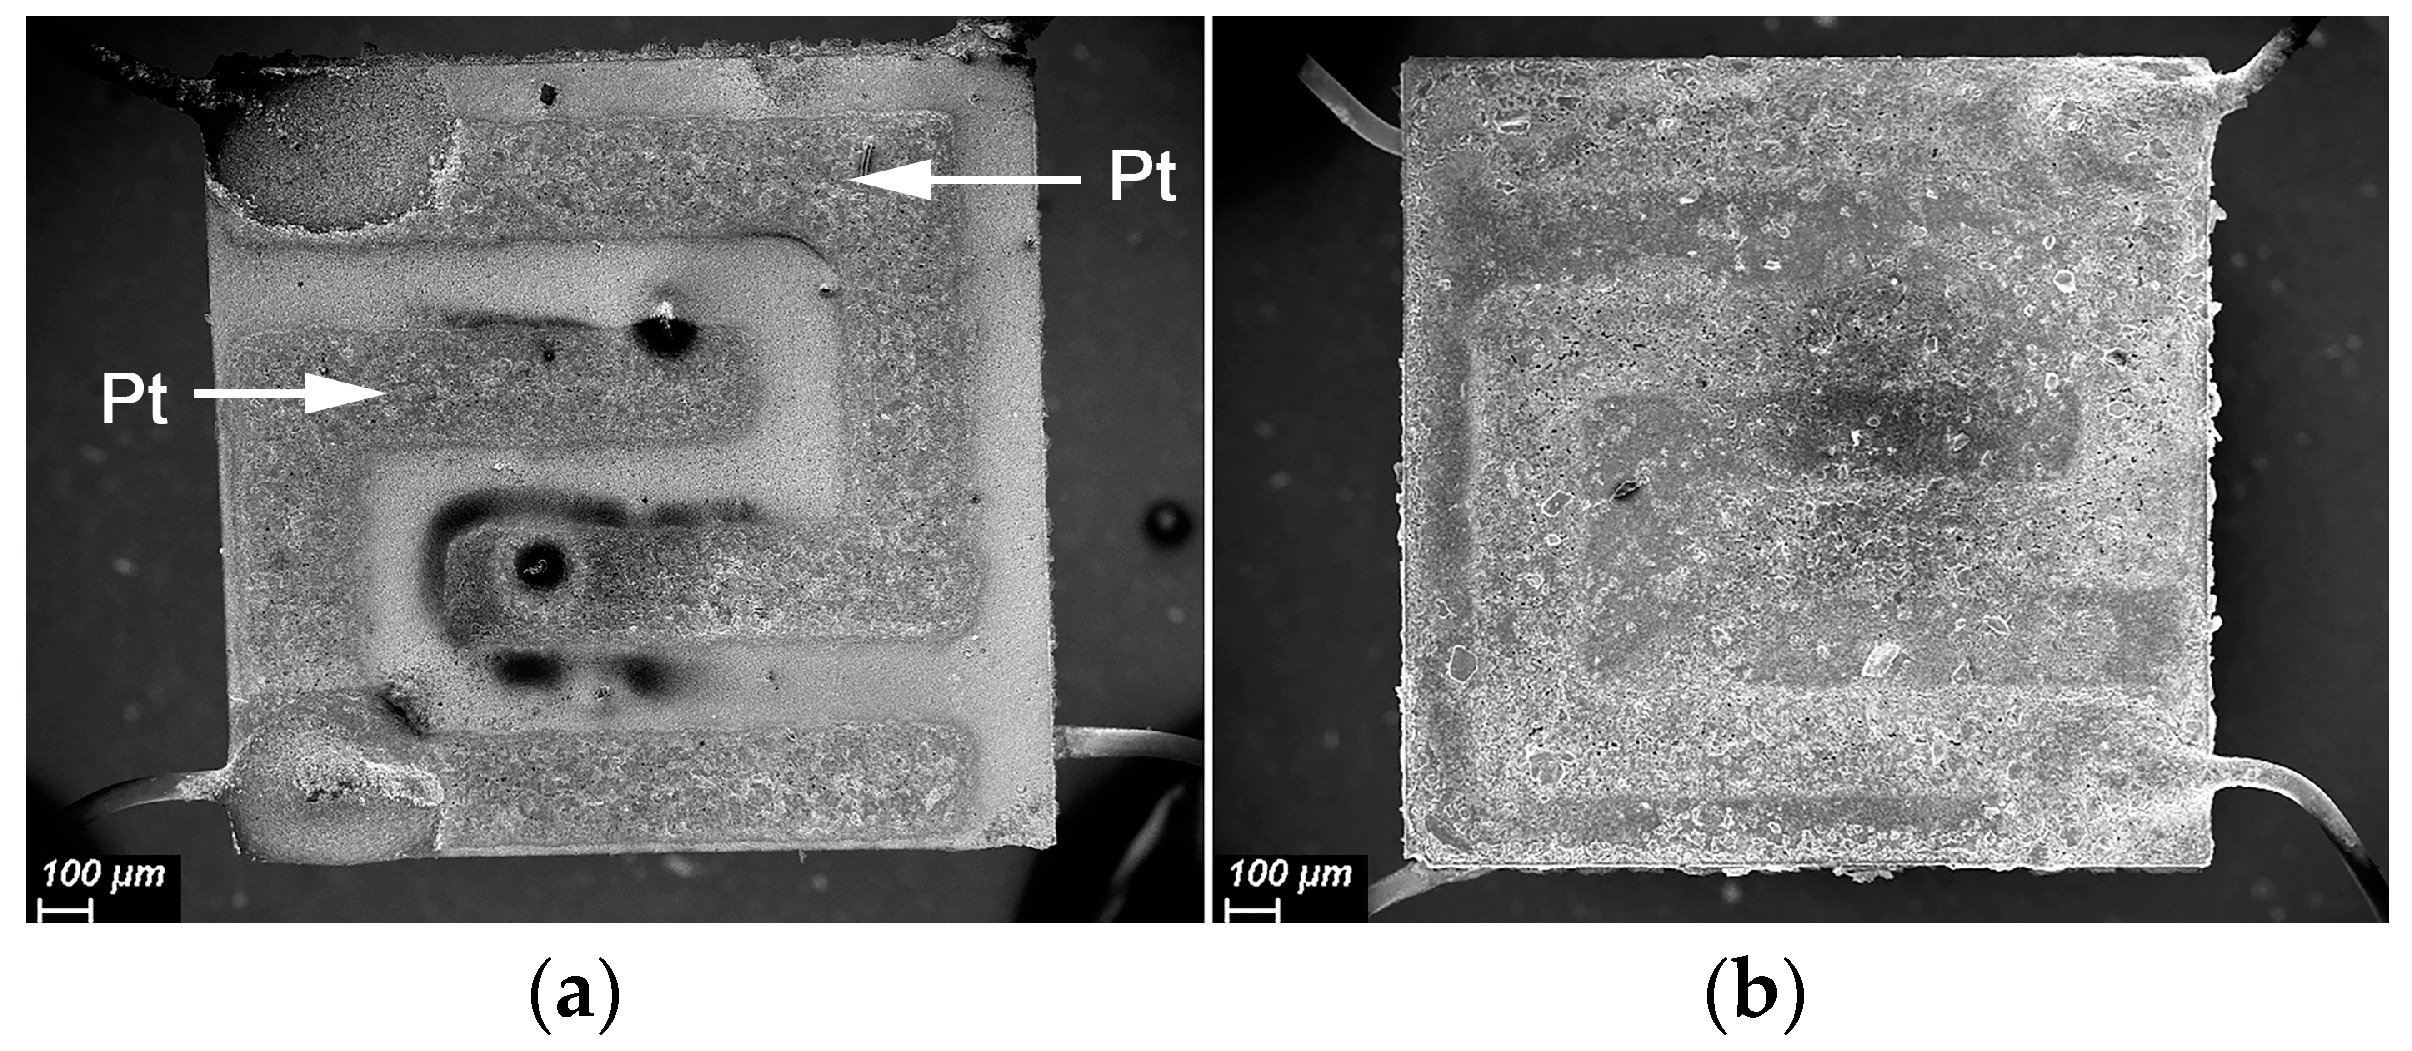
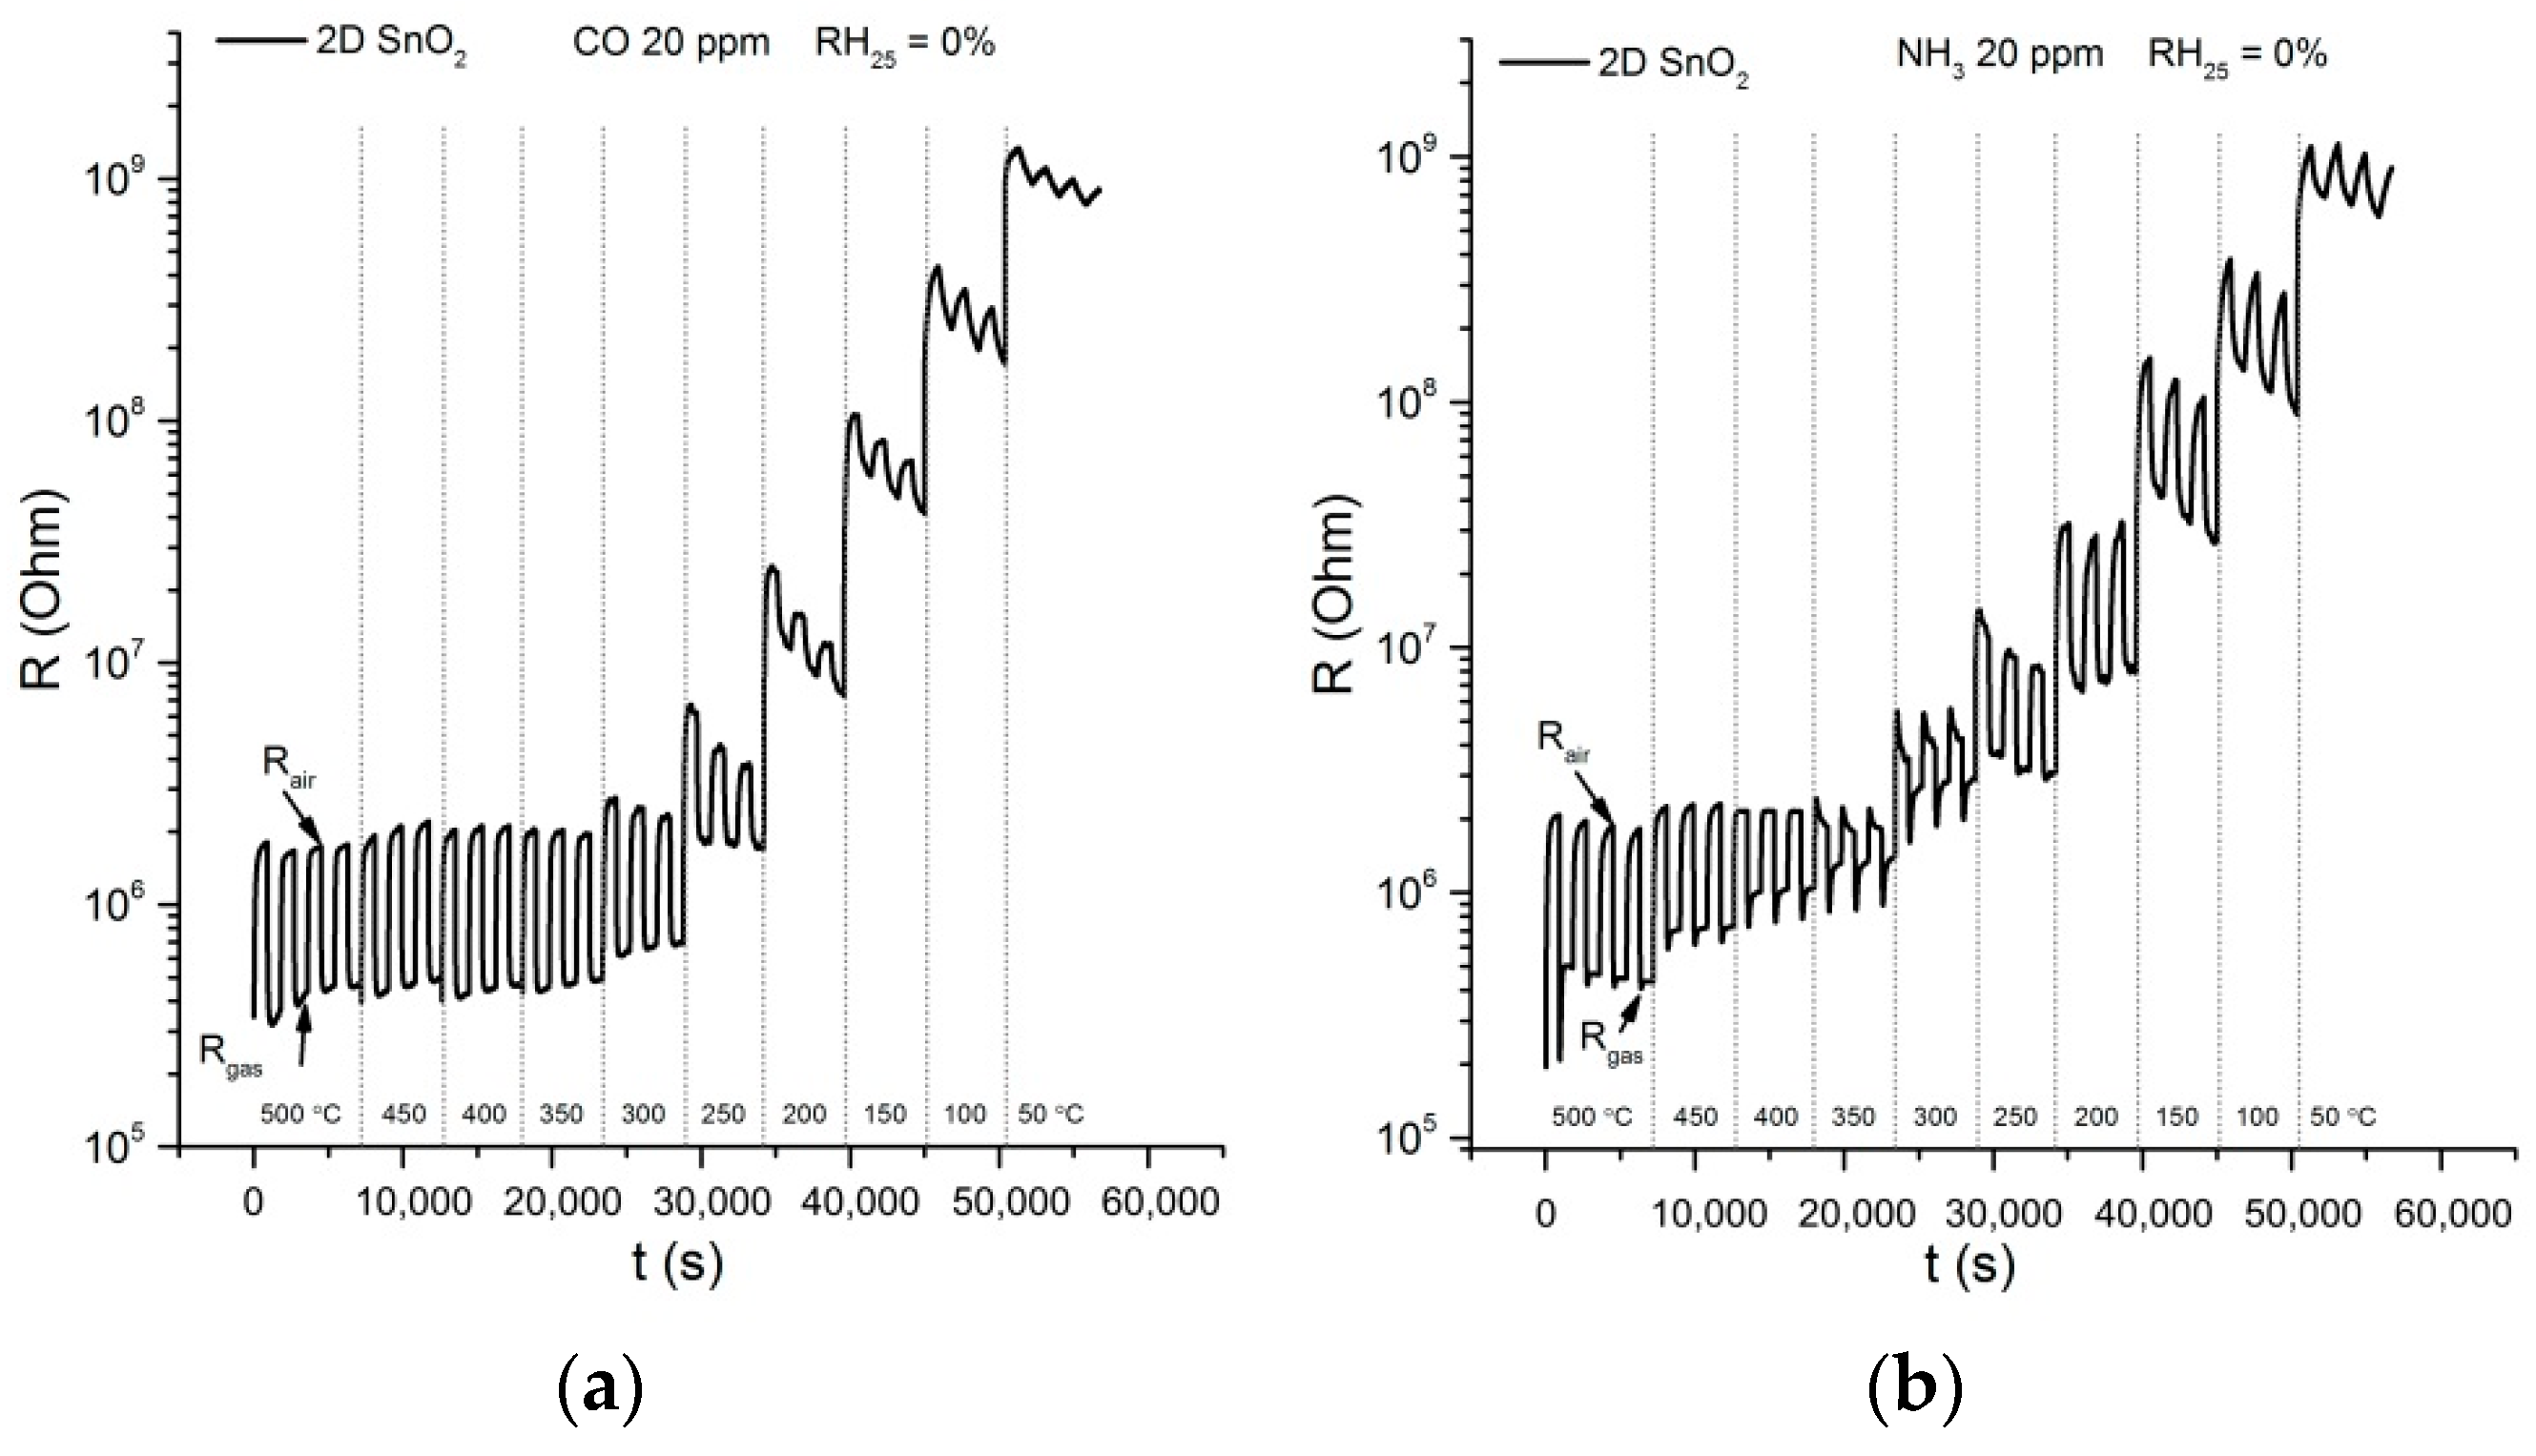
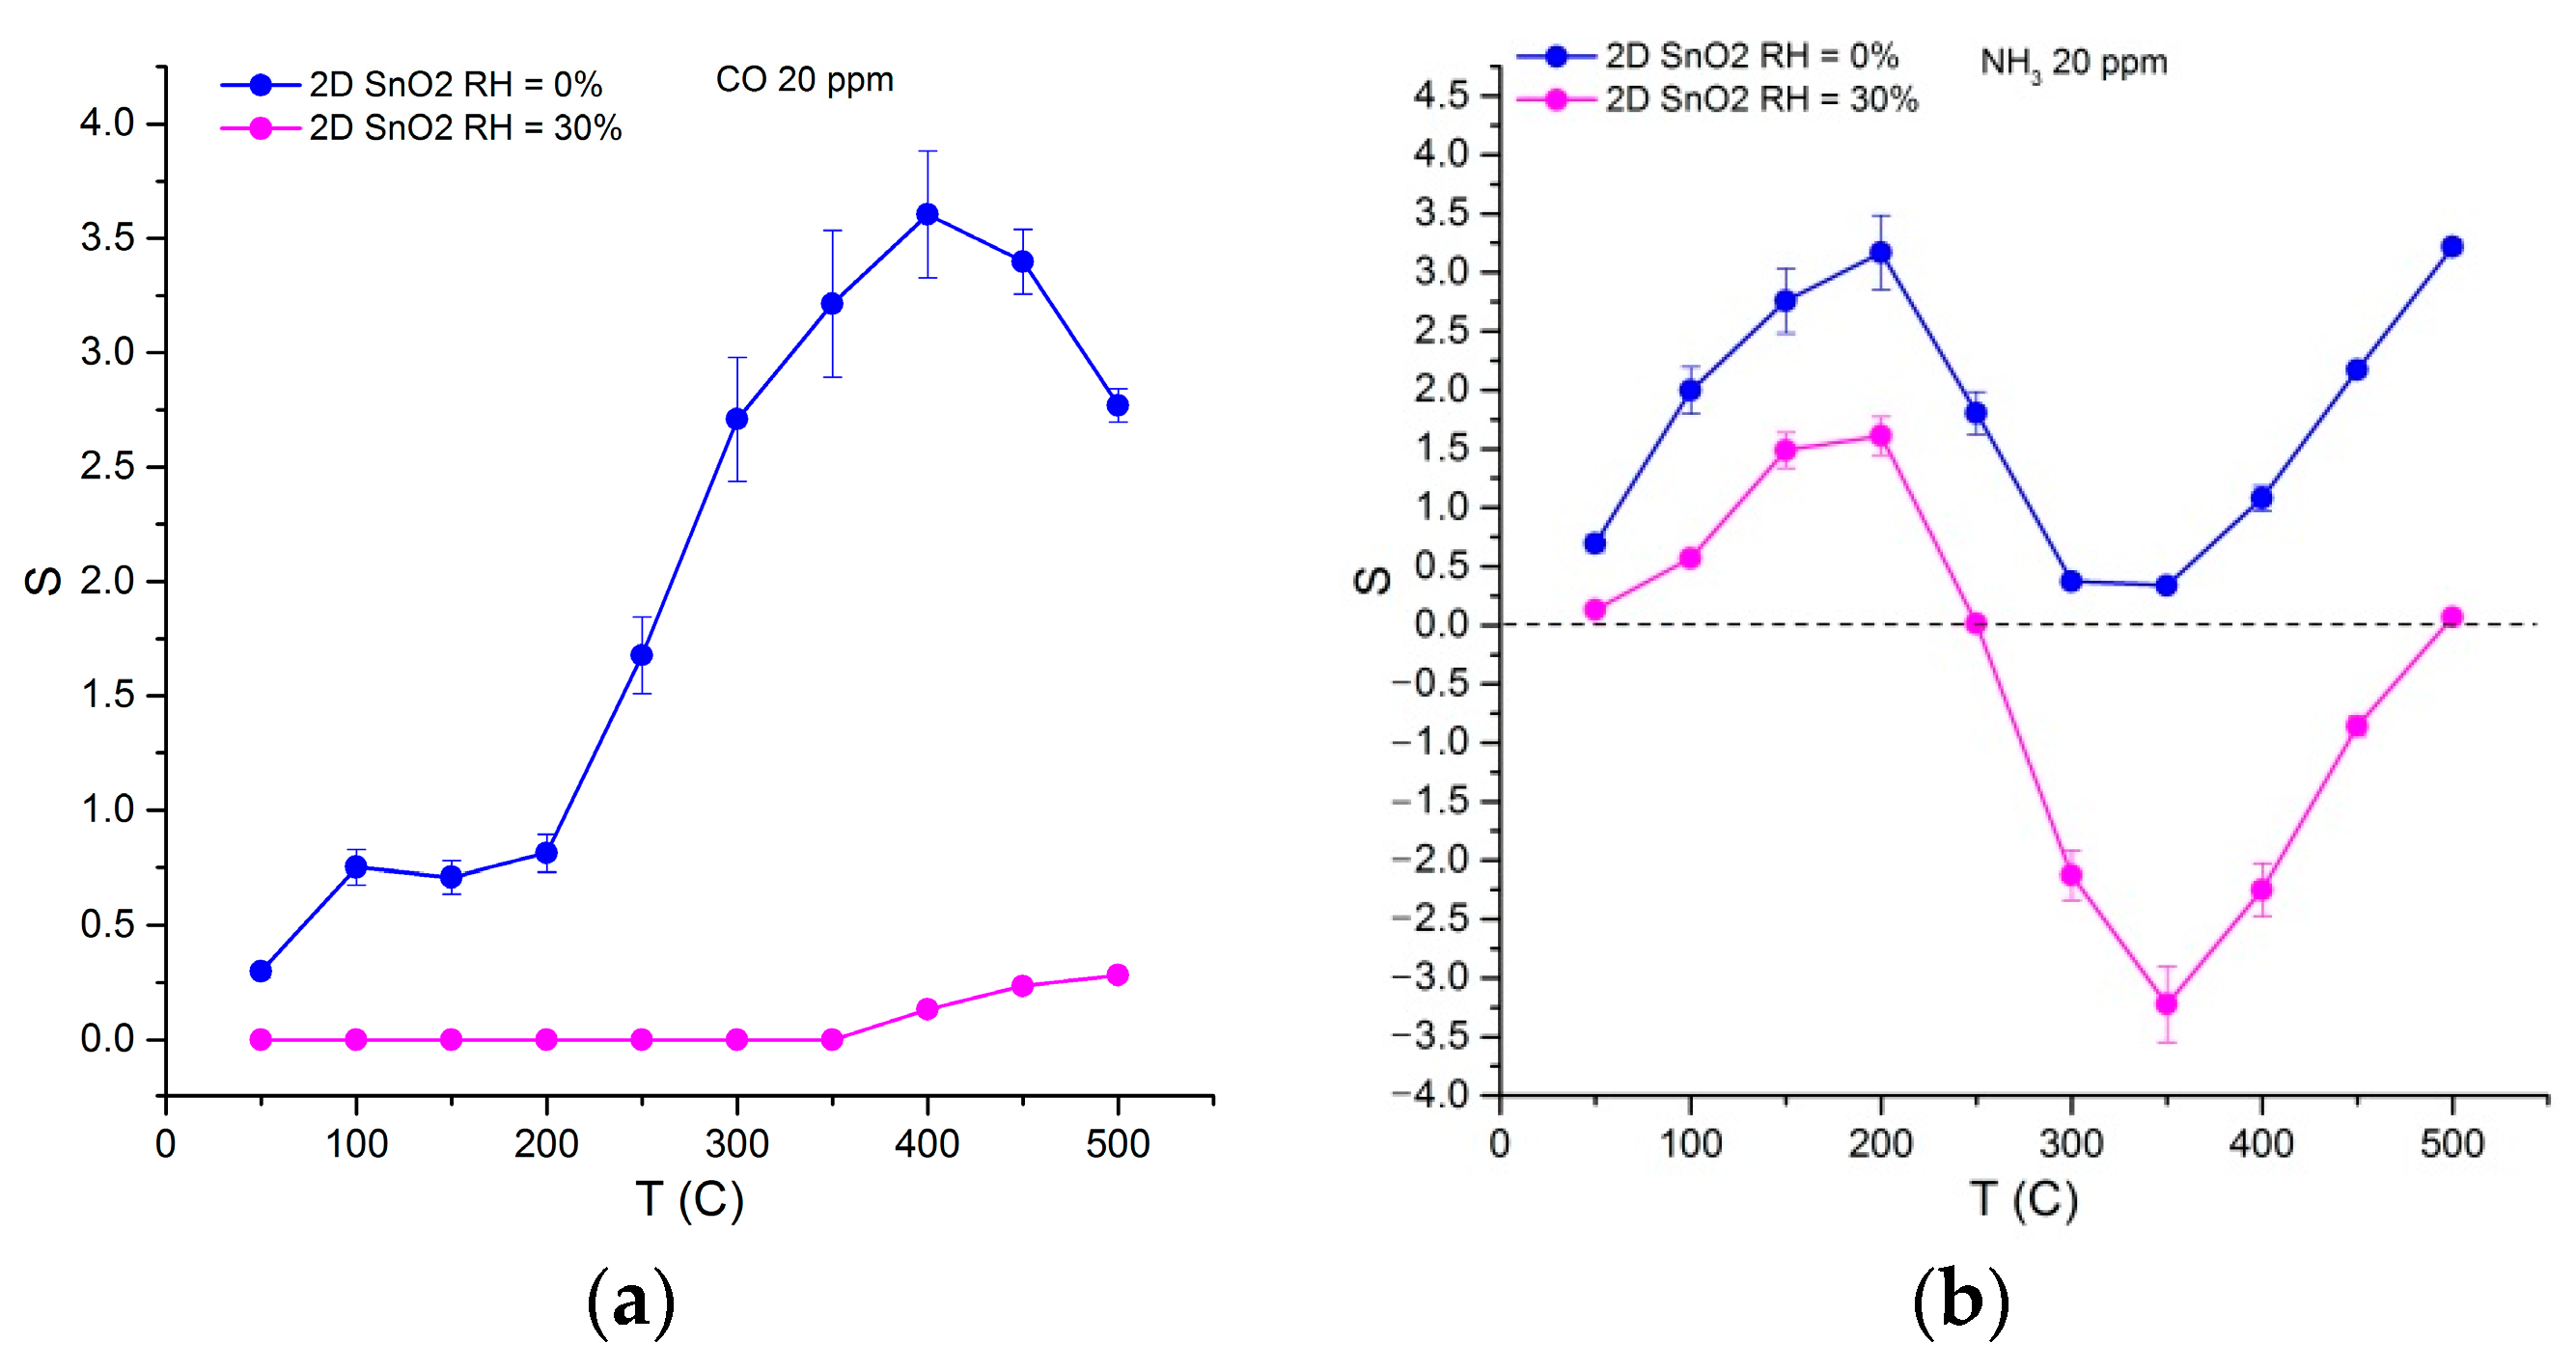
3.2. Gas Sensor Properties

To evaluate the sensor properties of the 2D SnO2 model, reducing gases CO (which does not have specific acid-base properties) and NH3 (which exhibits basic properties) were selected. The measurements were carried out when detecting 20 ppm CO and 20 ppm NH3 in dry (RH25 = 0%) and humid (RH25 = 30%) air. Examples of changes in the resistance of the 2D SnO2 when detecting 20 ppm CO and 20 ppm NH3 in dry air (RH25 = 0%) are shown in Figure 9. The sensor’s resistance decreases in the presence of reducing, due to their oxidation by oxygen chemisorbed on the SnO2 surface:
CO gas + O β ads α β CO 2 gas + α e
2 NH 3 gas + 3 β O β ads α N 2 gas + 3 H 2 O gas + 3 α β e
where CO gas ,   NH 3 gas are CO and NH3 molecules in the gas phase, O β ads α is the chemisorbed oxygen species (α = 1 and 2 for once- and twice-charged particles, respectively; β = 1 and 2 for atomic and molecular forms, respectively), e is an electron injected into the conduction band, and CO 2 gas , N 2 gas ,   H 2 O gas are products of CO and NH3 oxidation desorbed into the gas phase.
In the temperature range 350–500 °C, the independence of the 2D SnO2 resistance in air on the measurement temperature is observed. Such an unusual type of temperature dependence of the semiconductor resistance may be due to the small thickness of the sensitive layer formed from the sol during the oxidation of the SnS2 nanosheets. Therefore, the surface of all 2D SnO2 particles is accessible for oxygen chemisorption, which occurs with electron localization. As a result, the 2D SnO2 particles with a thickness of several nanometers turn out to be completely depleted of electrons. This corresponds to the situation of the “flat zones”, with the same concentration of electrons in the bulk and near the surface of the crystallite [46], in which the barriers at the grain boundaries that determine the value of the conductivity activation-energy are small. With a decrease in the operating temperature, the thickness of the depleted layer near the 2D SnO2 surface decreases. This leads to a difference in the electron concentration in the bulk and near the crystallite surface, which leads to the formation of significant surface barriers and a transition to the activation character of conductivity.
At temperatures below 200 °C, baseline drift (the change in resistance in air at the same operating temperature) is observed. This effect may be due to incomplete desorption and accumulation of the products of CO and NH3 oxidation on the surface of sensitive material.
The temperature dependencies of the sensor’s response are shown in Figure 10. When detecting CO (Figure 10a), there is a significant decrease in the response value. Such a change in signal is apparently because of a decrease in the number of oxidative active-centers on the SnO2 surface, namely, chemisorbed oxygen anions, which are responsible for the formation of a sensor response when detecting CO [47]. In humid air, dissociative adsorption of water vapor leads to the substitution of both lattice and chemisorbed oxygen by hydroxyl groups [48]. It can be expected that for thin 2D SnO2 sensitive layers formed from the sol during the oxidation of the SnS2 nanosheets, the process of surface hydroxylation in humid air occurs to a high extent.
The temperature dependencies of the sensor’s response towards NH3 have a more complex form (Figure 10b). In dry air, a maximum sensor signal is observed at T = 200 °C. The surface sulfate anions act as additional acid centers, favored for NH3 adsorption [49]. The temperature range of 250–350 °C corresponds to the minimum sensor response, and a further temperature increase leads to an increase in the sensor signal. When NH3 is detected in moist air, the sensor response of 2D SnO2 acquires “negative” values in this temperature range, due to the fact that the resistance of this material in the presence of ammonia becomes greater than in pure air.
Such a change in the response type was reported for various materials: from n- to p-type for MoO3 [50], In2O3 [51], SnO2 [52,53,54], SnO2(Fe) [55], SnO2(Pd,Pt) [56], ZnO [57], WO3 [58,59], TiO2 [60], and from p- to n-type conductivity for α-Fe2O3 [61], Co3O4 [62], graphene [63,64], and SnO2- and WO3-decorated graphene [65]. The inversion of the sensor response was explained by different reasons: (i) a change in the type of main charge-carriers in the semiconductor oxide, due to either the surface reactions under certain conditions, or because of the effect of impurities; (ii) kinetic reasons related to the adsorption barrier of the detected gas; (iii) the formation of new donor or acceptor species, which contributes to the change in the sensor conductivity.
The results obtained in this work and in our previous article [54] allow us to conclude that when detecting ammonia, the most likely cause of signal inversion is precisely the appearance of new acceptor species. The reason for the decrease in the SnO2 response in the temperature range of 250–350 °C is the possible NH3 to NO oxidation by chemisorbed oxygen. Further interaction of NO molecules with ambient oxygen molecules leads to the formation of surface-bound nitrite and nitrate groups [66]. This process occurs with the localization of charge carriers from the conduction band of the semiconductor, which leads to a decrease in the electrical conductivity of the n-type semiconductor material and a formal decrease in the sensor response. The adsorption of water vapor on the SnO2 surface occurs with an increase in the electron concentration in the conduction band of the semiconductor [48]. This should stimulate the formation of surface nitrite and nitrate groups which occurs with the localization of electrons, and cause a greater increase in the resistance of the sensitive layer.

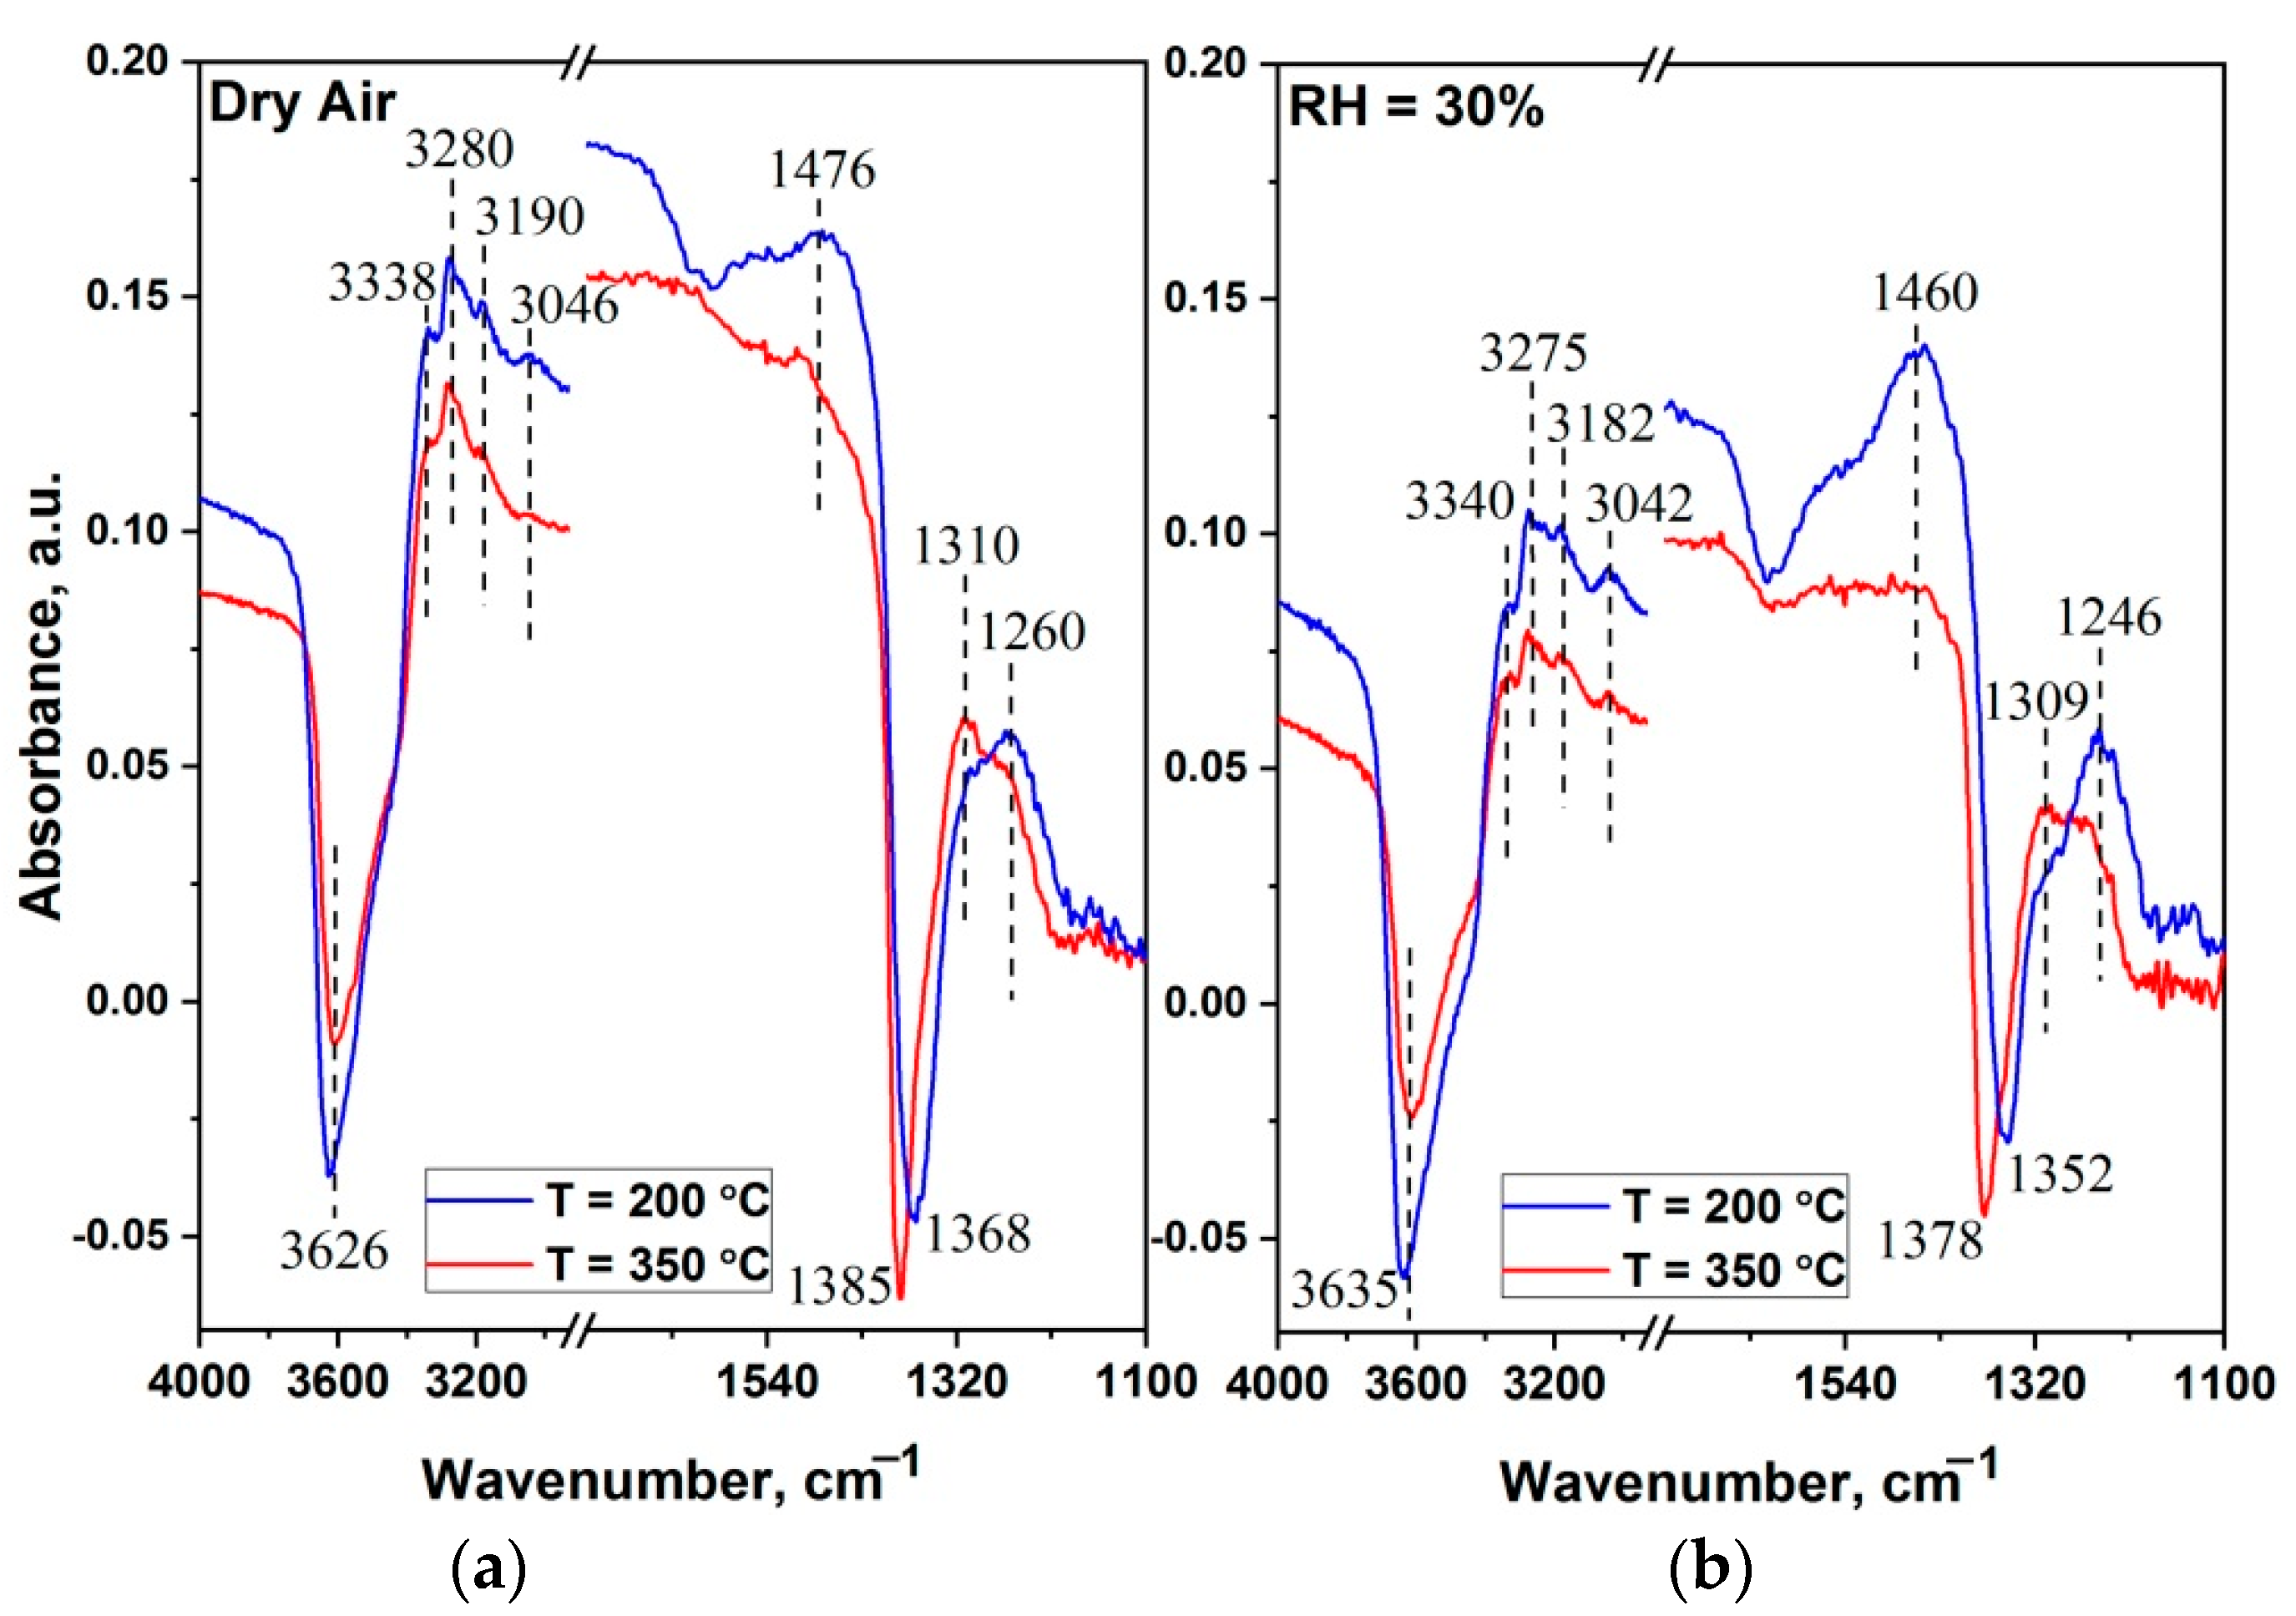
3.3. In Situ DRIFTS Analysis of 2D SnO2 Interaction with NH3

To confirm the above reasoning, the interaction of the 2D SnO2 with ammonia was investigated using DRIFTS in dry (RH25 = 0%) and humid (RH25 = 30%) air at temperatures of 200 °C and 350 °C, corresponding to the maximum "positive" and maximum "negative" sensor response, respectively. The DRIFT spectra recorded after 100 min exposure in dry or humid air containing 100 ppm NH3 are shown in Figure 11. Spectra in dry and humid air at 200 °C and 350 °C were used as the baselines.
In general, the spectra obtained at 200 °C and 350 °C in dry and humid air are similar (Table 2), but there are also differences corresponding to the type of change in conductivity. It can be assumed that the adsorption of ammonia molecules proceeds to a greater extent on the Brønsted acid active-sites, which results in a decrease in the intensity of the υ(OH) and δ(H2O) groups, the protonation of NH3 and the appearance of bands corresponding to the bending vibrations of NH4+ at 1460 and 1476 cm−1. The bands in the range of 1246–1260 cm−1 are associated with vibrations of the NH3+ coordinated at the Lewis acid sites (tin ions), while the N-H stretching-vibration region of coordinated NH3 is revealed in the form of many narrow peaks in the range of 3042–3340 cm−1 [67,68].
At 200 °C, the presence of intense peaks related to NH3+ and NH4+ assumes that ammonia is the main reagent interacting with the surface of the sensitive layer of the sensor. Comparing the intensities of these peaks, one can see that a humid atmosphere is a more favorable condition for the adsorption of NH3 species, at both the Brønsted and Lewis acid sites. At the same time, at 350 °C, a decrease in the intensity of peaks related to the NH3 species and the appearance of an additional peak at 1310 cm−1 can be noticed. The latter corresponds either to chelating bidentate nitrate or chelating bidentate nitrite groups [43,44,69]. The presence of nitrate groups on the surface at high temperature conditions may indicate the oxidation of ammonia molecules to NO (process (3)), and then, with the participation of ambient oxygen, further conversion to NO2 (processes (4) and (5)). As was shown earlier by Wang et al. [70], the maximum conversion of NO to NO2 in NH3-pre-adsorbed samples is achieved in the temperature range of 350–400 °C.
2 NH 3 gas + 5 β O β ads α 2 NO ads + 3 H 2 O gas + 5 α β e
2 NO ads + O 2 gas + 2 e 2 NO 2 ads
2 NO 2 ads + O 2 gas 2 NO 3 ads
Processes (4) and (5) can lead to a decrease in the conductivity of the sample, and might be the main reason for the reversing of the sensor signal (Figure 10b). Our results are in agreement with the observations of Zhou et al. [68] and Ramis et al. [71], who observed NH3 over-oxidation to NO or N2 at high temperatures above 300 °C.
The appearance of negative IR-adsorption-bands after NH3 adsorption at the range of 1352–1385 cm−1, depending on the sample, is directly related to the presence of sulfate groups on the surface [43,44]. Hadjiivanov et al. have reported the formation of a negative band in this region, and explained it by the adsorption of species in the immediate vicinity of sulfate anions [72]. Ramis et al. have attributed the negative band at 1362 cm−1 to the perturbation of the S=O band of traces of sulphate impurities in γ-Fe2O3 [71].
However, it should be noted that this negative absorption-peak also appears during the interaction of ammonia with the sample with pre-adsorbed SO2. Thus, according to Zhang et al., the formation of the negative band at 1368 cm−1 is associated with the replacement of the sulfate species by the ammonia ones, while the interaction of SO2 with the NH3 pre-treated sample leads to the production of (NH4)2SO4 or NH4HSO4 [67].

4. Conclusions

In summary, we have developed a new route to obtain two-dimensional SnO2 for sensor applications. The 2D SnO2 nanosheets were successfully synthesized via the oxidation (at 500 °C) of SnS2 nanosheets obtained in solution during the simple chemical reaction. TEM and SEM data confirmed that the as-grown SnS2 nanosheets and oxidized SnO2 nanosheets have 2D morphology. The 2D SnO2 is characterized by a high specific-surface area and increased surface-acidity, caused by the presence of residual sulfate anions. The combination of these characteristics provides a high 2D SnO2 sensor signal towards NH3 at a low temperature of 200 °C in dry air, but at the same time causes an inversion of the sensor response when detecting NH3 in a humid atmosphere. We have to conclude that SnS2 nanosheets are a good template for synthesizing 2D SnO2. Moreover, the features of the active surface-centers formed may be useful when creating sensors for a particular gas with pronounced basic properties. We believe that synthesized 2D SnO2 will be interesting for the design of new sensitive materials with high sensor performances.

Author Contributions

Conceptualization, R.V., X.L. and M.R.; methodology, R.V., X.L. and M.R.; formal analysis, D.K., V.P. and A.N.; investigation, D.K., N.U., V.P., A.N., T.S. and R.N.; data curation, V.P., A.N. and T.S.; writing—original draft preparation, R.V., D.K., A.N. and M.R.; writing—review and editing, R.V., X.L. and M.R. All authors have read and agreed to the published version of the manuscript.

Funding

This research was funded by the Russian Foundation for Basic Research, grant number 21-53-53018, and the National Natural Science Foundation of China, grant number 62111530055.

Institutional Review Board Statement

Not applicable.

Informed Consent Statement

Not applicable.

Data Availability Statement

The data that support the findings of this study are available from the corresponding author upon reasonable request.

Acknowledgments

TG-MS: FTIR and DRIFTS experiments were carried out using the equipment purchased by funds from the Lomonosov Moscow State University Program of the Development. SEM experiments were carried out using research infrastructure of the “Educational and Methodical Center of Lithography and Microscopy” of Lomonosov Moscow State University, supported by the Interdisciplinary Scientific and Educational School of Moscow State University, “Photonic and Quantum Technologies. Digital Medicine”. TEM experiments were carried out using equipment of the “Nanochemistry and Nanomaterials” center, supported by the Program of Development of Lomonosov Moscow State University. Authors are grateful to Anastasiya Alekseeva (Chemistry Department, Moscow State University) for the XRD investigations.

Conflicts of Interest

The authors declare no conflict of interest.

References

  1. Novoselov, K.S.; Geim, A.K.; Morozov, S.V.; Jiang, D.; Zhang, Y.; Dubonos, S.V.; Grigorieva, I.V.; Firsov, A.A. Electric field effect in atomically thin carbon films. Science 2004, 306, 666–669. [Google Scholar] [CrossRef] [PubMed] [Green Version]
  2. Konstantatos, G.; Badioli, M.; Gaudreau, L.; Osmond, J.; Bernechea, M.; Garcia de Arquer, F.P.; Gatti, F.; Koppens, F.H.L. Hybrid graphene–quantum dot phototransistors with ultrahigh gain. Nat. Nanotech. 2012, 7, 363–368. [Google Scholar] [CrossRef] [PubMed]
  3. Liu, X.; Ma, T.; Pinna, N.; Zhang, J. Two-Dimensional Nanostructured Materials for Gas Sensing. Adv. Funct. Mater. 2017, 27, 1702168. [Google Scholar] [CrossRef]
  4. Choi, S.-J.; Kim, I.-D. Recent Developments in 2D Nanomaterials for Chemiresistive-Type Gas Sensors. Electron. Mater. Lett. 2018, 14, 221–260. [Google Scholar] [CrossRef]
  5. Korotcenkov, G. Black phosphorus—New nanostructured material for humidity sensors: Achievements and limitations. Sensors 2019, 19, 1010. [Google Scholar] [CrossRef] [Green Version]
  6. Reich, E.S. Phosphorene Excites Materials Scientists. Nature 2014, 506, 19. [Google Scholar] [CrossRef] [Green Version]
  7. Anasori, B.; Lukatskaya, M.R.; Gogotsi, Y. 2D metal carbides and nitrides (MXenes) for energy storage. Nat. Rev. Mater. 2017, 2, 16098. [Google Scholar] [CrossRef]
  8. Lee, E.; Kim, D.-J. Recent Exploration of Two-Dimensional MXenes for Gas Sensing: From a Theoretical to an Experimental View. J. Electrochem. Soc. 2020, 167, 037515. [Google Scholar] [CrossRef] [Green Version]
  9. Pakdel, A.; Zhi, C.; Bando, Y.; Golberg, D. Low-dimensional boron nitride nanomaterials. Mater. Today 2012, 15, 256–265. [Google Scholar] [CrossRef]
  10. Wu, W.; Wang, L.; Li, Y.; Zhang, F.; Lin, L.; Niu, S.; Chenet, D.; Zhang, X.; Hao, Y.; Heinz, T.F.; et al. Piezoelectricity of single-atomic-layer MoS2 for energy conversion and piezotronics. Nature 2014, 514, 470–474. [Google Scholar] [CrossRef]
  11. Andoshe, D.M.; Jeon, J.M.; Kim, S.Y.; Jang, H.W. Two-dimensional transition metal dichalcogenides nanomaterials for solar water splitting. Electron. Mater. Lett. 2015, 11, 323–335. [Google Scholar] [CrossRef]
  12. Ou, J.Z.; Ge, W.; Carey, B.; Daeneke, T.; Rotbart, A.; Shan, W.; Wang, Y.; Fu, Z.; Chrimes, A.F.; Wlodarski, W.; et al. Physisorption-Based Charge Transfer in Two-Dimensional SnS2 for Selective and Reversible NO2 Gas Sensing. ACS Nano 2015, 9, 10313–10323. [Google Scholar] [CrossRef]
  13. Gu, D.; Liu, W.; Wang, J.; Yu, J.; Zhang, J.; Huang, B.; Rumyantseva, M.N.; Li, X. Au functionalized SnS2 nanosheets based chemiresistive NO2 sensors. Chemosensors 2022, 10, 165. [Google Scholar] [CrossRef]
  14. Gu, D.; Wang, X.; Liu, W.; Li, X.; Lin, S.; Wang, J.; Rumyantseva, M.N.; Gaskov, A.M.; Akbar, S.A. Visible-light activated room temperature NO2 sensing of SnS2 nanosheets based chemiresistive sensors. Sens. Actuators B Chem. 2020, 305, 127455. [Google Scholar] [CrossRef]
  15. Alsaif, A.; Field, M.R.; Murdoch, B.J.; Daeneke, T.; Latham, K.; Chrimes, A.F.; Zoolfakar, A.S.; Russo, S.P.; Ou, J.Z.; Kalantarzadeh, K. Substoichiometric two-dimensional molybdenum oxide flakes: A plasmonic gas sensing platform. Nanoscale 2014, 6, 12780–12791. [Google Scholar] [CrossRef] [PubMed]
  16. Bannov, A.; Prasek, J.; Zajickova, L. Investigation of pristine graphite oxide as room-temperature chemiresistive ammonia gas sensing material. Sensors 2017, 17, 320. [Google Scholar] [CrossRef]
  17. Kim, T.H.; Kim, Y.H.; Park, S.Y.; Kim, S.Y.; Jang, H.W. Two-dimensional transition metal disulfides for chemoresistive gas sensing: Perspective and challenges. Chemosensors 2017, 5, 15. [Google Scholar] [CrossRef] [Green Version]
  18. Neri, G. Thin 2D: The new dimensionality in gas sensing. Chemosensors 2017, 5, 21. [Google Scholar] [CrossRef] [Green Version]
  19. Sun, P.; Zhao, W.; Cao, Y.; Guan, Y.; Sun, Y.F.; Lu, G.Y. Porous SnO2 hierarchical nanosheets: Hydrothermal preparation, growth mechanism, and gas sensing properties. CrystEngComm 2011, 13, 3718–3724. [Google Scholar] [CrossRef]
  20. Zhou, Q.; Chen, W.G.; Li, J.; Tang, C.D.; Zhang, H. Nanosheet-assembled flower-like SnO2 hierarchical structures with enhanced gas-sensing performance. Mater. Lett. 2015, 161, 499–502. [Google Scholar] [CrossRef]
  21. Li, T.M.; Zeng, W.; Long, H.W.; Wang, Z.C. Nanosheet-assembled hierarchical SnO2 nanostructures for efficient gas-sensing applications. Sens. Actuators B Chem. 2016, 231, 120–128. [Google Scholar] [CrossRef]
  22. Guo, J.; Zhang, J.; Ju, D.X.; Xu, H.Y.; Cao, B.Q. Three-dimensional SnO2 microstructures assembled by porous nanosheets and their superior performance for gas sensing. Powder Technol. 2013, 250, 40–45. [Google Scholar] [CrossRef]
  23. Zhang, L.X.; Yin, Y.Y. Hierarchically mesoporous SnO2 nanosheets: Hydrothermal synthesis and highly ethanol-sensitive properties operated at low temperature. Sens. Actuators B 2013, 185, 594–601. [Google Scholar] [CrossRef]
  24. Chen, H.; Wang, Q.W.; Kou, C.L.; Sui, Y.M.; Zeng, Y.; Du, F. One-pot synthesis and improved sensing properties of hierarchical flowerlike SnO2 assembled from sheet and ultra-thin rod subunits. Sens. Actuators B Chem. 2014, 194, 447–453. [Google Scholar] [CrossRef]
  25. Lou, Z.; Wang, L.L.; Wang, R.; Fei, T.; Zhang, T. Synthesis and ethanol sensing properties of SnO2 nanosheets via a simple hydrothermal route. Solid-State Electron. 2012, 76, 91. [Google Scholar] [CrossRef]
  26. Zeng, W.; Wu, M.; Li, Y.; Wu, S. Hydrothermal synthesis of different SnO2 nanosheets with CO gas sensing properties. J. Mater. Sci. Mater. Electron. 2013, 24, 3701–3706. [Google Scholar] [CrossRef]
  27. Kakanakova-Georgieva, A.; Giannazzo, F.; Nicotra, G.; Cora, I.; Gueorguiev, G.K.; Persson, P.O.Å.; Pécz, B. Material proposal for 2D indium oxide. Appl. Surf. Sci. 2021, 548, 149275. [Google Scholar] [CrossRef]
  28. Dos Santos, R.B.; Rivelino, R.; Gueorguiev, G.K.; Kakanakova-Georgieva, A. Exploring 2D structures of indium oxide of different stoichiometry. CrystEngComm 2021, 23, 6661–6667. [Google Scholar] [CrossRef]
  29. Paolucci, V.; De Santis, J.; Lozzi, L.; Giorgi, G.; Cantalini, C. Layered amorphous a-SnO2 gas sensors by controlled oxidation of 2D-SnSe2. Sens. Actuators B Chem. 2022, 350, 130890. [Google Scholar] [CrossRef]
  30. Paolucci, V.; De-Santis, J.; Ricci, V.; Lozzi, L.; Giorgi, G.; Cantalini, C. Bidimensional Engineered Amorphous a-SnO2 Interfaces: Synthesis and Gas Sensing Response to H2S and Humidity. ACS Sens. 2022, 7, 2058–2068. [Google Scholar] [CrossRef]
  31. Domingo, G.; Itoga, K.S.; Kannewurf, C.K. Fundamental Optical Absorption in SnS2 and SnSe2. Phys. Rev. 1966, 143, 536–541. [Google Scholar] [CrossRef]
  32. Takeda, N.; Parkinson, B.A. Adsorption Morphology, Light Absorption, and Sensitization Yields for Squaraine Dyes on SnS2 Surfaces. J. Am. Chem. Soc. 2003, 125, 5559–5571. [Google Scholar] [CrossRef] [PubMed]
  33. Du, W.M.; Deng, D.H.; Han, Z.T.; Xiao, V.; Bian, V.; Qian, X.F. Hexagonal tin disulfide nanoplatelets: A new photocatalyst driven by solar light. CrystEngComm 2011, 13, 2071–2076. [Google Scholar] [CrossRef]
  34. Lei, Y.Q.; Song, S.Y.; Fan, W.Q.; Xing, Y.; Zhang, H.J. Facile Synthesis and Assemblies of Flowerlike SnS2 and In3+-Doped SnS2: Hierarchical Structures and Their Enhanced Photocatalytic Property. J. Phys. Chem. C 2009, 113, 1280–1285. [Google Scholar] [CrossRef]
  35. Shi, W.D.; Huo, L.H.; Wang, H.S.; Zhang, H.J.; Yang, J.H.; Wei, P.H. Hydrothermal growth and gas sensing property of flower-shaped SnS2 nanostructures. Nanotechnology 2006, 17, 2918–2924. [Google Scholar] [CrossRef]
  36. Zhai, C.X.; Du, N.; Zhang, H.; Yang, D.R. Large-scale synthesis of ultrathin hexagonal tin disulfide nanosheets with highly reversible lithium storage. Chem. Commun. 2011, 47, 1270–1272. [Google Scholar] [CrossRef]
  37. Kim, T.J.; Kim, C.; Son, D.; Choi, M.; Park, B. Novel SnS2-nanosheet anodes for lithium-ion batteries. J. Power Sources 2007, 167, 529–535. [Google Scholar] [CrossRef]
  38. Seo, J.W.; Jang, J.T.; Park, S.W.; Kim, C.J.; Park, B.W.; Cheon, J.W. Two-Dimensional SnS2 Nanoplates with Extraordinary High Discharge Capacity for Lithium Ion Batteries. Adv. Mater. 2008, 20, 4269–4273. [Google Scholar] [CrossRef]
  39. Mead, D.G.; Irwin, J.C. Raman spectra of SnS2 and SnSe2. Solid State Commun. 1976, 20, 885–887. [Google Scholar] [CrossRef]
  40. Smith, A.J.; Meek, P.E.; Liang, W.Y. Raman scattering studies of SnS2 and SnSe2. J. Phys. C Solid State Phys. 1977, 10, 1321–1333. [Google Scholar] [CrossRef]
  41. Gonzales, J.M.; Oleynik, I.I. Layer-dependent properties of SnS2 and SnSe2 two-dimensional materials. Phys. Rev. B 2016, 94, 125443. [Google Scholar] [CrossRef] [Green Version]
  42. Abello, L.; Bochu, B.; Gaskov, A.; Koudryavtseva, S.; Lucazeau, G.; Rumyantseva, M. Structural characterization of nanocrystalline SnO2 by X-Ray and Raman Spectroscopy. J. Solid State Chem. 1988, 135, 78–85. [Google Scholar] [CrossRef]
  43. Socrates, G. Infrared and Raman Characteristic Group Frequencies: Tables and Charts, 3rd ed.; John Wiley & Sons Ltd.: West Sussex, UK, 2001. [Google Scholar]
  44. Diéguez, A.; Romano-Rodrìguez, A.; Vilà, A.; Morante, J.R. The complete Raman spectrum of nanometric SnO2 particles. J. Appl. Phys. 2001, 90, 1550–1557. [Google Scholar] [CrossRef] [Green Version]
  45. Nakamoto, K. Infrared and Raman Spectra of Inorganic and Coordination Compounds. Part A: Theory and Applications in Inorganic Chemistry, 6th ed.; John Wiley & Sons, Inc.: Hoboken, NJ, USA, 2009. [Google Scholar]
  46. Barsan, N.; Weimar, U. Conduction Model of Metal Oxide Gas Sensors. J. Electroceramics 2001, 7, 143–167. [Google Scholar] [CrossRef]
  47. Marikutsa, A.; Rumyantseva, M.; Konstantinova, E.; Gaskov, A. The key role of active sites in the development of selective metal oxide sensor materials. Sensors 2021, 21, 2554. [Google Scholar] [CrossRef]
  48. Henrich, V.E.; Cox, P.A. The Surface Science of Metal Oxides; Cambridge University Press: Cambridge, UK, 1994. [Google Scholar]
  49. Marikutsa, A.; Sukhanova, A.; Rumyantseva, M.; Gaskov, A. Acidic and catalytic co-functionalization for tuning the sensitivity of sulfated tin oxide modified by ruthenium oxide to ammonia gas. Sens. Actuators B Chem. 2018, 255, 3523–3532. [Google Scholar] [CrossRef]
  50. Prasad, A.K.; Kubinski, D.J.; Gouma, P.I. Comparison of sol–gel and ion beam deposited MoO3 thin film gas sensors for selective ammonia detection. Sens. Actuators B Chem. 2003, 93, 25–30. [Google Scholar] [CrossRef]
  51. Korotcenkov, G.; Brinzari, V.; Golovanov, V.; Cerneavschi, A.; Matolin, V.; Todd, A. Acceptor-like behavior of reducing gases on the surface of n-type In2O3. Appl. Surf. Sci. 2004, 227, 122–131. [Google Scholar] [CrossRef]
  52. Epifani, M.; Prades, J.D.; Comini, E.; Cirera, A.; Siciliano, P.; Faglia, G.; Morante, J.R. Chemoresistive sensing of light alkanes with SnO2 nanocrystals: A DFT-based insight. Phys. Chem. Chem. Phys. 2009, 11, 3634–3639. [Google Scholar] [CrossRef]
  53. Brunet, E.; Maier, T.; Mutinati, G.C.; Steinhauer, S.; Köck, A.; Gspan, C.; Grogger, W. Comparison of the gas sensing performance of SnO2 thin film and SnO2 nanowire sensors. Sens. Actuators B Chem. 2012, 165, 110–118. [Google Scholar] [CrossRef]
  54. Garshev, A.; Ivanov, V.; Krotova, A.; Filatova, D.; Konstantinova, E.; Naberezhnyi, D.; Khmelevsky, N.; Marikutsa, A.; Kots, P.; Smirnov, A.; et al. Enhancement of lewis acidity of Cr-doped nanocrystalline SnO2 and its effect on surface NH3 oxidation and the sensory detection pattern. ChemPhysChem 2019, 20, 1985–1996. [Google Scholar] [CrossRef] [PubMed]
  55. Galatsis, K.; Cukrov, L.; Wlodarski, W.; McCormick, P.; Kalantar-zadeh, K.; Comini, E.; Sberveglieri, G. p- and n-type Fe-doped SnO2 gas sensors fabricated by the mechanochemical processing technique. Sens. Actuators B Chem. 2003, 93, 562–565. [Google Scholar] [CrossRef]
  56. Kutukov, P.; Rumyantseva, M.; Krivetskiy, V.; Filatova, D.; Batuk, M.; Hadermann, J.; Khmelevsky, N.; Aksenenko, A.; Gaskov, A. Influence of Mono- and Bimetallic PtOx, PdOx, PtPdOx Clusters on CO Sensing by SnO2 Based Gas Sensors. Nanomaterials 2018, 8, 917. [Google Scholar] [CrossRef] [PubMed] [Green Version]
  57. Vorobyeva, N.; Rumyantseva, M.; Konstantinova, E.; Grishina, D.; Gaskov, A. Inversion of NH3 sensor signal and paramagnetic centers of nanocrystalline ZnO(Ga). Procedia Eng. 2011, 25, 296–299. [Google Scholar] [CrossRef] [Green Version]
  58. Shekunova, T.O.; Baranchikov, A.E.; Yapryntsev, A.D.; Rudakovskaya, P.G.; Ivanova, O.S.; Karavanova, Y.A.; Kalinina, M.A.; Rumyantseva, M.N.; Dorofeev, S.G.; Ivanov, V.K. Ultrasonic disintegration of tungsten trioxide pseudomorphs after ammonium paratungstate as a route for stable aqueous sols of nanocrystalline WO3. J. Mater. Sci. 2018, 53, 1758–1768. [Google Scholar] [CrossRef]
  59. Wu, Y.-Q.; Hu, M.; Wei, X.-Y. A study of transition from n- to p-type based on hexagonal WO3 nanorods sensor. Chin. Phys. B 2014, 23, 40704. [Google Scholar] [CrossRef]
  60. Kim, I.-D.; Rothschild, A.; Lee, B.H.; Kim, D.Y.; Jo, S.M.; Tuller, H.L. Ultrasensitive Chemiresistors Based on Electrospun TiO2 Nanofibers. Nano Lett. 2006, 6, 2009–2013. [Google Scholar] [CrossRef]
  61. Gurlo, A.; Sahm, M.; Oprea, A.; Barsan, N.; Weimar, U. A p- to n-transition on α-Fe2O3-based thick film sensors studied by conductance and work function change measurements. Sens. Actuators B Chem. 2004, 102, 291–298. [Google Scholar] [CrossRef]
  62. Vladimirova, S.; Krivetskiy, V.; Rumyantseva, M.; Gaskov, A.; Mordvinova, N.; Lebedev, O.; Martyshov, M.; Forsh, P. Co3O4 as p-type material for CO sensing in humid air. Sensors 2017, 17, 2216. [Google Scholar] [CrossRef] [Green Version]
  63. Pearce, R.; Iakimov, T.; Andersson, M.; Hultman, L.; Lloyd Spetz, A.; Yakimova, R. Epitaxially grown graphene based gas sensors for ultra sensitive NO2 detection. Sens. Actuators B Chem. 2011, 155, 451–455. [Google Scholar] [CrossRef]
  64. Jaaniso, R.; Kahro, T.; Kozlova, J.; Aarik, J.; Aarik, L.; Alles, H.; Floren, A.; Gerst, A.; Kasikov, A.; Niilisk, A.; et al. Temperature induced inversion of oxygen response in CVD graphene on SiO2. Sens. Actuators B Chem. 2014, 190, 1006–1013. [Google Scholar] [CrossRef] [Green Version]
  65. Behi, S.; Bohli, N.; Casanova-Cháfer, J.; Llobet, E.; Abdelghani, A. Metal Oxide Nanoparticle-Decorated Few Layer Graphene Nanoflake Chemoresistors for the Detection of Aromatic Volatile Organic Compounds. Sensors 2020, 20, 3413. [Google Scholar] [CrossRef] [PubMed]
  66. Yang, L.; Marikutsa, A.; Rumyantseva, M.; Konstantinova, E.; Khmelevsky, N.; Gaskov, A. Quasi similar routes of NO2 and NO sensing by nanocrystalline WO3: Evidence by in situ DRIFT spectroscopy. Sensors 2019, 19, 3405. [Google Scholar] [CrossRef] [PubMed] [Green Version]
  67. Zhang, Z.; Chen, L.; Li, Z.; Li, P.; Yuan, F.; Niu, X.; Zhu, Y. Activity and SO2 resistance of amorphous CeaTiOx catalysts for the selective catalytic reduction of NO with NH3: In situ DRIFT studies. Catal. Sci. Technol. 2016, 6, 7151. [Google Scholar] [CrossRef]
  68. Zhou, G.; Zhong, B.; Wang, W.; Guan, X.; Huang, B.; Ye, D.; Wu, H. In situ DRIFTS study of NO reduction by NH3 over Fe–Ce–Mn/ZSM-5 catalysts. Catal. Today 2011, 175, 157–163. [Google Scholar] [CrossRef]
  69. Hadjiivanov, K.I. Identification of neutral and charged NxOy surface species by IR spectroscopy. Catal. Rev. Sci. Eng. 2000, 42, 71–144. [Google Scholar] [CrossRef]
  70. Wang, D.; Zhang, L.; Kamasamudram, K.; Epling, W.S. In Situ-DRIFTS Study of Selective Catalytic Reduction of NOx by NH3 over Cu-Exchanged SAPO-34. ACS Catal. 2013, 3, 871–881. [Google Scholar] [CrossRef]
  71. Ramis, G.; Yi, L.; Busca, G.; Turco, M.; Kotur, E.; Willey, R.J. Adsorption, Activation, and Oxidation of Ammonia over SCR Catalysts. J. Catal. 1995, 157, 523–535. [Google Scholar] [CrossRef]
  72. Hadjiivanov, K.; Avreyska, V.; Klissurski, D.; Marinova, T. Surface Species Formed after NO Adsorption and NO + O2 Coadsorption on ZrO2 and Sulfated ZrO2: An FTIR Spectroscopic Study. Langmuir 2002, 18, 1619–1625. [Google Scholar] [CrossRef]
Figure 1. TG curve and temperature dependencies of ionic current for m/z = 18 (H2O), 30 (NO), 44 (CO2), 64 (SO2) for SnS2 oxidation in air.
Materials 15 08213 g001
Figure 2. SEM image of alumina substrate with Pt contacts: (a) bare substrate, (b) covered with 2D SnO2.
Materials 15 08213 g002
Figure 3. TEM images of SnS2 nanosheets before (ac) and after (d) oxidation at 500 °C. Inset shows the electron-diffraction pattern.
Materials 15 08213 g003
Figure 4. SEM images of SnS2 nanosheets before (a) and after (b) oxidation at 500 °C.
Materials 15 08213 g004
Figure 5. X-ray diffraction patterns of SnS2 nanosheets and 2D SnO2 powder.
Materials 15 08213 g005
Figure 6. Raman spectra of SnS2 (a) and 2D SnO2 (b) samples.
Materials 15 08213 g006
Figure 7. XP-spectra of SnS2 and 2D SnO2.
Materials 15 08213 g007
Figure 8. FTIR spectra of SnS2 and 2D SnO2 samples.
Materials 15 08213 g008
Figure 9. Temperature dependencies of the dynamic-sensor response of 2D SnO2 when detecting 20 ppm CO (a) and 20 ppm NH3 (b) in dry air (RH25 = 0%).
Materials 15 08213 g009
Figure 10. Temperature dependencies of 2D SnO2 sensor response when detecting 20 ppm CO (a) and 20 ppm NH3 (b) in dry (RH25 = 0%) and humid (RH25 = 30%) air.
Materials 15 08213 g010
Figure 11. In situ DRIFT spectra of 2D SnO2 (a) in dry (RH25 = 0%) and (b) in humid (RH25 = 30%) air containing 100 ppm NH3 at temperatures of 200 °C (blue line) and 350 °C (red line).
Materials 15 08213 g011
Table 1. Assignments of IR bands and Raman vibrational modes (cm−1).
SampleIR Band/Region,
cm−1
AssignmentRaman Shift,
cm−1
Assignment
SnS2400–800ν (Sn-S) + ν (Sn-O)230Eg
970, 1130ν (C-O)317A1g
1372νs (COO)
1462, 2852, 2924ν (C-H)
1534νas (COO)
1633ν (C=O)
2955ν (=C-H)
2D SnO2400–800ν (Sn-O)110.5B1g
970, 1048, 1122ν (SO42−)270IR Eu
1255δ (CH2)513.5Eg
1400νs (COO)564.8surface mode
1626δ (H2O) + ν (C=O)627A1g
1728ν (C=O)851.7B2g
2850–3700“free” OH groups997.5ν (C-C)
1282.6δ (CH2)
1609.6ν (C=O)
1727.7ν (C=C)
Table 2. Assignments of IR absorption bands (cm−1) appeared in DRFIT spectra on the surface of 2D SnO2 in dry (RH25 = 0%) and in humid (RH25 = 30%) air containing 100 ppm NH3 at 200 °C and 350 °C.
Functional Groups200 °C350 °C
RH25 = 0%RH25 = 30%RH25 = 0%RH25 = 30%
NH3+ on Lewis acid site1258124612681260
chelating bidentate nitrate (NO3) or nitrite (NO2)--13101309
SO2 in (-SO2∙NH-) or SO42−1368135213851378
NH4+ on Brønsted acid site14761460--
δ(H2O)16201625-1625
ν(N-H) in NH4+3046304230463042
ν(N-H) in NH33185, 32803184, 32703190, 32803189, 3278
ν(OH)3330–37703330–37803330–37303330–3780
Publisher’s Note: MDPI stays neutral with regard to jurisdictional claims in published maps and institutional affiliations.

