

Microstructural Control Strategy Based on Optimizing Laser Powder Bed Fusion for Different Hastelloy X Powder Size


Abstract
:1. Introduction
2. Materials and Experimental Procedures
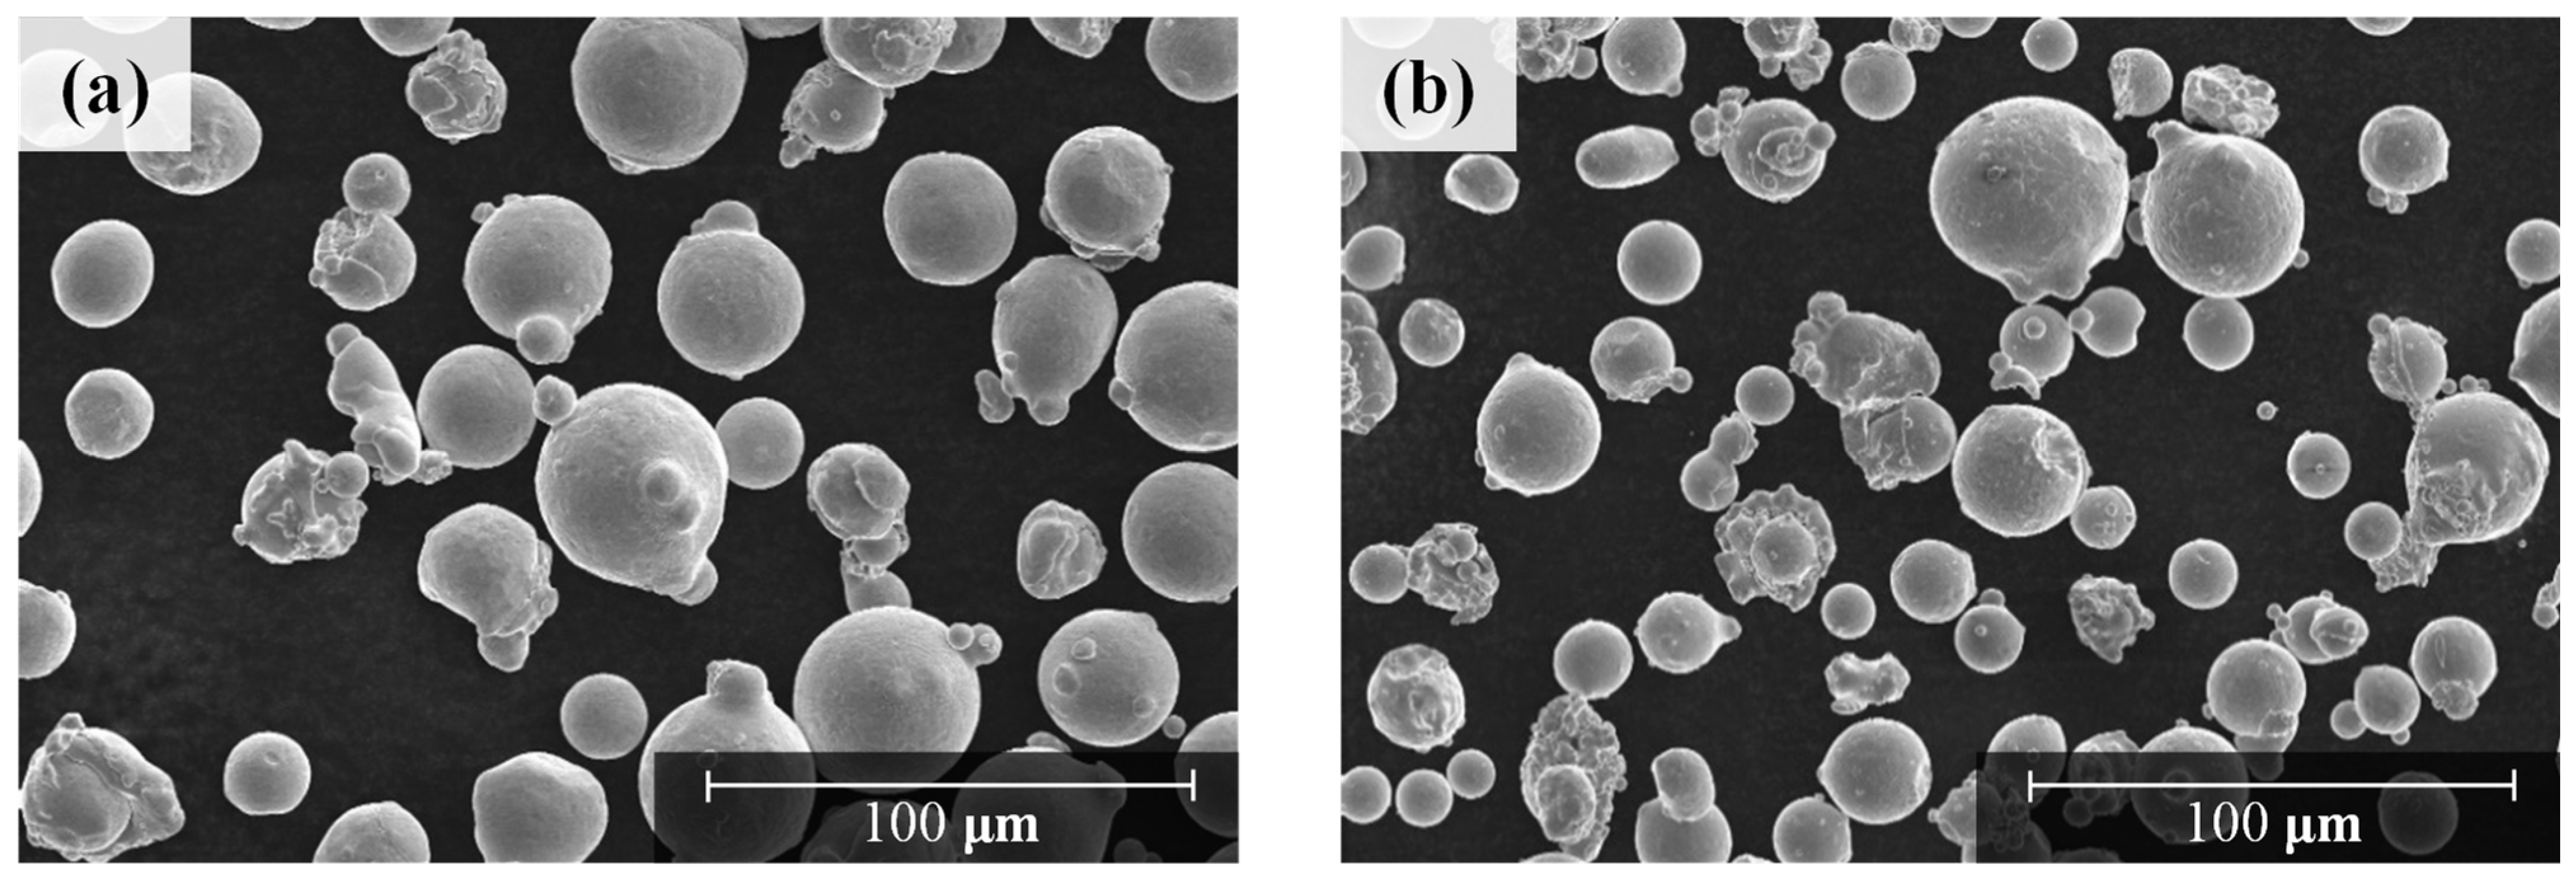
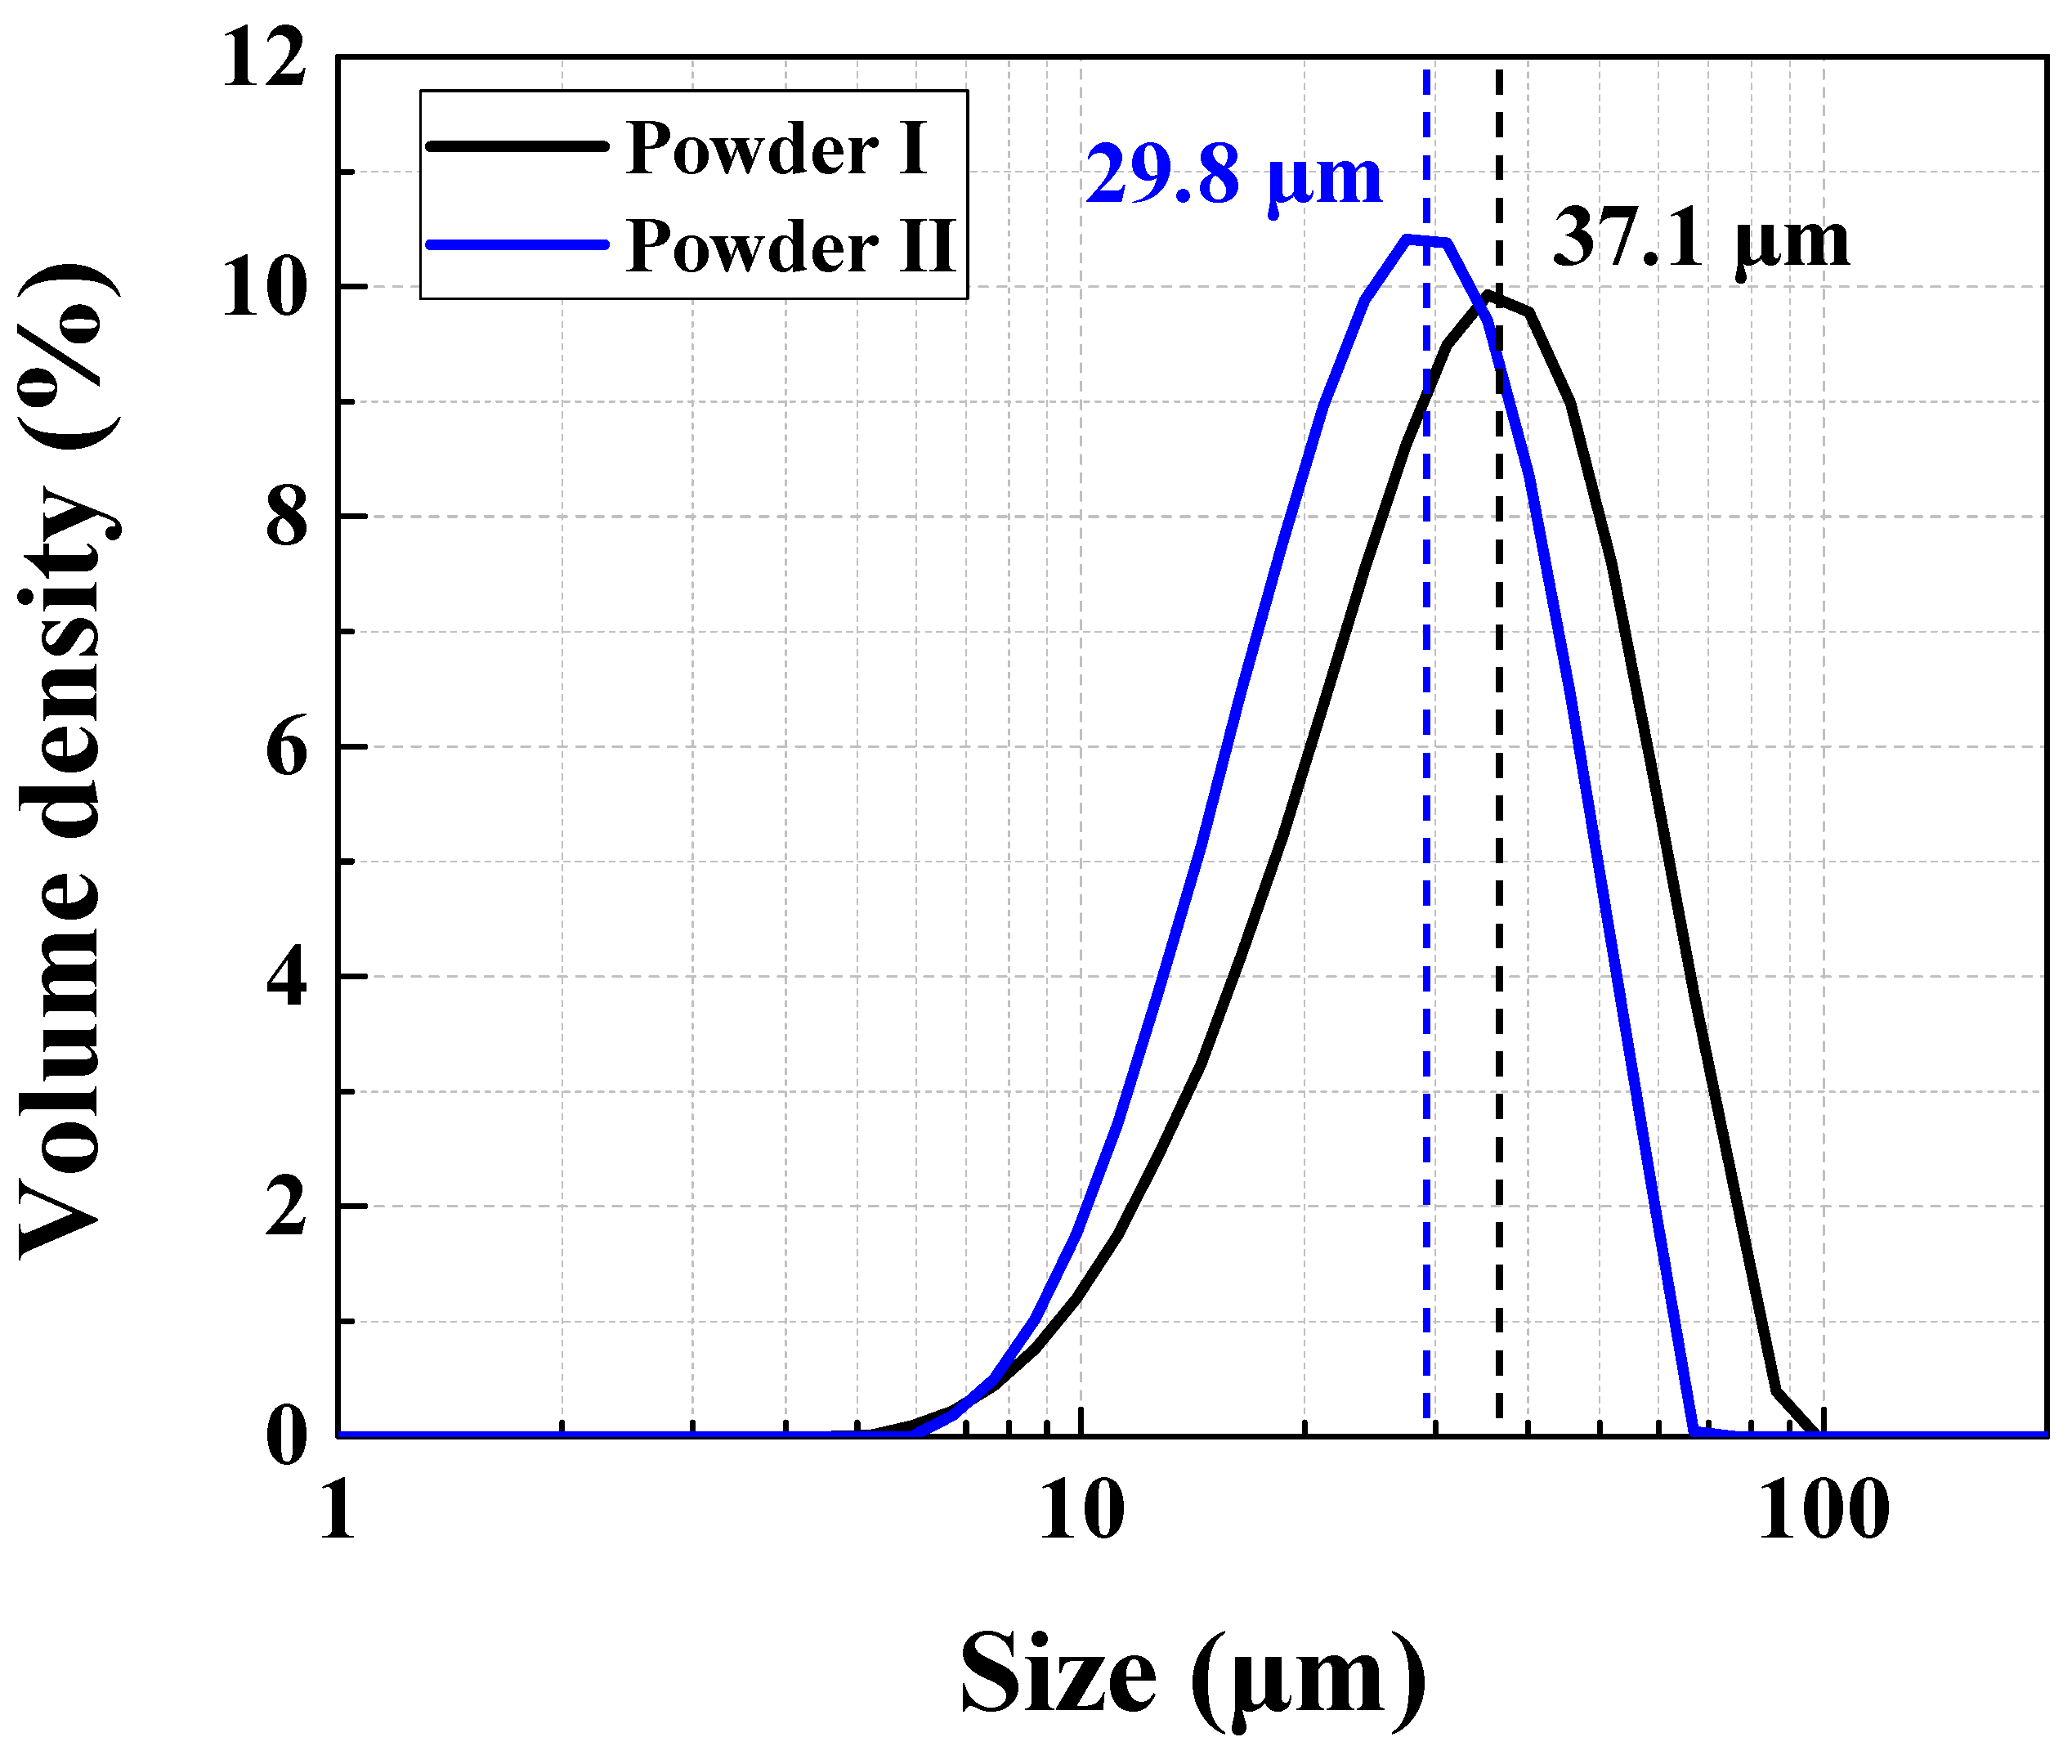
2.1. Material
Hastelloy X Powder Size Distribution and Chemical Composition
2.2. Experimental Procedures
2.2.1. Specimens Prepared by Powder Bed Fusion Method
- Laser beam power: 120–260 W,
- Layer thickness: 30 μm,
- Laser scanning speed: 100–500 mm/s,
- Laser scanline spacing: 115 μm.
2.2.2. Microstructure Observation
2.2.3. Tests for Mechanical Properties
3. Results and Discussion
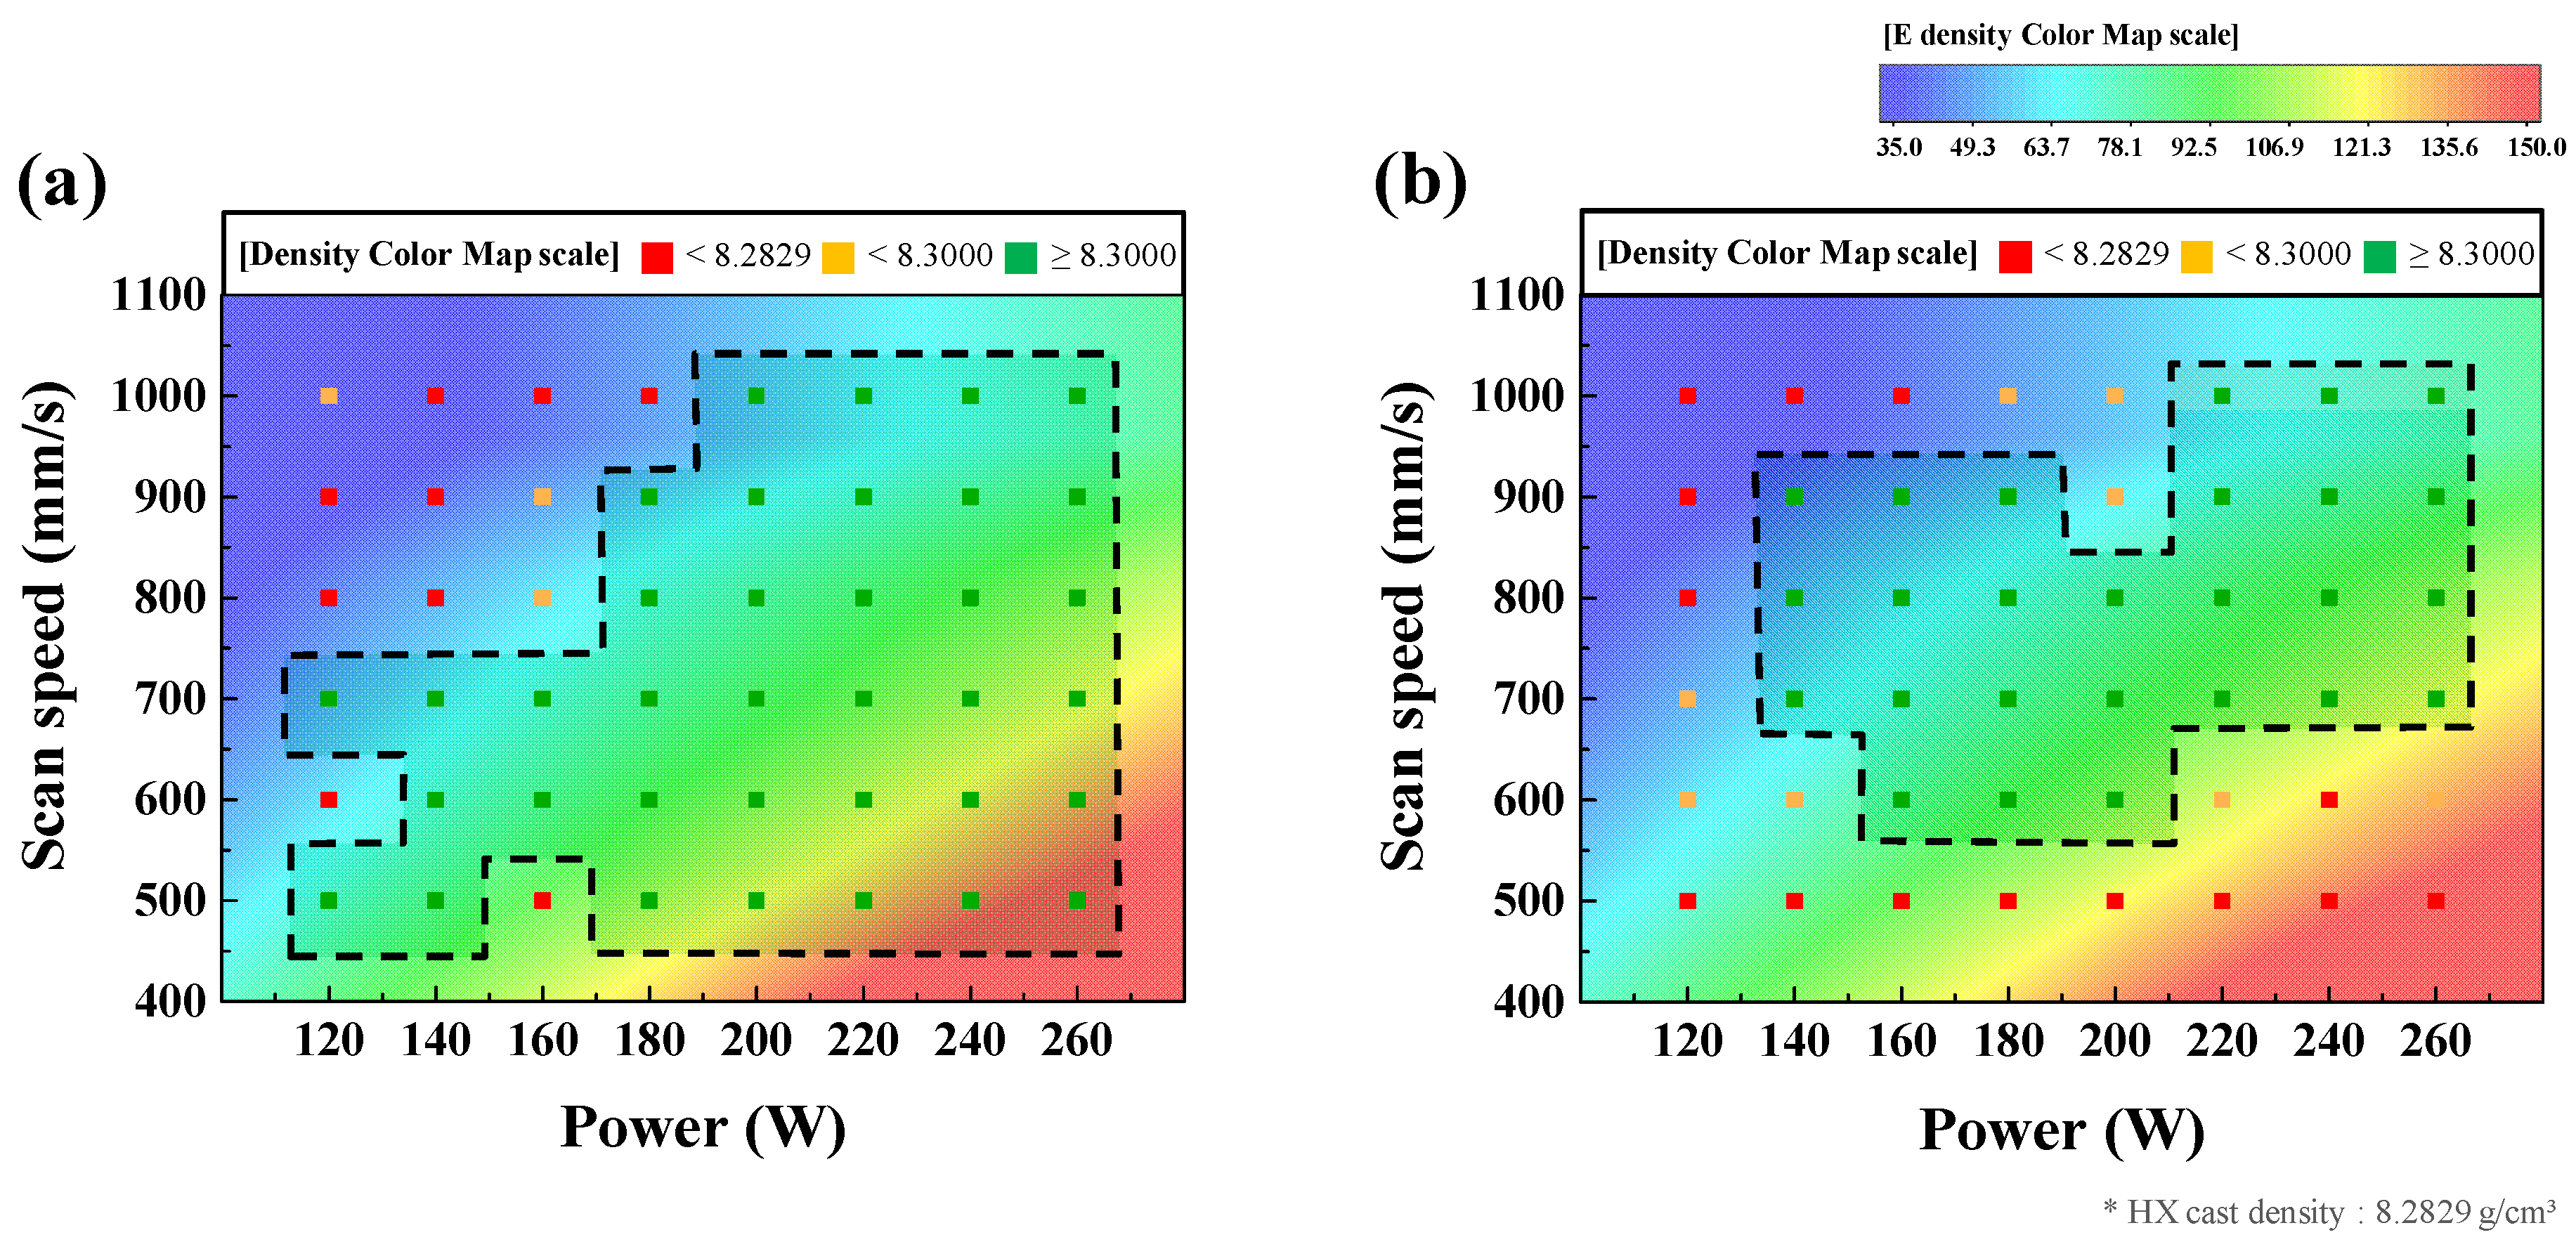
3.1. Laser Powder Bed Fusion (LPBF) Process Optimization
- High density and low surface porosity: strong mechanical properties by reducing internal defects,
- Low surface roughness: high dimensional accuracy of specimens.
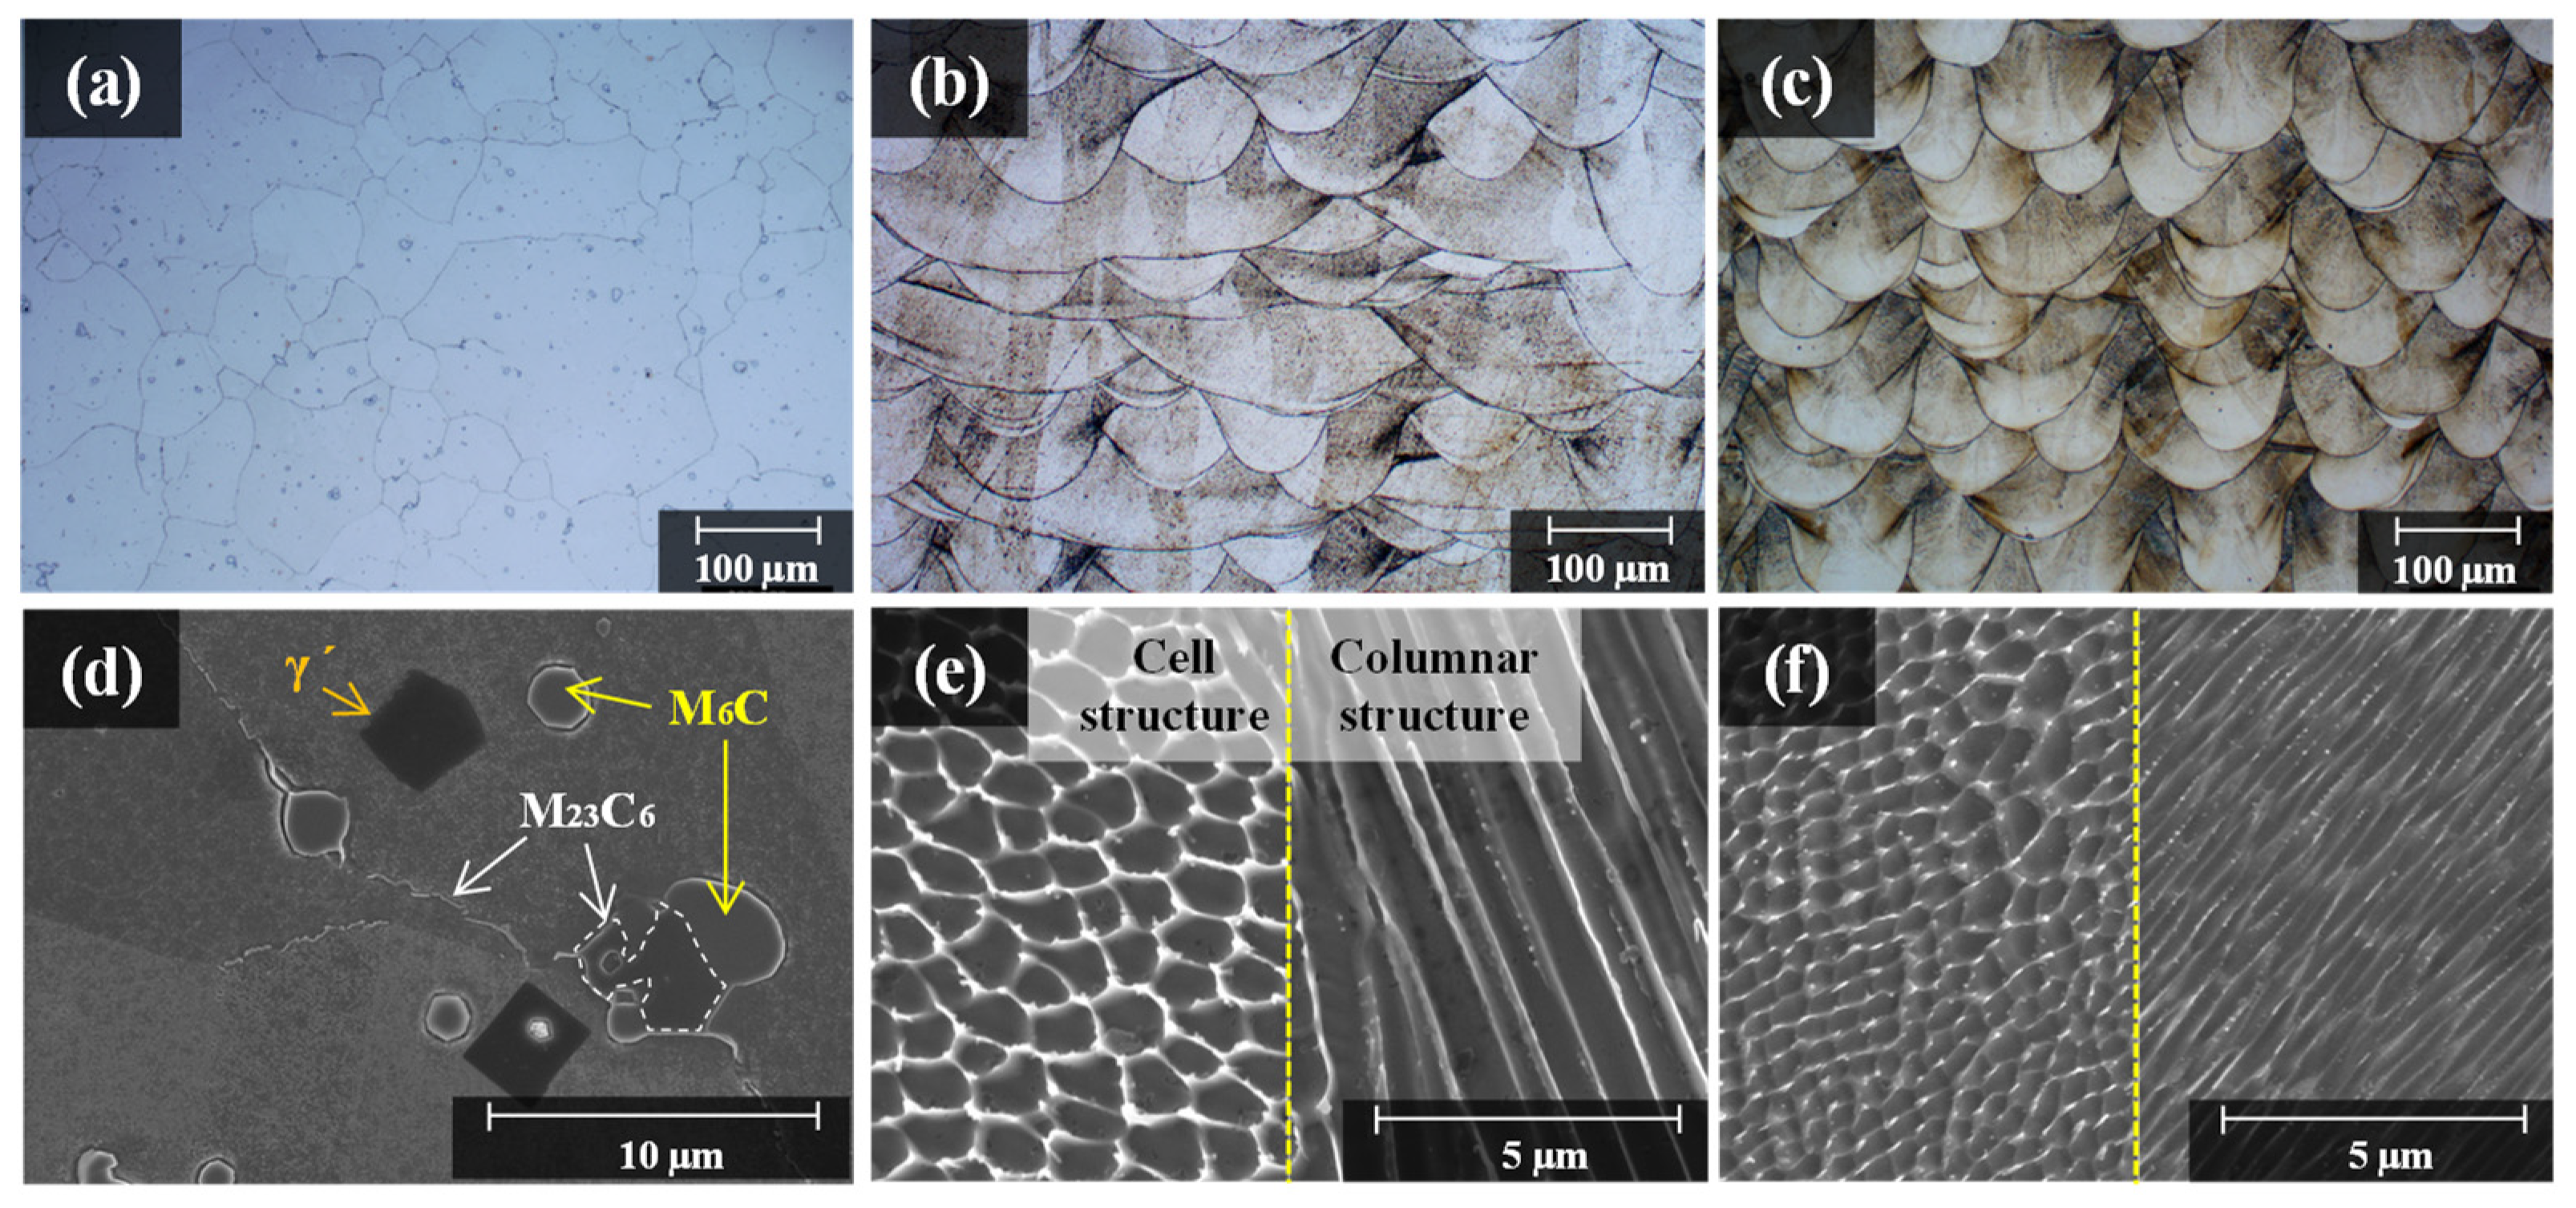
3.2. Microstructure of As-Built and Cast Hastelloy X Alloy
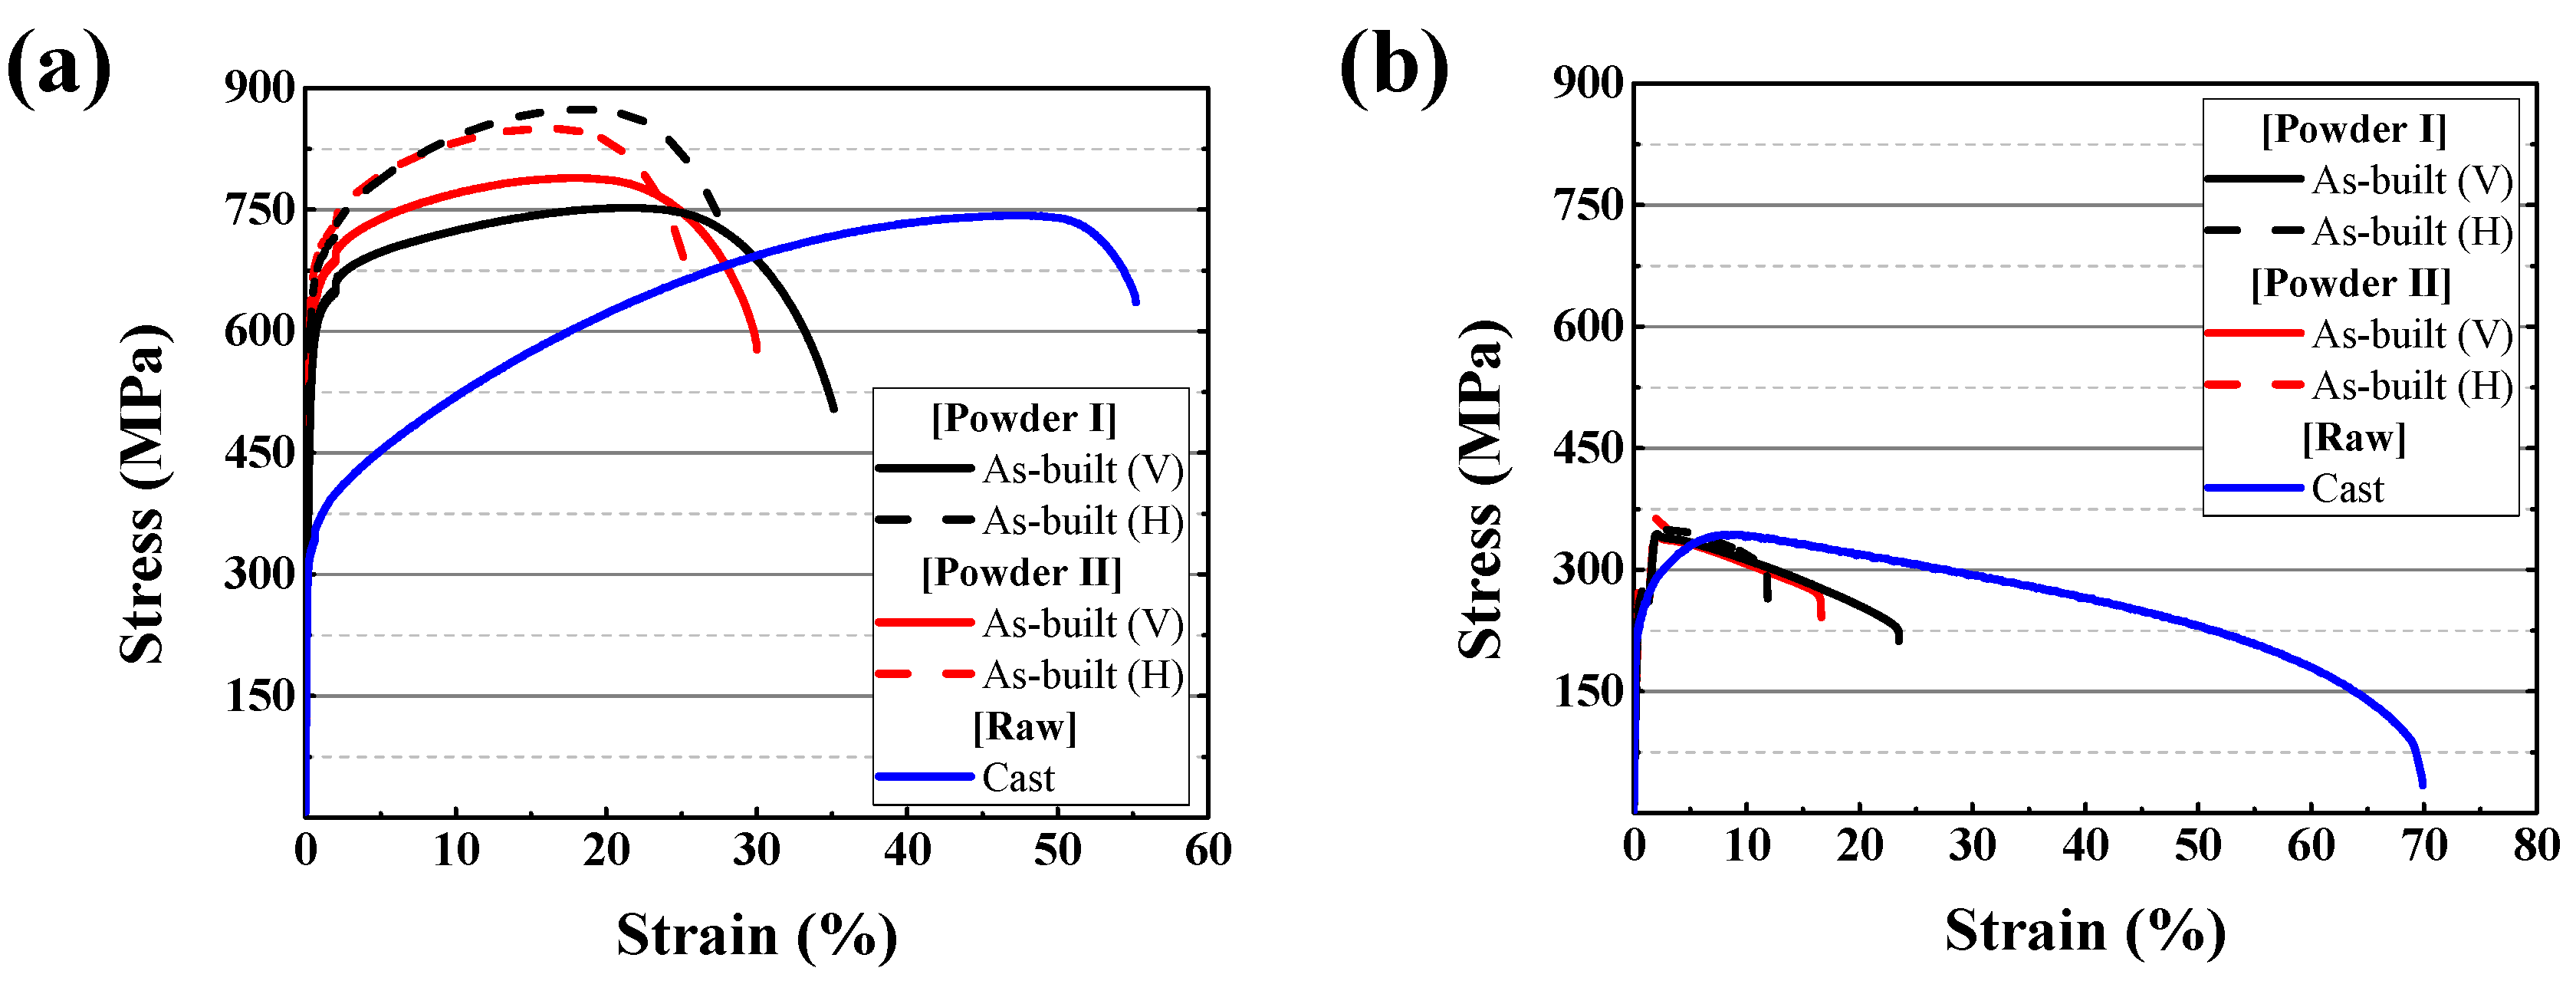
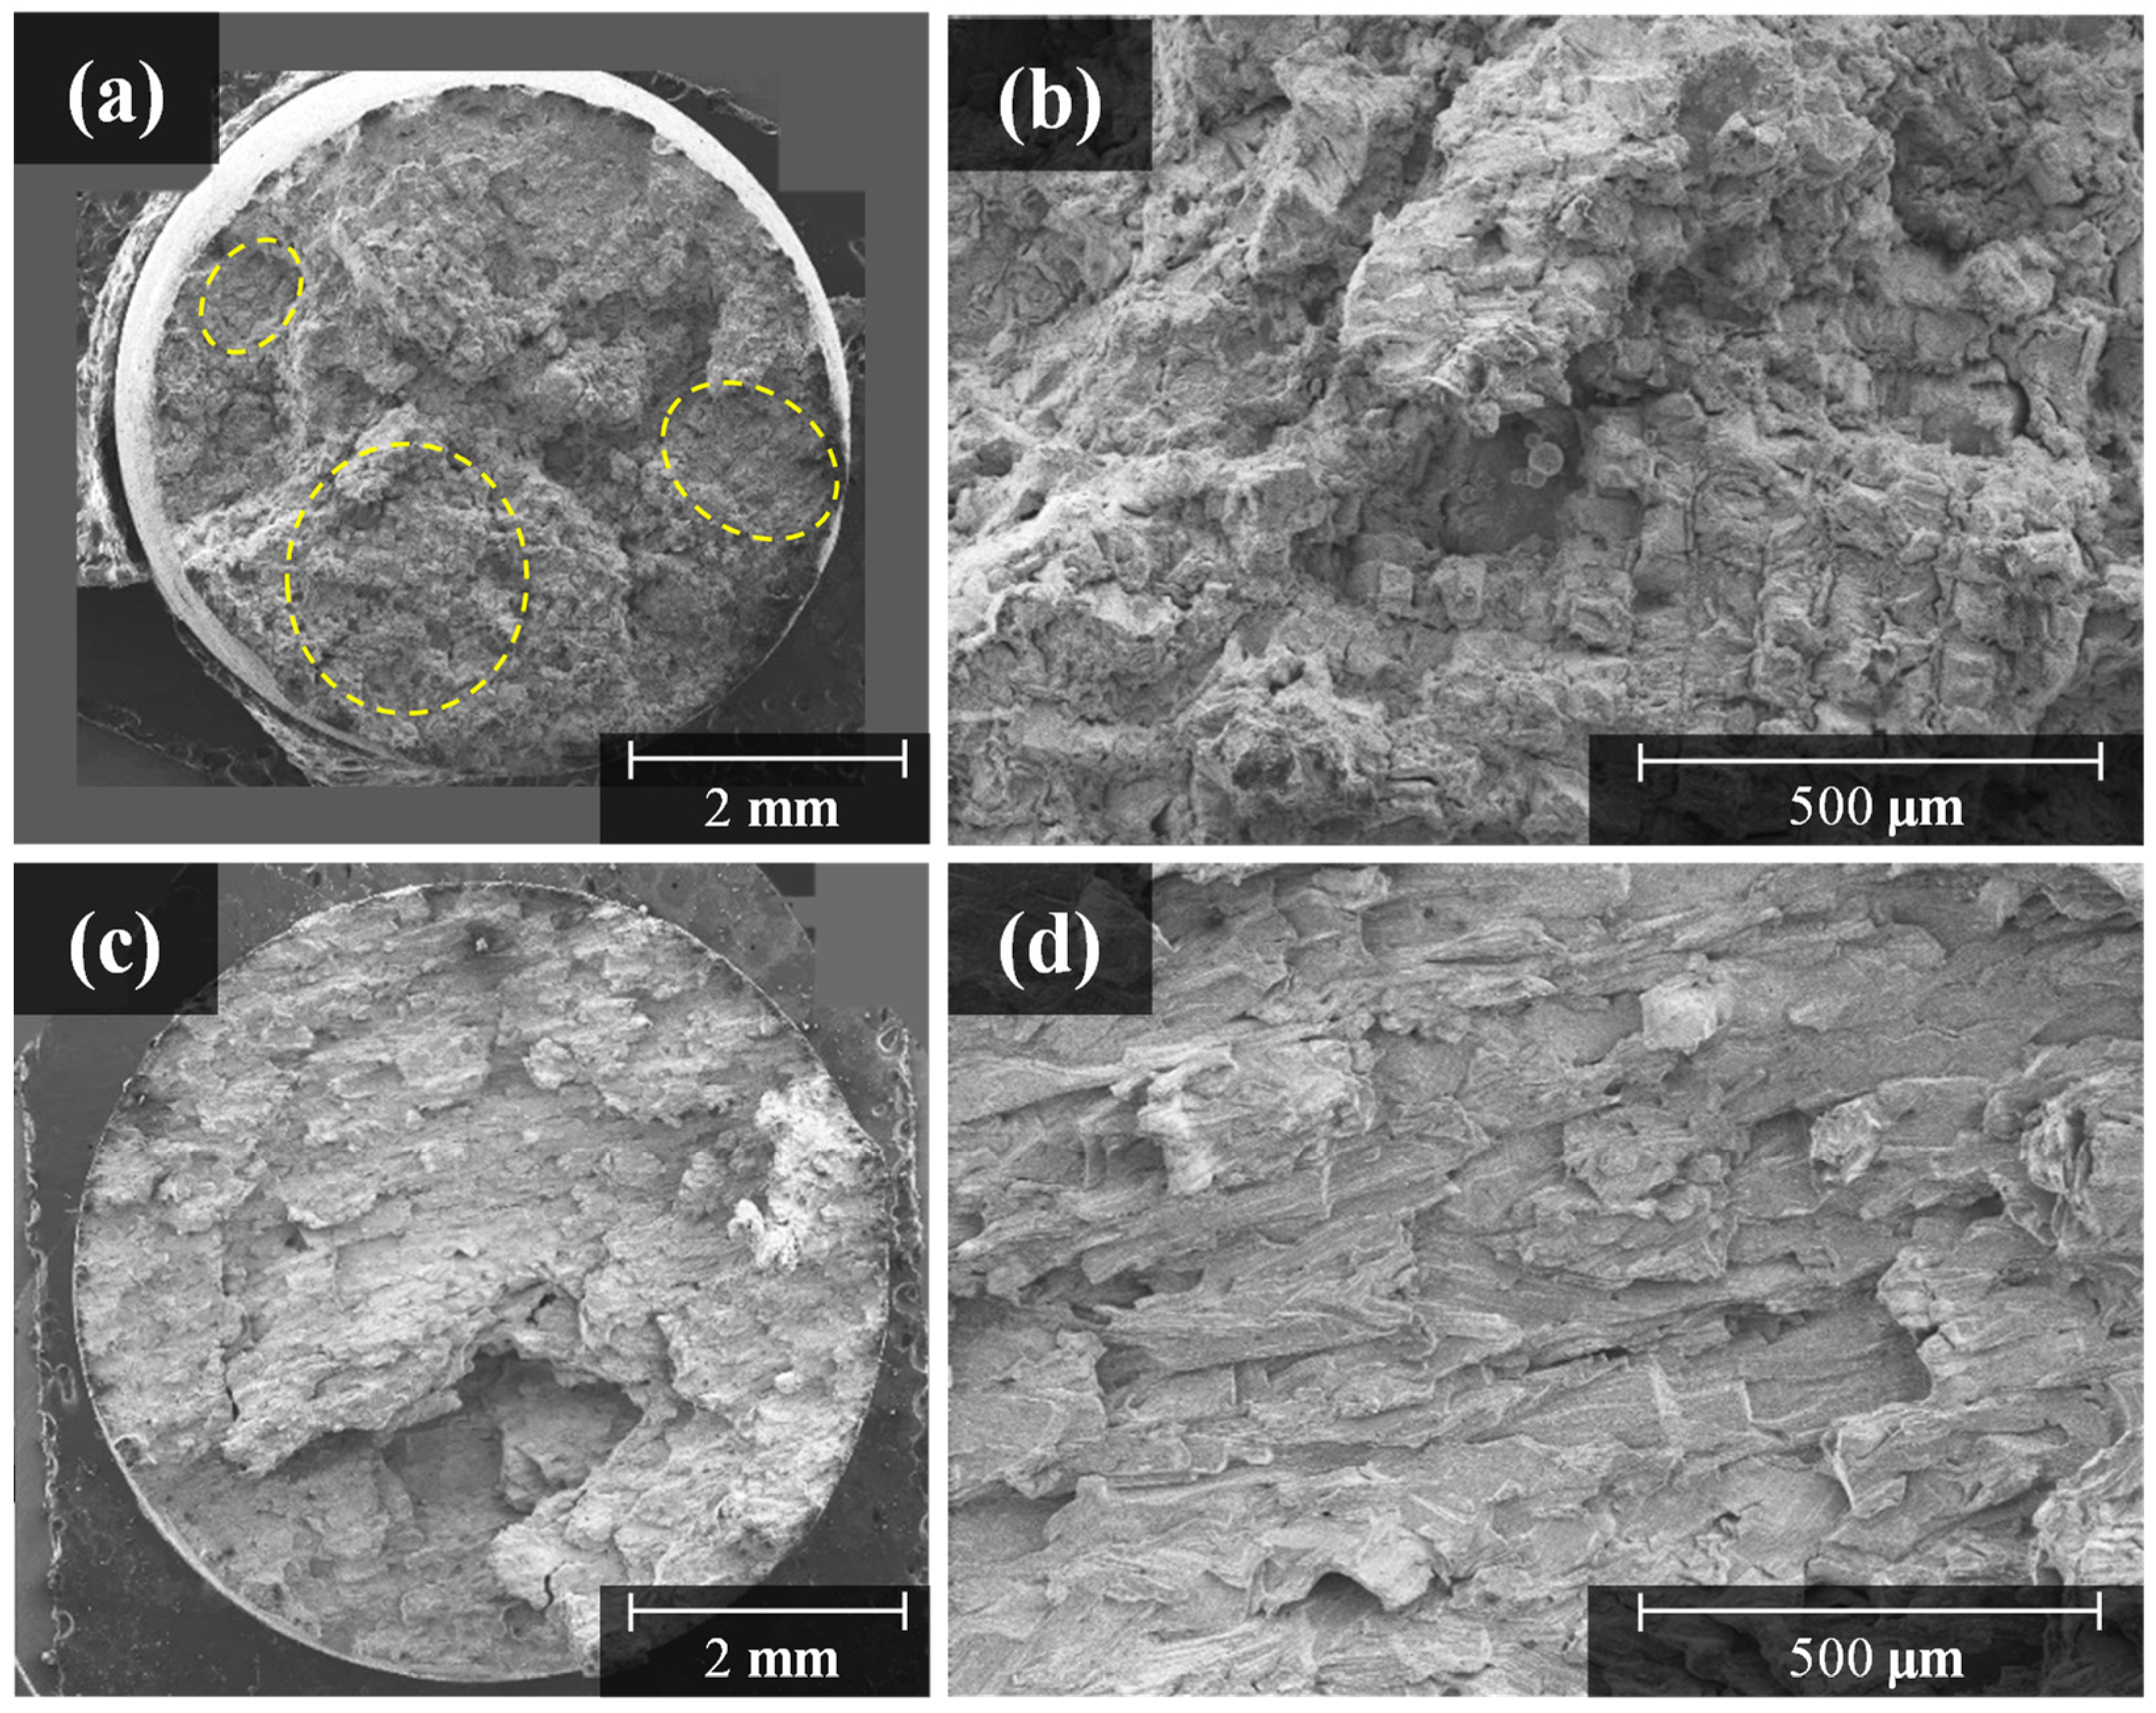
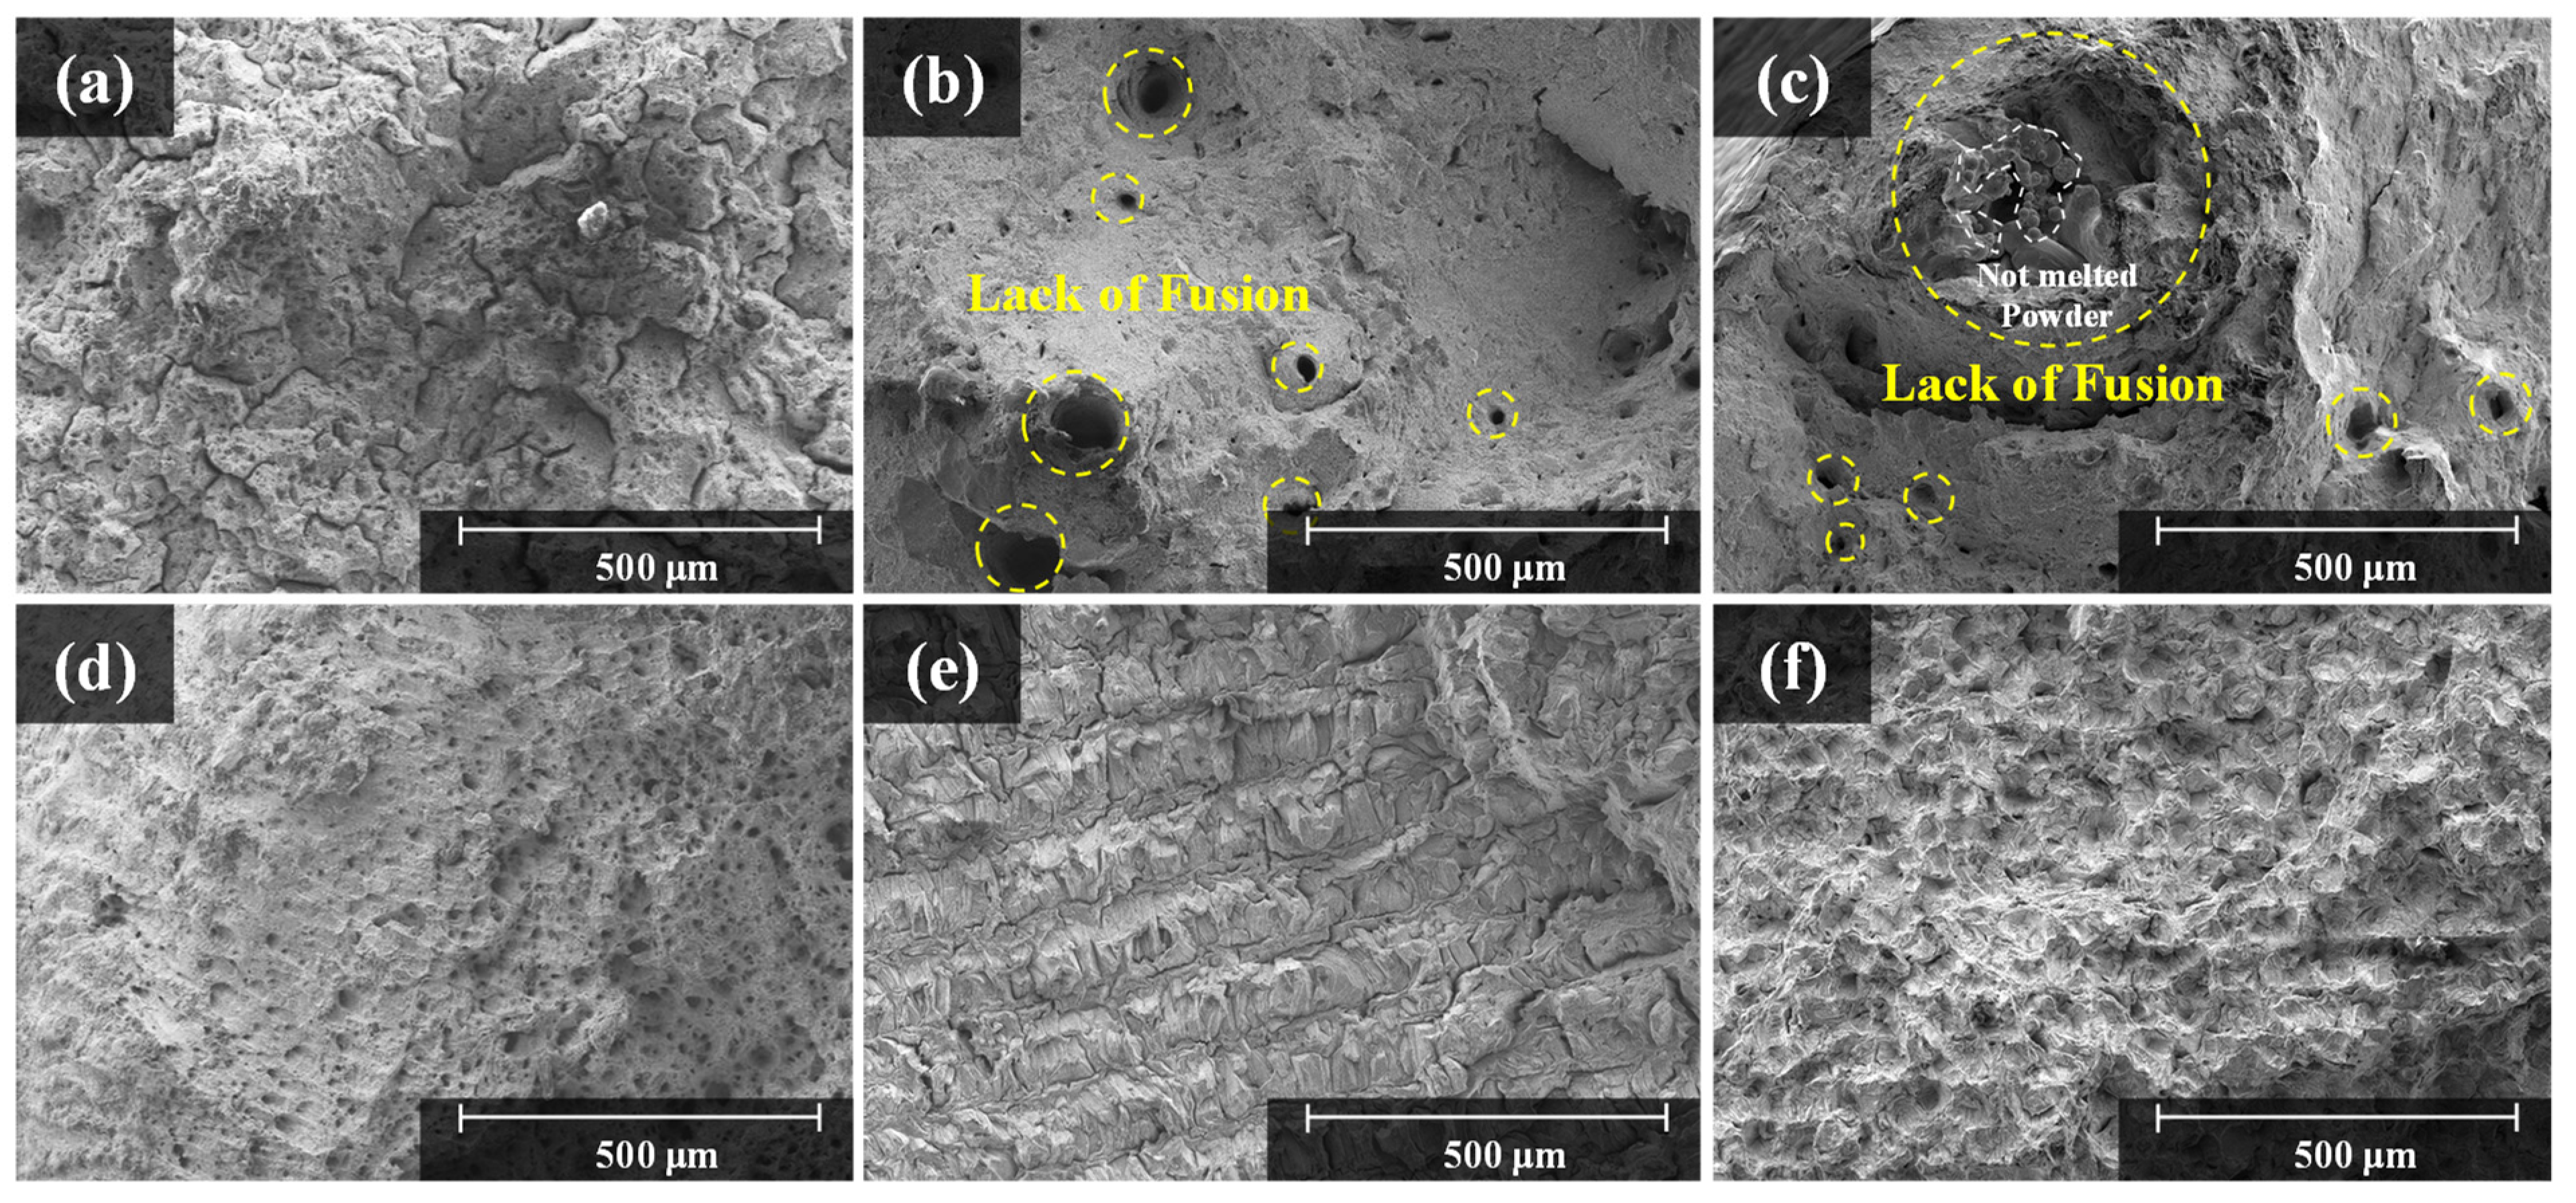
3.3. Mechanical Property Investigation of As-Built and Cast Hastelloy X Alloy
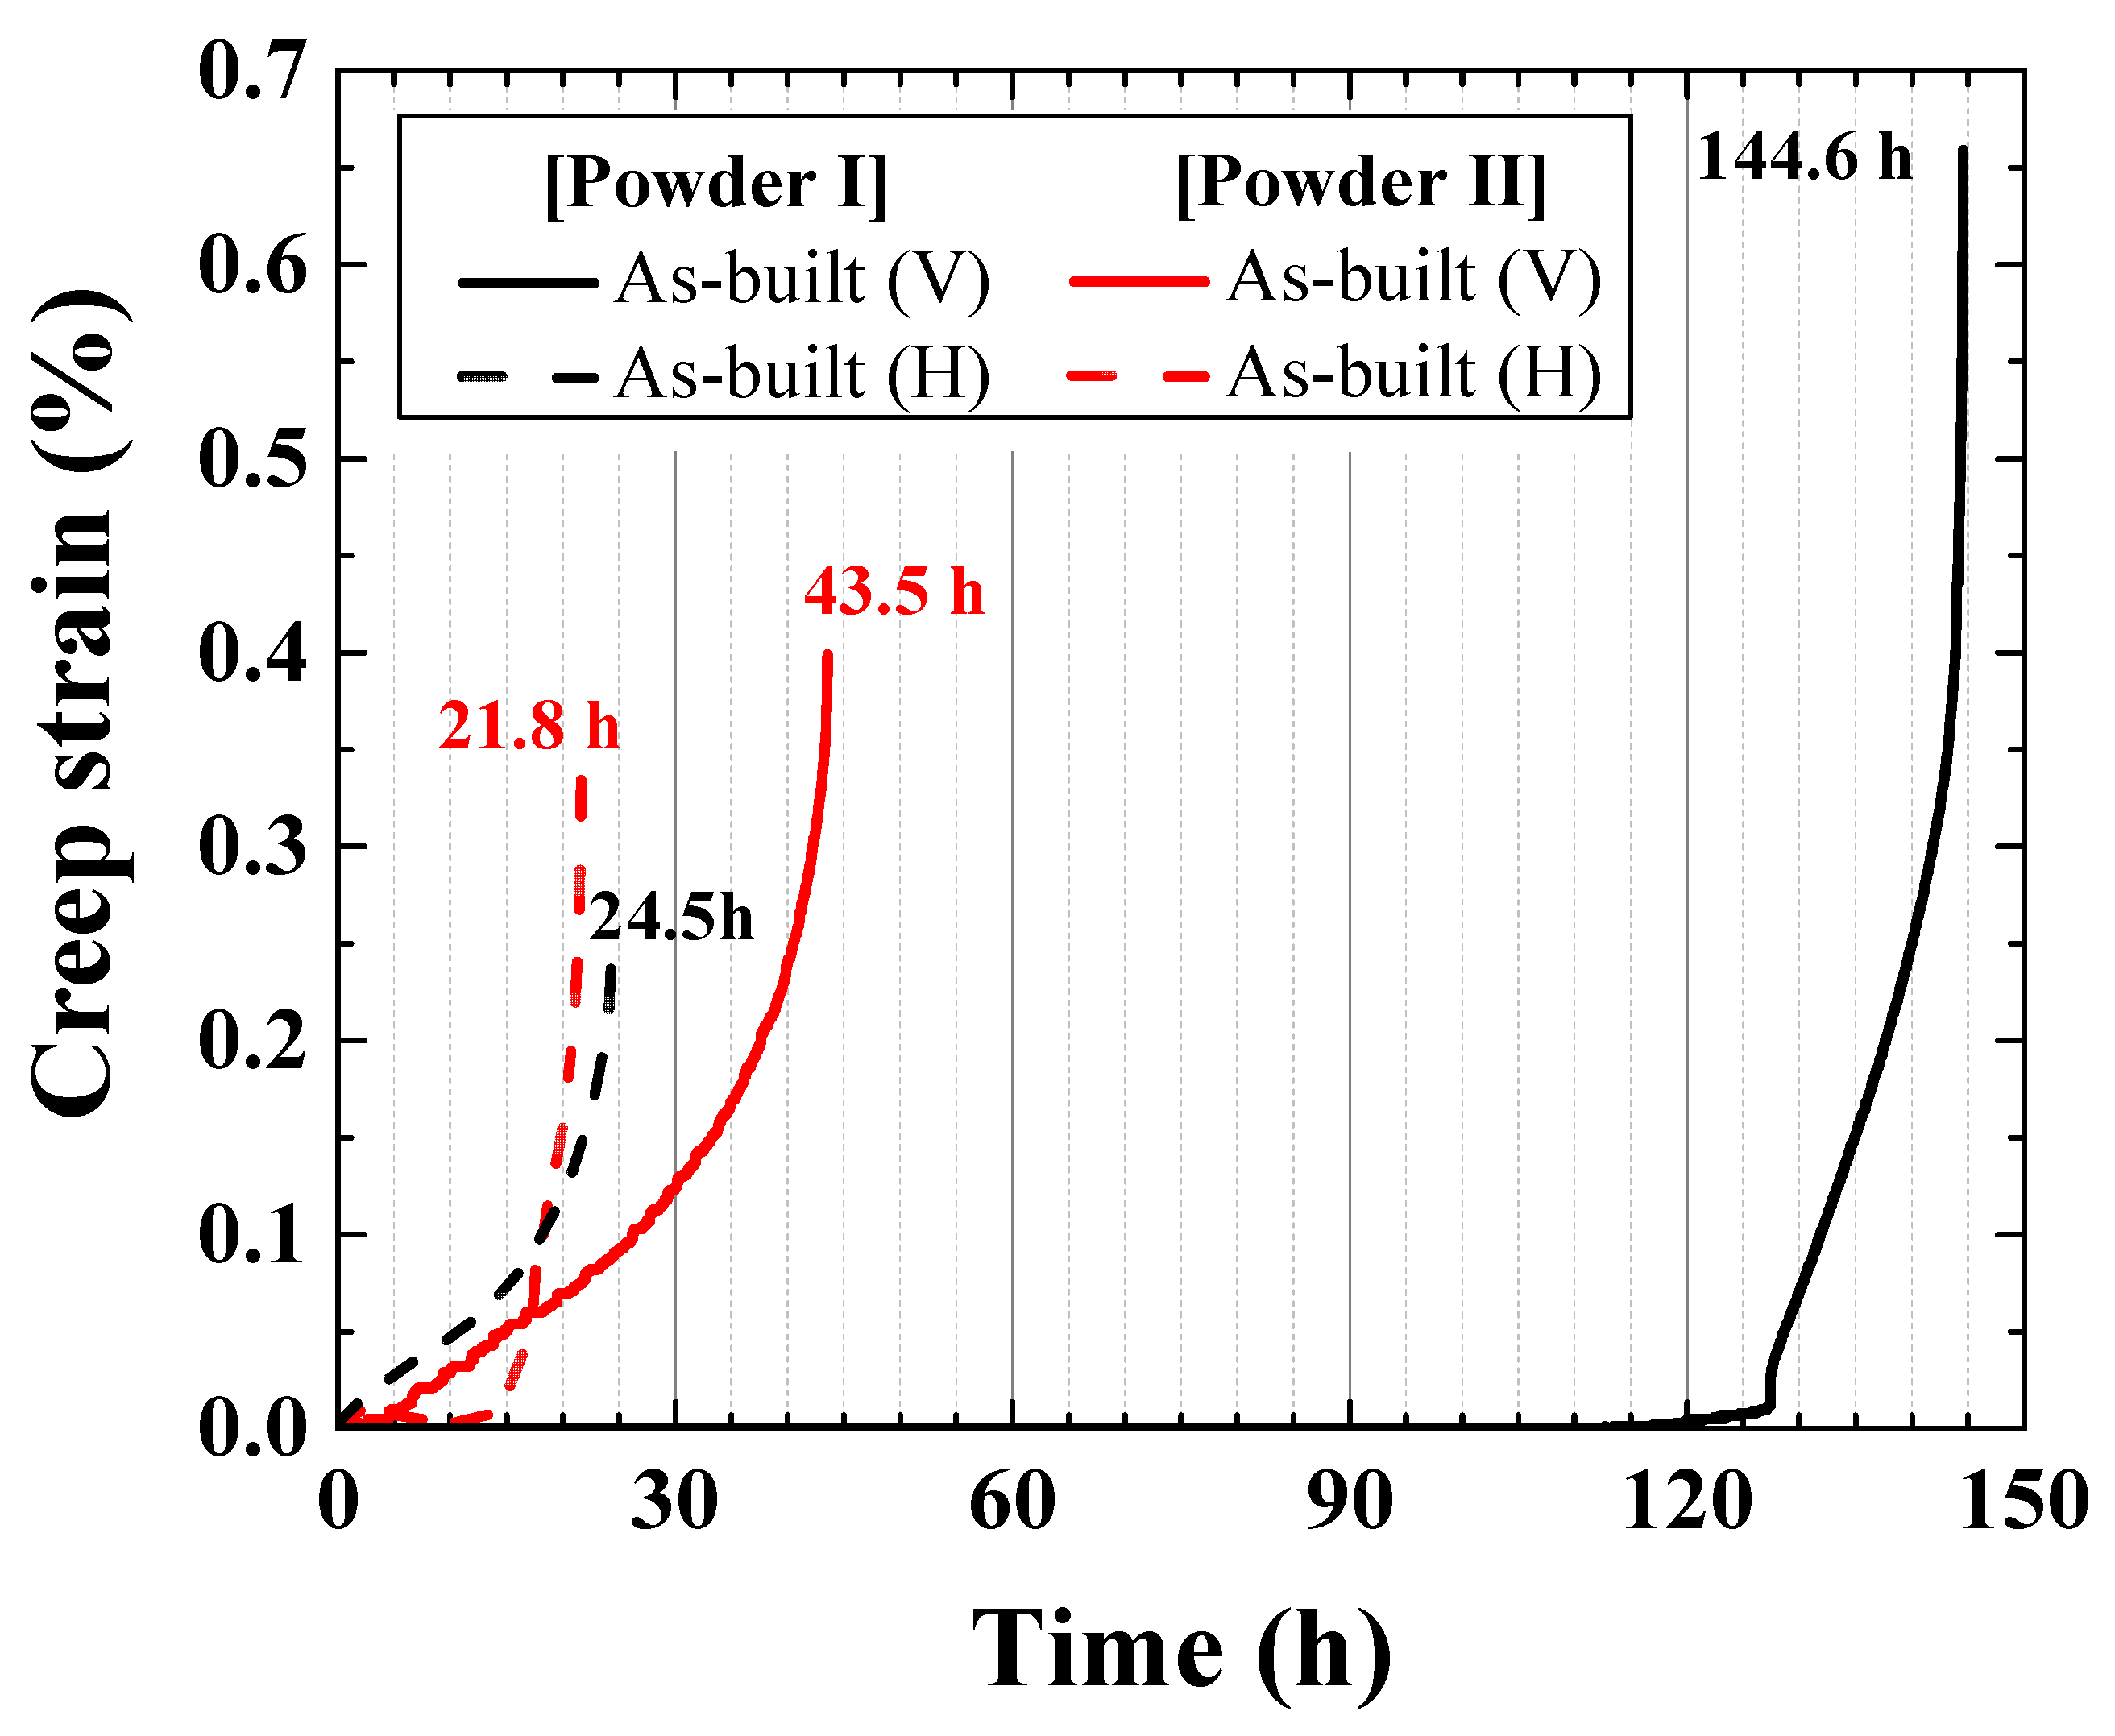
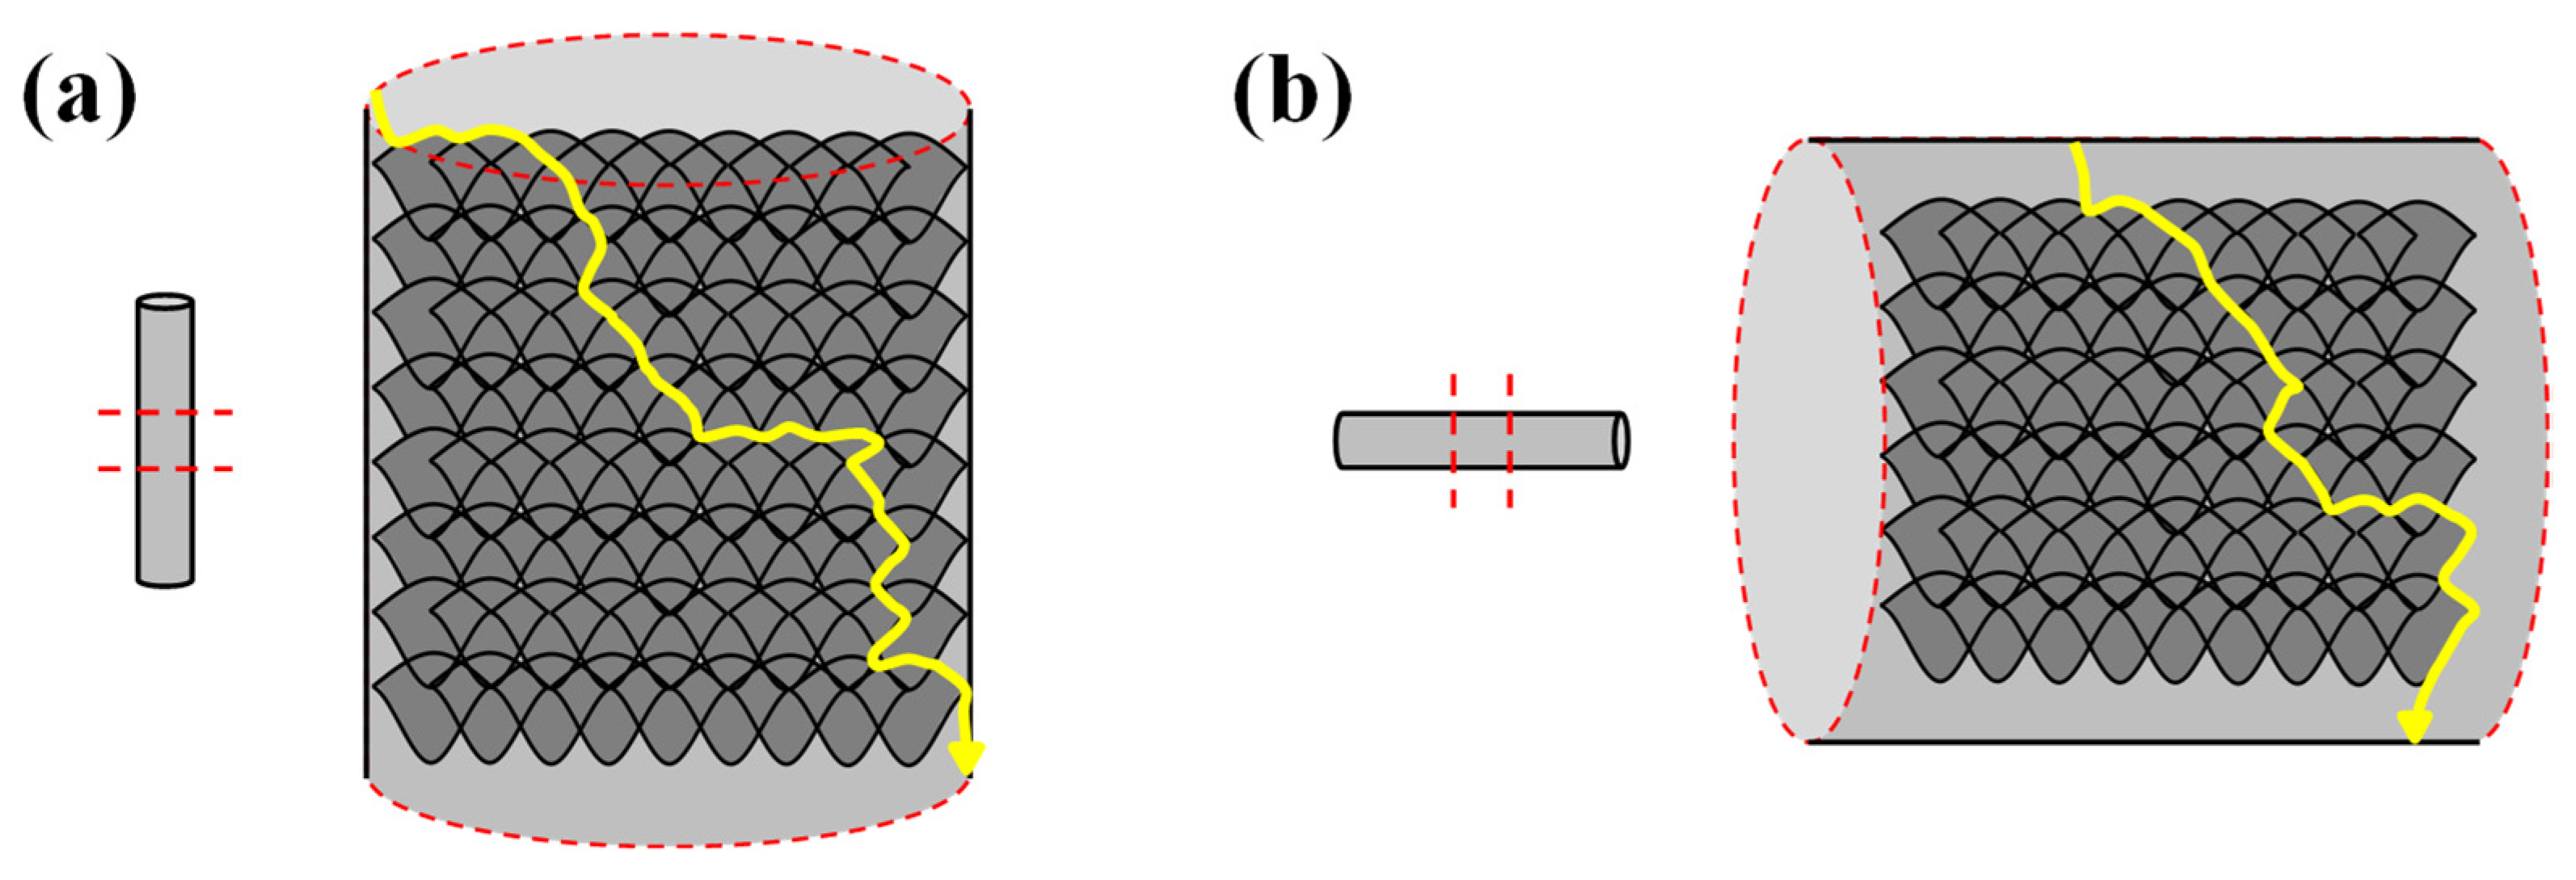
3.4. Creep Rupture Time of Hastelloy X Alloy LPBF as-Built Specimen
4. Conclusions
Author Contributions
Funding
Institutional Review Board Statement
Informed Consent Statement
Data Availability Statement
Conflicts of Interest
References
- Wu, X. A review of laser fabrication of metallic engineering components and of materials. Mater. Sci. Technol. 2007, 23, 631–640. [Google Scholar] [CrossRef]
- Douglas, S.T.; Stanley, W.G. Costs and Cost Effectiveness of Additive Manufacturing a Literature Review and Discussion; NIST Special Publication: Gaithersburg, MD, USA, 2014; Volume 1176. [Google Scholar]
- Adedeji, B.B.; Vhance, V.V.; David, L. Additive Manufacturing Handbook: Product Development for the Defense Industry; CRC Press: Boca Raton, FL, USA, 2017; pp. 46–54. [Google Scholar]
- Zhao, J.-C.; Larsen, M.; Ravikumar, V. Phase precipitation and time–temperature transformation diagram of Hastelloy X. Mater. Sci. Eng. A. 2000, 293, 112–119. [Google Scholar] [CrossRef]
- Haynes-International. Hastelloy X Alloy; Haynes-International: Kokomo, IN, USA, 1997; Volume 16. [Google Scholar]
- Hong, H.U.; Kim, I.S.; Choi, B.G.; Jeong, H.W.; Jo, C.Y. Effects of temperature and strain range on fatigue cracking behavior in Hastelloy X. Mater. Lett. 2008, 62, 4351–4353. [Google Scholar] [CrossRef]
- Wei, L.; Chaoyue, C.; Sansan, S.; Ruixin, Z.; Longtao, L.; Xiaodong, W.; Tao, H.; Weidong, X.; Chuanjun, L.; Jianbo, Y.; et al. Study of pore defect and mechanical properties in selective laser melted Ti6Al4V alloy based on X-ray computed tomography. Mater. Sci. Eng. A 2020, 797, 139981. [Google Scholar]
- Yang, T.; Dacian, T.; Paul, R.; Xinhua, W. Influences of processing parameters on surface roughness of HastelloyX produced by selective laser melting. Addit. Manuf. 2017, 13, 103–112. [Google Scholar]
- Sara, G.; Susana, M.P.; Eduardo, C.; Pablo, Z.; Joaquín, B. Proposal of design rules for improving the accuracy of selective laser melting (SLM) manufacturing using benchmarks parts. Rapid Prototyp. J. 2022, 28, 1129–1143. [Google Scholar]
- Jerard, V.G.; Sneha, P.N.; Ross, W.C.; He, L.; Hangman, C.; Robert, M.S.; Jack, L.B.; Anthony, D.R. Defect structure process maps for laser powder bed fusion additive manufacturing. Addit. Manuf. 2020, 36, 101552. [Google Scholar]
- Reza, E.; Ali, K.; Usman, A.; Behzad, B.; Ali, B.; Hamid, J.; Ehsan, T. On the effect of laser powder-bed fusion process parameters on quasi-static and fatigue behaviour of Hastelloy X: A microstructure/defect interaction study. Addit. Manuf. 2021, 38, 101805. [Google Scholar]
- Ali, K.; Reza, E.; Usman, A.; Pablo, D.E.; Yahya, M.; Norman, Y.Z.; Ali, B.; Ehsan, T. Controlling mechanical properties of additively manufactured Hastelloy X by altering solidification pattern during laser powder-bed fusion. Mater. Sci. Eng. A 2019, 762, 138081. [Google Scholar]
- Tae, W.N.; Won, R.K.; Seung, M.Y.; Ohyung, K.; Jong, M.P.; Gun, H.K.; Kyung, H.J.; Chang, W.L.; Hyung, K.P.; Hyung, G.K. Effect of laser power on oxygen and nitrogen concentration of commercially pure titanium manufactured by selective laser melting. Mater. Charact. 2018, 143, 110–117. [Google Scholar]
- Usman, A.; Reza, E.; Farid, A.; Dyuti, S.; Waqas, M.; Ali, K.; Yahya, M.; Ehsan, M.; Ehsan, T. Identification and characterization of spatter particles and their effect on surface roughness, density and mechanical response of 17-4 pH stainless steel laser powder- bed fusion parts. Mater. Sci. Eng. A 2019, 756, 98–107. [Google Scholar]
- Jordan, S.W.; Justin, W.; Vipin, T.; Carlos, B.; Max, P.; Jared, T.; Thien, Q.P.; Alkan, D.M. The effects of particle size distribution on the rheological properties of the powder and the mechanical properties of additively manufactured 17-4 PH stainless steel. Addit. Manuf. 2021, 39, 101851. [Google Scholar]
- Ahmed, H.M.; Mohamed, E.; Goulnara, K.D.; Stephen, C.V. Thermal post-processing of AlSi10Mg parts produced by Selective Laser Melting using recycled powder. Addit. Manuf. 2018, 21, 234–247. [Google Scholar]
- Haokun, S.; Xin, C.; Zhiying, L.; Azimi, G.; Yu, Z. Selective laser melting of maraging steels using recycled powders: A comprehensive microstructural and mechanical investigation. Metall. Mater. Trans. A 2021, 52, 1714–1722. [Google Scholar]
- Leitz, K.-H.; Grohs, C.; Singer, P.; Tabernig, B.; Plankensteiner, A.; Kestler, H.; Sigl, L.S. Fundamental analysis of the influence of powder characteristics in Selective Laser Melting of molybdenum based on a multi-physical simulation model. Int. J. Refract. Hard. Met. 2018, 72, 1–8. [Google Scholar] [CrossRef]
- Cuiyuan, L.; Jing, S. Relative density prediction of additively manufactured Inconel 718: A study on genetic algorithm optimized neural network models. Rapid Prototyp. J. 2022, 28, 1425–1436. [Google Scholar]
- Haifeng, X.; Changchun, Z.; Haihong, Z. Effect of direct aging and annealing on the microstructure and mechanical properties of AlSi10Mg fabricated by selective laser melting. Rapid Prototyp. J. 2022; ahead-of-print. [Google Scholar]
- Yu, Q.; Peng, W.; Hui, G.; Dandan, X.; Yufeng, Z.; Lucas, J.; Reinhart, P.; Maximilian, V.; Johannes, H.S. Additive manufacturing of biodegradable metals: Current research status and future perspectives. Acta Biomater. 2019, 98, 3–22. [Google Scholar]
- Zhongtang, G.; Jinqiang, T.; Wei, G.; Chuanwei, Z.; Wu, Z. Characterization of the Microstructure Evolution of Ni-Based Superalloy at Liquidus Temperature by Electromagnetic Field. Metals 2018, 8, 748. [Google Scholar] [CrossRef]
- Lore, T.; Frederik, V.; Tom, C.; Jan, V.H.; Jean, P.K. A study of the microstructural evolution during selective laser melting of Ti–6Al–4V. Acta Mater. 2010, 58, 3303–3312. [Google Scholar]
- Umberto, S.B.; Alexander, J.W.; Manyalibo, J.M.; Jean-Pierre, R.D.; Julie, M.S. On the limitations of volumetric energy density as a design parameter for selective laser melting. Mater. Des. 2017, 113, 331–340. [Google Scholar]
- Alexey, D.; Anna, P.; Igor, M.; Philippe, B.; Nathalie, P.; Benjamin, D.; Sebastien, S.; Christophe, D. Microstructure and physical properties of a Ni/Fe-based superalloy processed by selective laser melting. Addit. Manuf. 2017, 15, 66–77. [Google Scholar]
- Dongdong, G.; Yifu, S. Balling phenomena in direct laser sintering of stainless steel powder: Metallurgical mechanisms and control methods. Mater. Des. 2009, 30, 2903–2910. [Google Scholar]
- Mahyar, K.; Amir, H.G.; Martin, L.; Elmira, S.; Laura, C.; Ian, G.; David, D.; Stuart, B.; Milan, B.; Bernard, R. The effect of absorption ratio on meltpool features in laser-based powder. Opt. Laser. Technol. 2022, 153, 108263. [Google Scholar]
- Floreen, S.; Davidson, J.M. The effects of B and Zr on the creep and fatigue crack growth behavior of a Ni-base superalloy. Metall. Trans. A 1983, 14, 895–901. [Google Scholar] [CrossRef]
- Yan, B.C.; Zhang, J.; Lou, L.H. Effect of boron additions on the microstructure and transverse properties of a directionally solidified superalloy. Mater. Sci. Eng. A 2008, 474, 39–47. [Google Scholar] [CrossRef]
- He, L.Z.; Zheng, Q.; Sun, X.F.; Guan, H.R.; Hu, Z.Q.; Tieu, A.K.; Lu, C.; Zhu, H.T. Effect of carbides on the creep properties of a Ni-base superalloy M963. Mater. Sci. Eng. A 2005, 397, 297–304. [Google Scholar] [CrossRef]
- Woo, I.Y.; Lyu, M.Y. Variations in the Impact strength of material extrusion-type 3D printed specimens depending on tool path and building direction. Polymer 2020, 44, 471–478. [Google Scholar]
- Beth, E.C.; Todd, A.P.; Allison, M.B. Anisotropic tensile behavior of Ti–6Al–4V components fabricated with directed energy deposition additive manufacturing. Acta Mater. 2015, 87, 309–320. [Google Scholar]
- George, E.D. Mechanical Metallurgy; McGraw Hill: New York, NY, USA, 1988; pp. 189–191. [Google Scholar]


| Cast | As-Built | ||
|---|---|---|---|
| Powder I | Powder II | ||
| Density (g/cm3) | 8.28 | 8.38 | 8.34 |
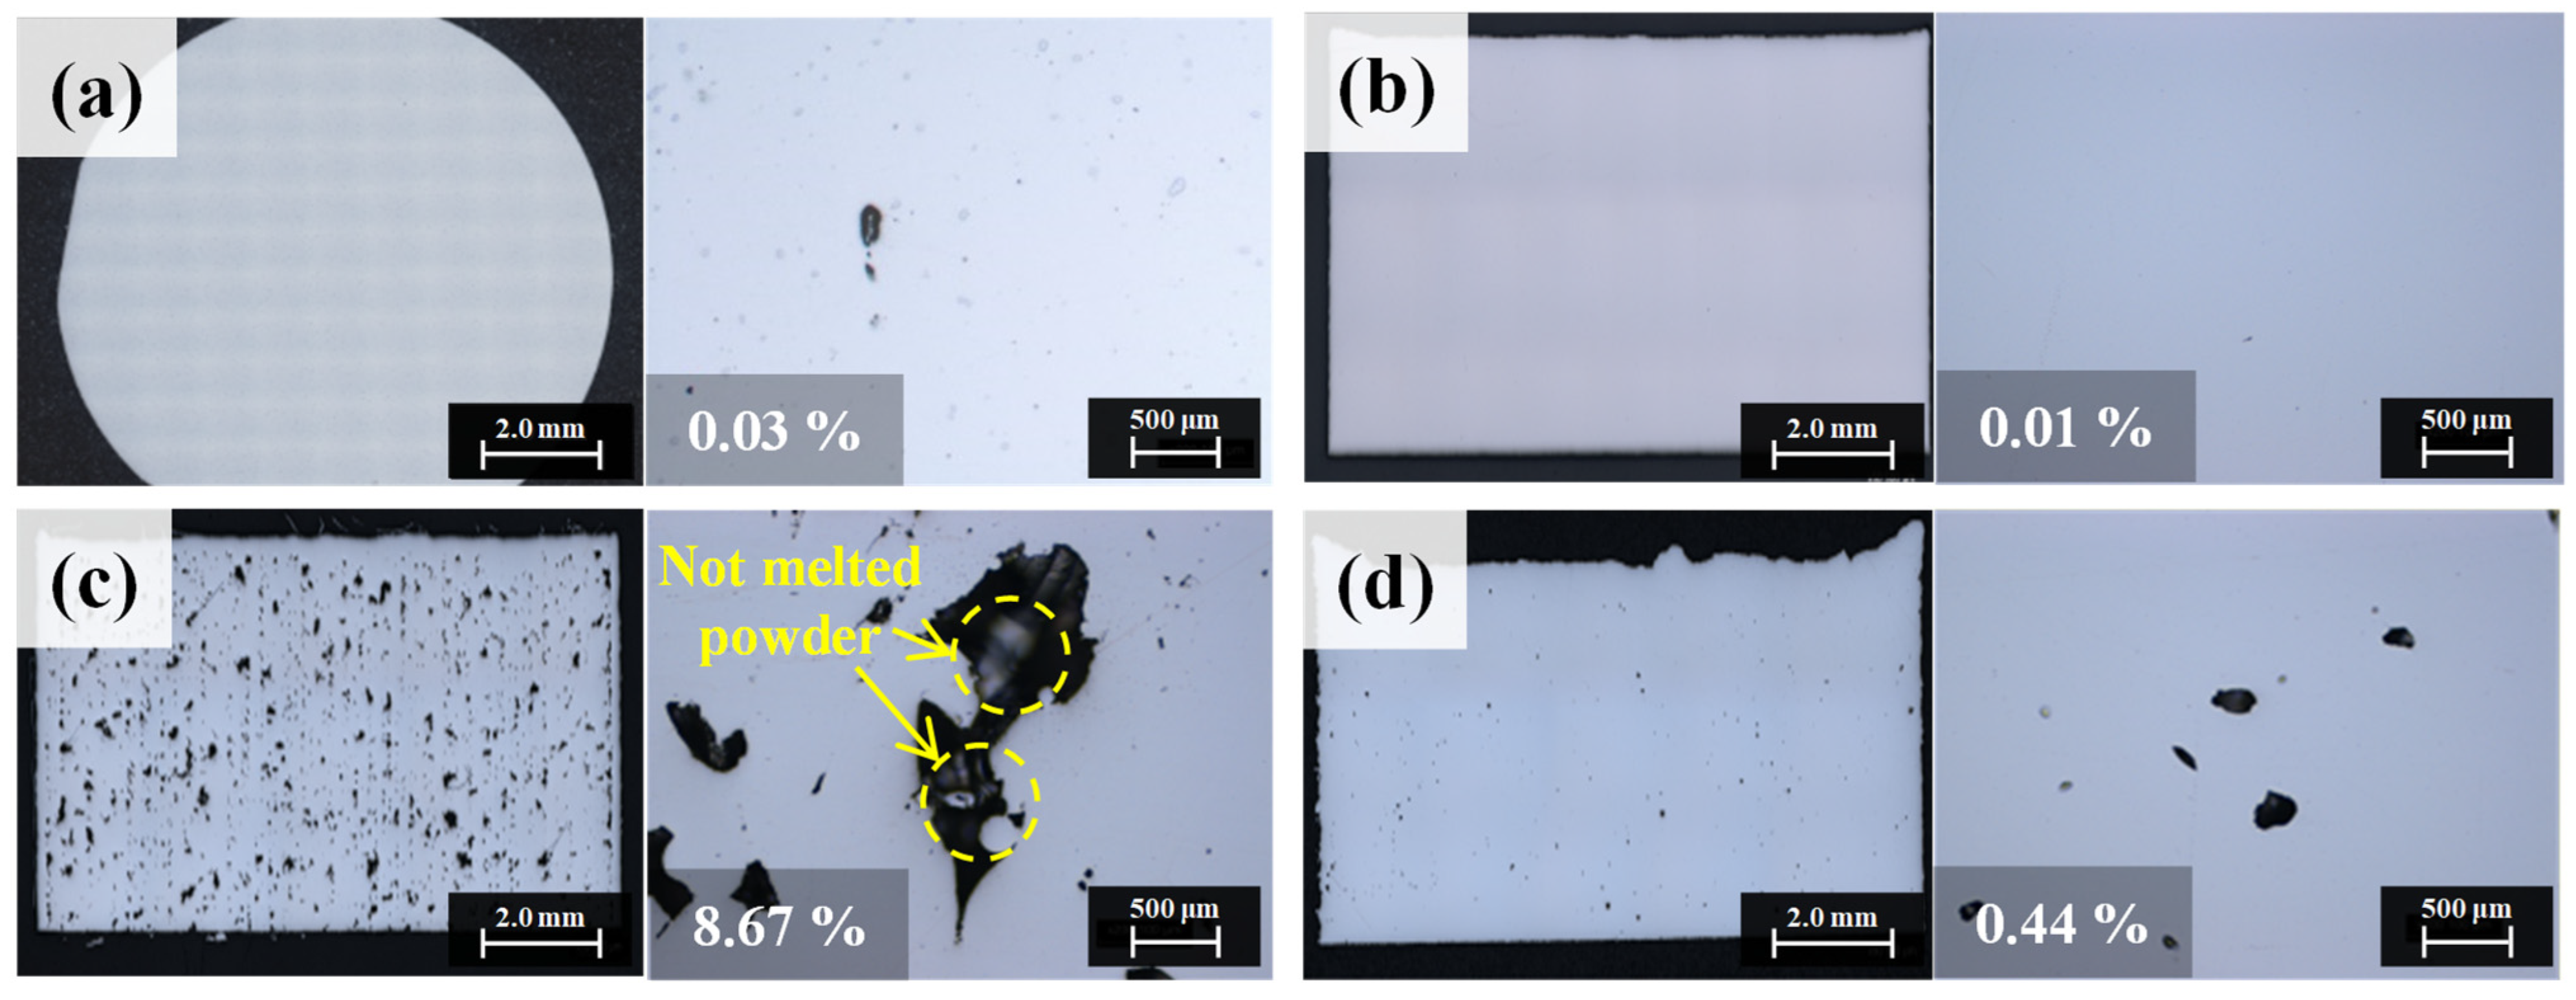
| Cross-Section Porosity (%) | 0.03 | 0.01 | 0.01 |
| Maximum Pore Area (μm2) | 3084.13 | 682.56 | 764.07 |
| Average Pore Area (μm2) | 162.35 | 53.68 | 32.13 |
| Tracked Pore Numbers | 194 | 208 | 344 |
Publisher’s Note: MDPI stays neutral with regard to jurisdictional claims in published maps and institutional affiliations. |
© 2022 by the authors. Licensee MDPI, Basel, Switzerland. This article is an open access article distributed under the terms and conditions of the Creative Commons Attribution (CC BY) license (https://creativecommons.org/licenses/by/4.0/).
Share and Cite
Jang, J.-E.; Kim, W.; Sung, J.-H.; Kim, Y.-J.; Park, S.-H.; Kim, D.-H. Microstructural Control Strategy Based on Optimizing Laser Powder Bed Fusion for Different Hastelloy X Powder Size. Materials 2022, 15, 6191. https://doi.org/10.3390/ma15186191
Jang J-E, Kim W, Sung J-H, Kim Y-J, Park S-H, Kim D-H. Microstructural Control Strategy Based on Optimizing Laser Powder Bed Fusion for Different Hastelloy X Powder Size. Materials. 2022; 15(18):6191. https://doi.org/10.3390/ma15186191
Chicago/Turabian StyleJang, Jee-Eun, Woosung Kim, Ji-Hyun Sung, Young-Joo Kim, Sung-Hyuk Park, and Da-Hye Kim. 2022. "Microstructural Control Strategy Based on Optimizing Laser Powder Bed Fusion for Different Hastelloy X Powder Size" Materials 15, no. 18: 6191. https://doi.org/10.3390/ma15186191
APA StyleJang, J.-E., Kim, W., Sung, J.-H., Kim, Y.-J., Park, S.-H., & Kim, D.-H. (2022). Microstructural Control Strategy Based on Optimizing Laser Powder Bed Fusion for Different Hastelloy X Powder Size. Materials, 15(18), 6191. https://doi.org/10.3390/ma15186191