
Research on Improving NVH Performance of Automobile Side Door Glass in Use Based on 6 Sigma Method


Abstract
1. Introduction
2. Experimental Device
2.1. Inner Belt
2.1.1. Material Properties
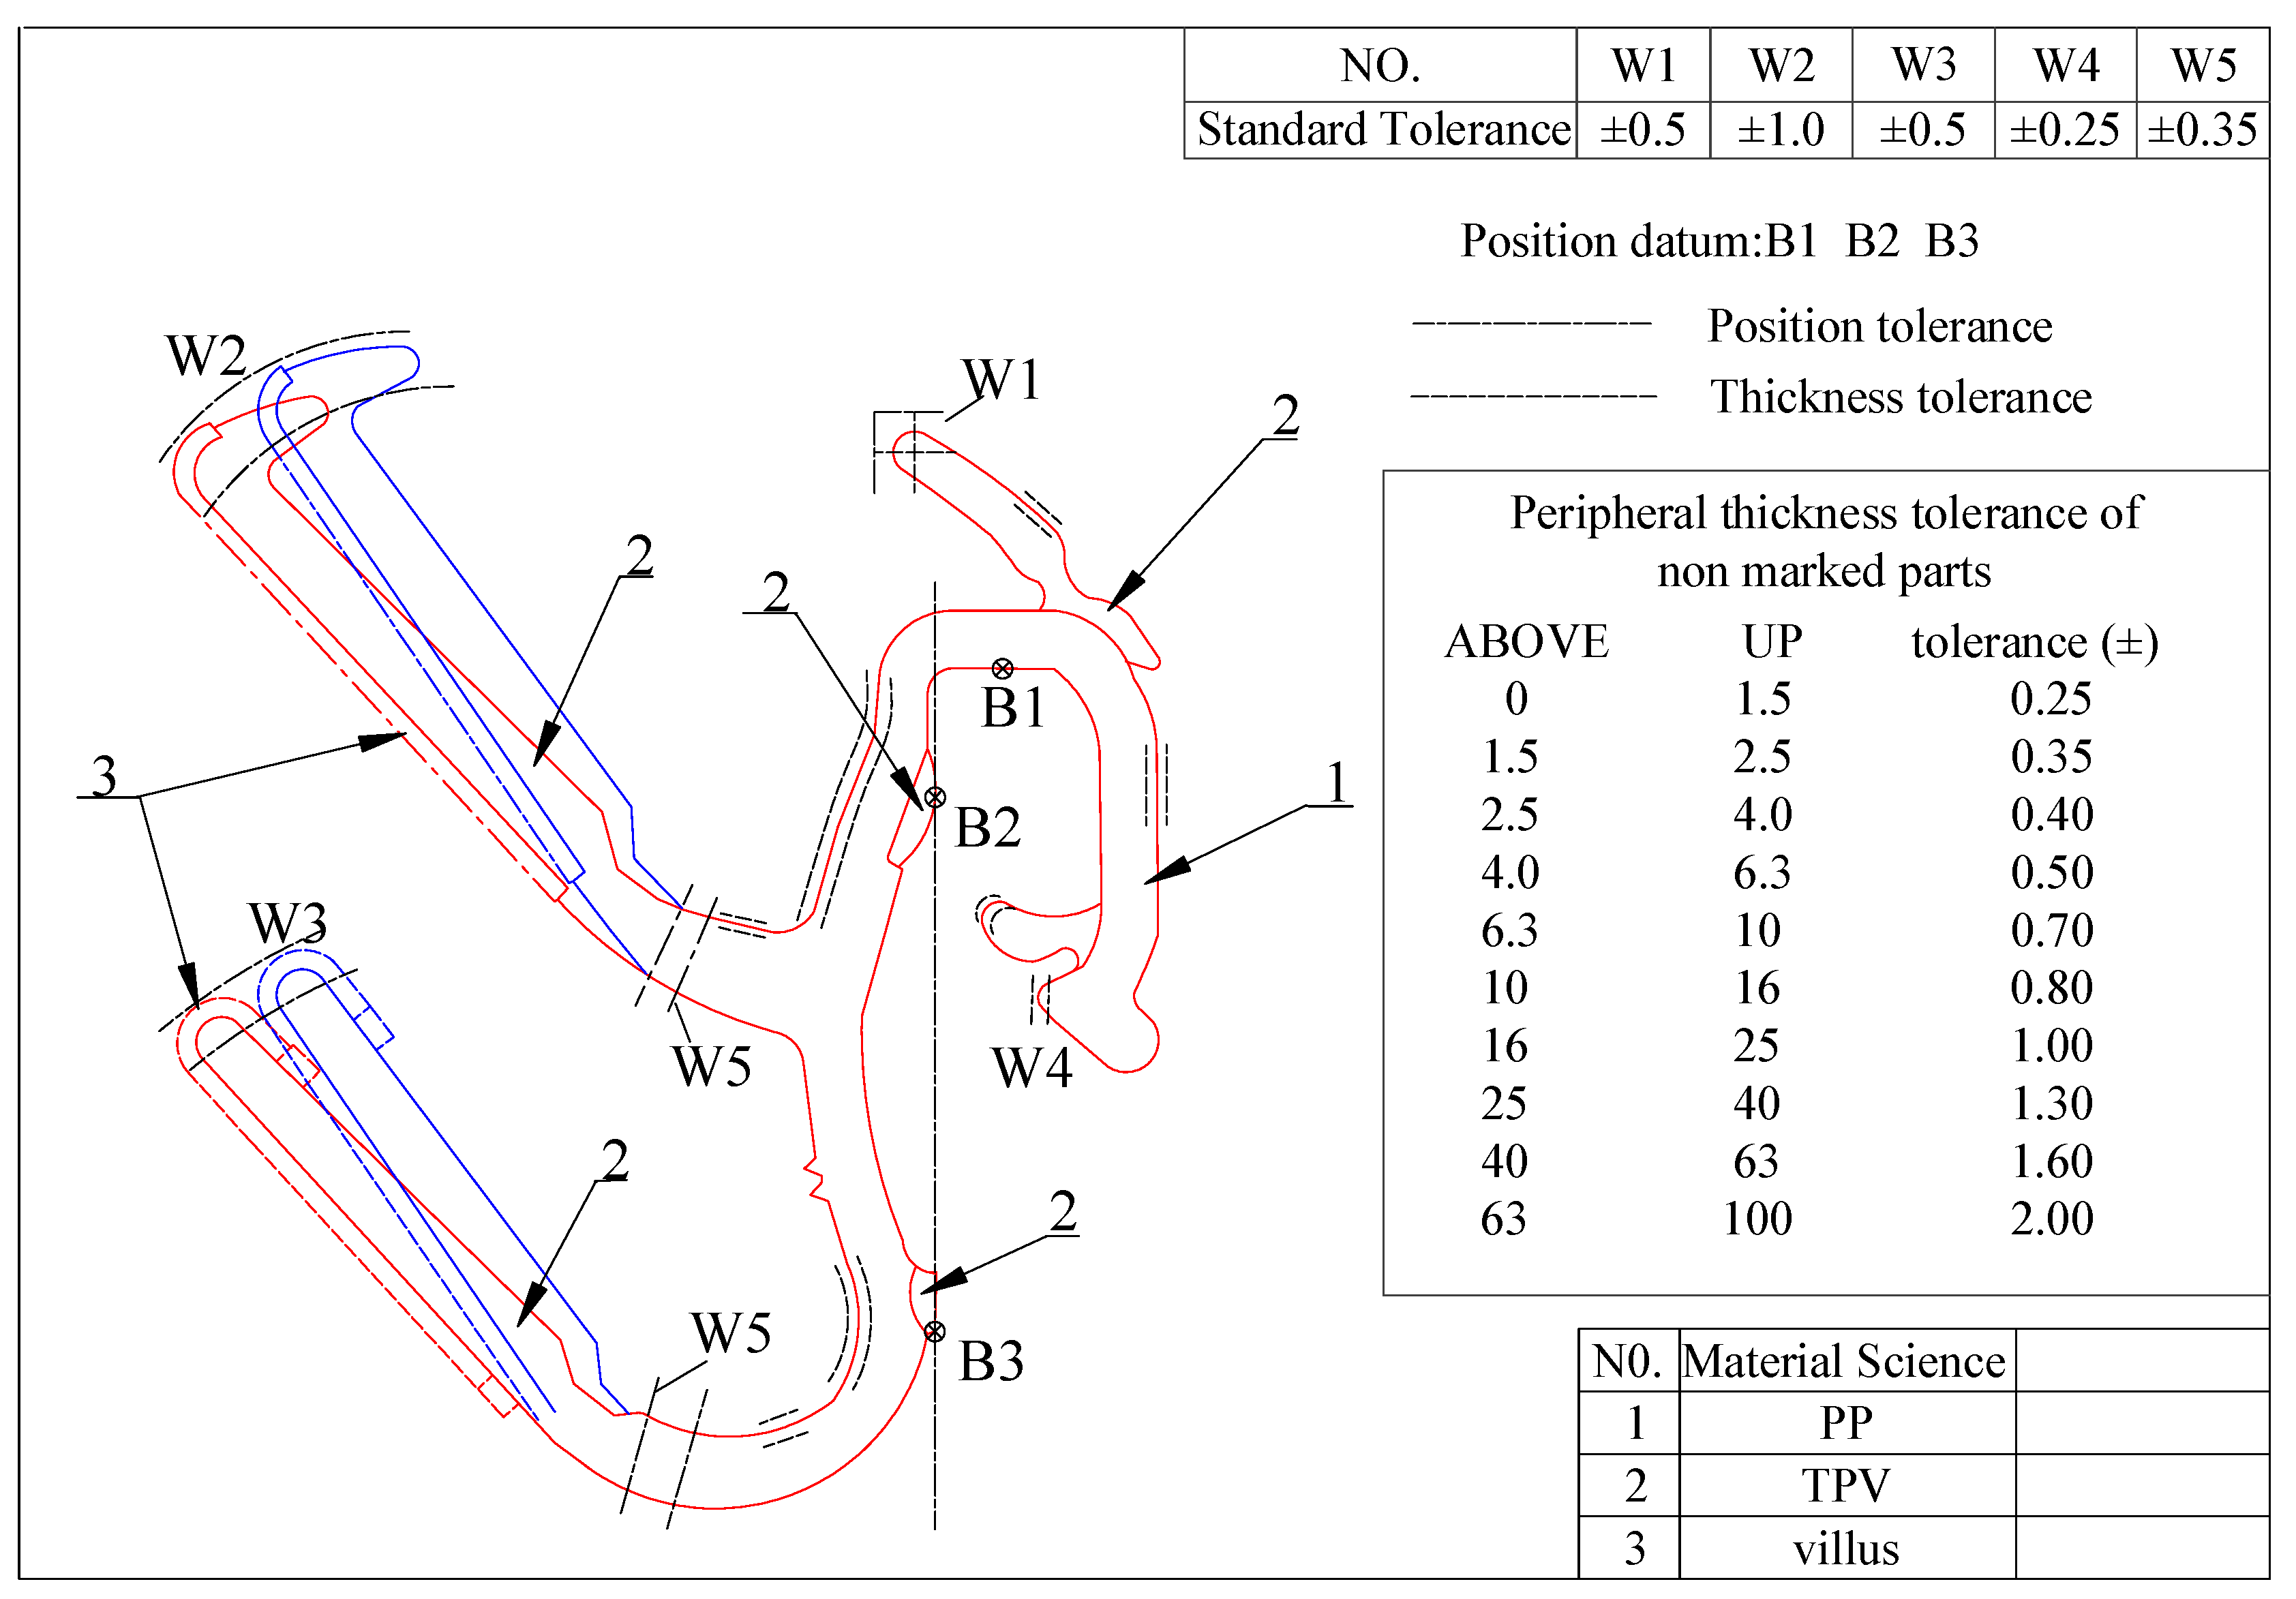
2.1.2. Section Characteristics
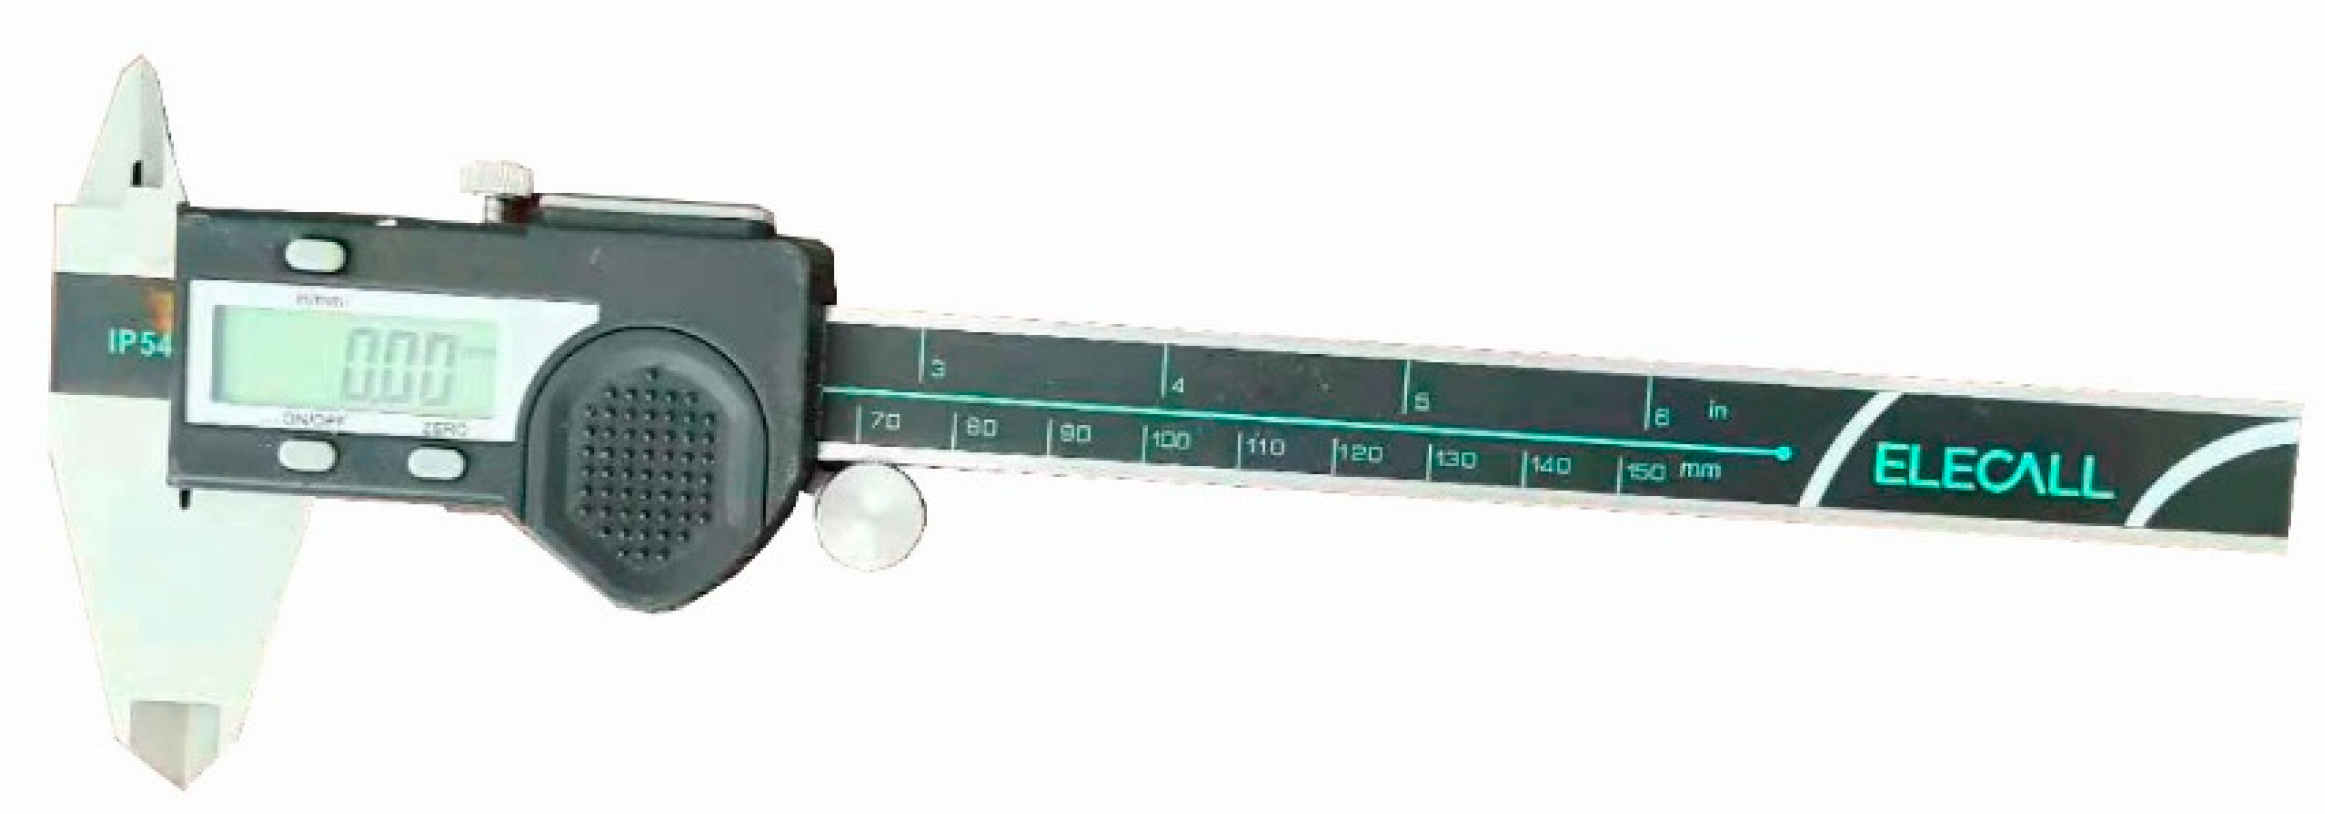
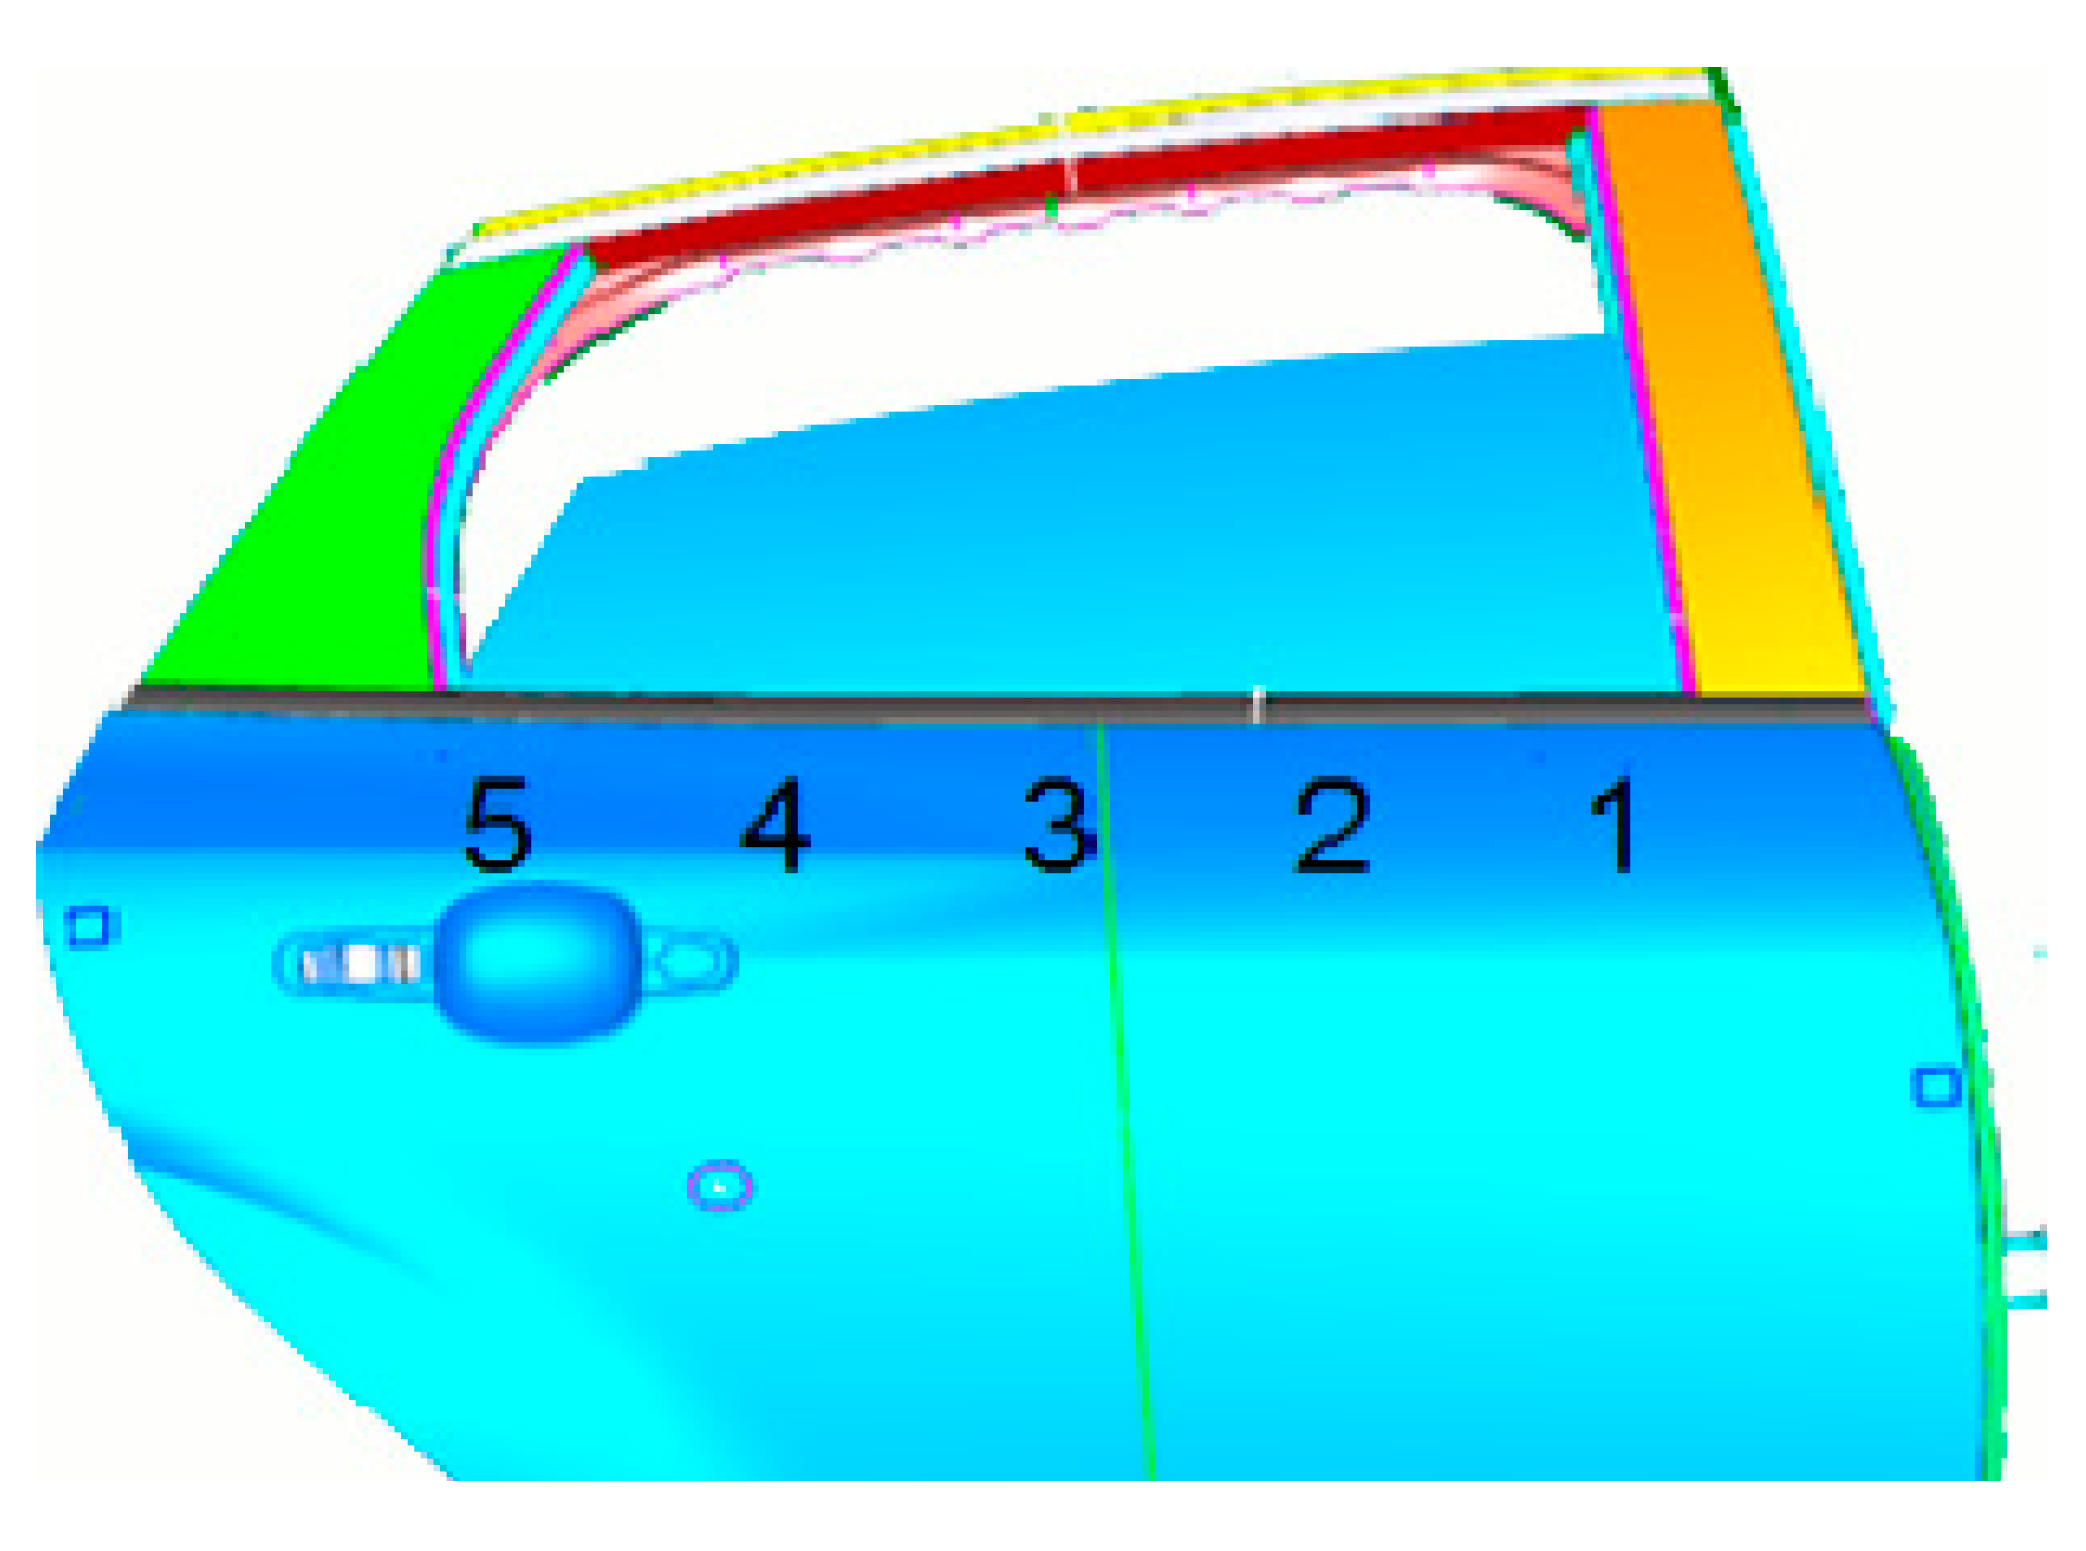
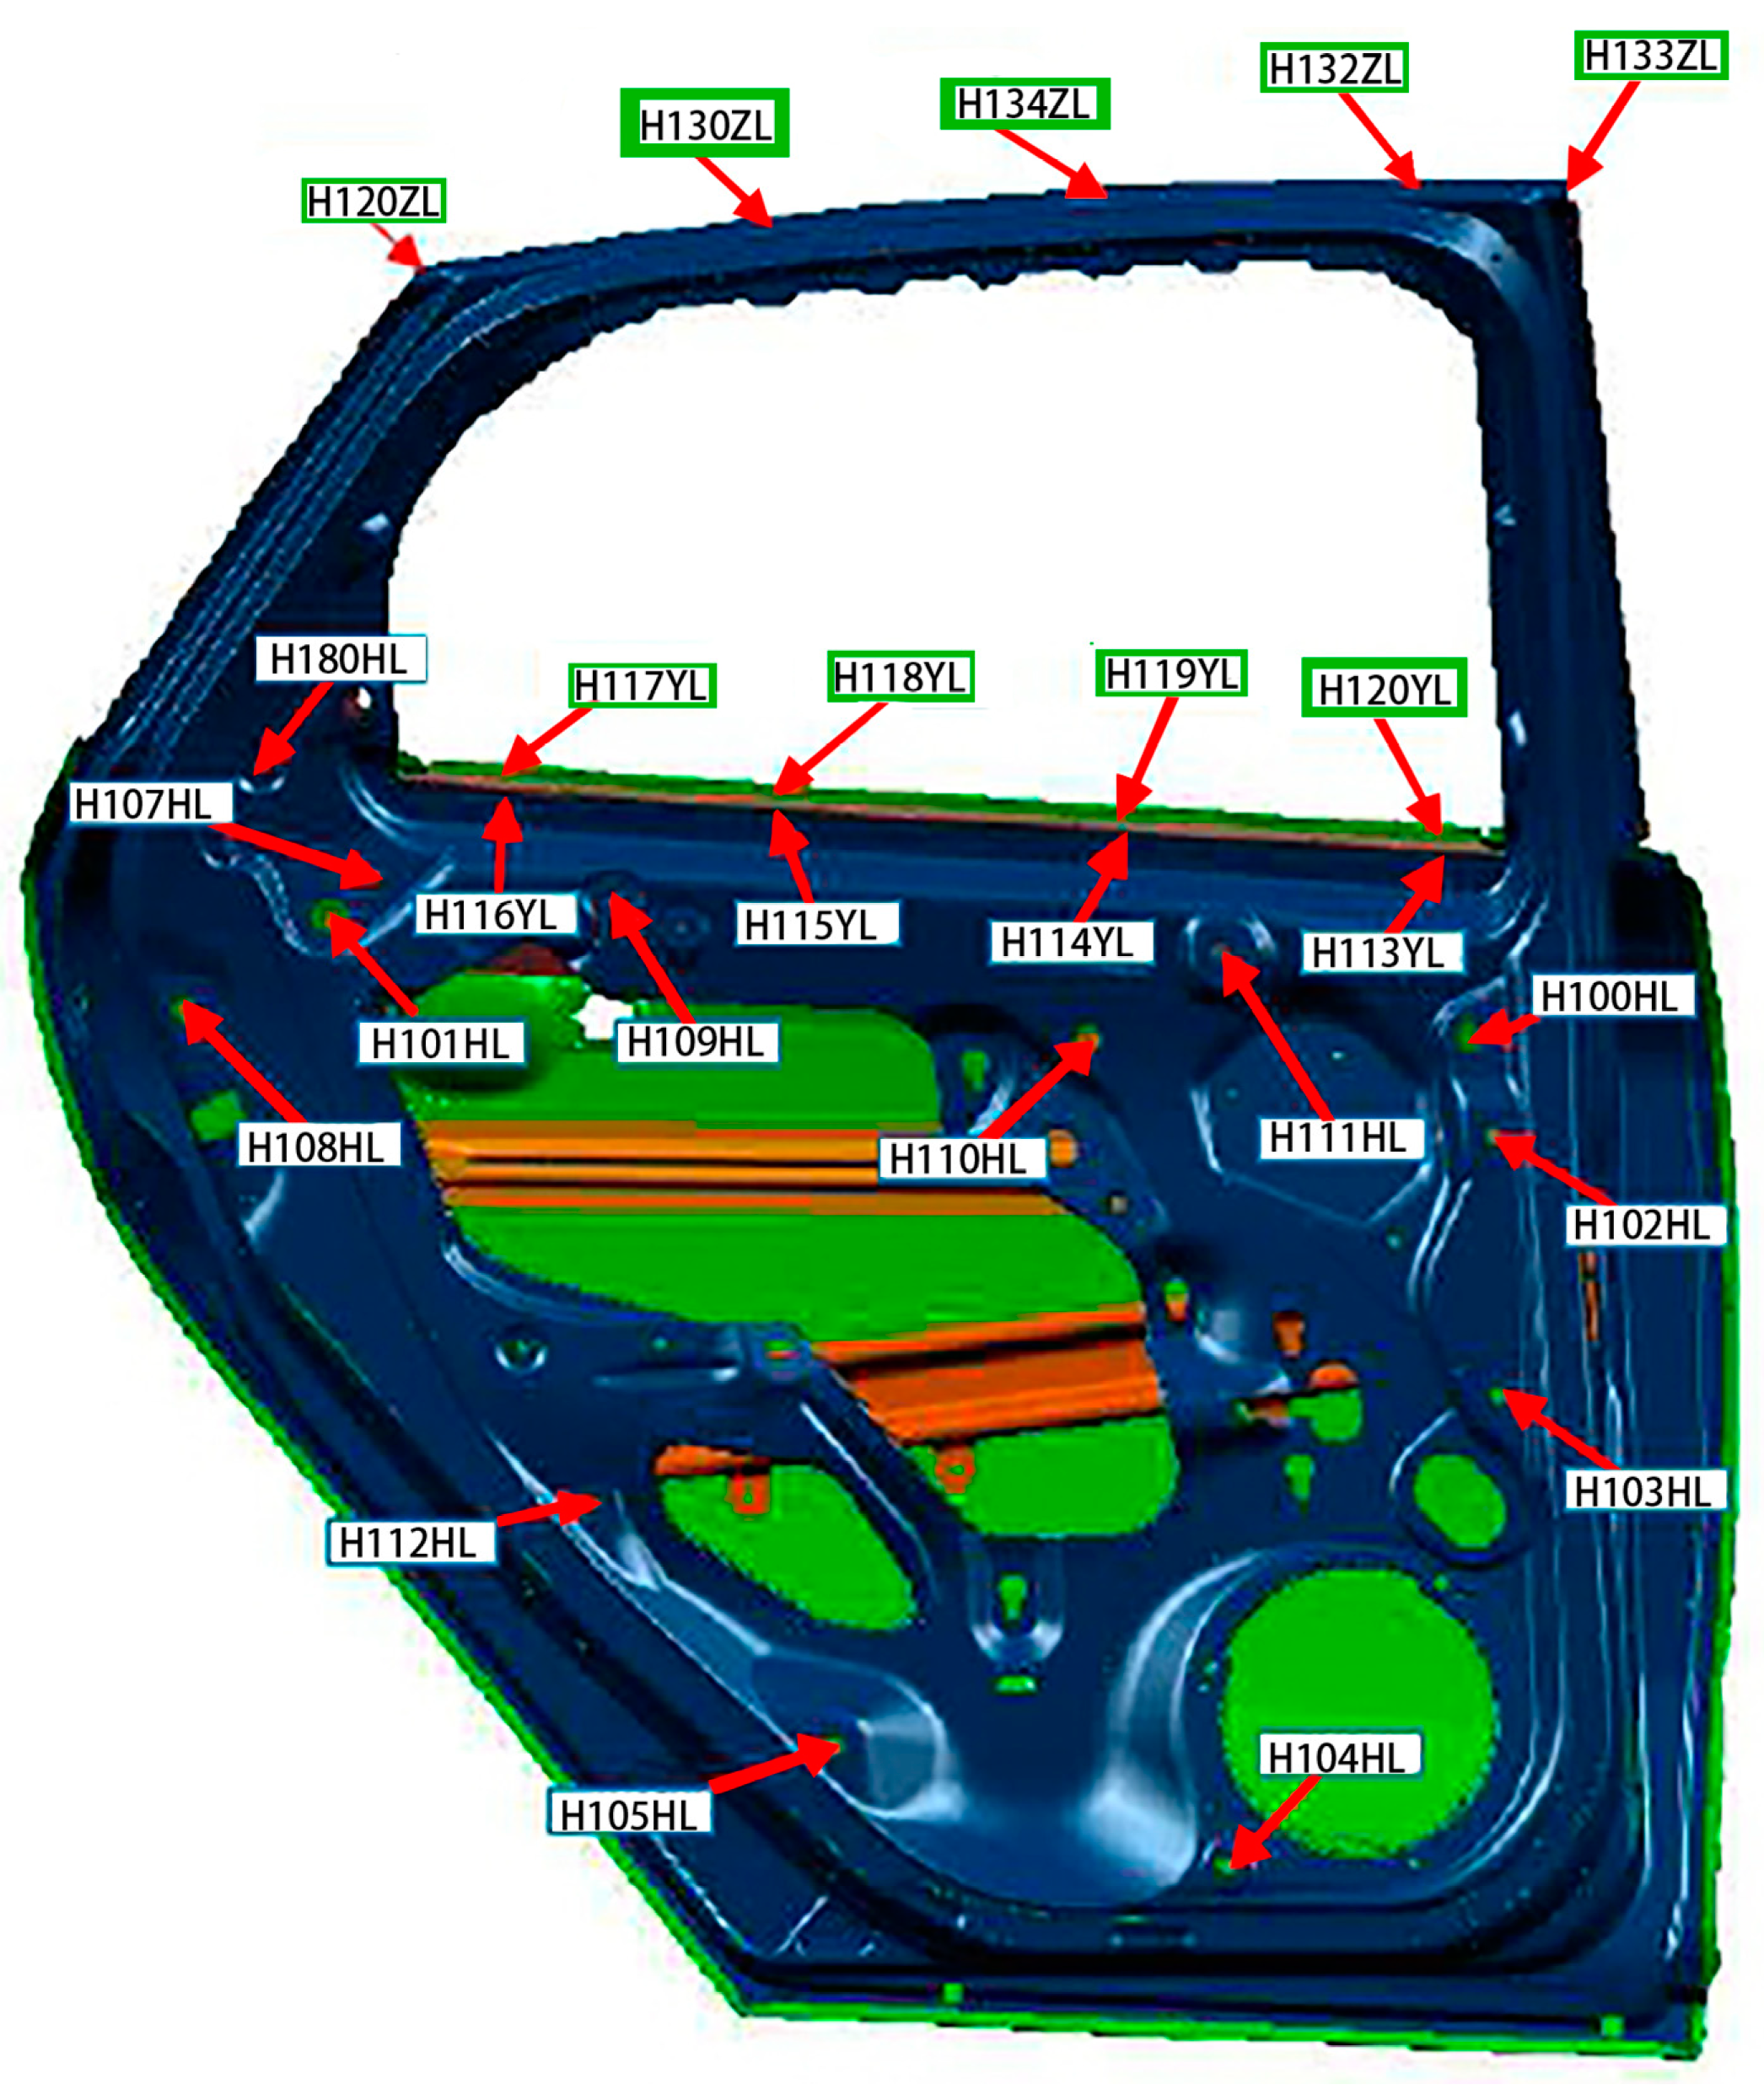
2.2. Window Side Door Point Measuring Tool
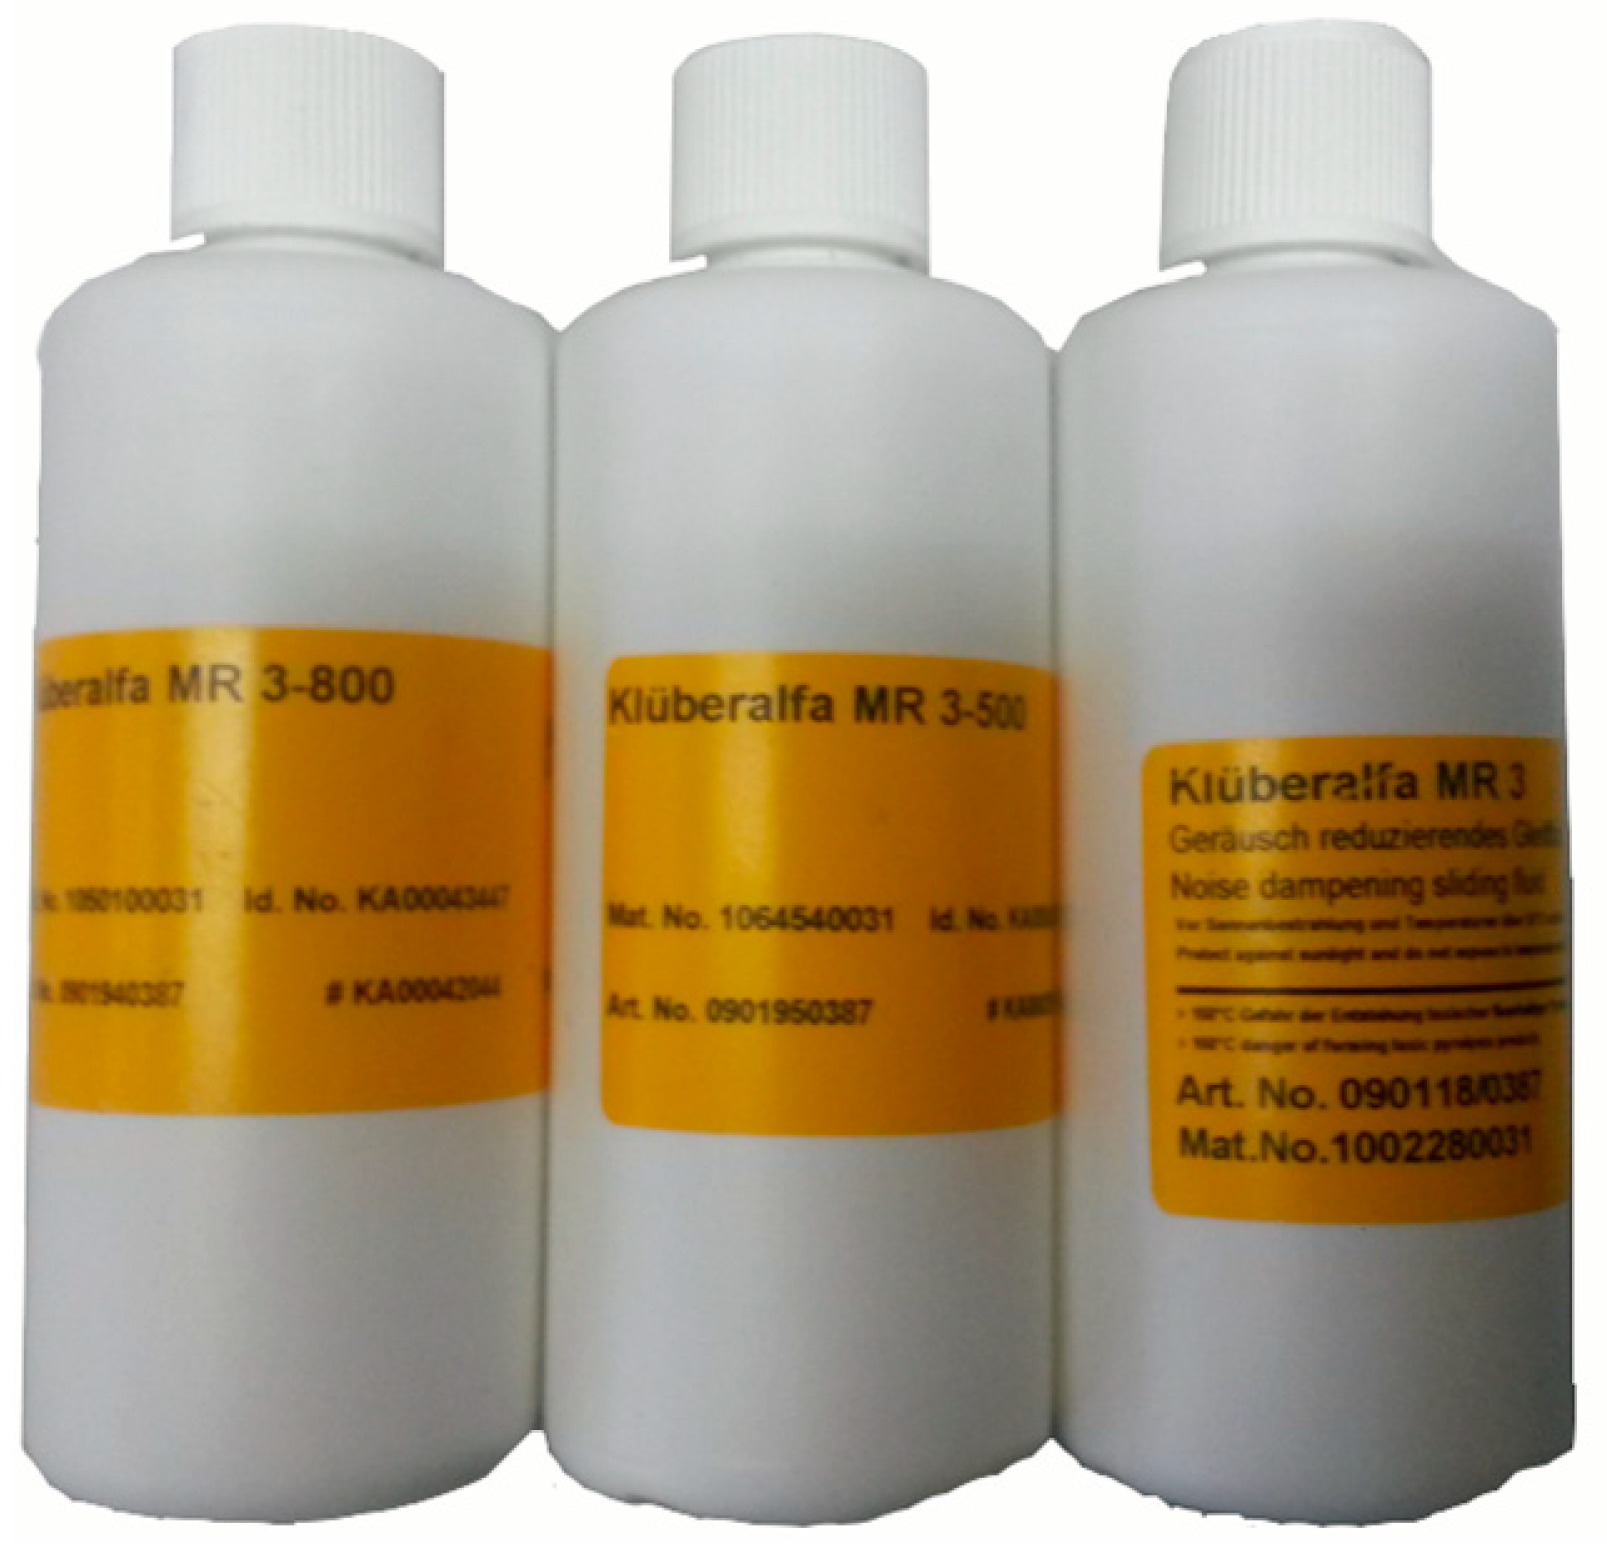
2.3. MR3-800 Coating
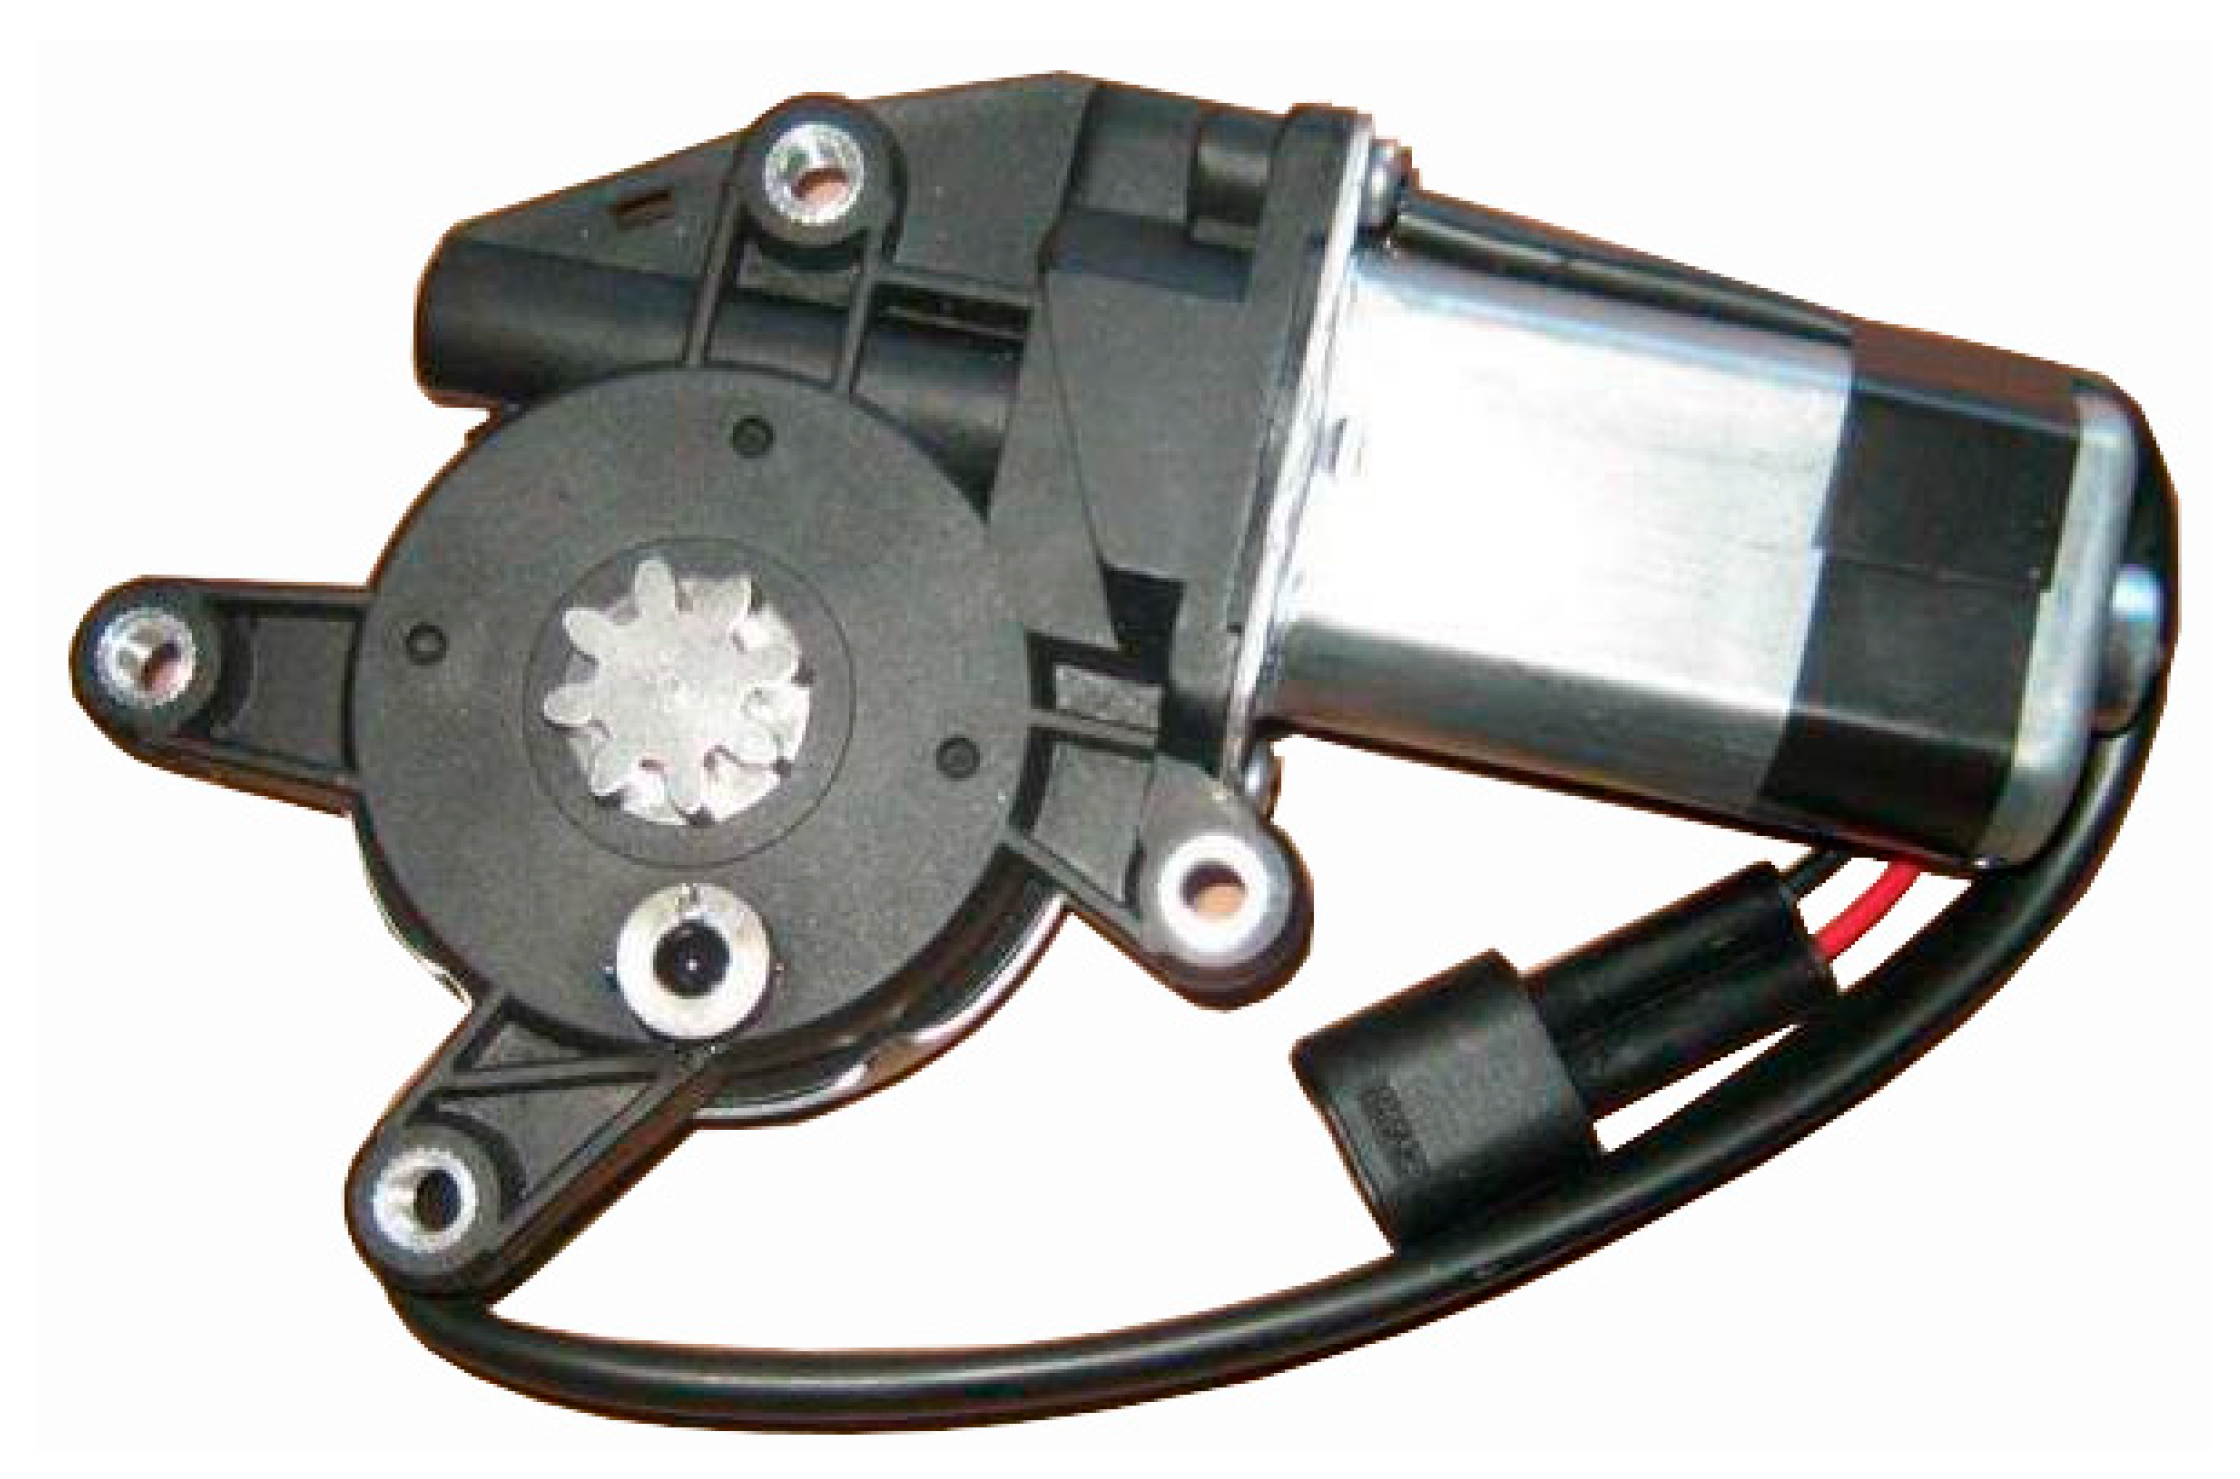
2.4. Motor and Transmission Mechanism
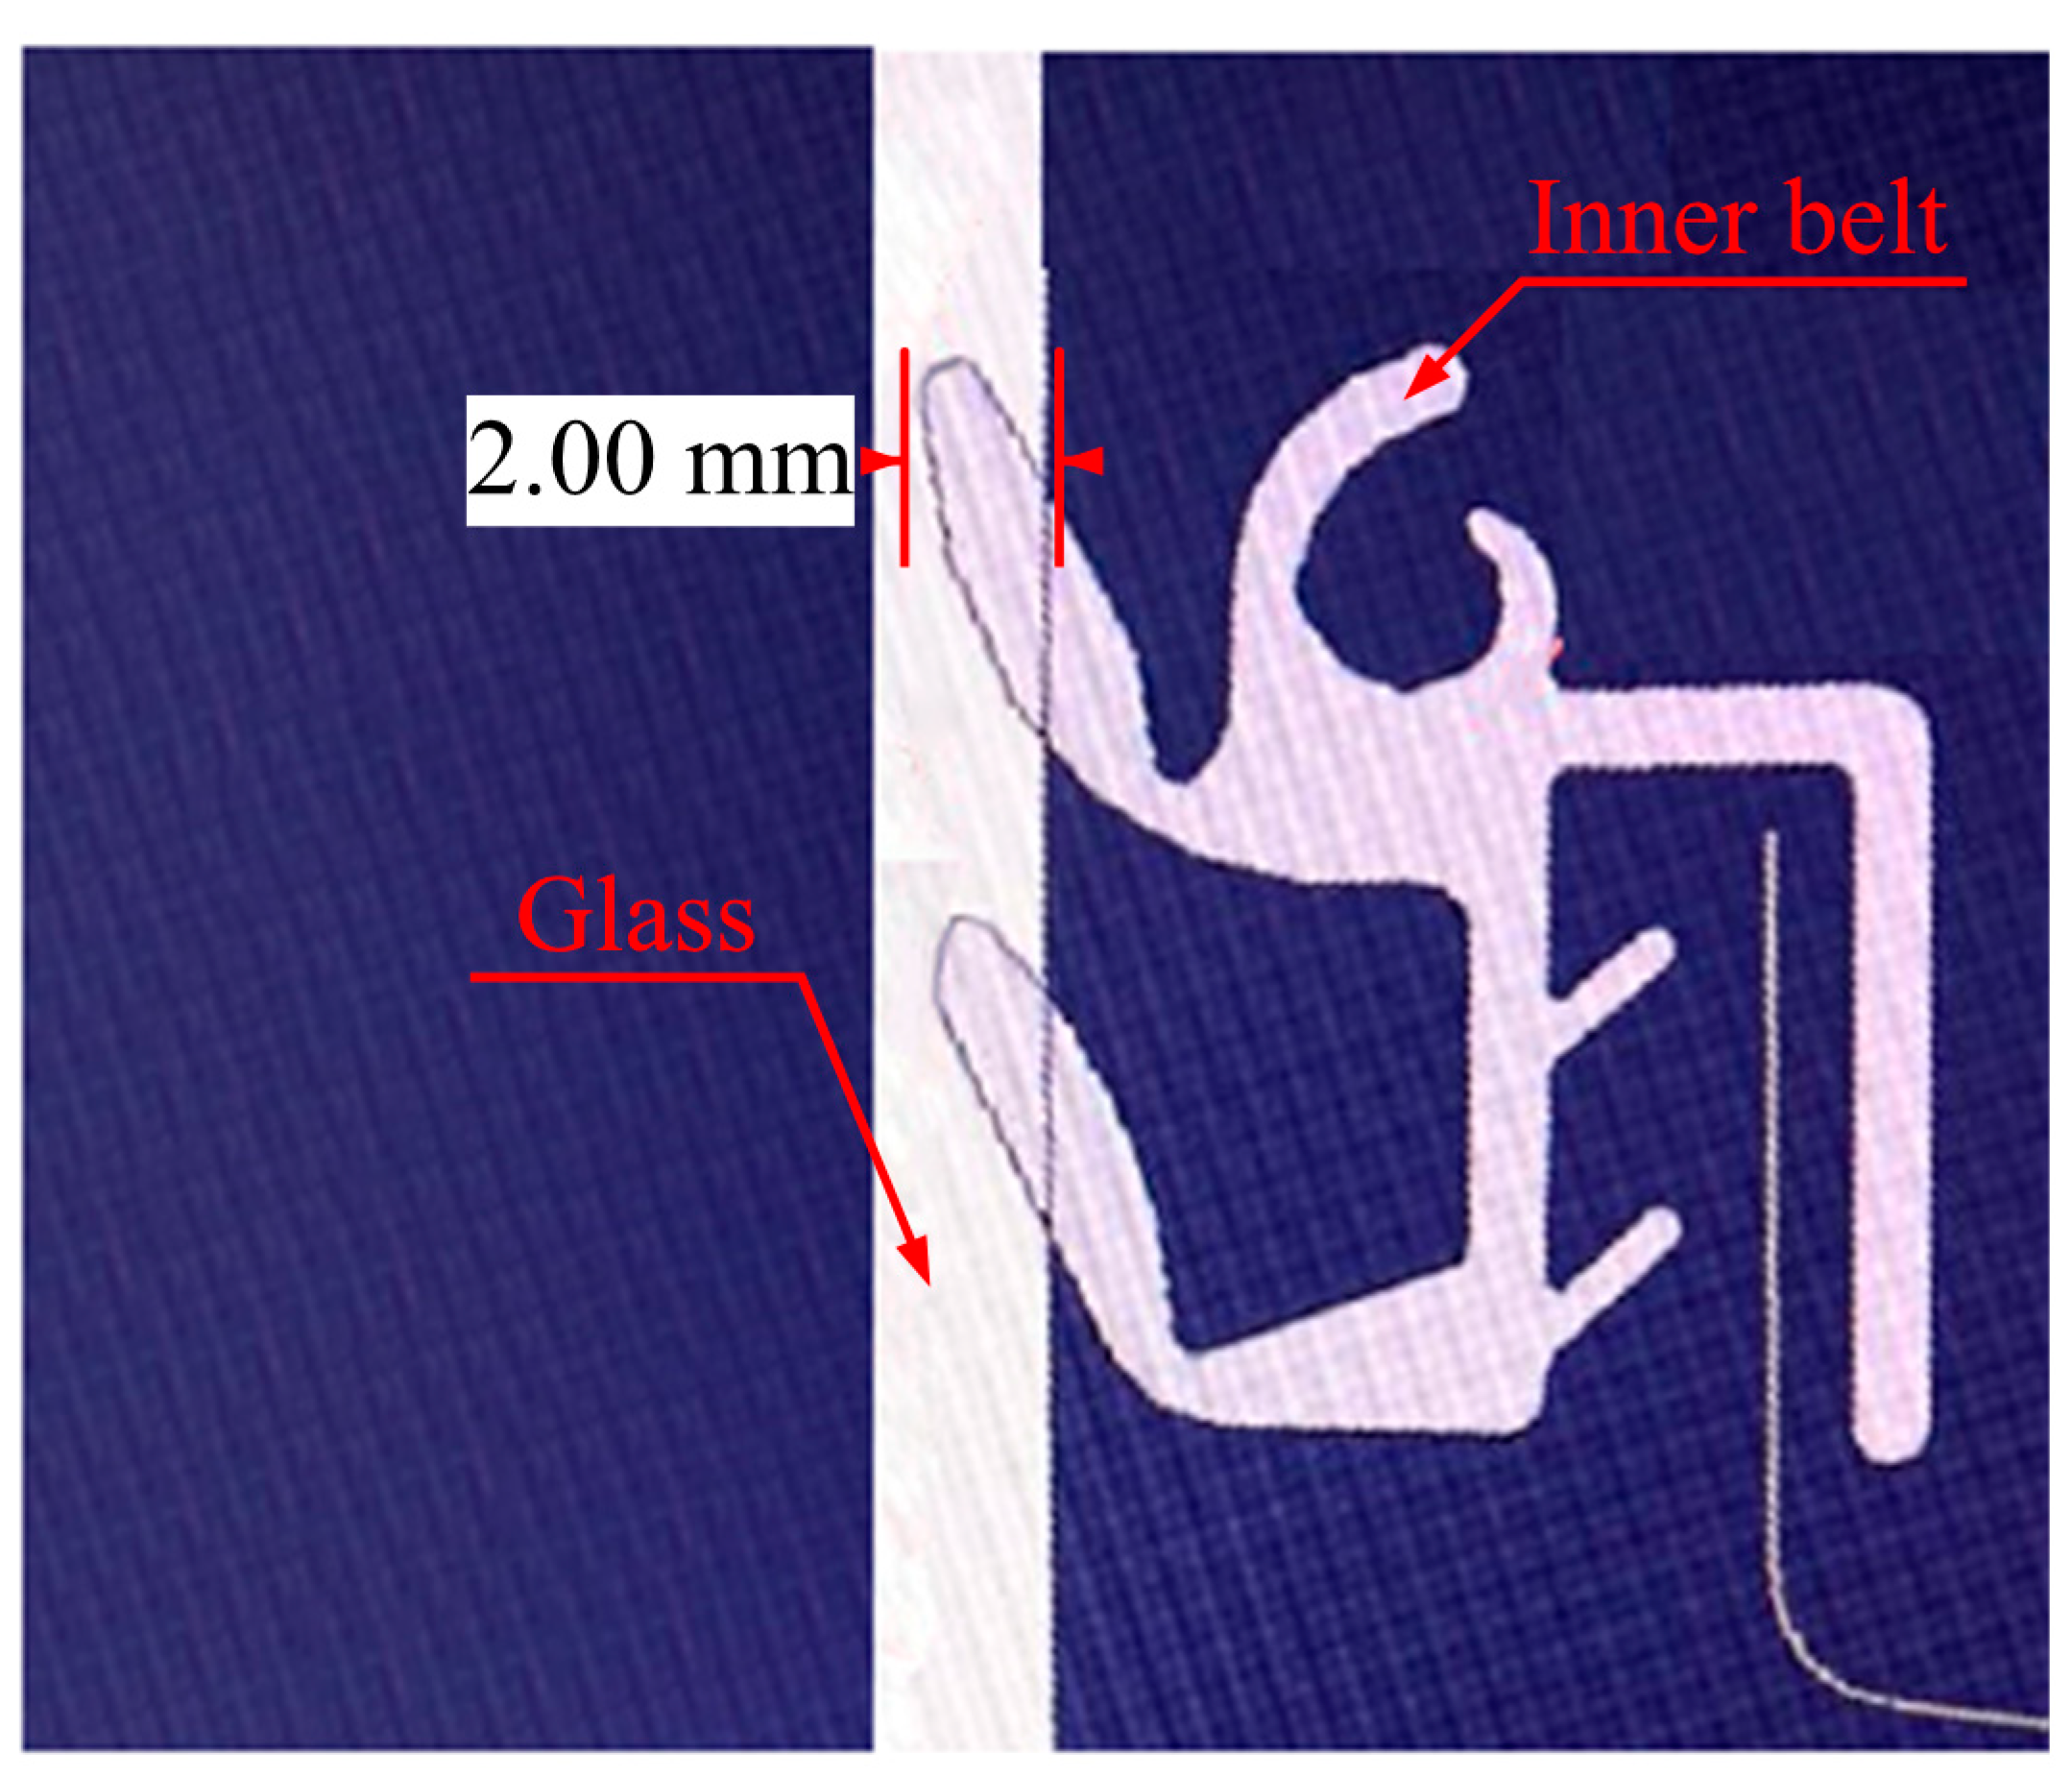
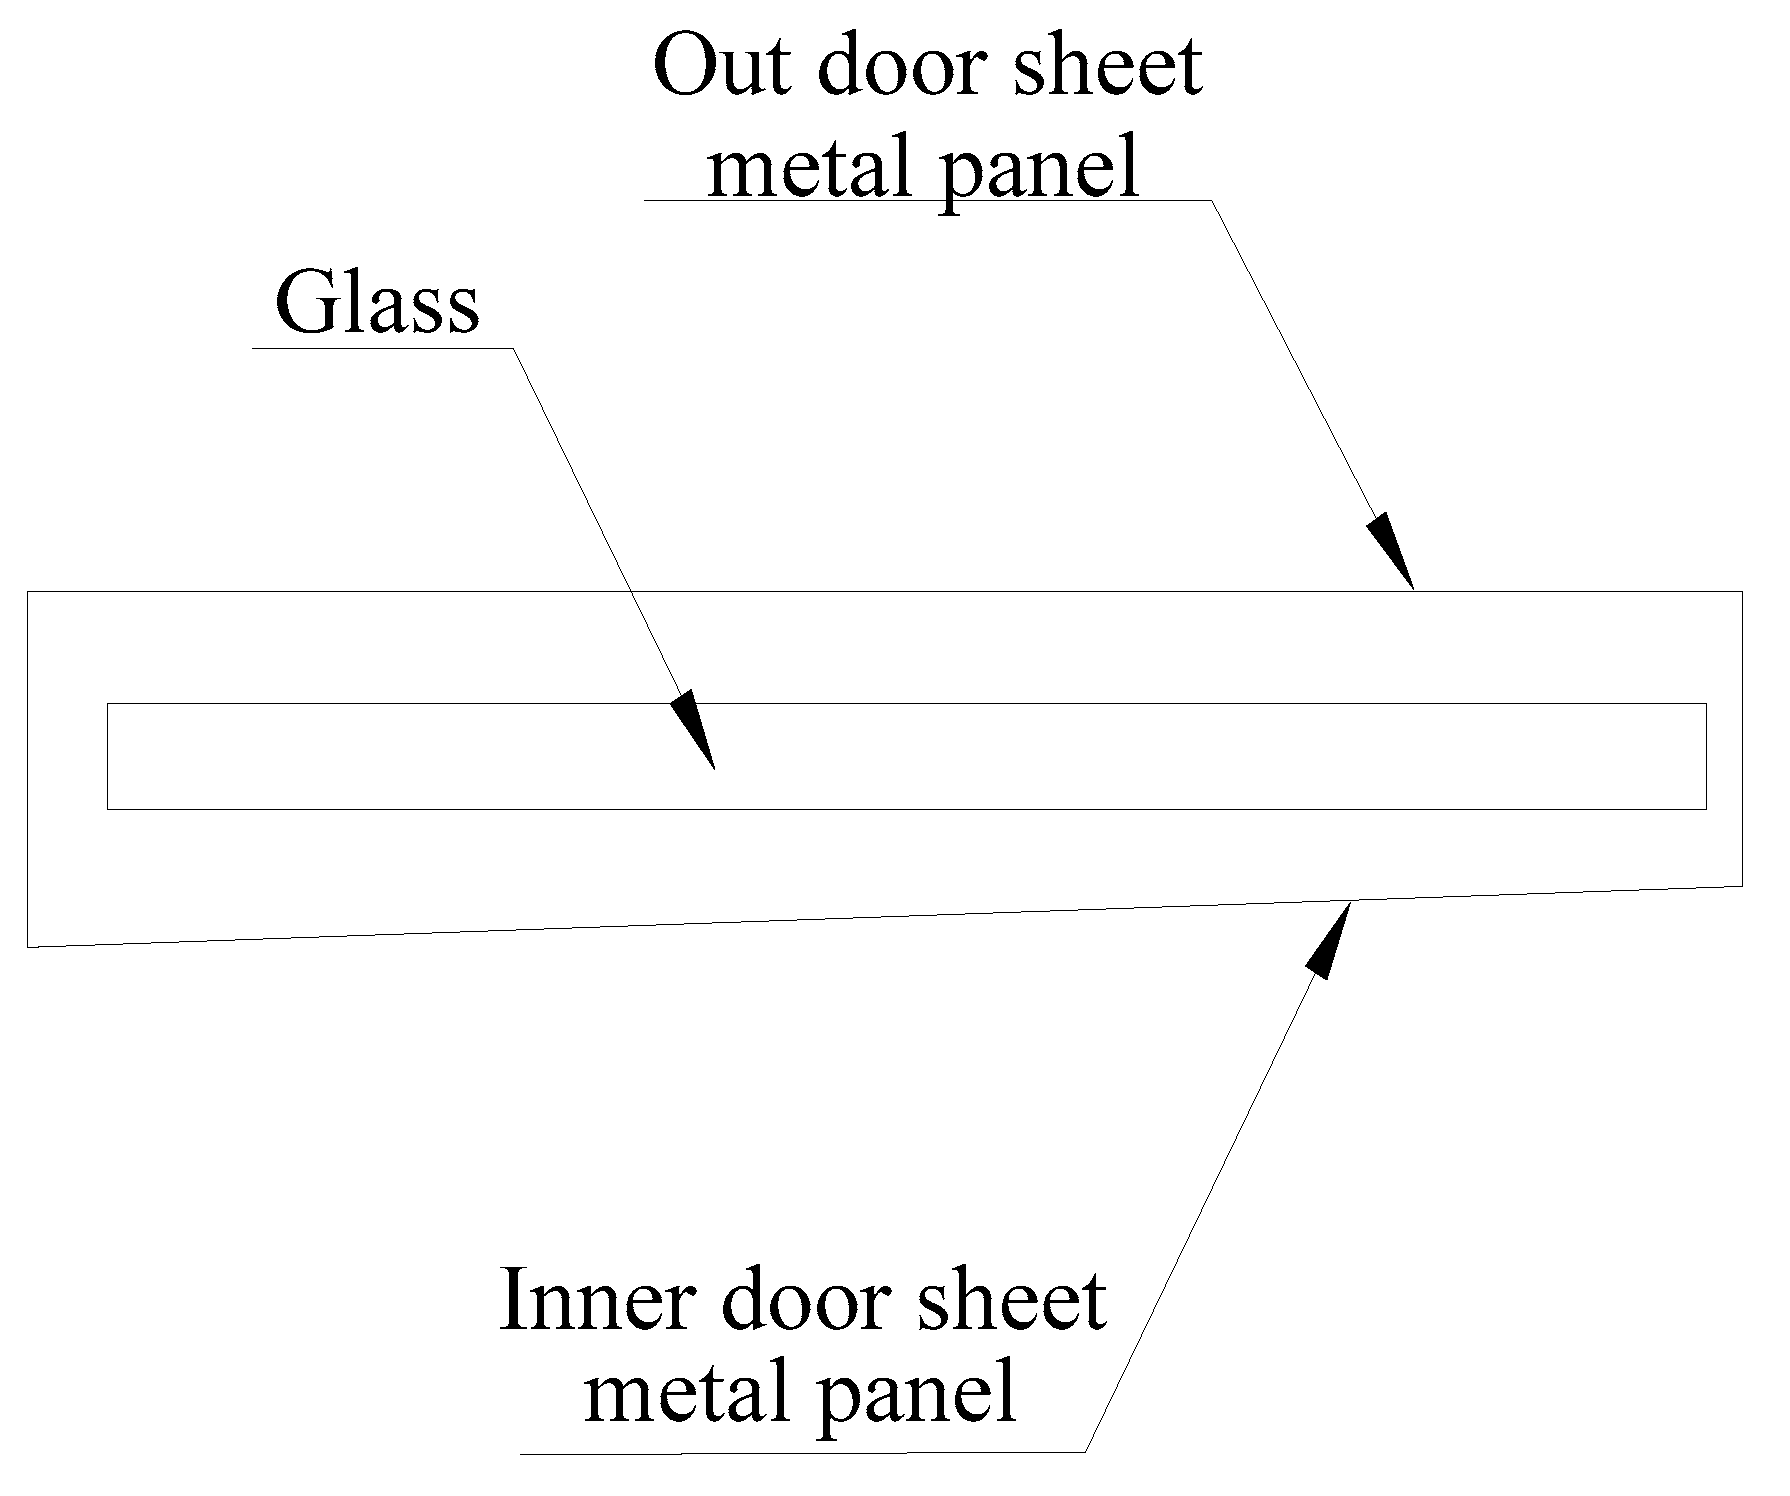
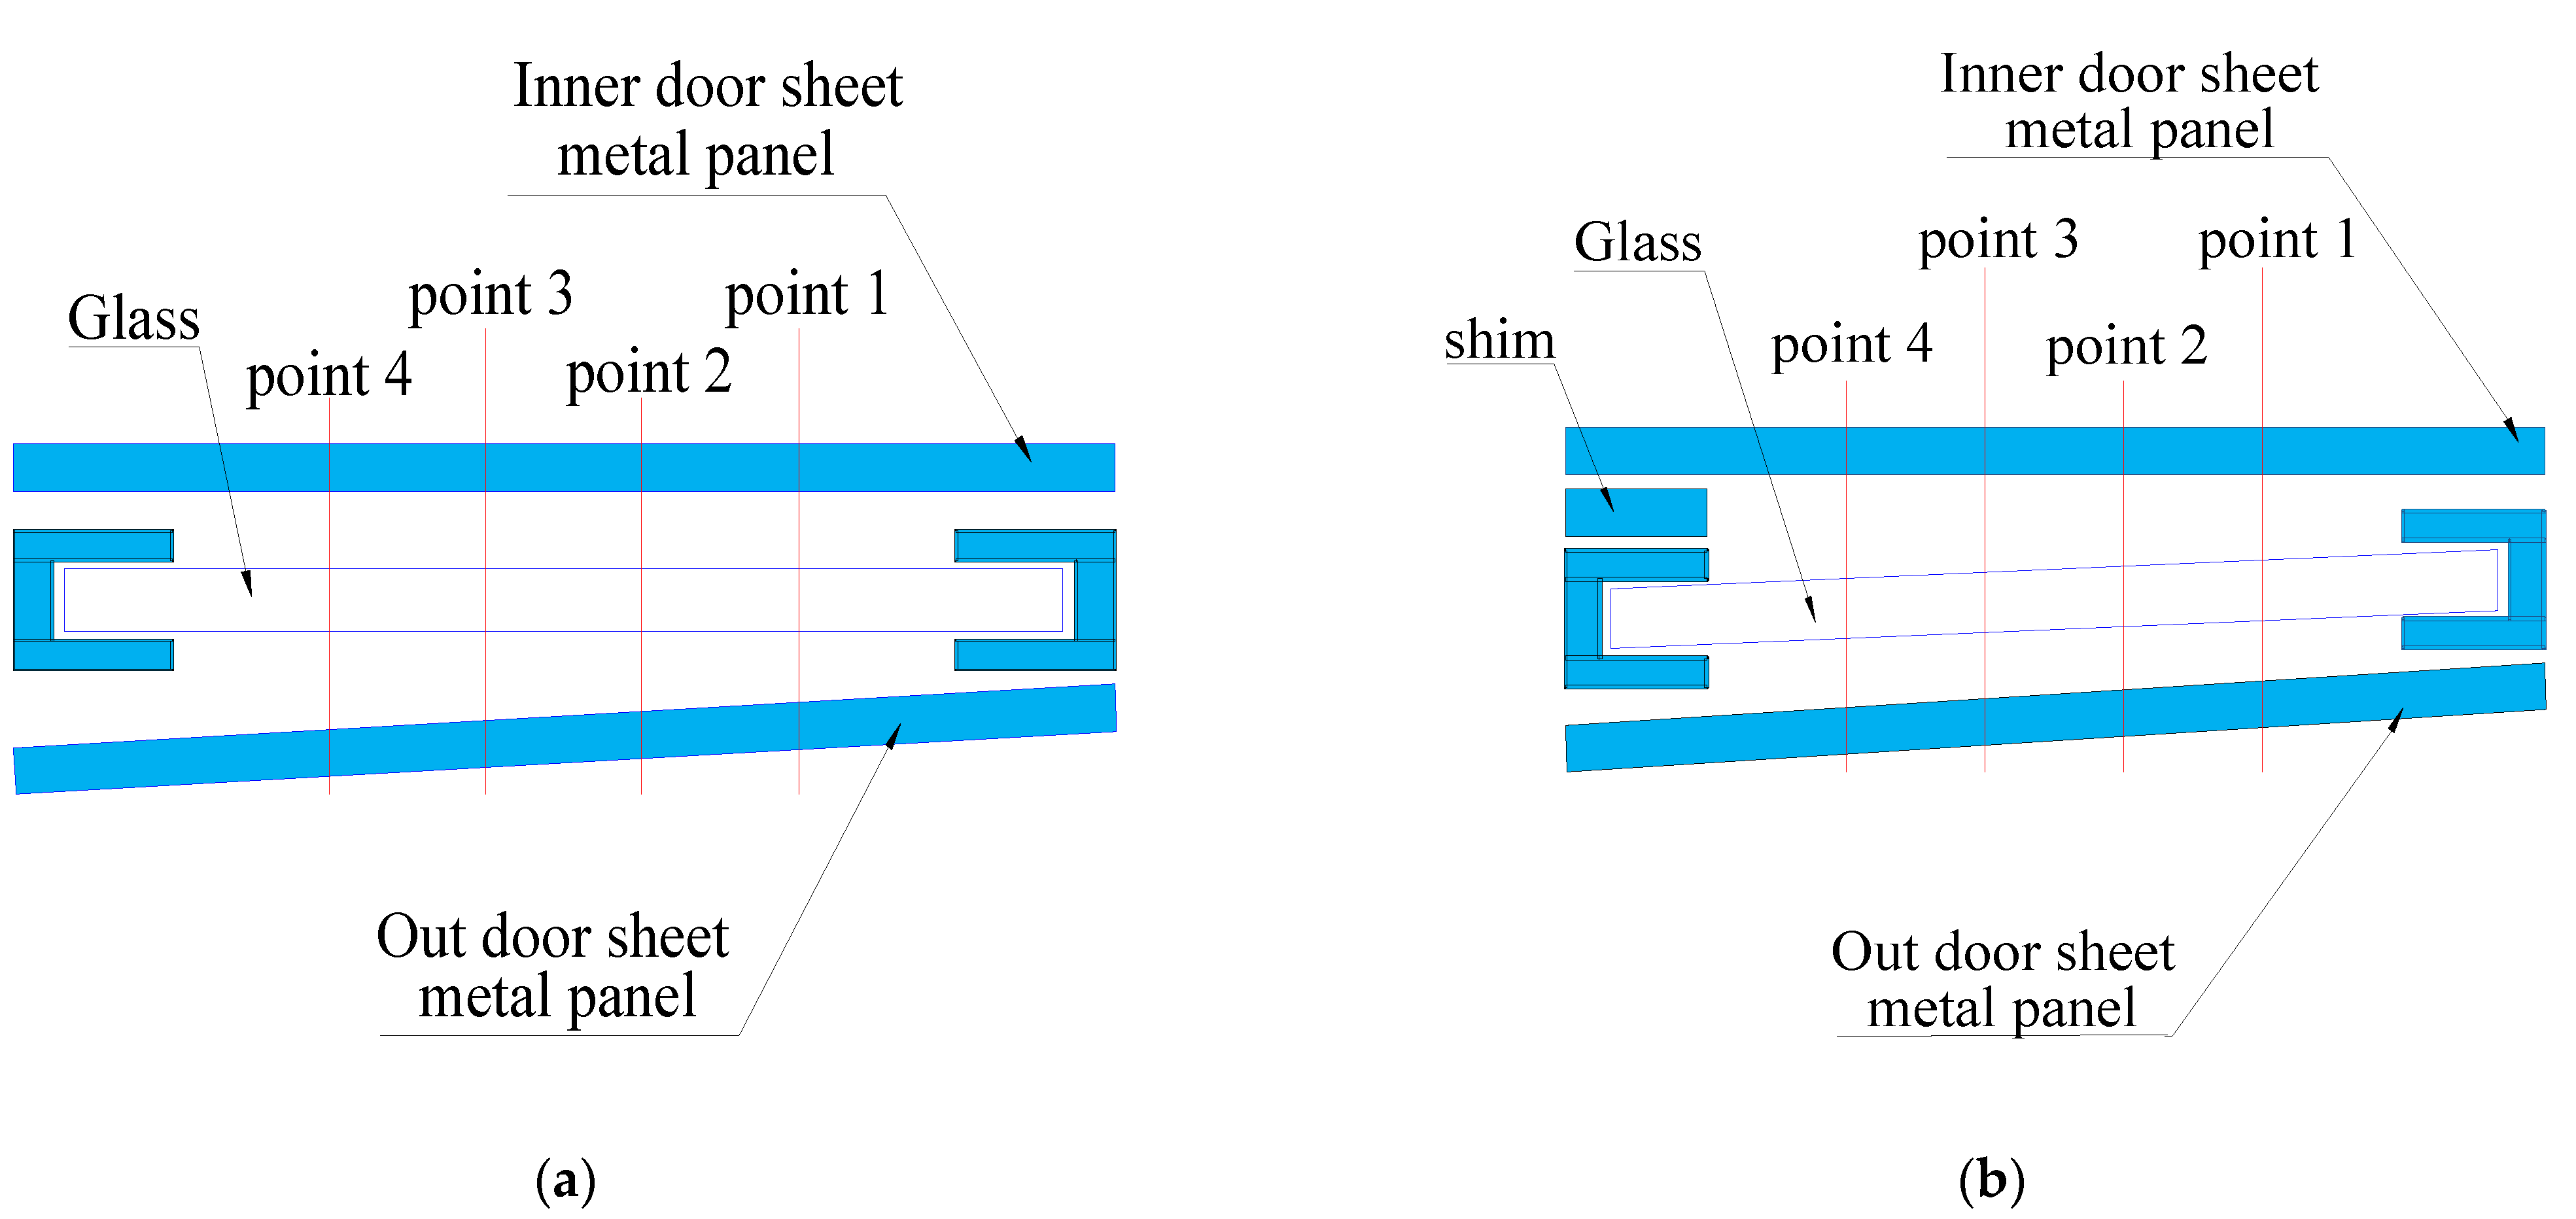
2.5. Coordination between Glass and Inner Belt
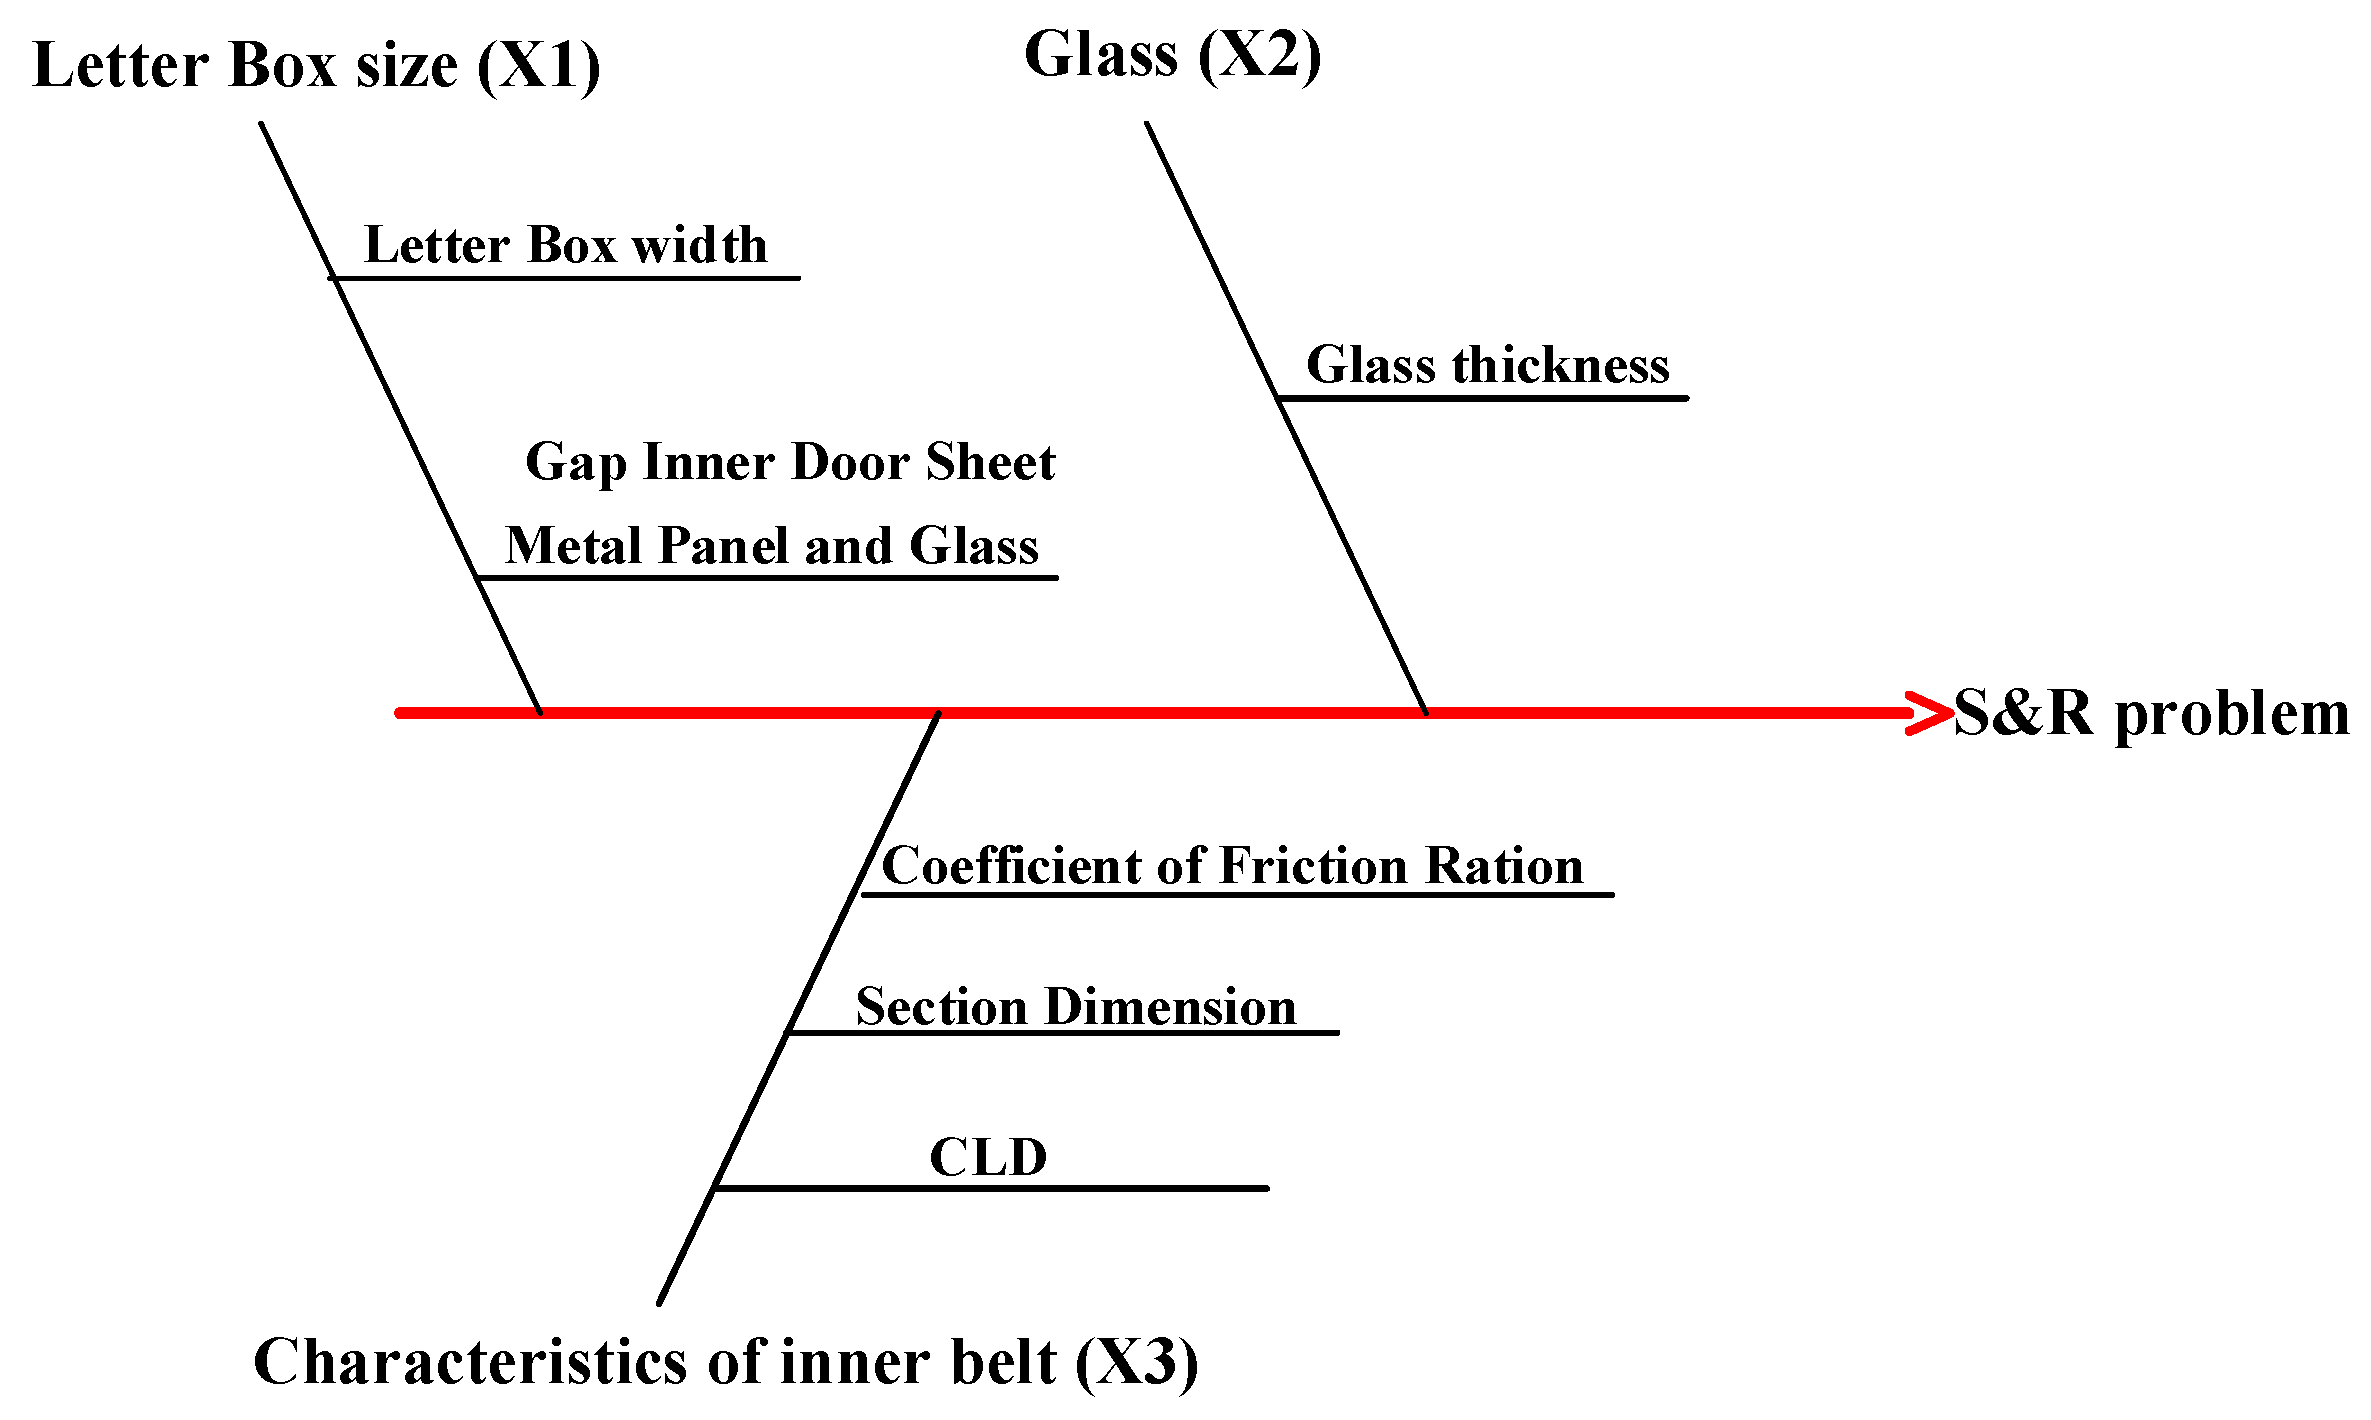
3. Analysis of S&R Problem Based on the 6 Sigma Method
3.1. Definition of the 6 Sigma Method
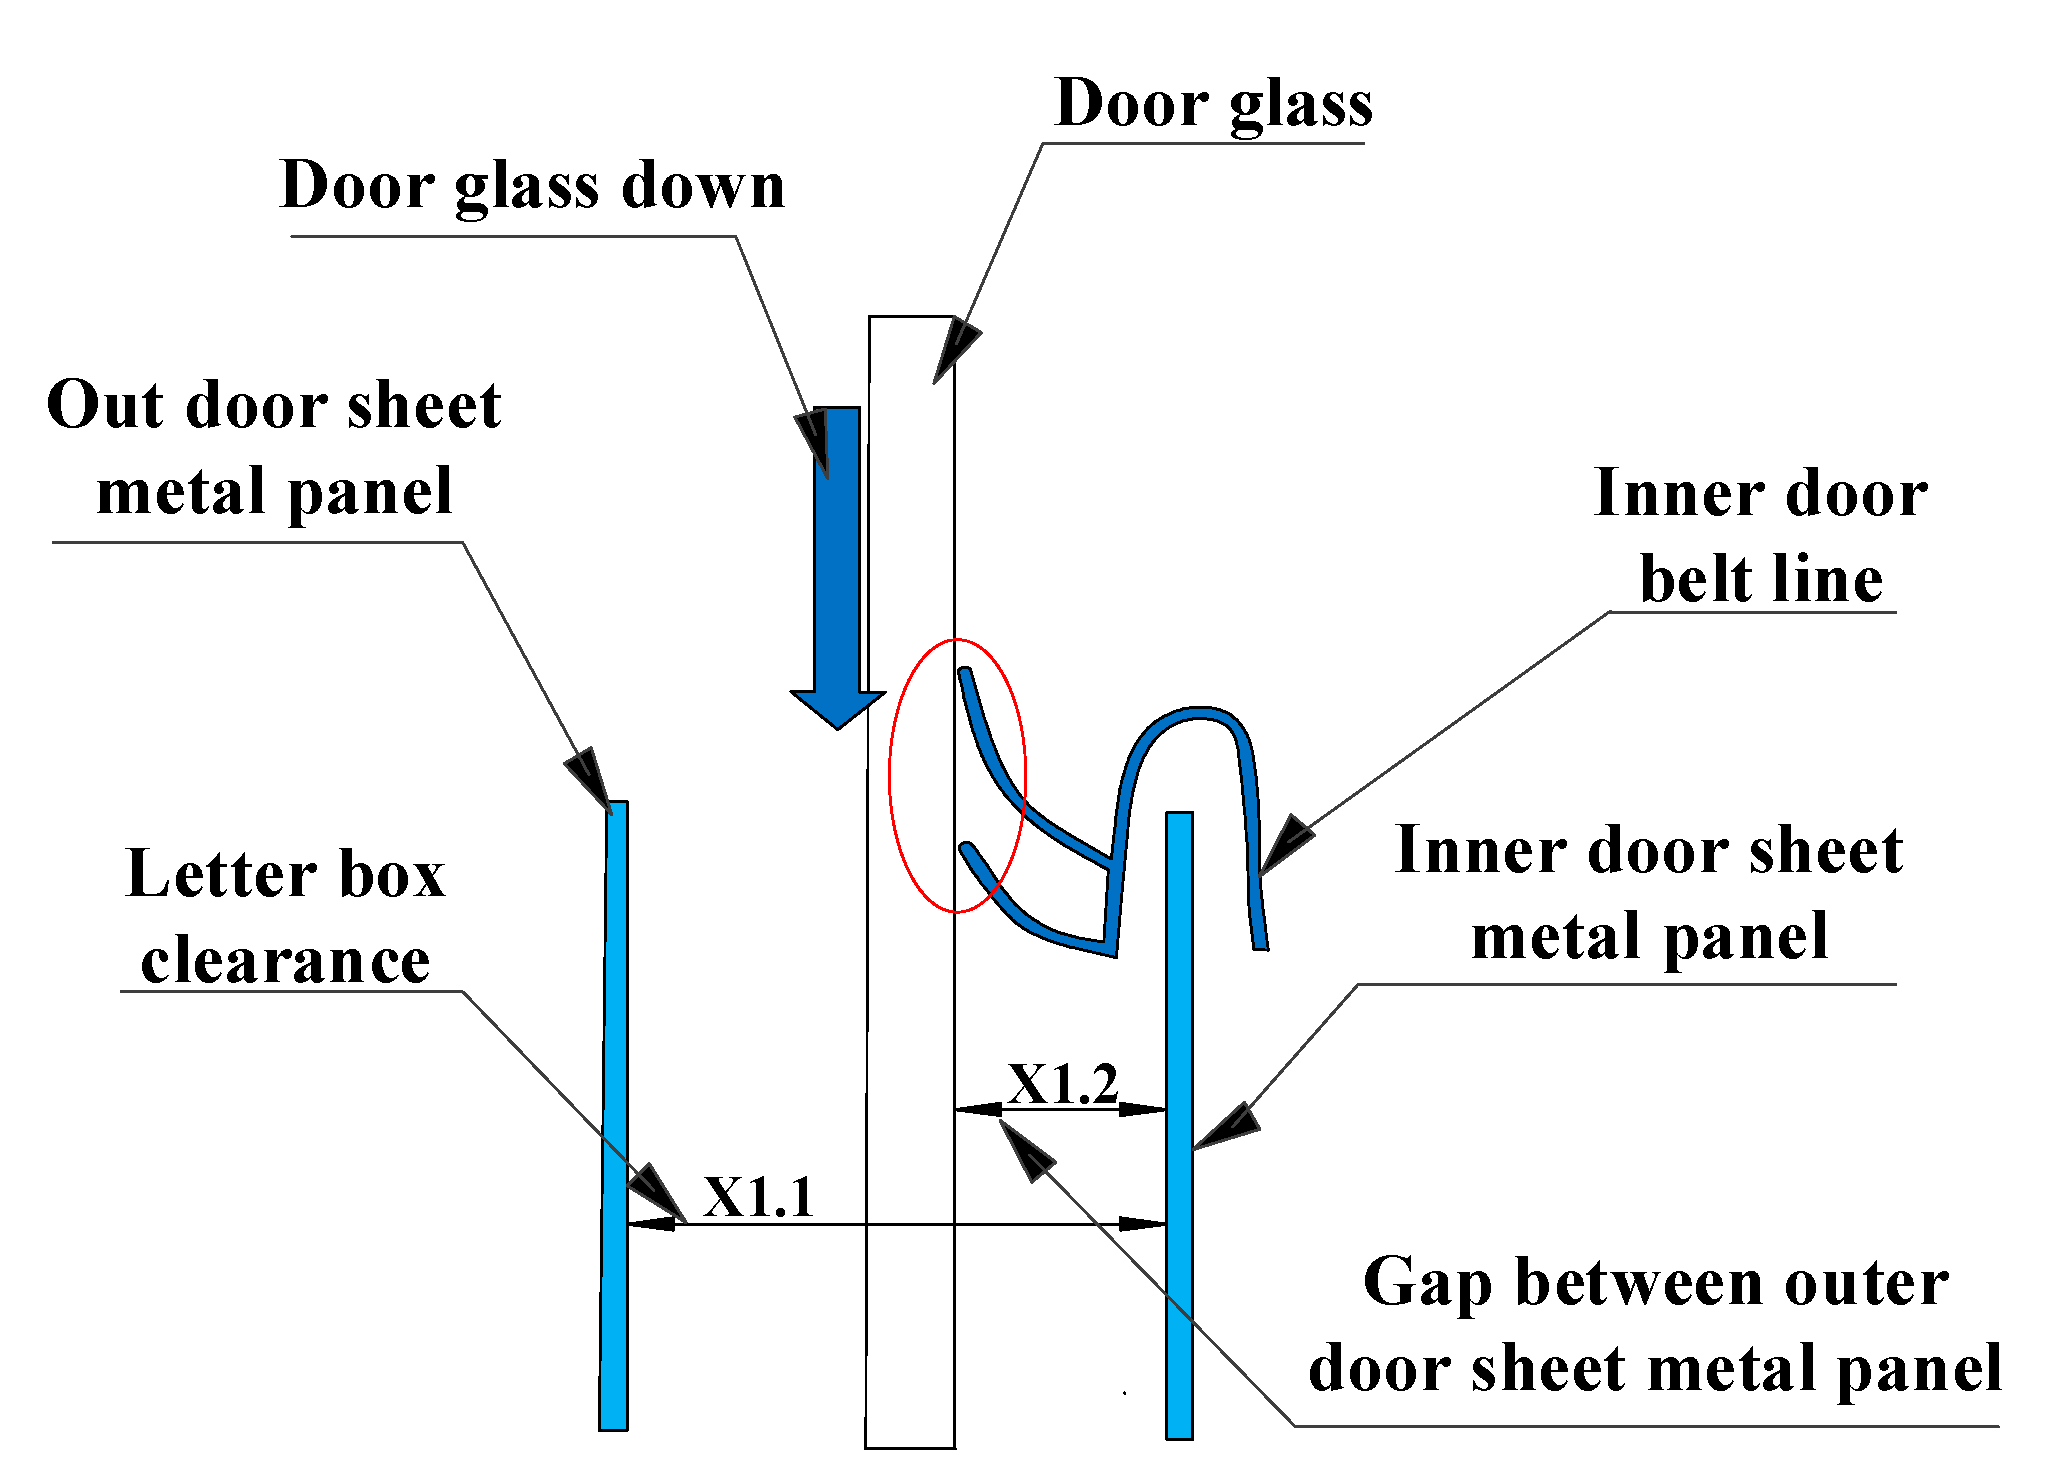
3.2. Analysis of X1 Using the 6 Sigma Method
3.2.1. Measurement
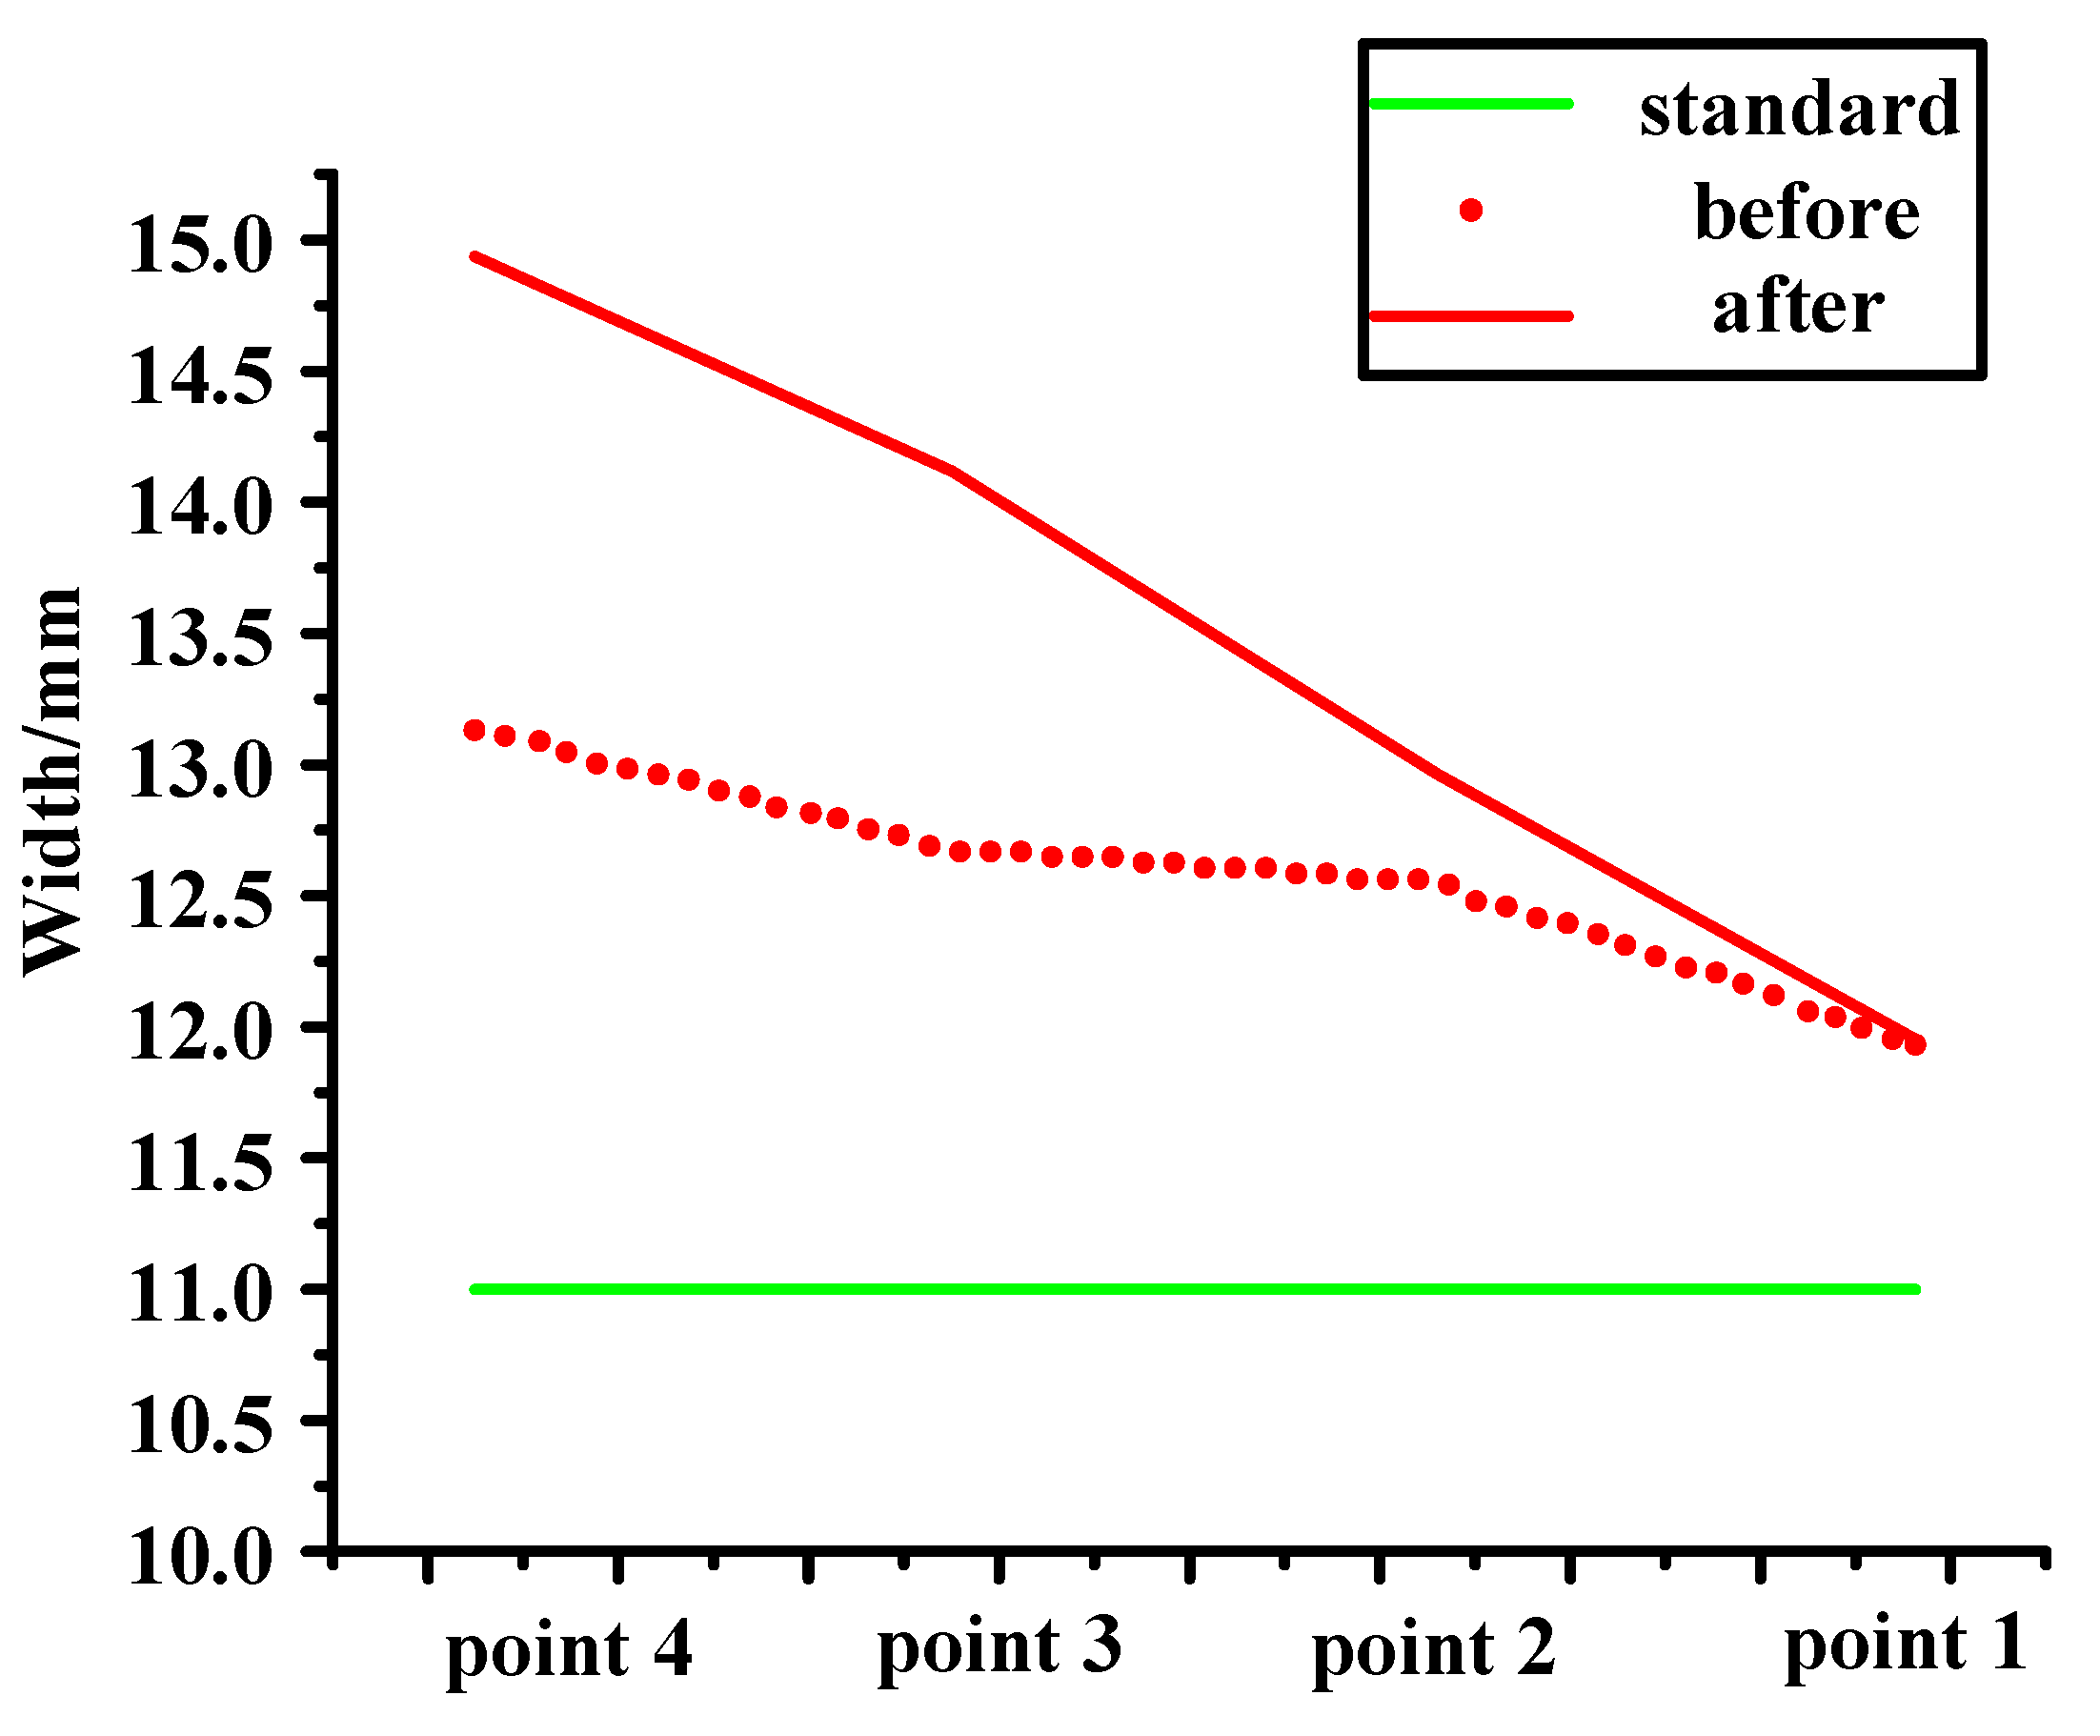
3.2.2. Improvement
3.2.3. Analysis
3.2.4. Control (Verification)
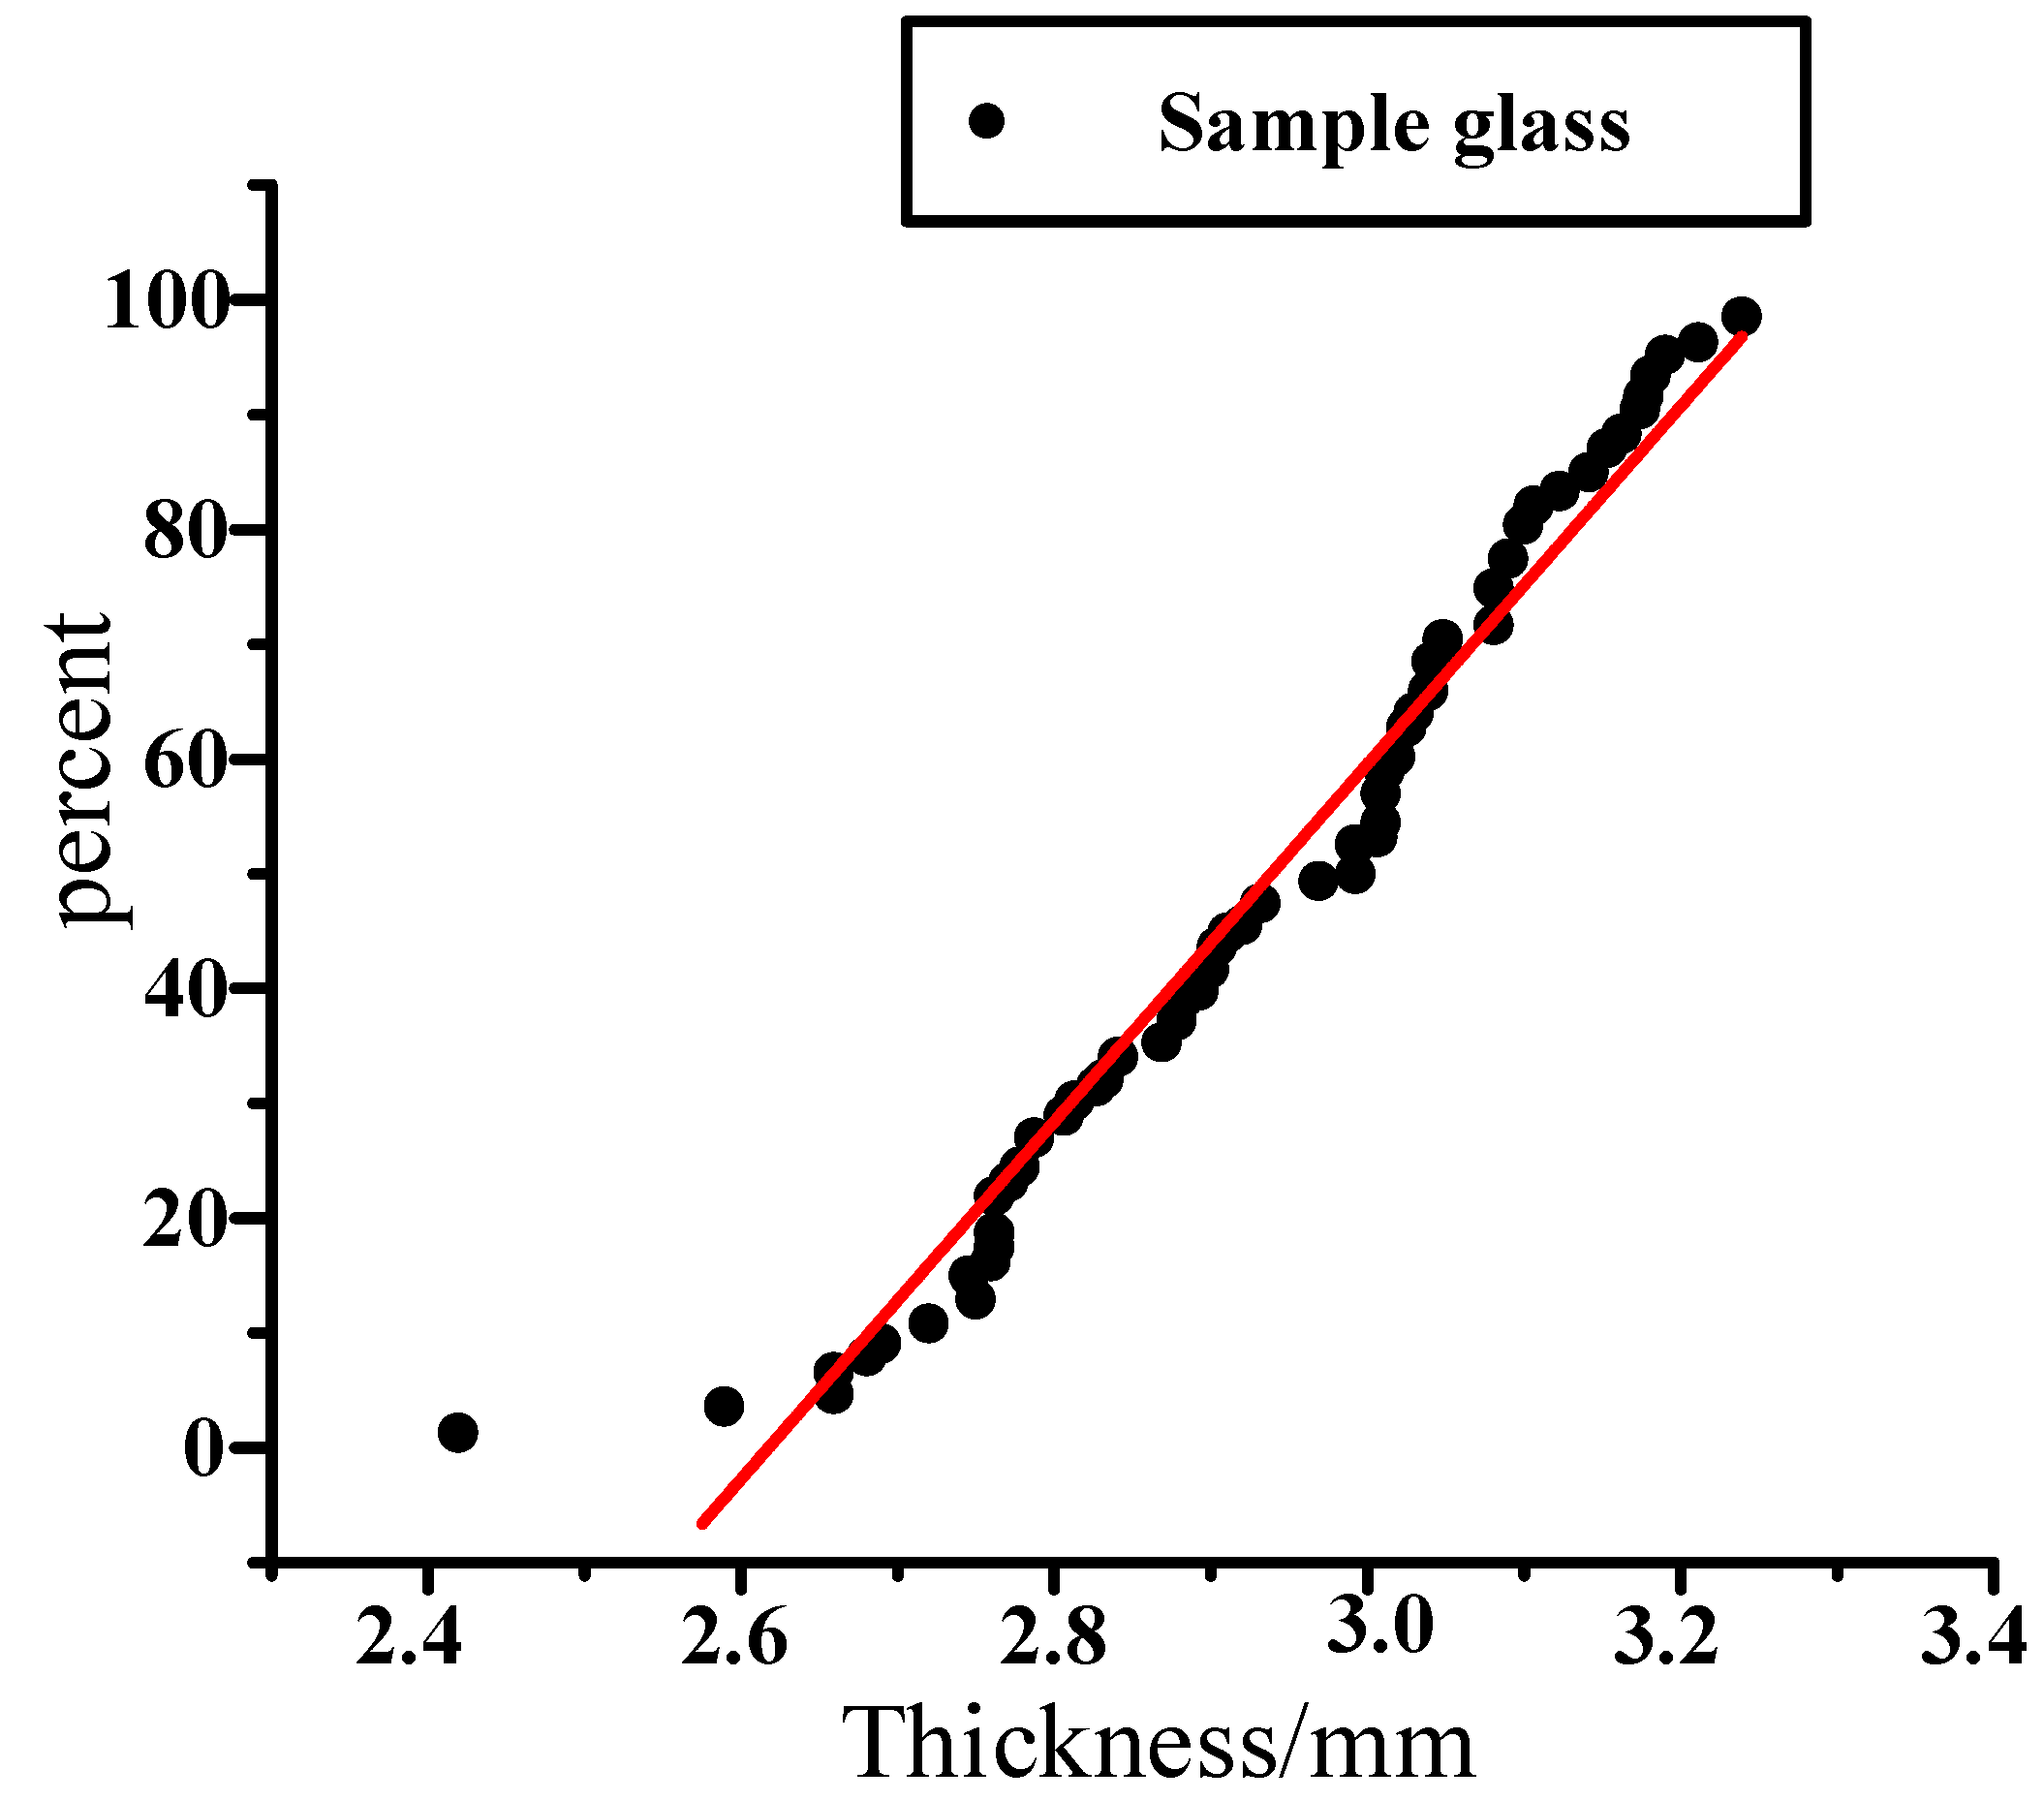
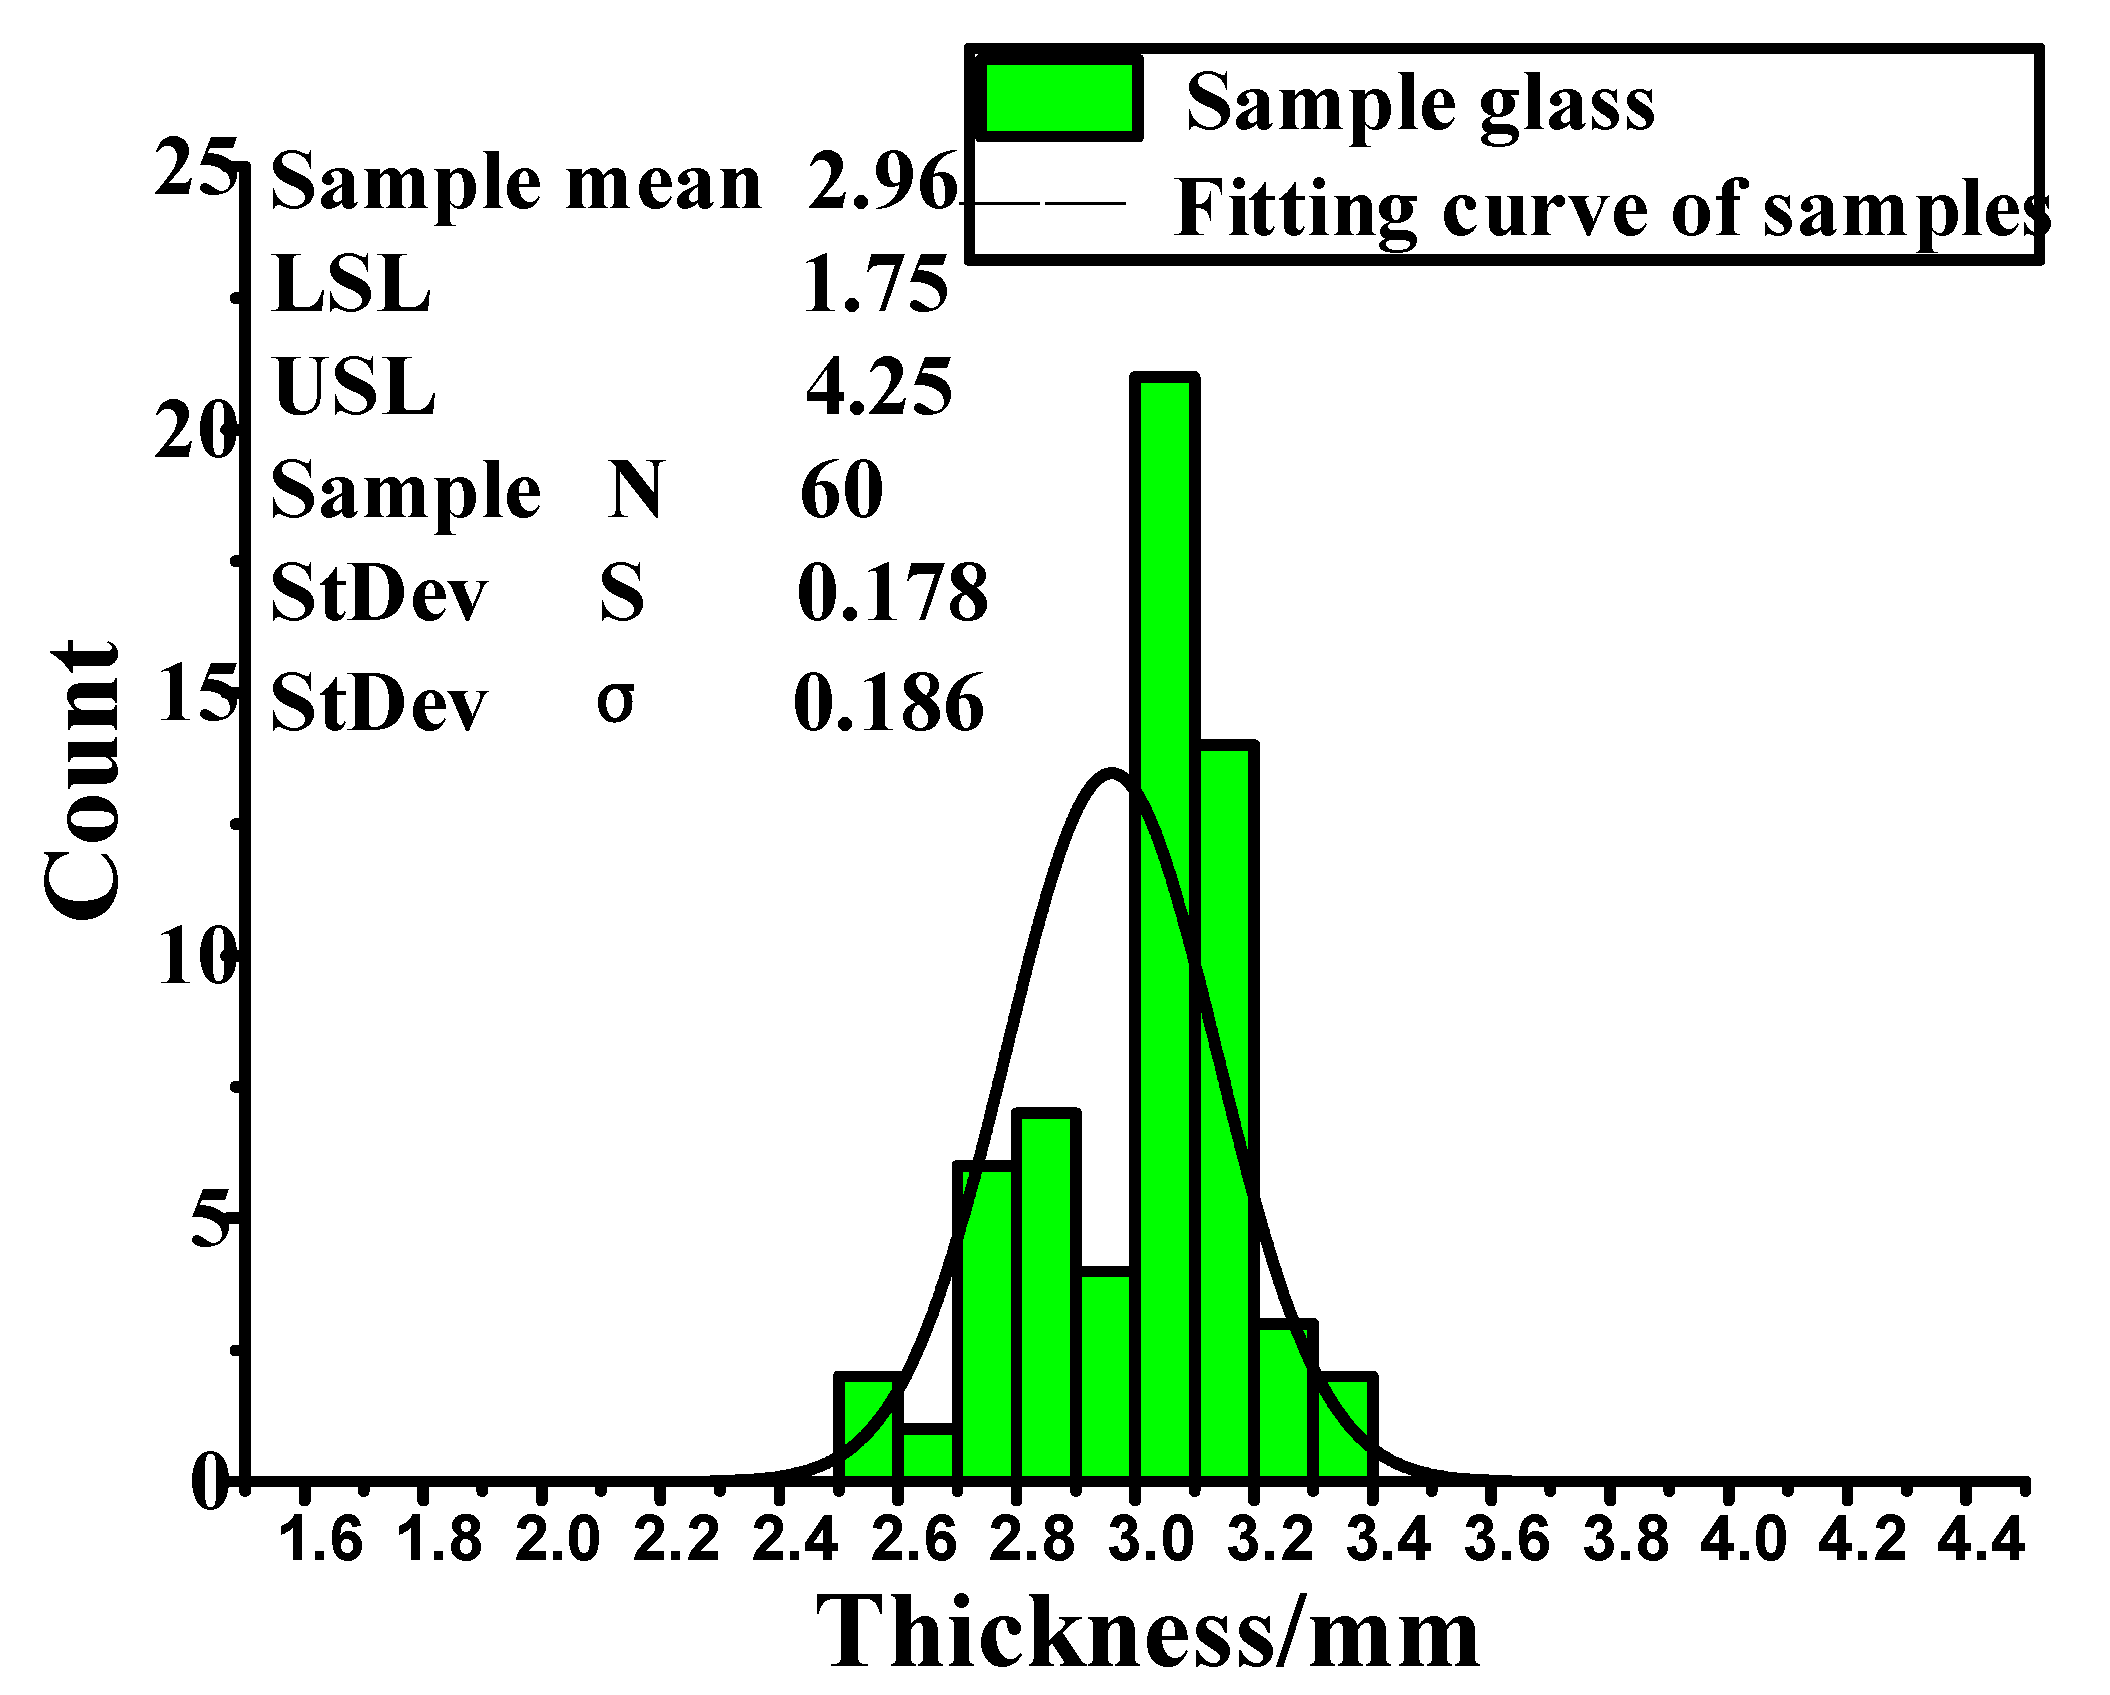
3.3. Analysis of X2 Using the 6 Sigma Method
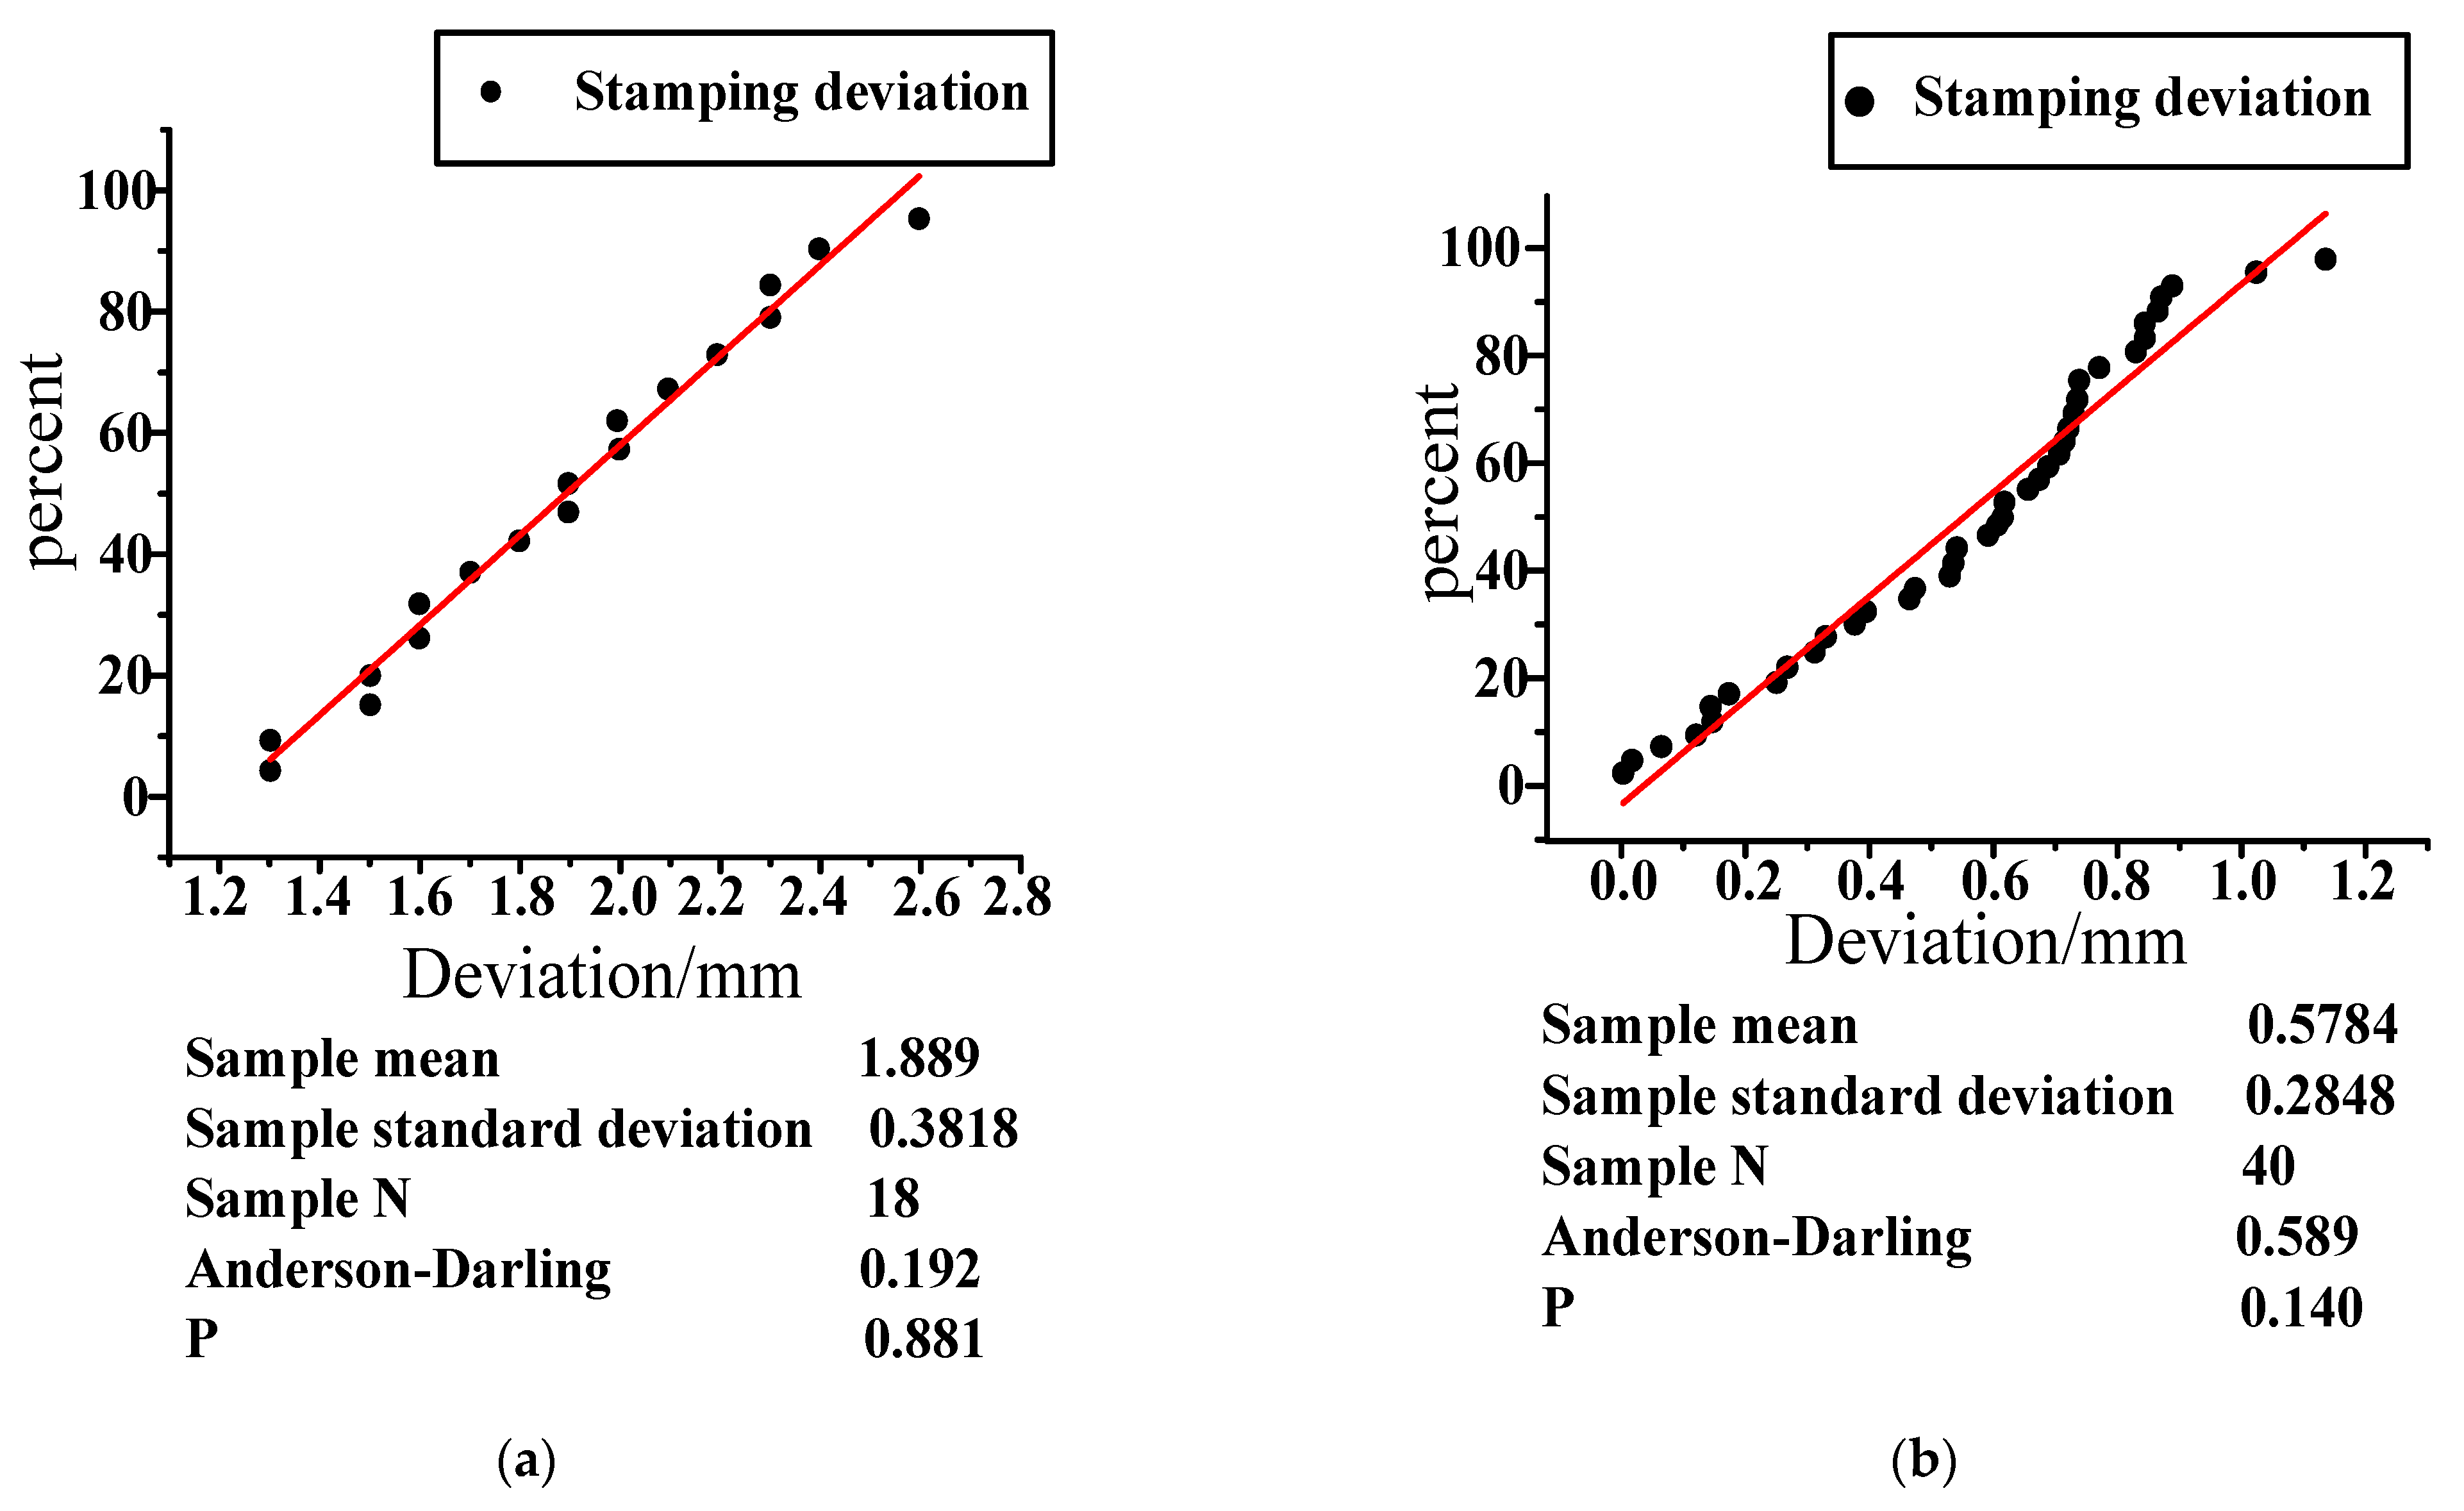
3.3.1. Measurement
3.3.2. Analysis
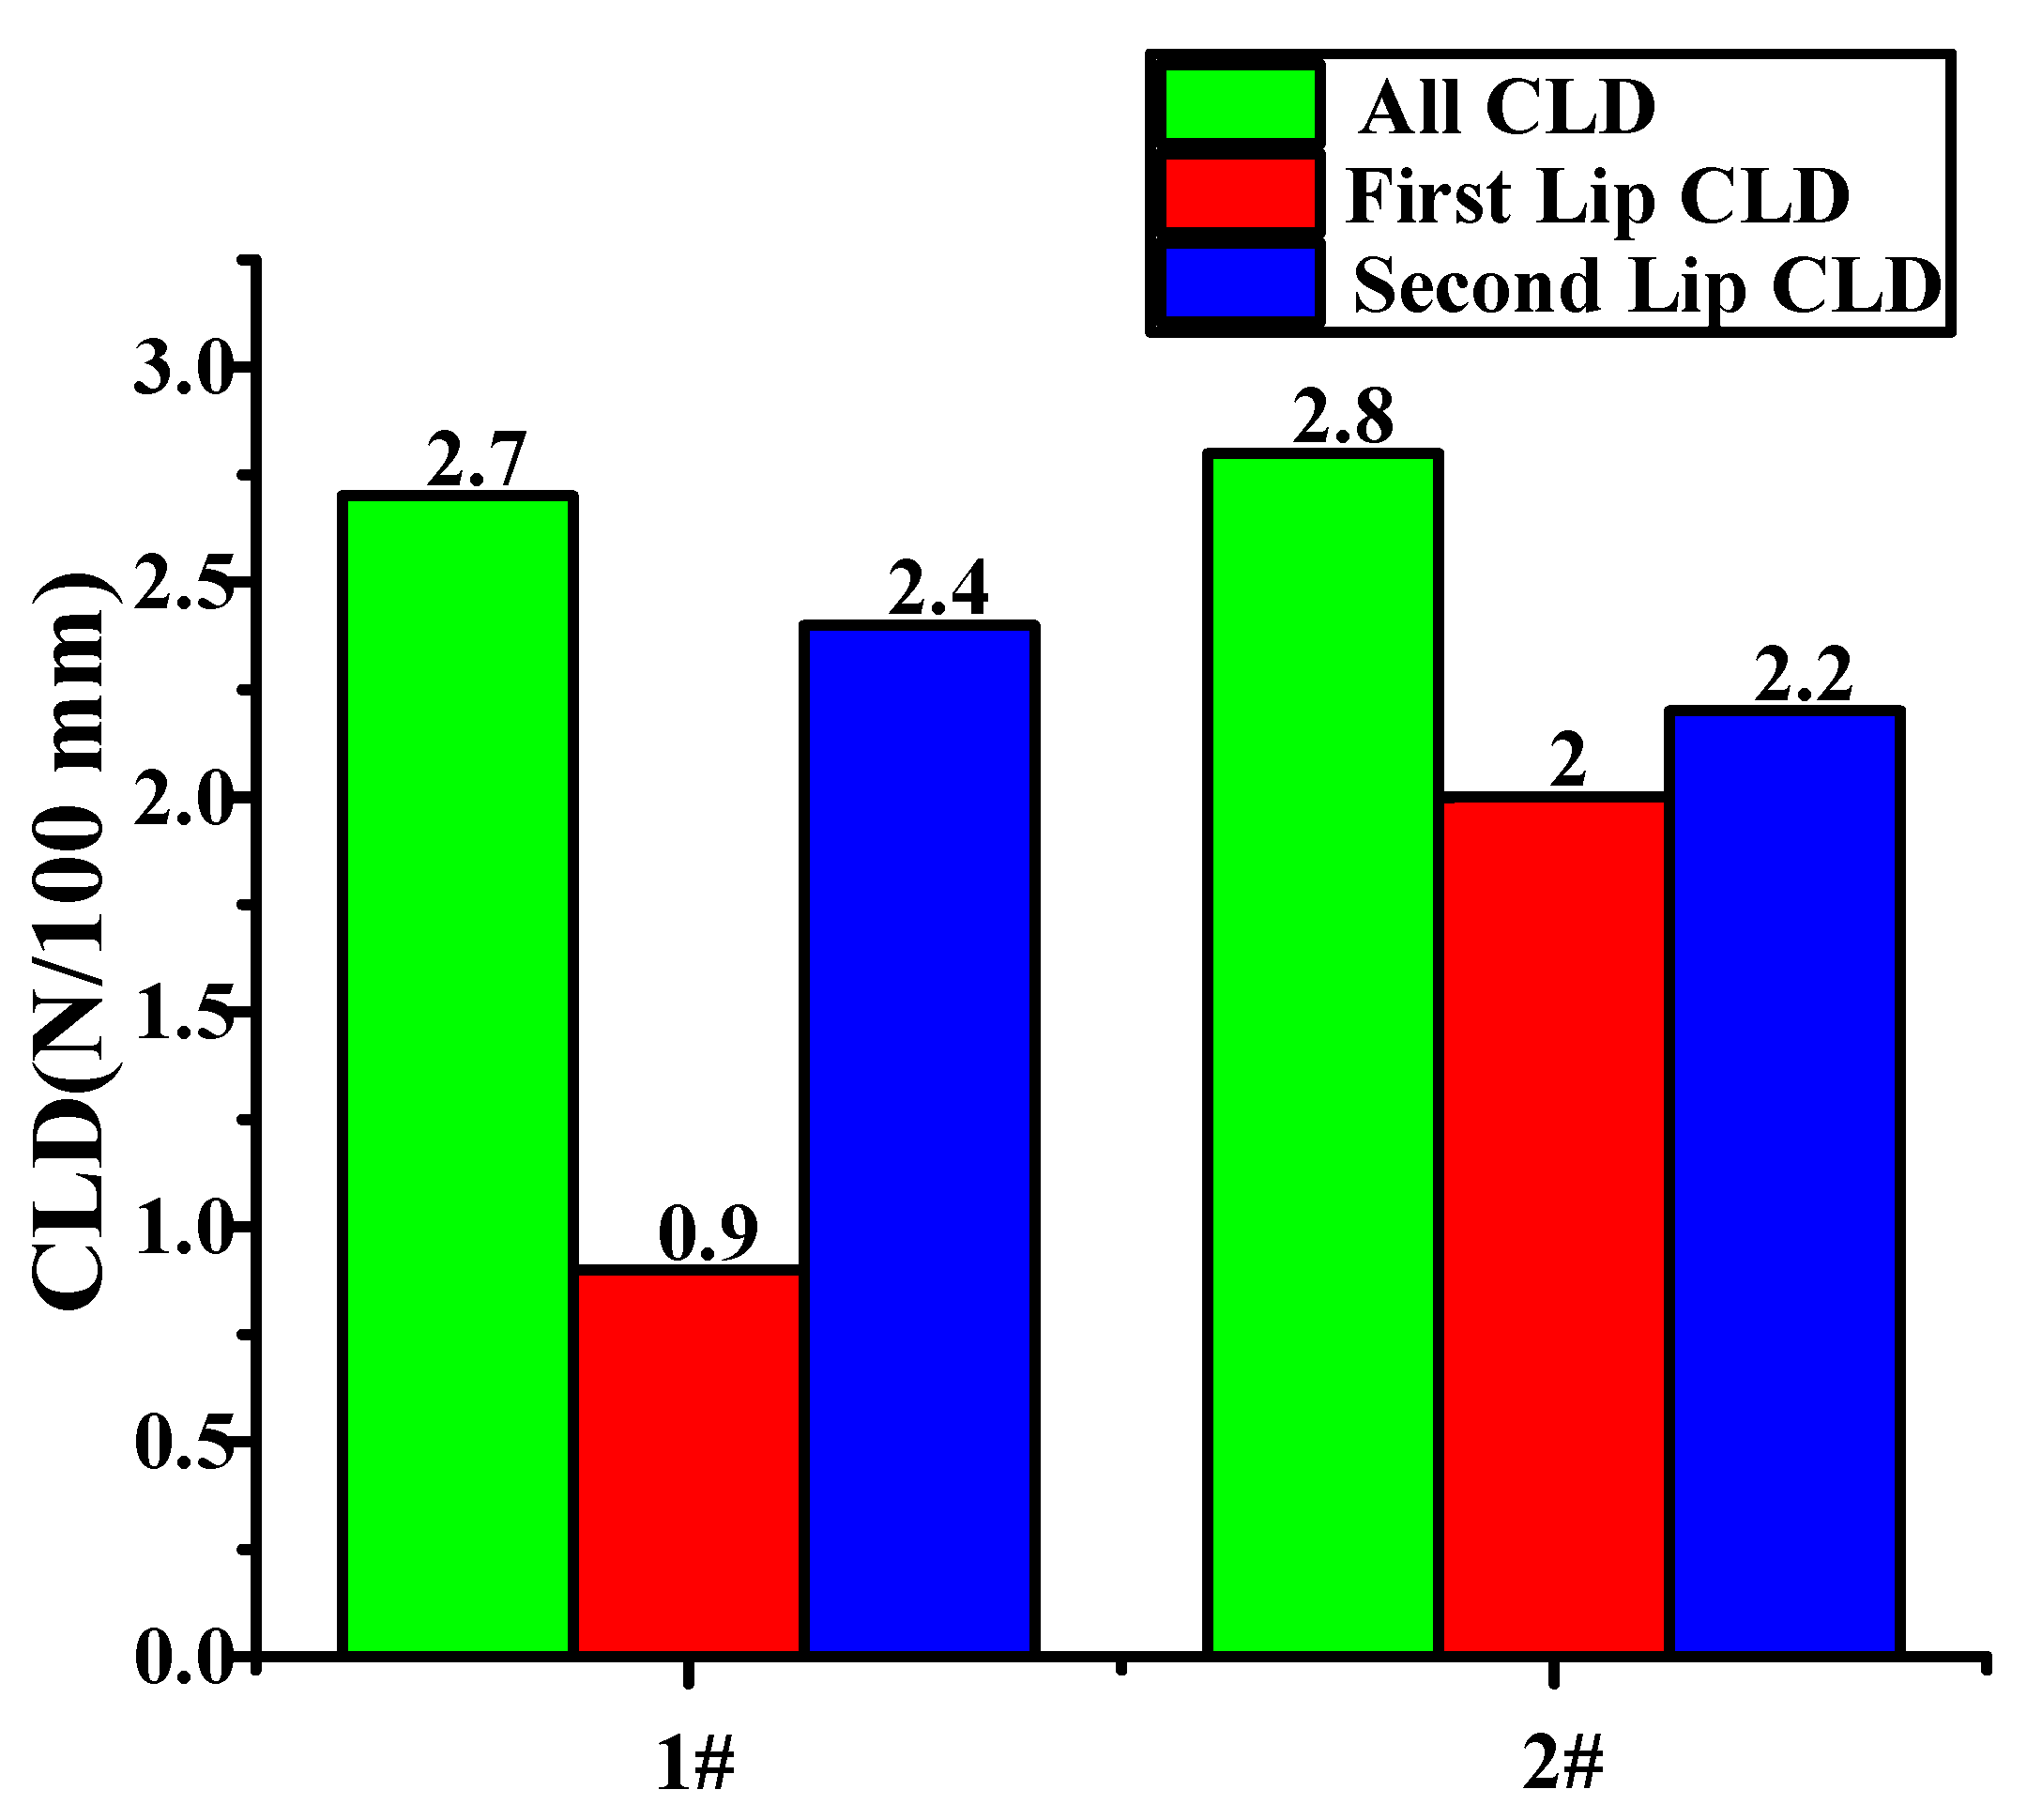
3.4. Analysis of X3 Using the 6 Sigma Method
3.4.1. Measurement
3.4.2. Analysis
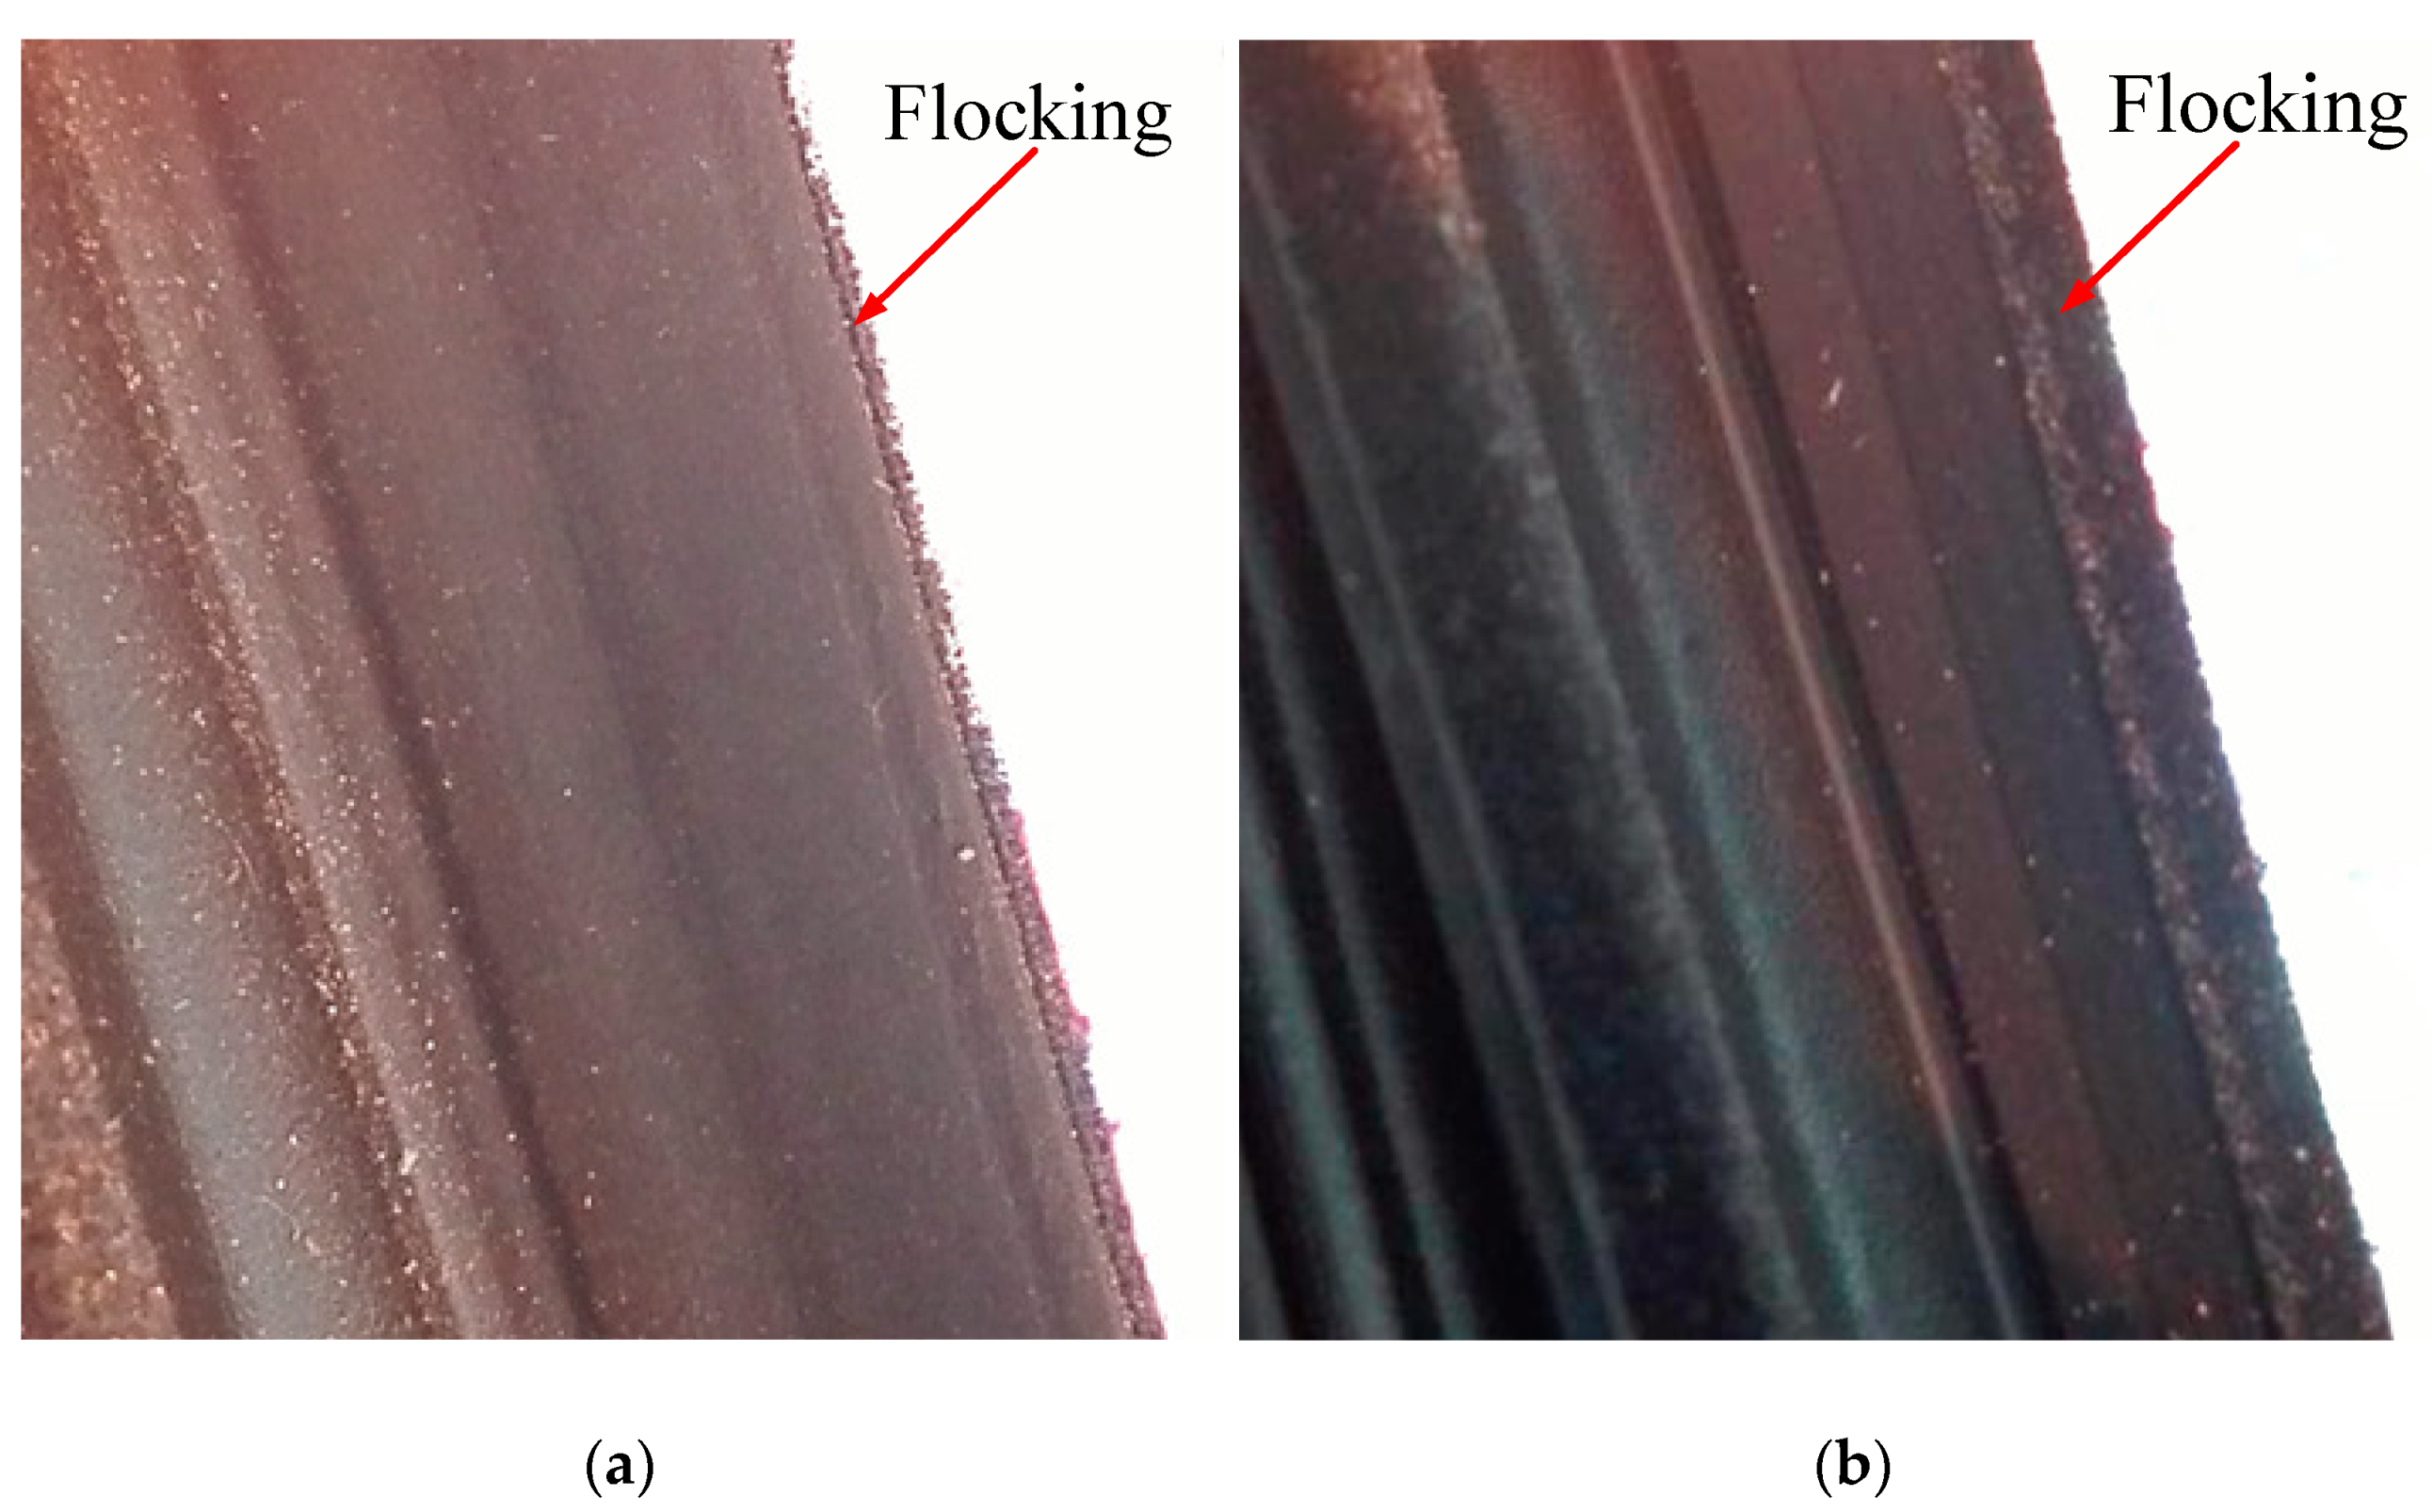
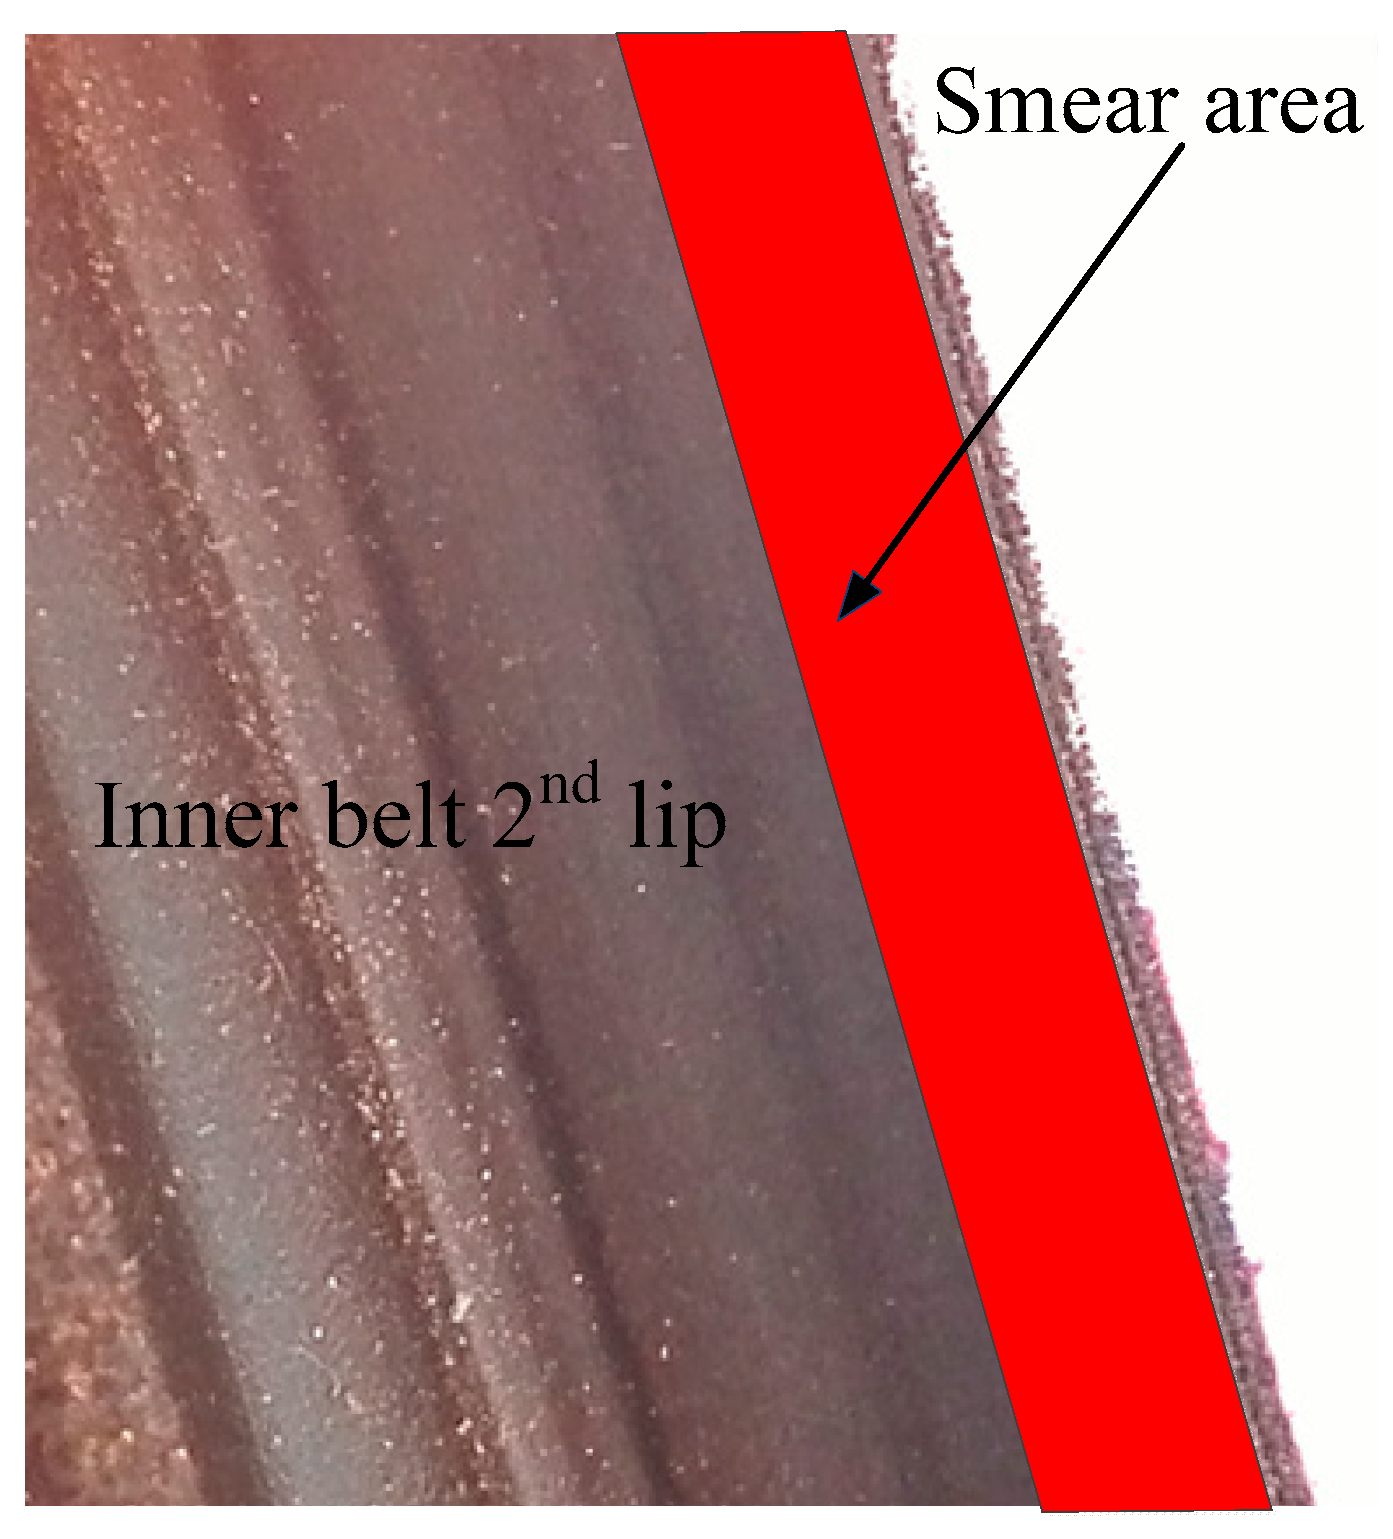
3.4.3. Improvement
3.4.4. Control (Verification)
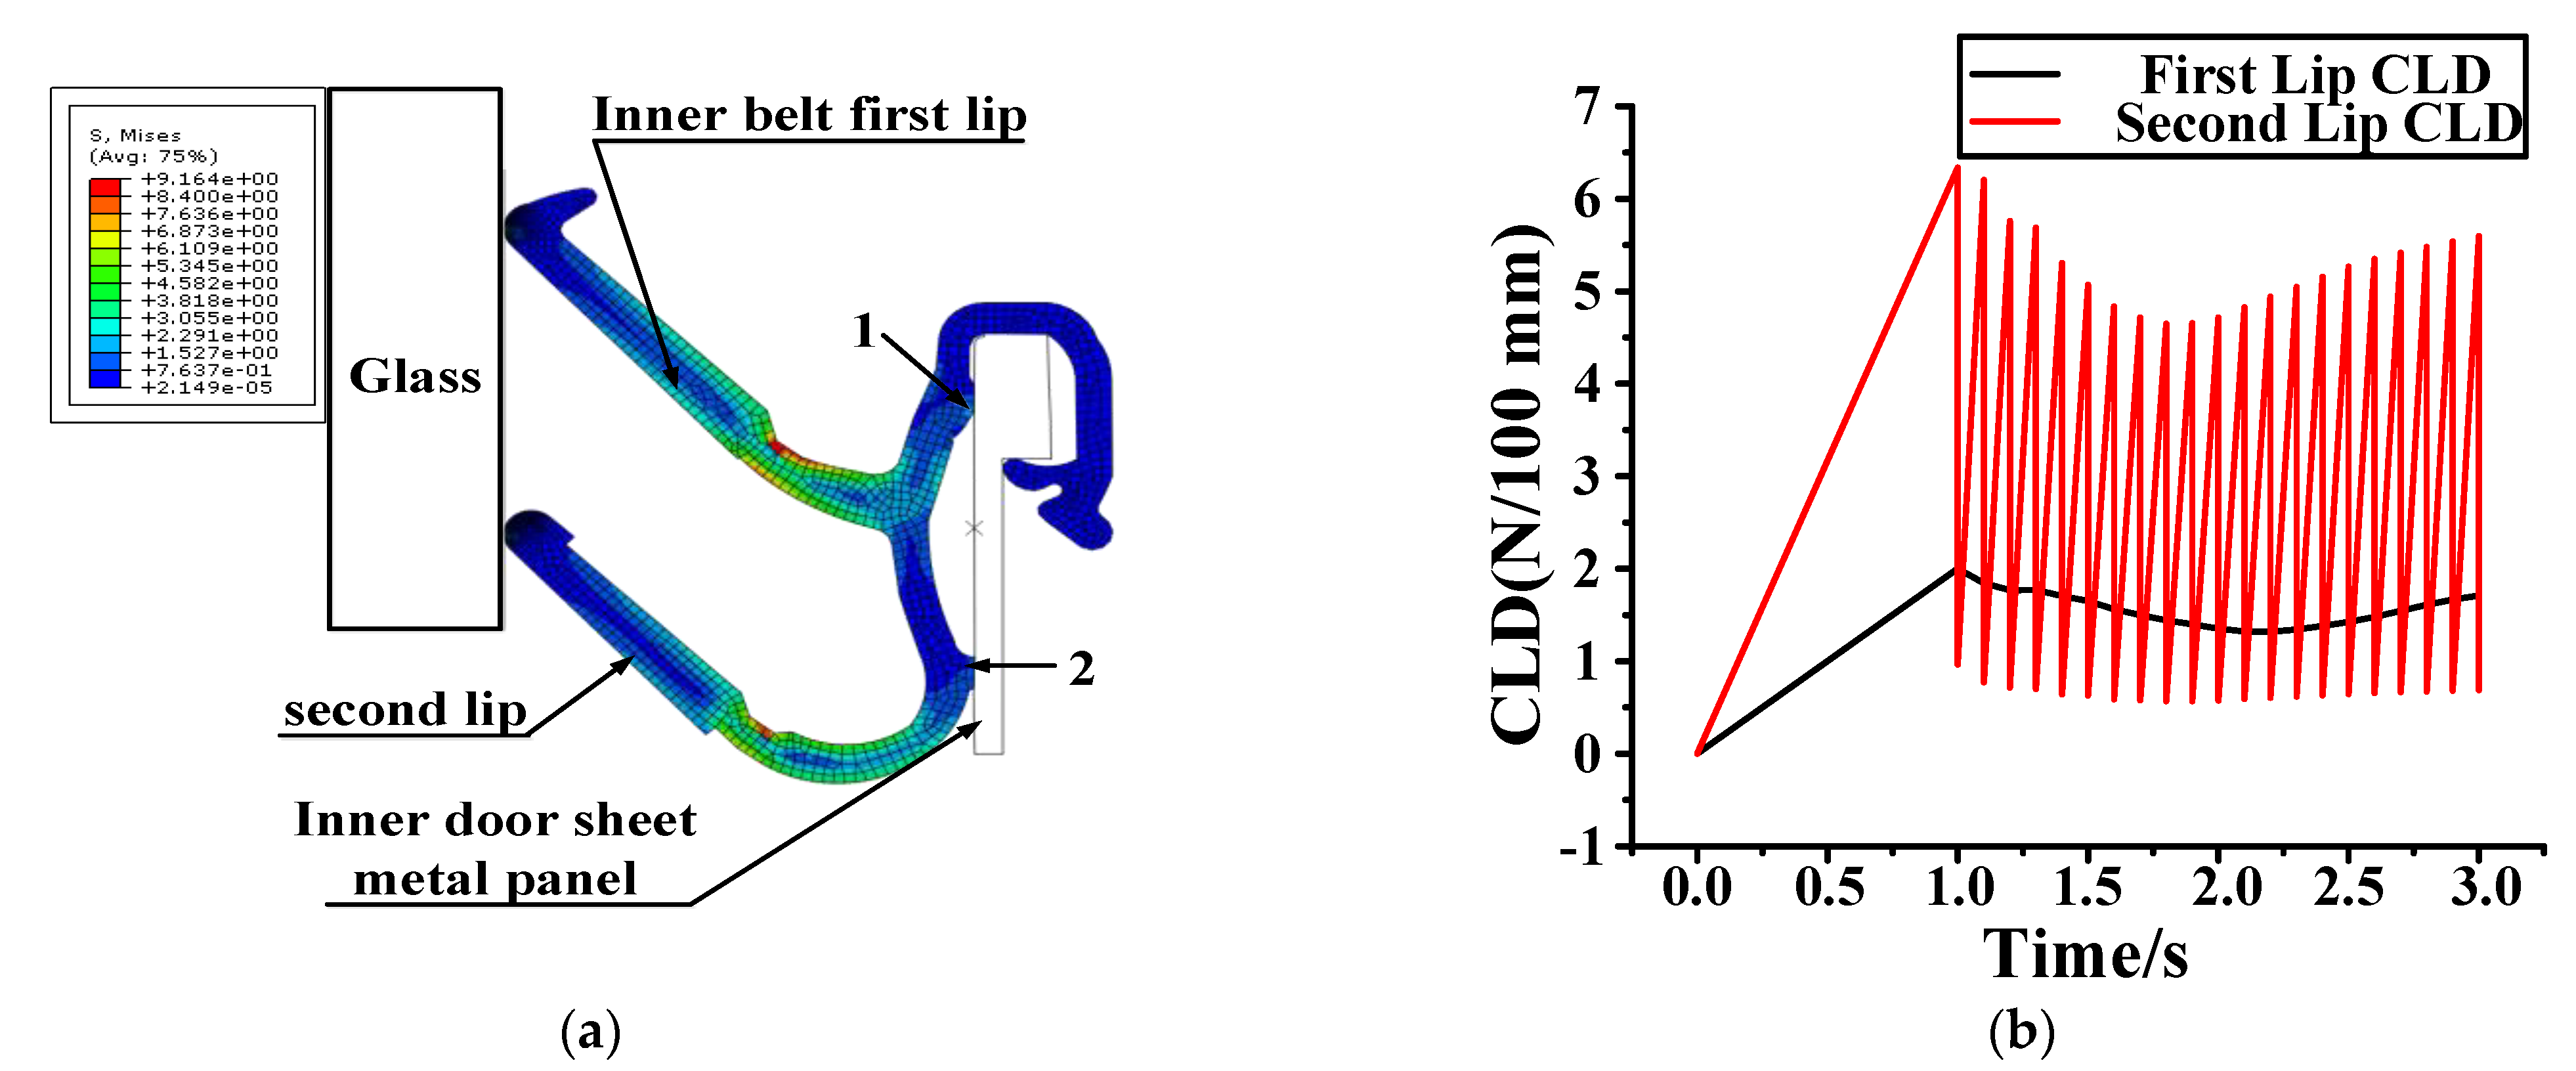
4. Finite Element Analysis and Experimental Verification
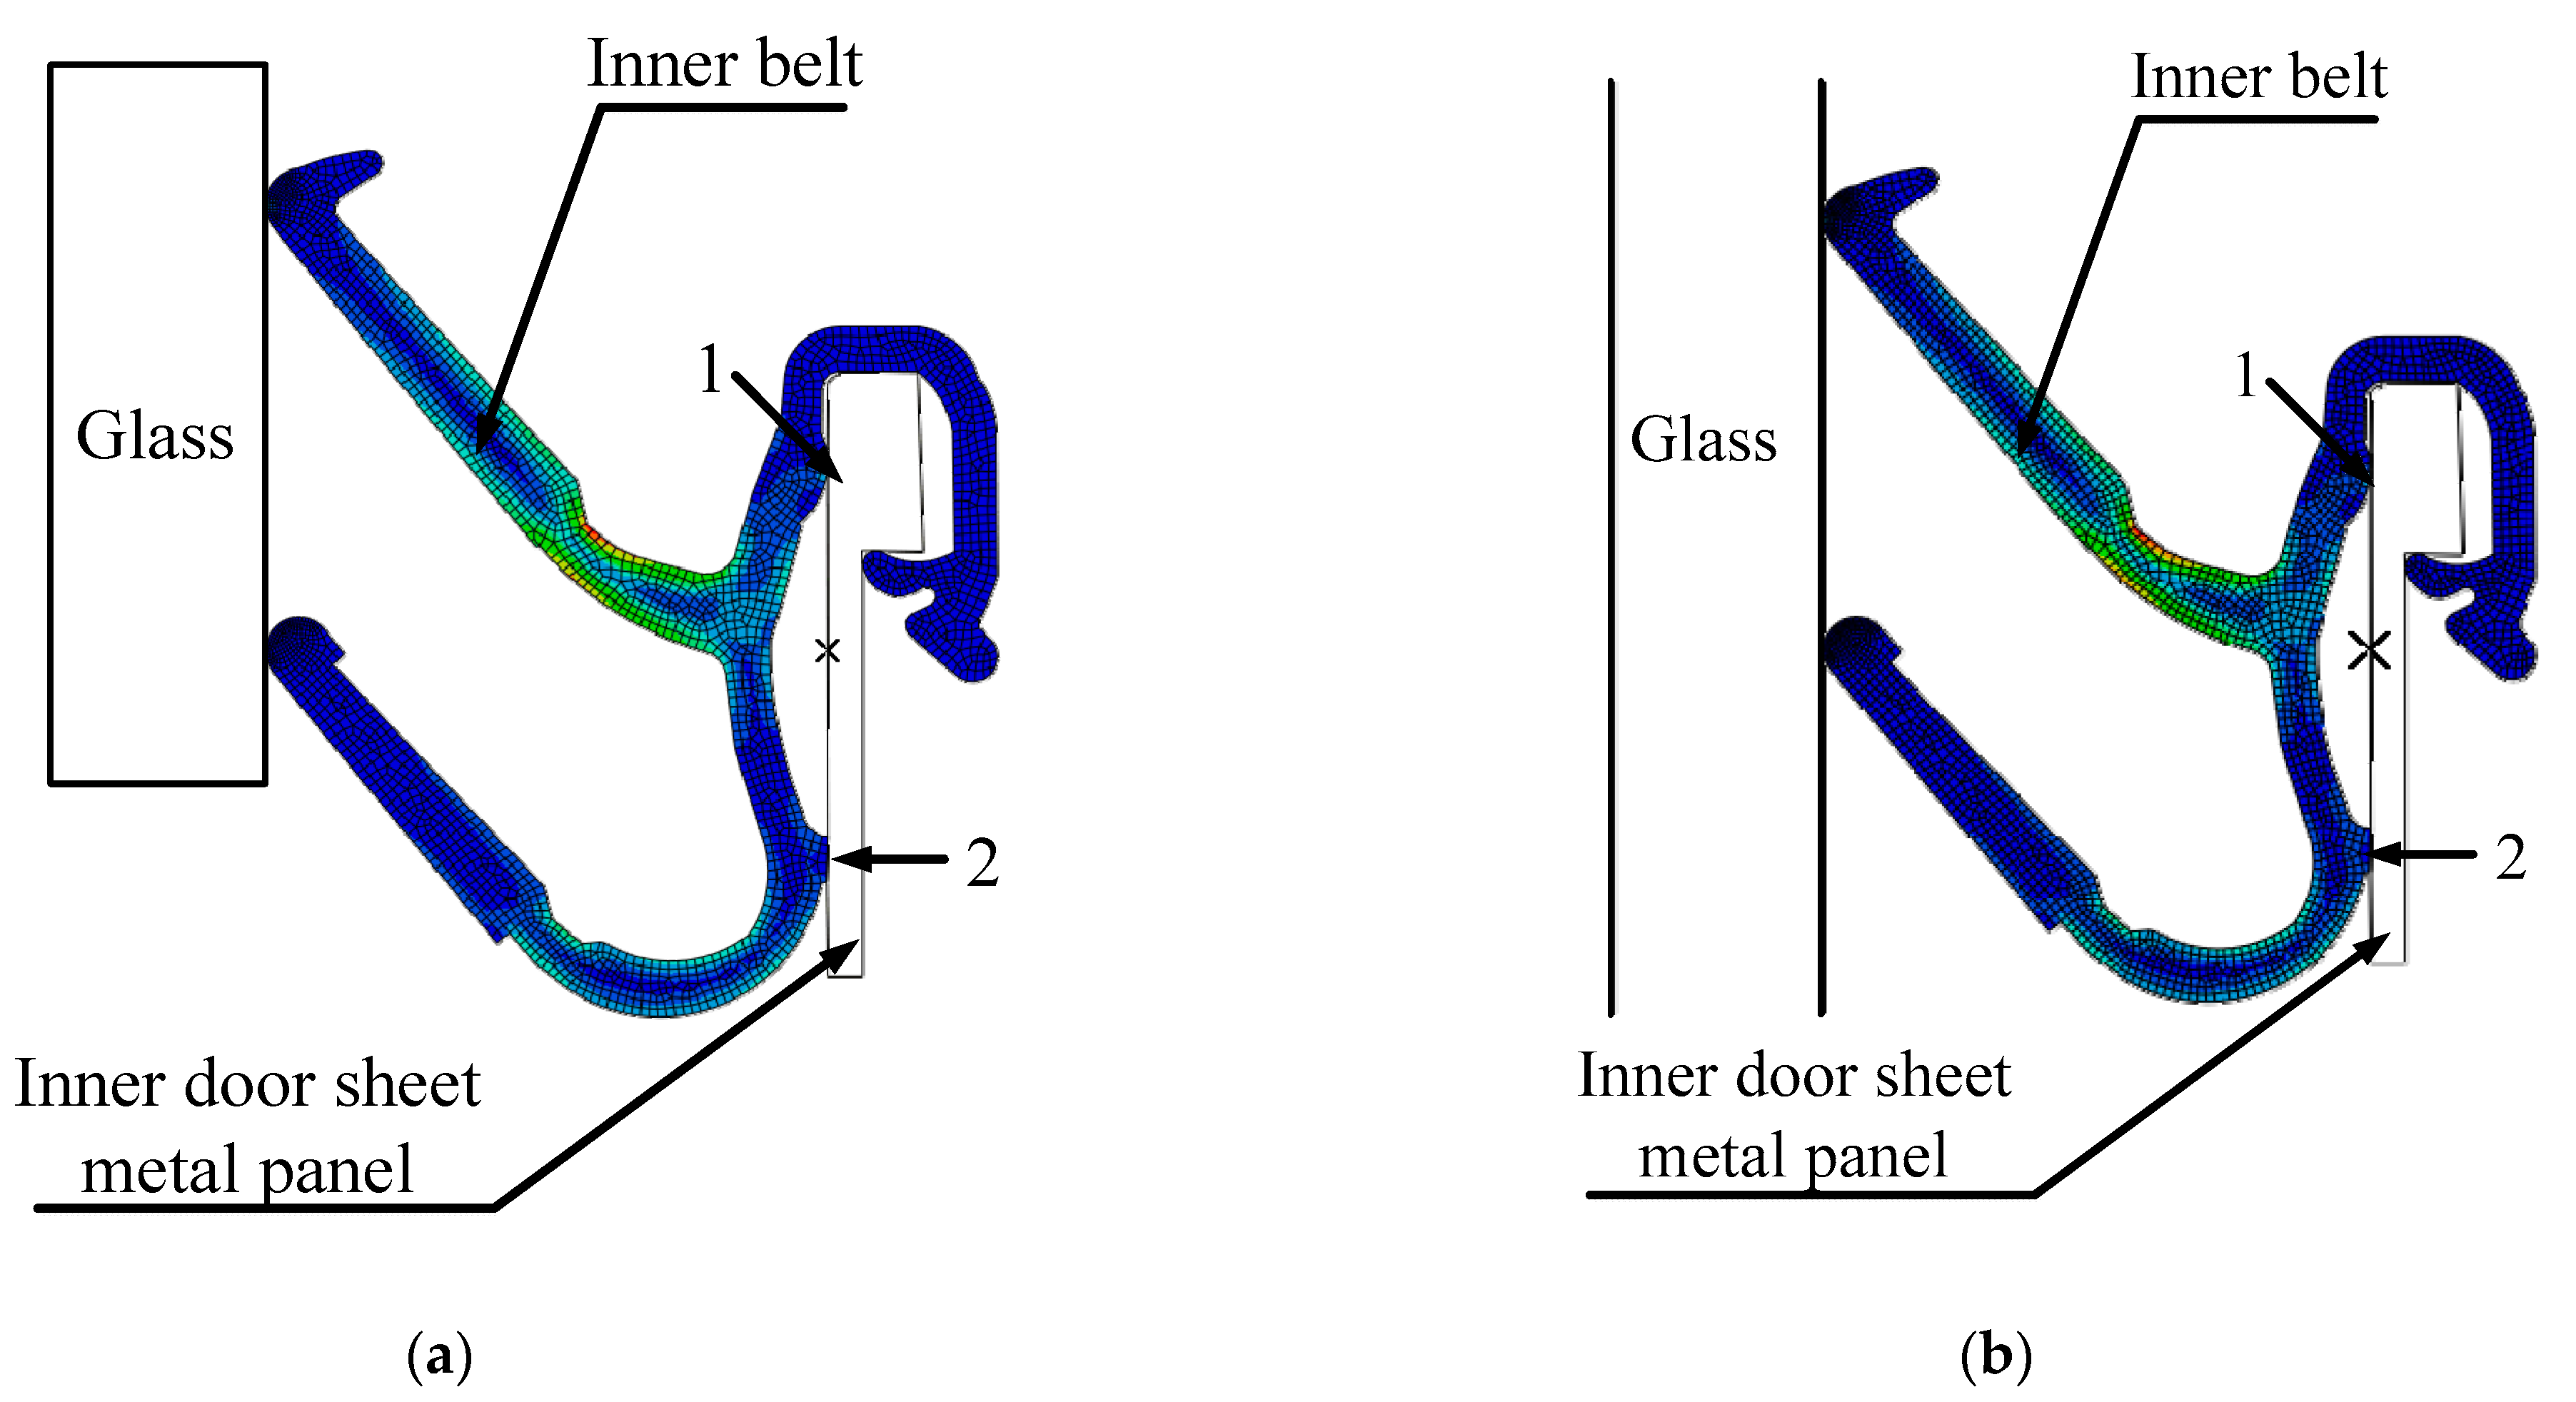
4.1. Finite Element Analysis
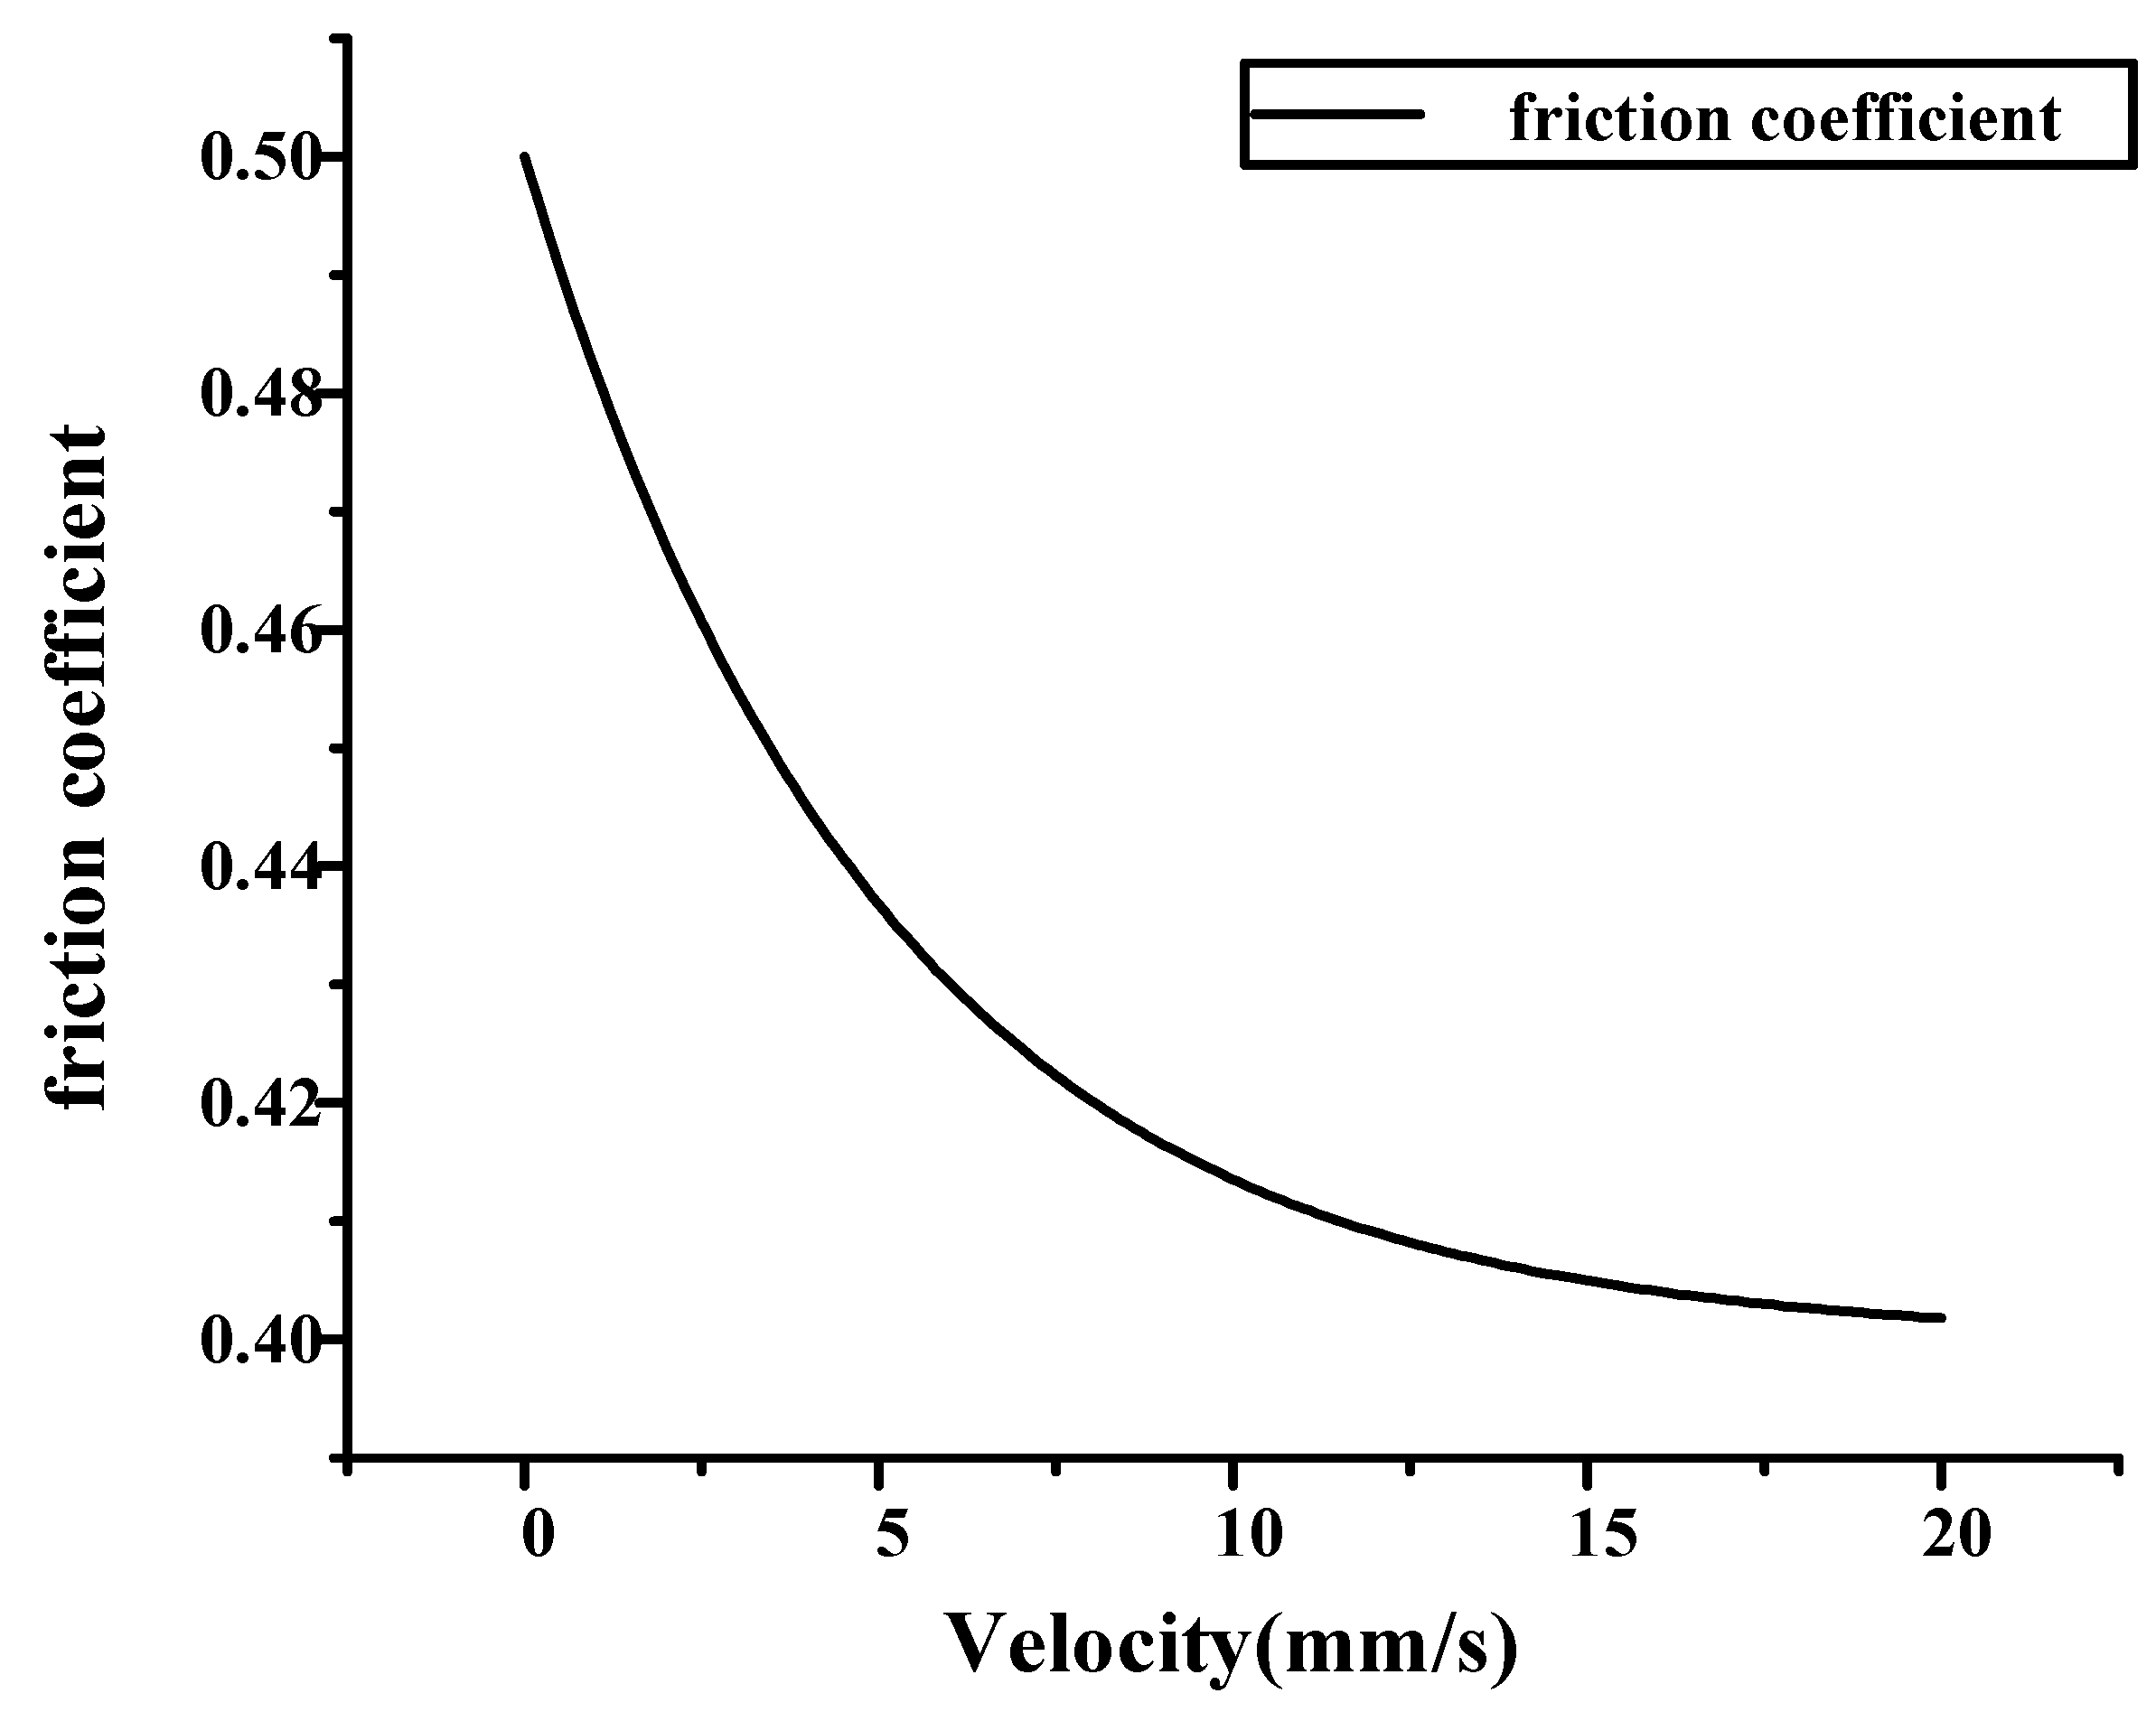
4.1.1. Setup of Coulomb Friction Model
4.1.2. Implicit Dynamic Analysis
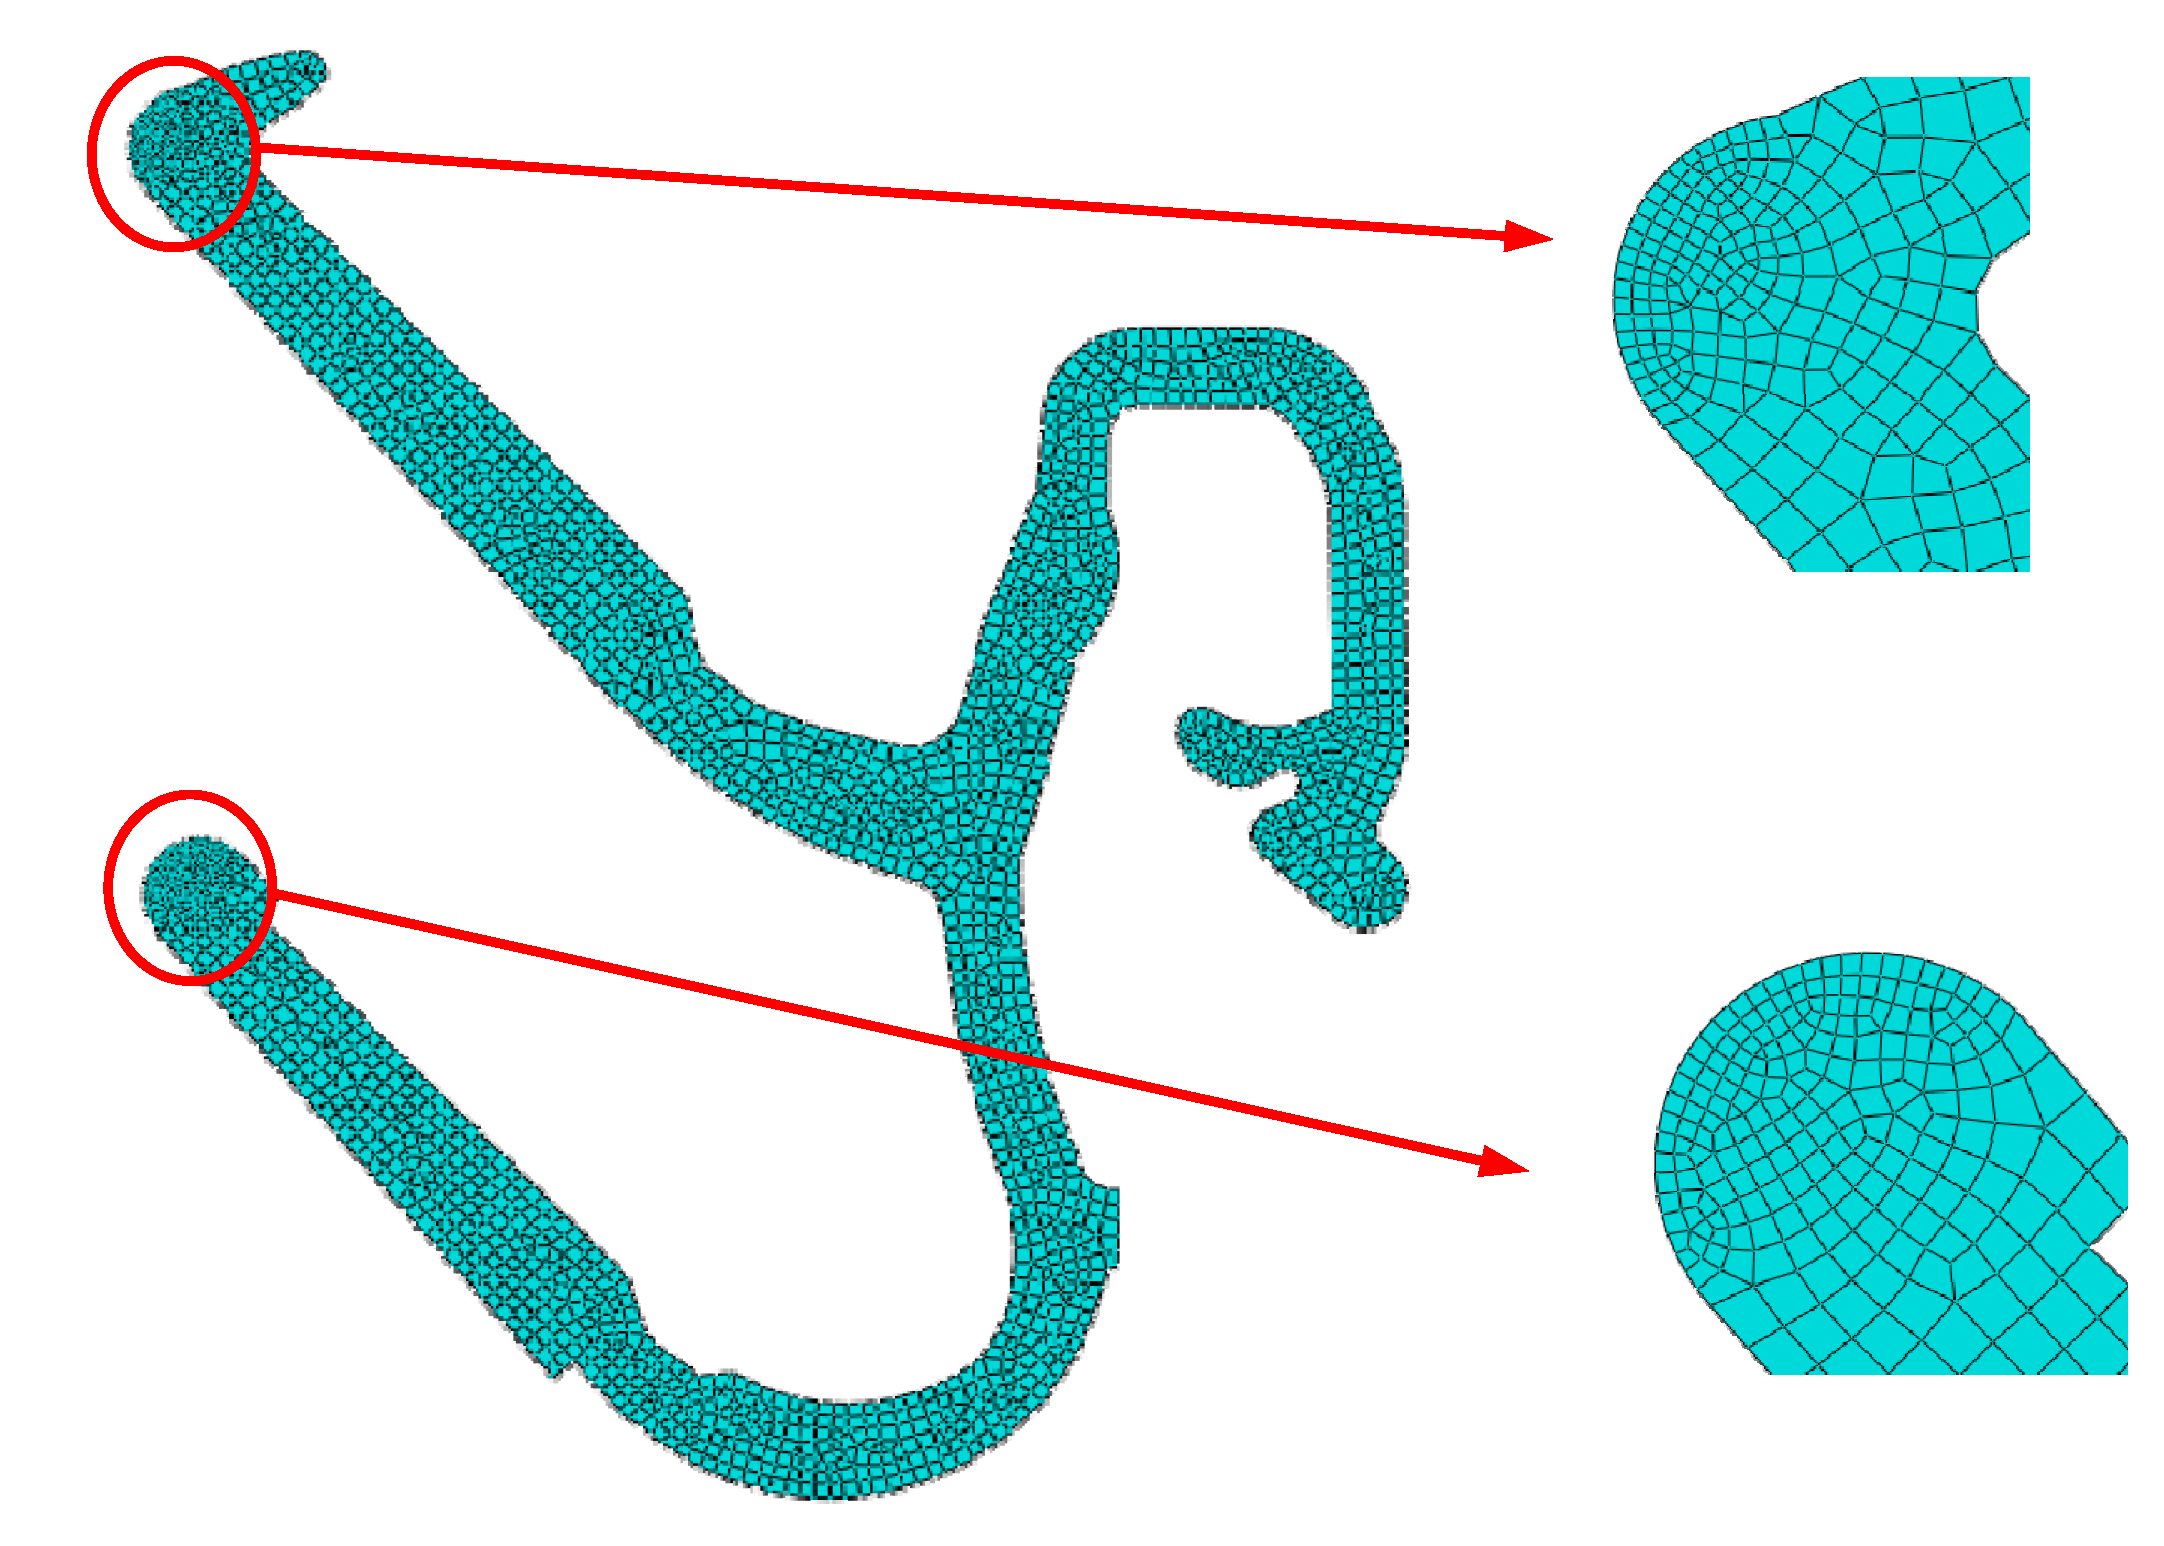
4.1.3. Grid Division
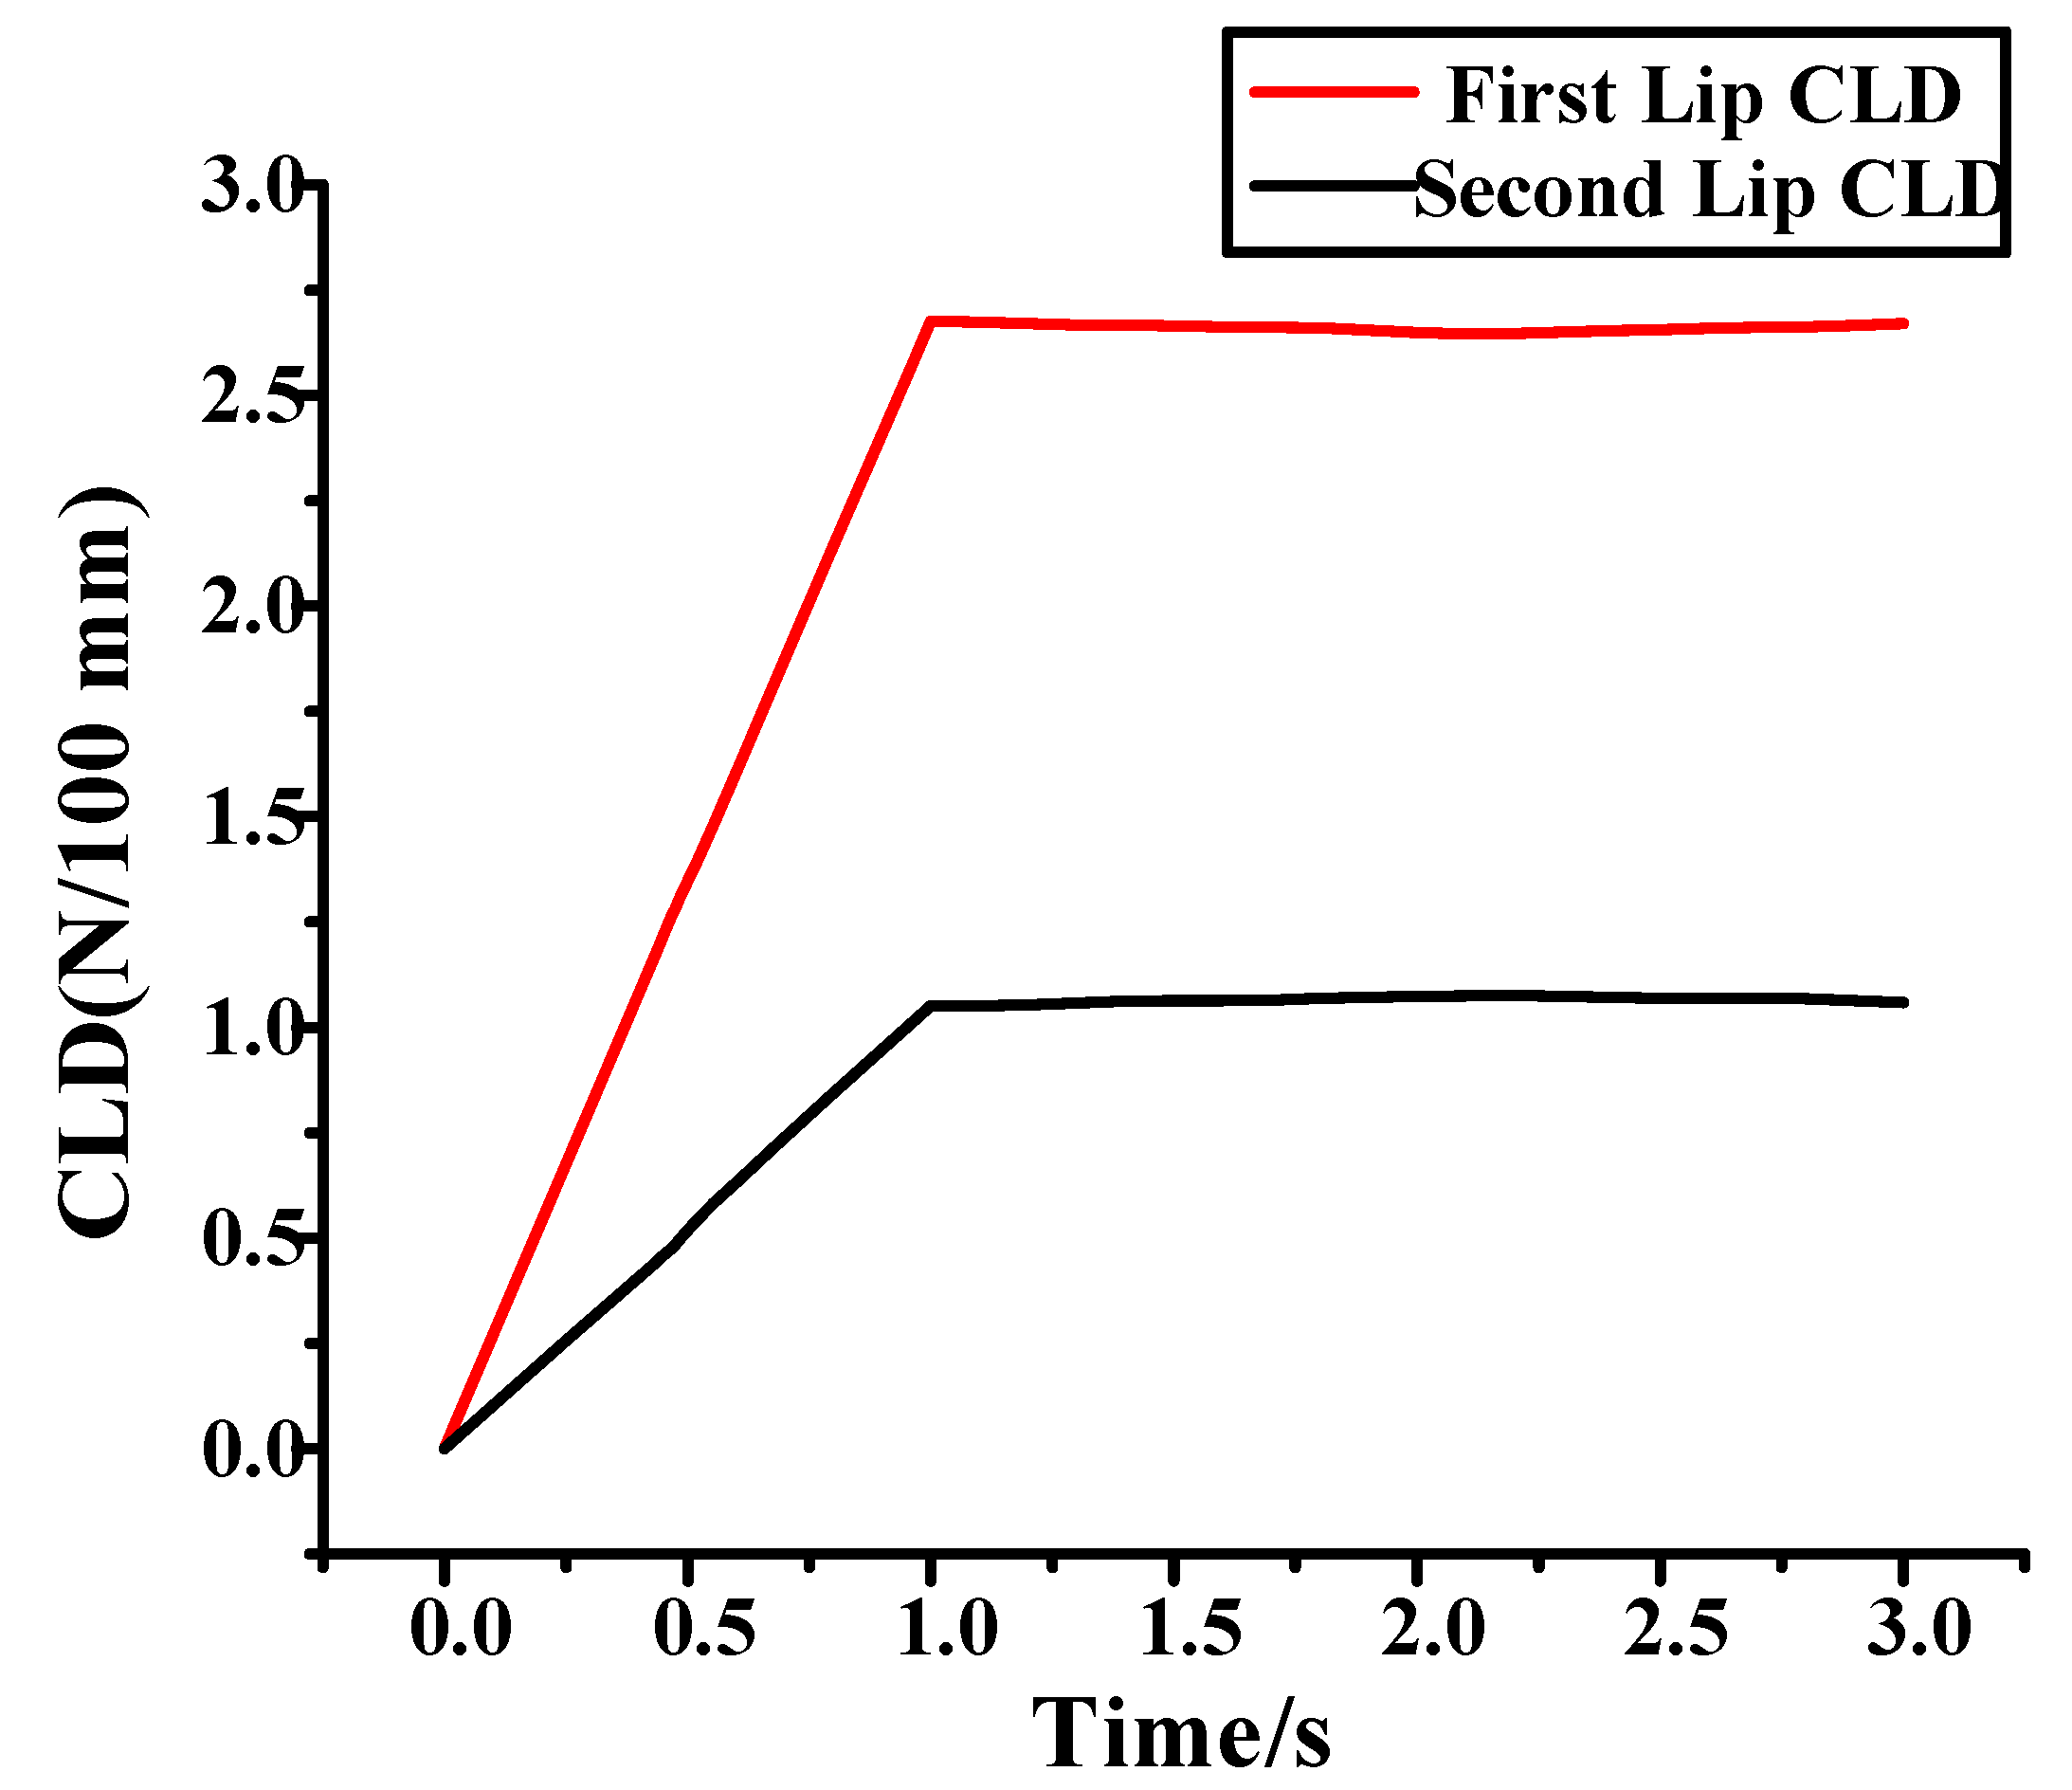
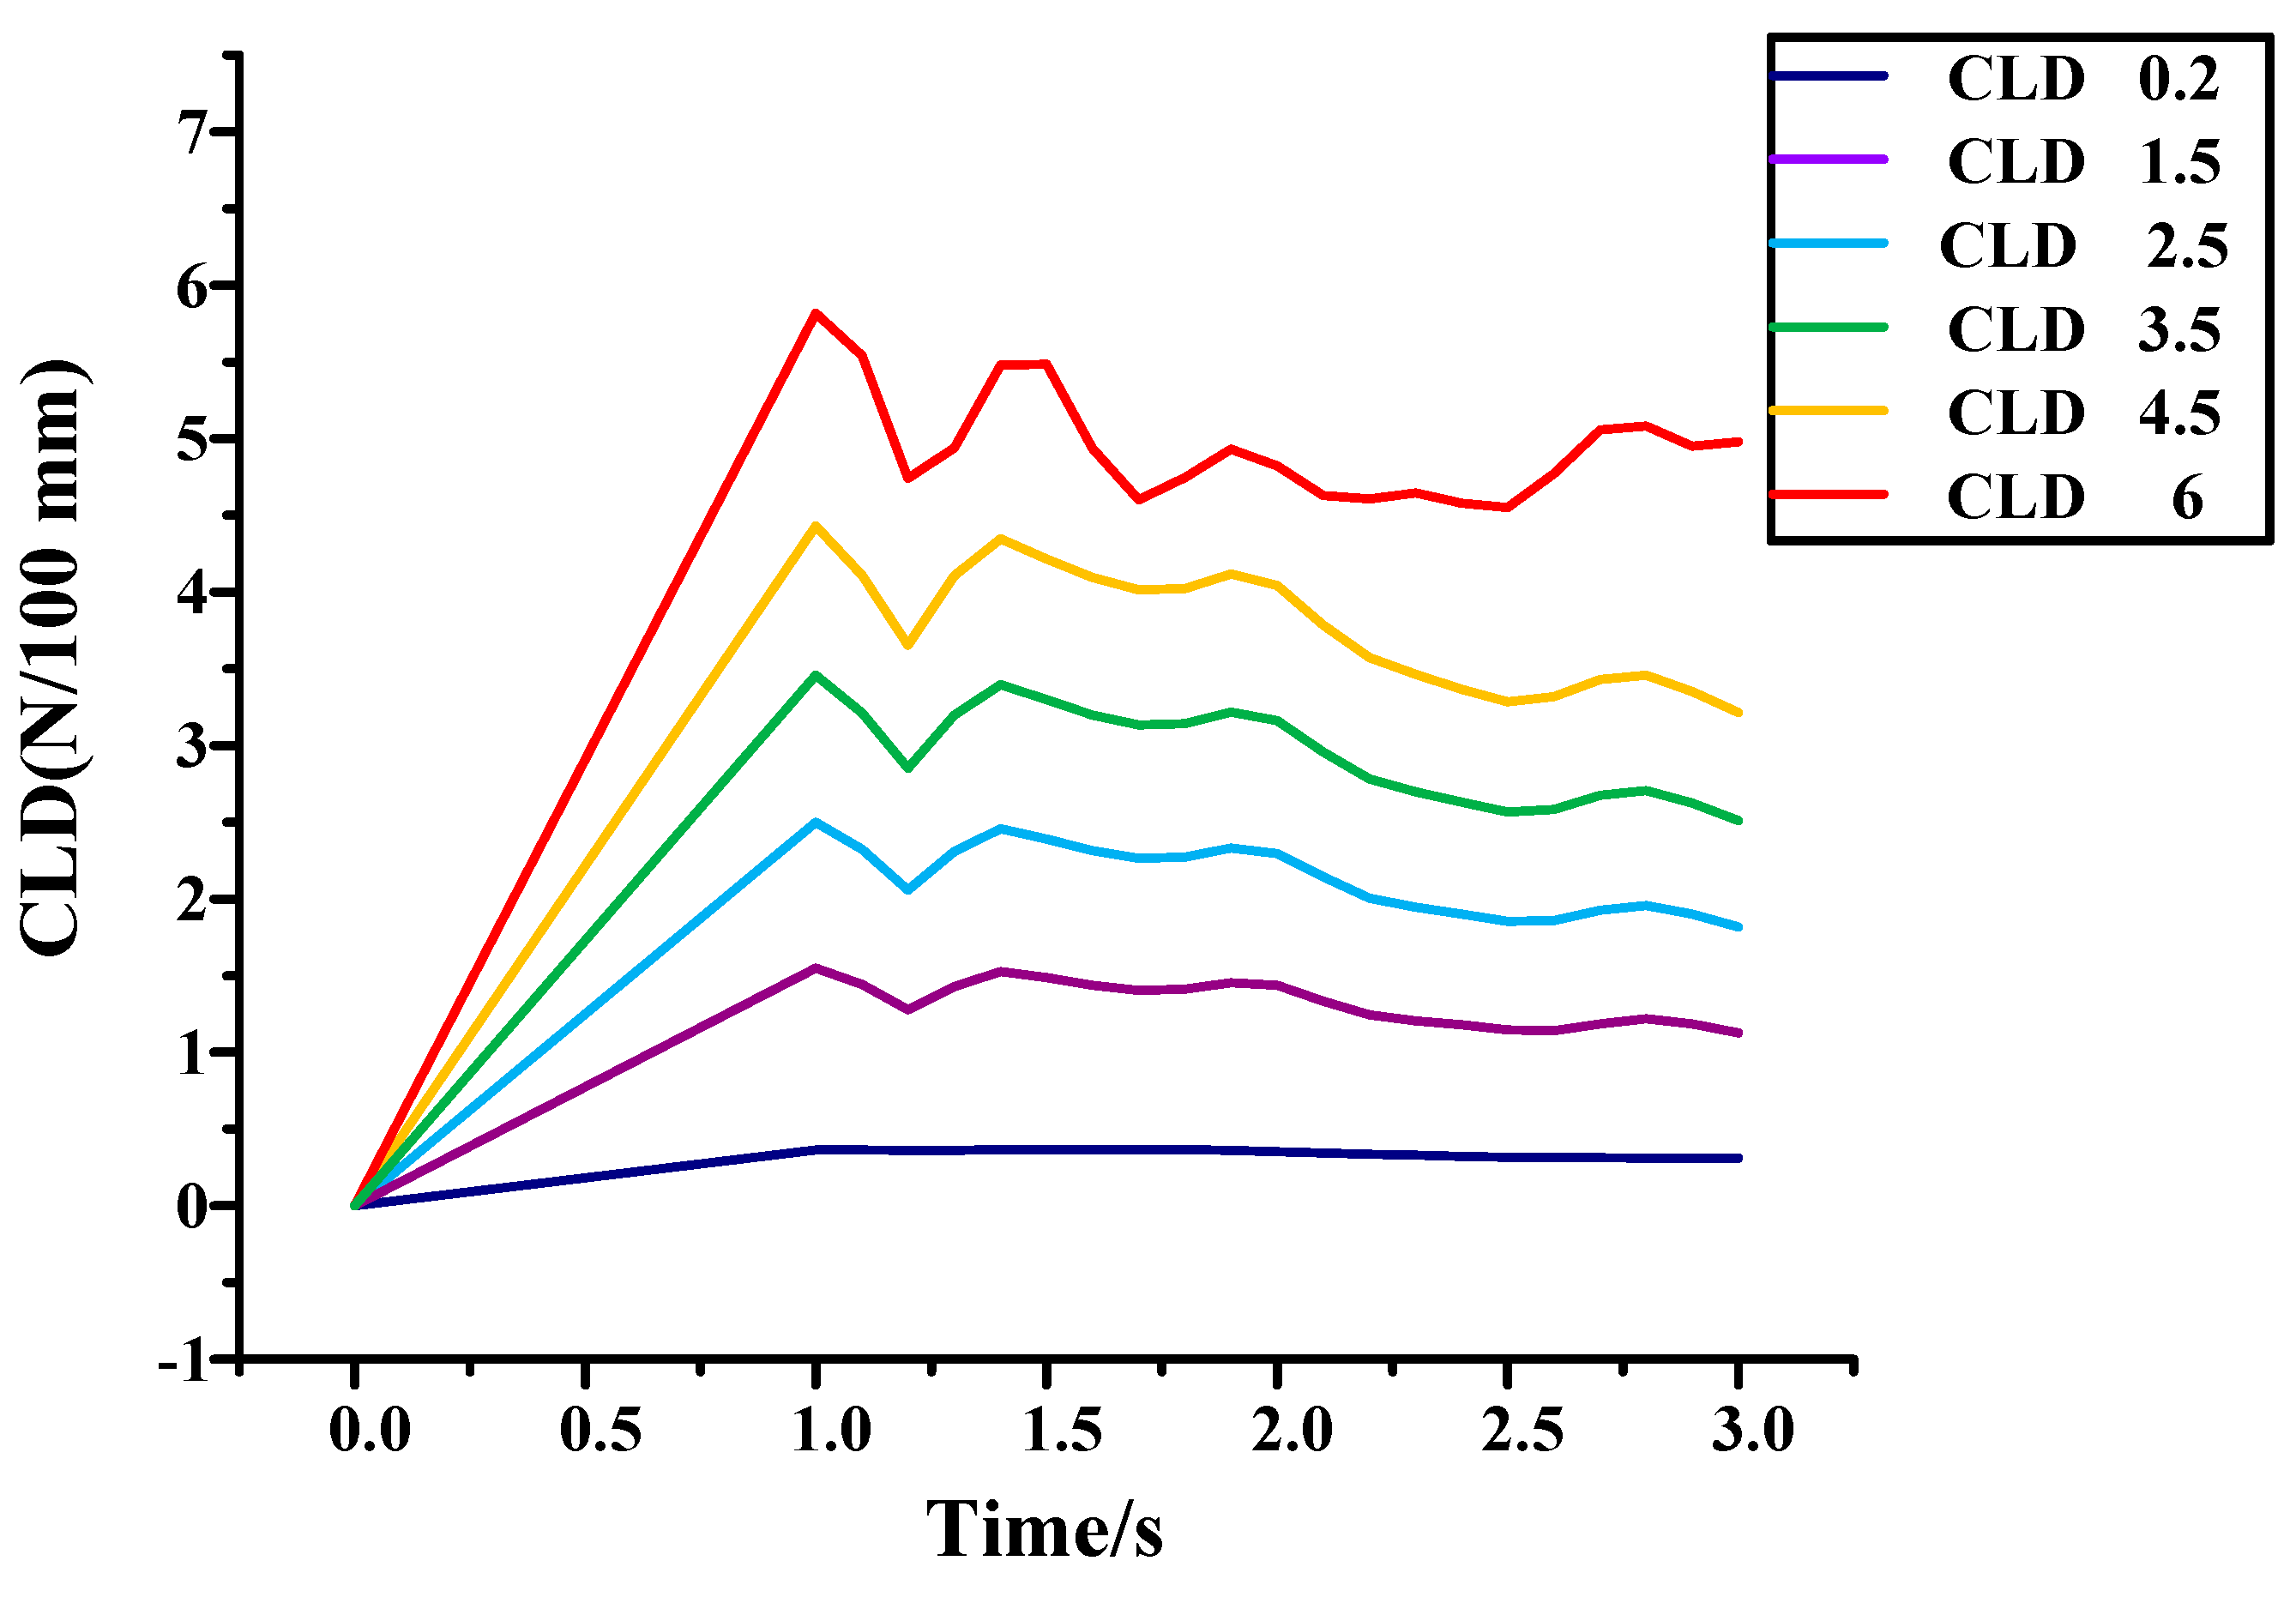
4.1.4. Simulation Analysis
4.2. Real Vehicle Verification
5. Conclusions
Author Contributions
Funding
Institutional Review Board Statement
Informed Consent Statement
Data Availability Statement
Conflicts of Interest
Appendix A

References
- Schneider, M.; Wilhelm, M.; Alt, N. Development of Vehicle Sound Quality Targets and Methods. SAE Techen. 1995, 104. [Google Scholar]
- Weber, J.; Benhayoun, I. Squeak & Rattle Correlation in Time Domain using the SAR—LINE Method. SAE Int. J. Passeng. Cars-Mech. Syst. 2012, 5, 1124–1132. [Google Scholar] [CrossRef]
- Ibrahim, R.A. Friction- induced vibration, chatter, squeal, and chaos—Part II: Dynamics and modeling. Appl. Me-Chanics Rev. 1994, 47, 227–253. [Google Scholar] [CrossRef]
- Chunlong, M. Research on Key Technology of Vehicle NVH Test Data Management System. Mod. Ind. Econ. Informatiz. 2018, 8, 66–67. [Google Scholar]
- Chunlong, M. NVH Control Research on Door Glass Lift Process of A Passenger Car. Master’s Thesis, Jilin University, Changchun, China, 2018. [Google Scholar]
- Yokoi, M.; Nakai, M. A Fundamental Study on Frictional Noise: (5th Report, The influence of random surface roughness on frictional noise). Bull. JSME 1982, 25, 827–833. [Google Scholar] [CrossRef][Green Version]
- Stoimenov, B.L.; Maruyama, S.; Adachi, K.; Kato, K. The roughness effect on the frequency of frictional sound. Tribol. Int. 2005, 40, 659–664. [Google Scholar] [CrossRef]
- Othman, M.O.; Elkholy, A.H. Surfaces roughness measuring using dry friction noise. Exp. Mech. 1990, 47, 309–312. [Google Scholar] [CrossRef]
- Othman, M.O.; Elkholy, A.H.; Seireg, A.A. Experimental investigation of frictional noise and surface-roughness characteristics. Exp. Mech. 1990, 47, 328–331. [Google Scholar] [CrossRef]
- Ben Abdelounis, H.; Le Bot, A.; Zahouani, H.; Perret-Liaudet, J. Experimental Study on Friction Noise of Dry Rough Surfaces. In Proceedings of the International Joint Tribology Conference, Miami, FL, USA, 20–22 October 2008; pp. 533–535. [Google Scholar]
- Le Bot, A.; Chakra, E.B. Measurement of Friction Noise Versus Contact Area of Rough Surfaces Weakly Loaded. Tribol. Lett. 2010, 37, 273–281. [Google Scholar] [CrossRef]
- Abdelounis, H.B.; le Bot, A.; Liaudet, J.P.; Zahouani, H. An experimental study on roughness noise of dry rough flflat surfaces. Wear 2010, 268, 335–345. [Google Scholar] [CrossRef]
- Abdelounis, H.B.; Zahouani, H.; Le Bot, A.; Perret-Liaudet, J.; Tkaya, M.B. Numerical simulation of friction noise. Wear 2010, 271, 621–624. [Google Scholar] [CrossRef]
- Yang, Z.; Shi, X.; Wu, C.; Zhou, H.; Guo, M.; Liu, S.; Lin, J.; Fu, C. Study on Tribological and Friction Noise Performance of Ti6Al4V Self-lubricating Composites. J. Mater. Eng. Perform. 2019, 28, 6063–6072. [Google Scholar] [CrossRef]
- Wang, L.; He, H.; Lin, R.; Wu, Z.; Wang, Q.; Yang, B.; Chen, R. Study on ameliorating friction noise of ABS materials by lubrication. Polym. Test. 2020, 82, 106307. [Google Scholar] [CrossRef]
- Nam, J.; Baek, J.; Do, H.; Kang, J. Experimental investigation of friction noise on lubricated contact. J. Mech. Sci. Technol. 2017, 31, 5751–5760. [Google Scholar] [CrossRef]
- Li, Y.; Cui, Z.; Zhang, D.; Ruan, X.; Chen, J. Six sigma opti-mization in sheet metal forming based on dual response sur-face model. Chin. J. Mech. Eng. 2006, 19, 251–255. [Google Scholar] [CrossRef]
- Krehbiel, T.C.; Eighme, J.E.; Cottell, P.G. Morgan Systems, Inc.: Application of Six Sigma to the finance function. J. Account. Educ. 2009, 27, 104–123. [Google Scholar] [CrossRef]
- Koo, I.S.; Cho, I.H.; Jung, K.H. A Study on the Service Quality Evaluation of University Administrations—The utilization of DMAIC process 6sigma. J. Korea Saf. Manag. Sci. 2008, 10, 209–218. [Google Scholar]
- Li, Q.; Popov, M.; Dimaki, A.; Filippov, A.E.; Kürschner, S.; Popov, V.L. Friction Between a Viscoelastic Body and a Rigid Surface with Random Self-Affine Roughness. Phys. Rev. Lett. 2013, 111, 034301.1–034301.5. [Google Scholar] [CrossRef] [PubMed]
- Persson, B. Author Response to the Comment by Popov on "Contact Mechanics for Randomly Rough Surfaces: On the Validity of the Method of Reduction of Dimensionality". Tribol. Lett. 2015, 60, 1–4. [Google Scholar] [CrossRef]


| Mechanical Property | Numerical Value |
|---|---|
| Young’s modulus | 4.5 MPa |
| tensile strength | 9~20.8 MPa |
| Shore hardness | 40~90 |
| Subcode | Control Factor |
|---|---|
| X1.1 | Letter box size |
| X1.2 | Distance between glass and inner sheet metal panel |
| X2 | Thickness of glass |
| X3.1 | CLD of inner belt |
| X3.2 | Flocking position of inner belt 2nd lips |
| Point Position | Coordinates/ Distance | 9.29 | 11.3 | 11.3 | 12.2 | 12.2 | 12.4 | 12.4 |
|---|---|---|---|---|---|---|---|---|
| H113YL | 764.04 | 0.6 | 0.1 | 0.1 | −0.2 | −0.4 | −0.3 | −0.2 |
| H113YL H120YL | 24.95 | −1.2 | 1.3 | 1.1 | 1.4 | 1.4 | 1.3 | 1.1 |
| H114YL | 757.93 | 0.5 | 0.5 | 0.6 | −0.3 | −0.2 | −0.2 | −0.2 |
| H114YL H119YL | 24.64 | −0.7 | 1.5 | 1.3 | 2.3 | 1.9 | 2.1 | 2.0 |
| H115YL | 749.35 | 0.5 | 0.2 | 0.3 | −0.4 | −0.8 | −0.3 | −0.3 |
| H115YL H118YL | 24.8 | 0.3 | 2.2 | 1.9 | 2.4 | 2.6 | 2.3 | 2.0 |
| H116YL | 741.95 | 0.5 | 0.7 | 0.9 | 0.2 | −0.1 | 0.3 | 0.5 |
| H116YL H117YL | 23.83 | 0.5 | 1.7 | 1.5 | 1.6 | 1.8 | 1.6 | 1.3 |
| H117YL | 765.43 | 2.4 | 2.3 | 1.8 | 1.7 | 1.9 | 1.8 | |
| H118YL | 774.15 | 2.4 | 2.2 | 2.0 | 1.8 | 2.0 | 1.8 | |
| H119YL | 782.57 | 2.0 | 1.9 | 2.1 | 1.7 | 1.9 | 1.7 | |
| H120YL | 788.99 | 1.4 | 1.3 | 1.2 | 1.0 | 0.9 | 0.9 |
| Date | 9.29 | 11.3 | 11.3 | 12.2 | 12.2 | 12.4 | 12.4 |
|---|---|---|---|---|---|---|---|
| (Pass rate) Tolerance 1.5 mm | 95.8% | 95.1% | 95.1% | 94.2% | 94% | 94.2% | 95.3% |
| Total points (number) | 118 | 634 | 634 | 634 | 634 | 634 | 634 |
| Unqualified points (number) | 5 | 38 | 39 | 43 | 46 | 41 | 36 |
| Date | Humidity | Test Frequency | Test Result |
|---|---|---|---|
| 10.31 PM | 36% | 50 | No S&R |
| 11.1 AM AND PM | 77% | 50 | No S&R |
| 11.2 PM | 44% | 50 | No S&R |
| 11.3 AM | 44% | 50 | No S&R |
| 11.3 PM | 29% | 50 | No S&R |
| 11.4 AM | 56% | 50 | No S&R |
| Type | Up/ Below | Up/ Middle | Up/ Top | Down/ Top | Down/ Middle | Down/ Below | Condition | Note | |
|---|---|---|---|---|---|---|---|---|---|
| VIN17 | FL | no | no | no | no | no | no | Wet | 50 times |
| VIN17 | FR | no | no | no | no | no | no | Wet | 50 times |
| VIN17 | RL | no | no | no | no | no | no | Wet | 50 times |
| VIN17 | RR | no | no | no | no | no | no | Wet | 50 times |
| VIN26 | RL | no | no | no | no | no | no | Wet | 50 times |
| VIN26 | RR | no | no | no | no | no | no | Wet | 50 times |
Publisher’s Note: MDPI stays neutral with regard to jurisdictional claims in published maps and institutional affiliations. |
© 2021 by the authors. Licensee MDPI, Basel, Switzerland. This article is an open access article distributed under the terms and conditions of the Creative Commons Attribution (CC BY) license (https://creativecommons.org/licenses/by/4.0/).
Share and Cite
Ma, C.; Shi, D.; Wang, M.; He, D.; Li, C.; Yu, X. Research on Improving NVH Performance of Automobile Side Door Glass in Use Based on 6 Sigma Method. Materials 2021, 14, 3748. https://doi.org/10.3390/ma14133748
Ma C, Shi D, Wang M, He D, Li C, Yu X. Research on Improving NVH Performance of Automobile Side Door Glass in Use Based on 6 Sigma Method. Materials. 2021; 14(13):3748. https://doi.org/10.3390/ma14133748
Chicago/Turabian StyleMa, Chunlong, Dongyan Shi, Mengnan Wang, Dongze He, Chao Li, and Xingsheng Yu. 2021. "Research on Improving NVH Performance of Automobile Side Door Glass in Use Based on 6 Sigma Method" Materials 14, no. 13: 3748. https://doi.org/10.3390/ma14133748
APA StyleMa, C., Shi, D., Wang, M., He, D., Li, C., & Yu, X. (2021). Research on Improving NVH Performance of Automobile Side Door Glass in Use Based on 6 Sigma Method. Materials, 14(13), 3748. https://doi.org/10.3390/ma14133748