1. Introduction
Materials’ flammability is one of the most important elements that require strict measures and precautions necessary to maintain fire safety, especially for building and construction products. This is due to the growing loss of life because of the spread of fire. Thus, comprehensive research on this issue is the main focus of this study. In order to overcome this consequence, various measuring techniques of fire properties have been developed and improved, such as lowering the heat release, controlling ignitability, or improving the extent of flame spread across the surface of flammable materials. Therefore, these factors allow a greater time for people to evacuate to safe areas before a fire takes hold and thus, saves more lives. Overall, from 2006 to 2014, the average rate of fire cases in Malaysia is up to 1024.67 fires per million people for each year [
1]. From statistics, 7.53 per million populations each year is the rate of fire victims with 3.07 deaths per million populations. Hence, approximately 90 residential fires per million populations occurred each year. By taking into account fire casualties, it is about a 30% increase in the total number of victims in residential fires within 3 years [
1].
In order to avoid a rise in the risk of fire, modern products, including building materials, furniture, and clothing, were mostly made of fire-retardants materials [
2]. However, some of the compounds present in these materials have adverse and harmful effects on the environment, hence leading to a change to more eco-friendly alternatives in recent years [
3]. Therefore, in recent years, there has been an increasing interest in the development of bio-based fire retardants. In various research, researchers have discovered that Lignocellulosic Plant Fibres (LPFs) have natural defence behaviours against the aggression of fire [
4,
5,
6]. Rice husk (RH), which is categorised as an LPF, consists of 35% cellulose, 25% hemicellulose, 20% lignin, 3% crude protein, and 17% ash [
7].
The gradual global transition from non-renewable (fossil-based) raw materials to renewable (plant-based) has intensified the search for alternative industrial raw materials. The paint industry has also not been excluded in this growing demand for renewable materials because several plant-based materials have been introduced, particularly as fillers [
8]. Rice husk ash (RHA), with its known high silica content, has a vast potential for offering an alternative to commercial paint filler or additive. Currently, silica flour, kaolin, and calcium carbonate are the widely used fillers in the paint industry since these materials can be obtained naturally and have perfect crystalline silica [
9]. Recent studies have shown that RHA is also suitable to be used as a filler. It is inexpensive and renewable, and most importantly, it is able to improve some mechanical properties of epoxy paints [
10]. The properties of white RHA or black RHA are different because they both have a dissimilar amount of carbon and silica due to different pre-treatments of rice [
10]. Industrials have assured the potentials of rice husk (RH) on various applications due to its high silica content. The applicable way to use RHA as an extender along with paint has been investigated in some paints, namely, textured emulsion, cellulose matt paint, and matt wood varnish [
11]. However, there is still not as yet well-established research in adding RHA-based geopolymer into alkyd paint, proven by application.
Geopolymer is known for its excellent properties; thus, it has been applied in several industrial applications and has attracted global investments with commercialisation in many categories, namely, resin, paint, binder, grout, cement, concrete, ceramic, panels, and fibre-reinforced composites [
12]. Geopolymer binder (GB) has been verified to demonstrate outstanding fire resistance properties [
13], high mechanical strength [
14], high durability [
15], and numerous aluminosilicates have been used, such as fly ash, metakaolin, palm oil fuel ash (POFA), and dolomite [
16]. However, the GB used can cause an increase in substrate weight, darker colour, and uneven surface. These effects should be considered and not be ignored because they give rise to other issues after the application. Thus, the utilisation of RHA-based GB in coating application is low. The effective use of RHA-based GB in paint, therefore, needs to be studied so that an efficient coating produced can have a maximum advantage.
Accordingly, it is valuable to discover cheap and renewable resources to be applied to the construction sector. RHA, which is a leftover outcome from rice granulating, has a high potential to be the alternate resource for silica [
10]. Therefore, it is important to utilise RHA since it is an abundant source, in Malaysia particularly. In Malaysia, the Food and Agriculture Organization (FAO) reported that rice-paddy production is estimated to increase by 0.1 tonnes every year [
17]. The growing demand for rice paddy produced about 0.52 tons of RH annually [
18], with about 20% of the total grain weight obtained from the average husk weight. Therefore, approximately 200 kg of husk is produced from a tonne of rough rice, which is considered as the biodegradable waste product in the rice mill industry and is commonly burned in the open area or dumped in landfills [
18].
Due to potential explored in previous studies, RHA could be the next generation of geopolymer technology and environmentally friendly sources for paint filler or additive. In this study, a new-fangled coating with RHA-based GB was developed particularly for fire-resistant steel application. This coating is expected to contribute to high mechanical properties and auspicious fire-resistance properties. Thus, an eco-friendly, efficient, and green product can be produced and has extensive potential application in the industry. The objective of this research is to optimise the RHA-based geopolymer ratio using response surface methodology (RSM) and study the effect of RHA-based geopolymer addition on alkyd paint coating in terms of thermal properties.
3. Results
The complete design matrix and responses values of the time taken to reach 200 °C (TT200) and temperature at equilibrium (TAE) are given in
Table 3.
3.1. Statistical Analysis of Thermal Properties
In the Design-Expert software, the fit summary tab proposes the highest order polynomial, where the additional terms are significant, and the model is not aliased. The sequential F-test for the significance of both the regression model and the individual models’ terms, along with the lack of fit test, were carried out. The ANOVA analysis for TT200 for the quadratic model in
Table 4 summarises the response analysis and the significant model term.
p-values less than 0.0500 indicate that model terms are significant, which in this case, A, B, AB, A
2, and B
2 are significant model terms. The predicted R
2 of 0.9012 is in reasonable agreement with the adjusted R
2 of 0.9251, as the difference is less than 0.2. This indicated that 90.12% of the sample variation in the response was attributed to the factors. A ratio of 31.898, which is greater than 4, indicates logical agreement and significant relationships.
Meanwhile, ANOVA analysis for TAE in
Table 5 shows that all factors and interaction effects were significant, with
p < 0.0500 except for AB with a
p value of 0.8052 and B
2 with a
p value of 0.0559. If there are many insignificant model terms, a model reduction may improve the model. The predicted R
2 of 0.9346 is in reasonable agreement with the adjusted R
2 of 0.9517, where the difference is less than 0.2. This indicated that 93.46% of the sample variation in the response was attributed to the factors. A ratio of 42.244, which is greater than 4, indicates logical agreement and significant relationships.
The regression models can be used to calculate and analyse the effect of factors on the fire resistance performance of paint mixed with the FR additive. The equations are presented in terms of coded factors and actual factors, which are useful to make predictions about the response for the given levels of each factor.
Regression models for TT200 and TAE are respectively expressed in terms of actual factors.
This regression model can be used to calculate and analyse the effect of factors on the thermal properties of RHA-based geopolymer hybrid paint.
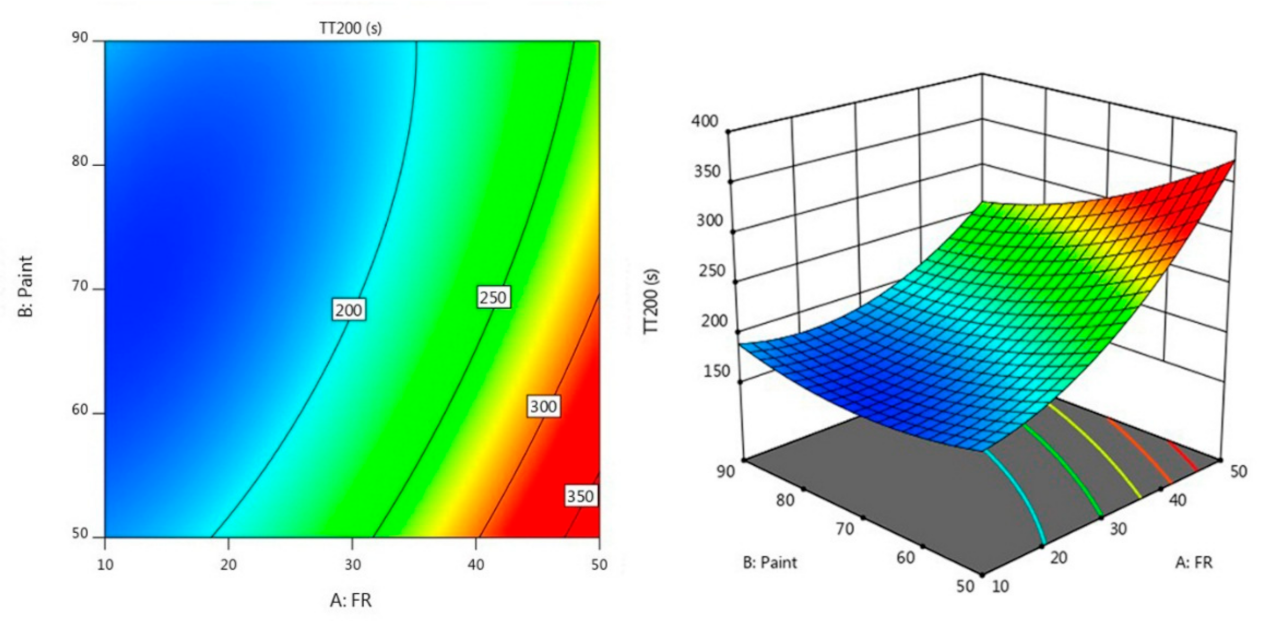
3.2. Effect of Factors on Thermal Properties
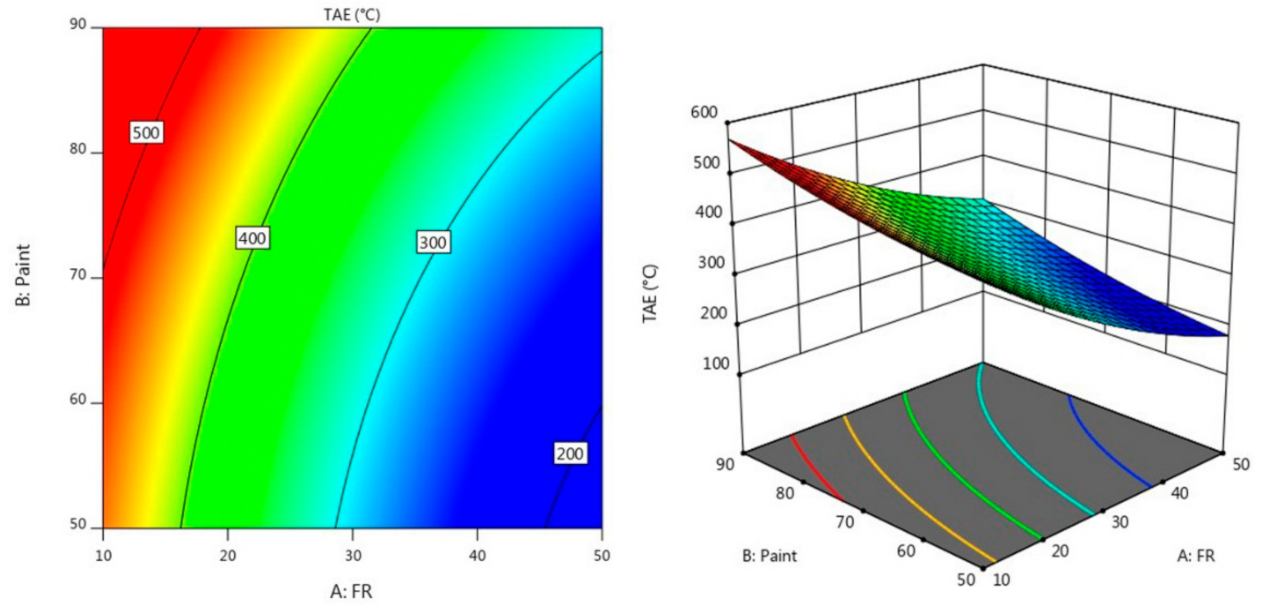
Figure 3 and
Figure 4 describe the contour diagram for the response model for the time taken to reach 200 °C (TT200) and temperature at equilibrium (TAE), respectively. As indicated by the colour key, it shows that a higher percentage of A and a lower percentage of B could result in a longer TT200, which is above 350 s. Meanwhile, a higher percentage of A and a lower percentage of B resulted in a lower temperature at equilibrium, which is below 200 °C.
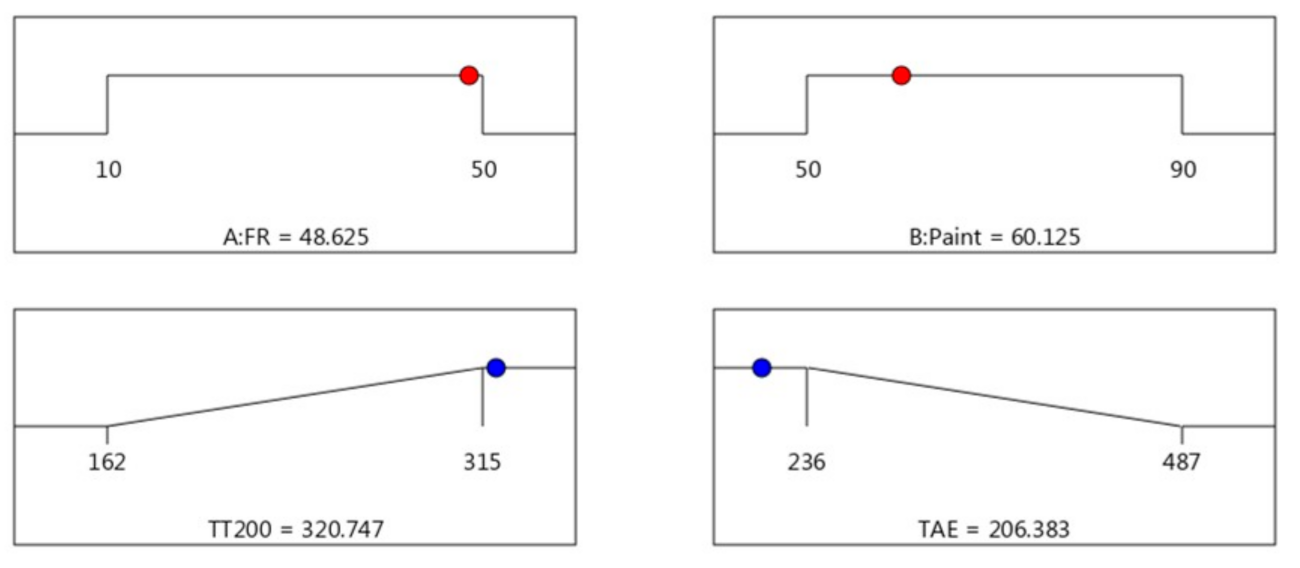
3.3. Optimisation of the Responses for Thermal Properties
Since the objective was to maximise the time taken to reach 200 °C and minimise the temperature at equilibrium (TAE), the maximum acceptable value for TT200 was set at 315 s, and the minimum acceptable value was set to 162 s. Meanwhile, for TAE, the target values, which is the minimum temperature at equilibrium, were set at 236 °C, and the maximum acceptable value was set for 487 °C.
Figure 5 illustrates the predicted optimum conditions and the responses studied for thermal properties. The predicted optimum operating parameters influencing thermal properties was estimated to be FR (48.625% wt.) and paint (60.125% wt.). At these optimum conditions, the corresponding predicted TT200 and TAE was found to be 320 s and 206 °C, respectively. The desirability of optimisation was calculated as 1.000, indicating that all parameters were within the target to obtain the maximum fire resistance properties.
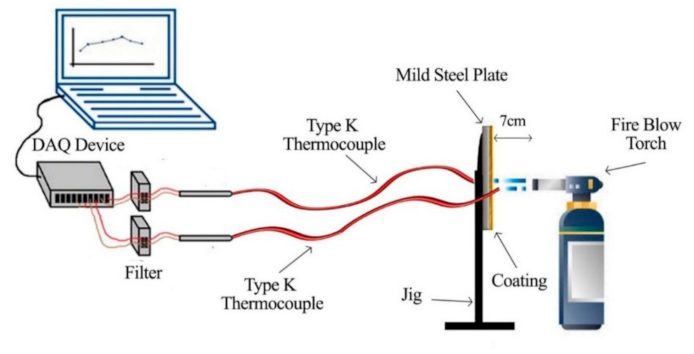
3.4. Experimental Validation
Experimental validation is the final step in the modelling process, and it verifies the model’s accuracy. Three validation experiments were carried out under the optimal conditions obtained from the optimisation plot, as shown in
Figure 3, in order to verify the reproducibility of the established regression model and the RSM model. For a nonlinear process, the optimisation and validity of the model are only verified when the average difference between experimental and predicted values is less than 15% [
19].
Table 6 shows the experimental validation for fire resistance properties; it was found that the average errors for the TAE and TT200 were well below 15% at 4.58% and 6.47%, respectively. It was concluded that the developed regression model established using this method was able to optimise the value for the responses.
3.5. Fire Resistance Performance
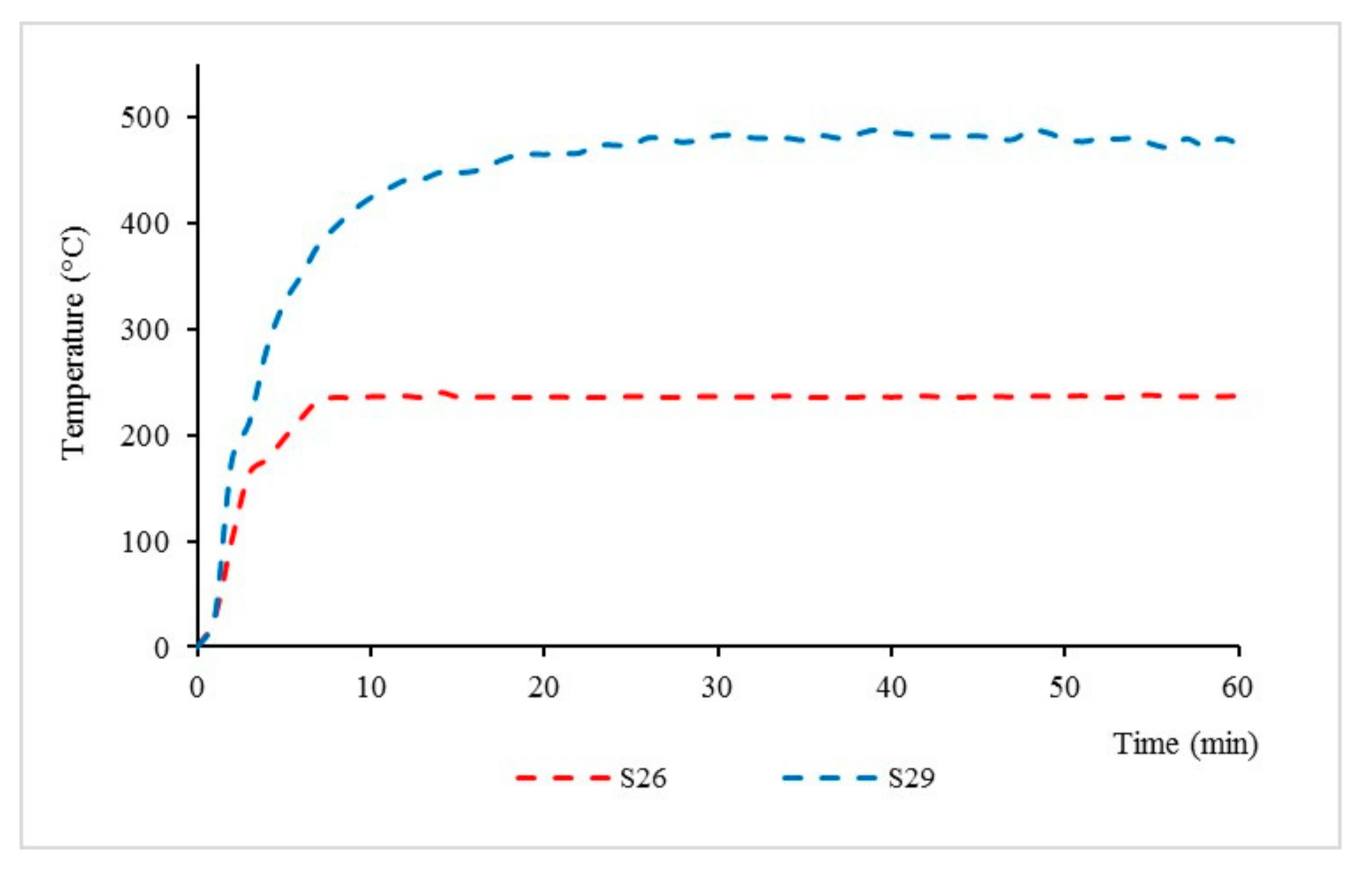
Design matrix and responses values for sample S26 and S29 were discussed in detail and are shown in
Figure 6; these samples exhibited the best and worst performance in thermal properties, respectively.
For TAE response, sample S26 showed a 103.81% improvement when compared to sample S29. Meanwhile, for the TT200 response, sample S26 showed a 94.44% improvement when compared to sample S29. From this test, it can be seen that the equilibrium temperatures and time taken to reach 200 °C for sample S26 were significantly lower compared to sample S29 due to the positive synergistic effect of the additive on fire resistance [
20].
From the fire resistance, test it is noted that intumescent starts to occur at the time of 10 min for sample S26. Once the coated surface was exposed to fire, it started to melt and become a highly viscous liquid. Chemical reactions took place, leading to bubble formation, which then produced swelling and a porous intumescent char layer. A swelling char layer was formed, which minimised the heat transfer from the heat source to the underlying steel and maintained the integrity of the protected substrate against fire.
As for sample S29, there is no formation of an intumescent char layer observed. This is mainly due to the ratio of FR to paint in this sample being very minimal, 10:70, which causes a longer decomposition time and affects intumescent formation. Regardless of its unformed intumescent char formation, chemical reactions in the paint coating led to bubble formation, which helps to minimise the smoke emission and prevent fire ignition during the fire resistance test. This is mainly due to RHA physical properties, which contain a high amount of silica. According to Sekifuji et al. (2017), silica in RH is a useful material, which offers flame resistance and antioxidation properties in coatings [
21].
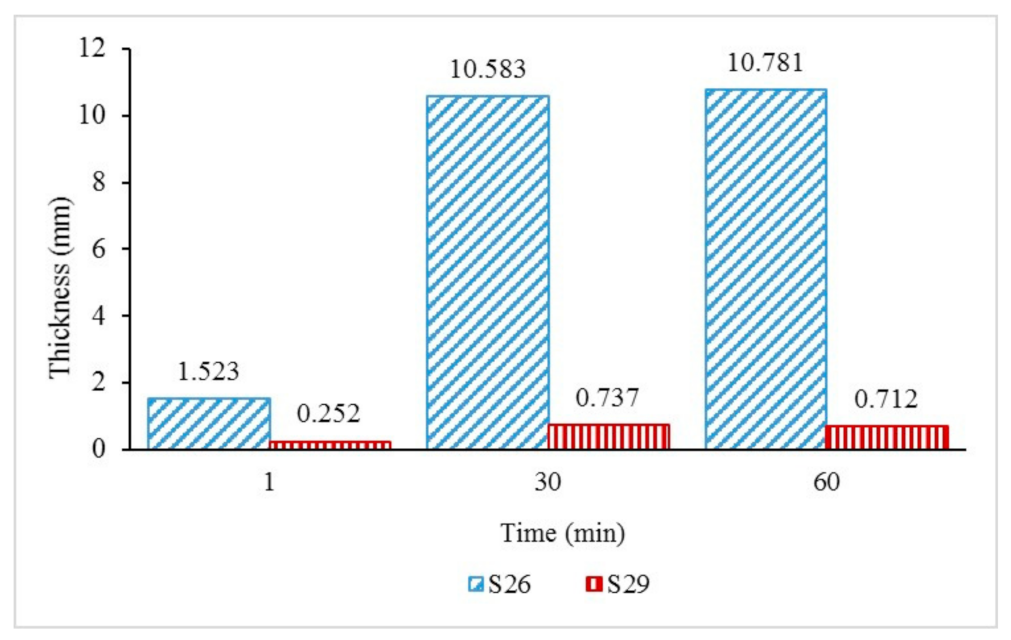
The intumescent char layer thickness of samples S26 and S29 was further investigated in
Figure 7 to study the effect of fire on the intumescent char thickness. The thickness of the coatings was measured at the start of the test (1 min), during the test (30 min), and after the fire resistance test (60 min). From observations in
Figure 5, sample S26 started to swell rapidly once exposed to fire and formed a 1.523 mm-thick char layer after 1 minute. As the time and temperature increased, sample S26 continued to swell and formed thicker char layers of 10.583 mm and 10.781 mm, respectively, at 30 and 60 min. Meanwhile, for sample S29, the coating only formed 0.252 mm of char thickness after a minute. It was observed that the char thickness during the test at 30 min (0.737 mm) decreased at the end of the test (0.712 mm). This indicated that the coating was unable to withstand the increasing temperature and experienced a substantial mass transfer out from the char and increased the heat transfer into the metal surface.
The results indicated that the 50.0% weight of the FR addition contributed significantly to better fire protection efficiency due to the formation of the char layer, which affects the equilibrium temperature. The result is in agreement with Beh et al. (2019) in their study [
22], which shows that the char layer’s thickness influenced the coating’s fire-safety efficiency, and there was a correlation between the char layer’s thickness and the equilibrium temperature.
3.6. Material Characterisation and Microstructural Analysis
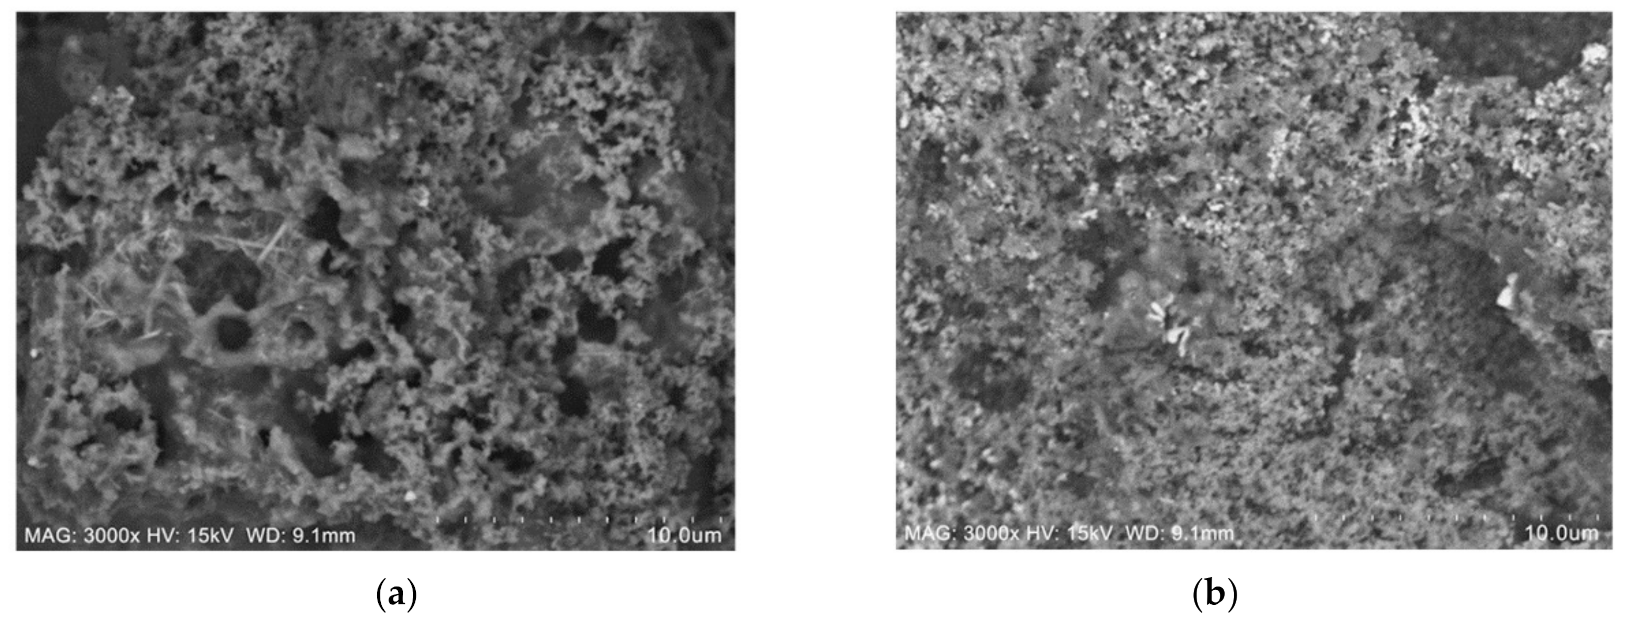
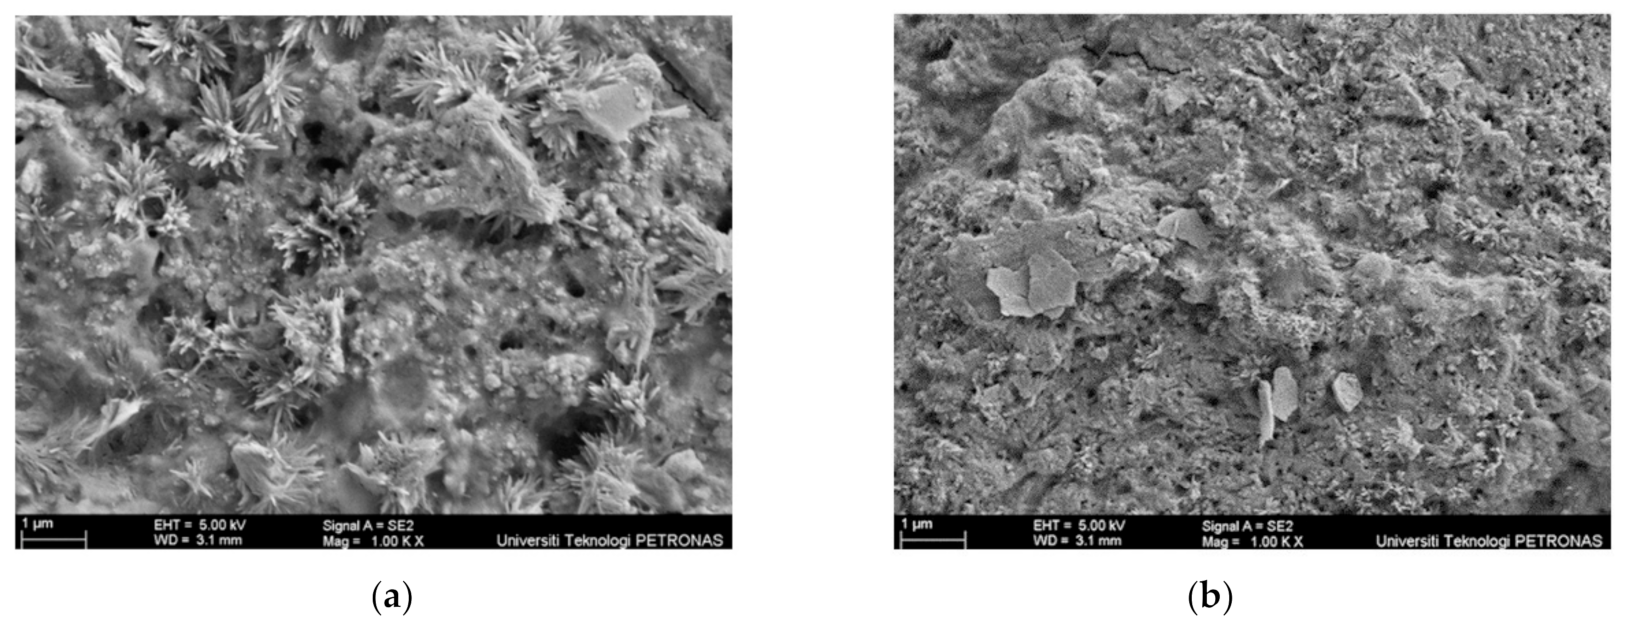
Two samples; specifically, sample S26, which produced good fire resistance performance, and S29, with poor fire resistance performance, were selected for further characterisation and microstructural analysis. The surface of the coating samples for sample S26 and S29 before the fire test was analysed using an SEM micrograph, as shown in
Figure 8.
The main difference between samples S26 and S29 can be seen clearly based on the unreacted particles’ amount and the surface roughness on the coating surface before the fire test. In
Figure 8a, sample S26 showed a rough and porous surface due to the RHA amount, while in
Figure 8b, sample S29 showed a greater amount of unreacted particles, which indicated that the combination of RHA and AA fillers did not fully dissolve in alkyd paint, hence resulting in an uneven distribution and rougher surface finish. This evidence was supported by the EDX test result in
Table 7. Samples for this test were taken from the upper surface of the coating, which was directly exposed to the fire. The difference in wt. % between Si and Na content in sample S29 was higher, 7.01%, compared to sample S26 (3.69%), indicating that the RHA particles may not have fully dissolved, resulting in an uneven distribution of the additive, which caused the formation of a rough surface on the coating.
Sample S26 and S29 after fire resistance test were then further analysed using SEM micrographs, as shown in
Figure 9.
Samples for these tests were taken from the upper surface of the coating, which was directly exposed to the fire. From the SEM observation in
Figure 9a, sample S26 contains long-rod structures, which were a certain form of sodium derived from Na
2SiO
3 or due to a side reaction of NaOH and RHA [
13]. The number of pores on the coating surface plays an important role in the formation of an intumescent char layer. Evaporated water molecules are alleged to travel from the exposed surface of the hot fire to the cooler inner part of the material. The pressure in the pores of the material and in the microvoids was generated by water due to the rapid evaporation rate [
23]. Since crystallisation of the surface and the intumescent process successfully took place in the sample, the evaporated water molecules were transported to a cooler area of the material, resulting in very low temperature at the non-exposed area. Once the coating was exposed to heat, water filled the pores to form an intumescent layer. This can be seen in the surface of the coating after the fire test, once exposed to heat, where sample S26 started to swell and formed a char layer, protecting the mild steel substrates. Meanwhile, sample S29 in
Figure 9b showed a small number of pores comparatively and failed to form an intumescent char layer due to a minimal amount of FR additive. Elements’ presence in sample S26 and S29 after the fire test were then investigated using EDX and tabulated in
Table 8. The major elements present in the coating were carbon (C), oxygen (O), sodium (Na), and silica (Si).
From the EDX results in
Table 8, sample S26 contained 47.00% of the element of oxygen (O), carbon (C) 28.59%, silica (Si) 18.72%, and sodium (Na) 5.69%. According to Zhao et al. (2009), Si content in RHA plays a major role in the fire-resistance effect. Si contributes to the formation of a silica–ash layer which acts as a heat barrier. This layer is important in restricting the access of oxygen to the inner part of the coating, which helps to slow down the gasification process. The sufficient loading, uniform dispersion, and integrity of the silica ash layer influence the effectiveness of the fire resistance properties. Thus, this explains the high element of oxygen presence in sample S26 after the fire test. The presence of sodium (Na) also can be confirmed by the presence of the long-rod structure in the
Figure 9a SEM image. As reported by previous studies [
13,
24,
25], the long-rod structures were a certain form of sodium derived from Na
2SiO
3 or due to a side reaction of NaOH and RHA.
Meanwhile, sample S29 showed 45.56% of the element of oxygen (O), followed by carbon (C) 25.80%, sodium (Na) 11.22%, and silica (Si) 17.42%. Better fire-protection performance can also be determined by the antioxidant properties of the intumescent coating. Better antioxidant properties are demonstrated by coatings that have lower oxygen to carbon ratios. By comparing oxygen to carbon ratios for both samples, sample S26 has a better antioxidant properties value of 1.643, compared to sample S29 with 1.766. Thus, results from EDX analysis support the results obtained from the fire resistance test, as sample S26 showed better fire protection performance and is matched with the result obtained from EDX analysis.
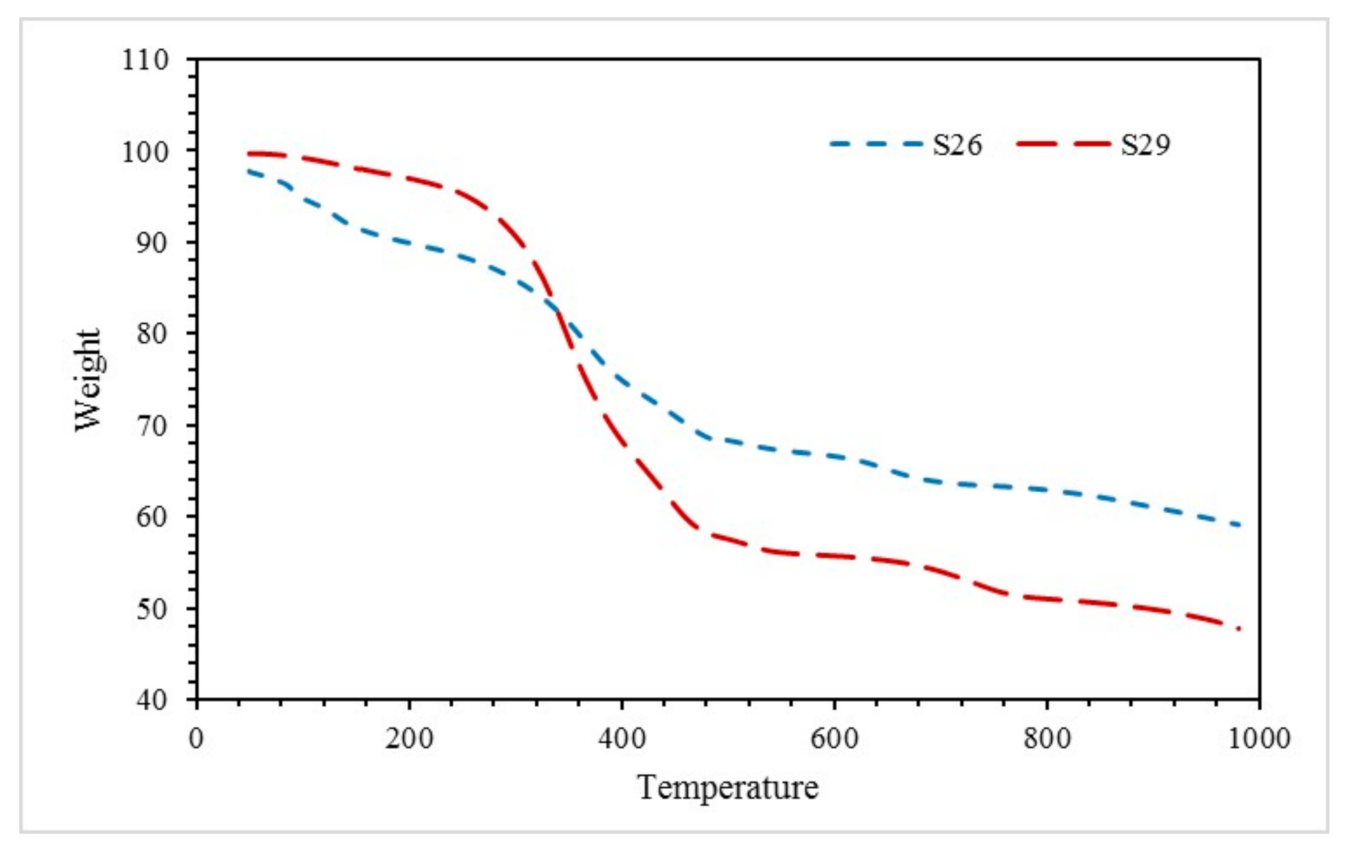
3.7. Thermogravimetric Analysis (TGA)
Thermal degradation of sample S26 and S29 was analysed using the TGA test.
Figure 10 shows TGA results obtained when samples were exposed to nitrogen at a heating rate of 10 °C/min over a temperature range from 50 °C to 1000 °C.
At the beginning of the experiment (50–200 °C), sample S26 recorded a rapid weight loss of 7.856%, which can be linked with the removal of free water, bonded water with hydrogen bond [
26], and water bonded to silicate molecules [
27]. Water loss through endothermic dehydration left behind a thermally stable residue [
28]. The small weight loss at this stage can also be related to the softening stage of solvent vaporisation [
29]. Meanwhile, for sample S29, weight loss occurred at 50–200 °C was 2.704%. Minimal weight loss for sample S29 can be associated with the RHA-based GB ratio, as this sample contained only 10 wt. % FR and 70 wt. % paint. As the endothermic dehydration reaction took place early, this result was reflected in the fire resistance test, which revealed that sample S26 intumesced faster, thicker, and possessed good fire-resistant properties.
The subsequent stage of the TGA curve (200–500 °C) is the stage of oxidative degradation for alkyd paint [
30]. It was observed that sample S26 recorded a 21.56% weight loss. Meanwhile, sample S29 recorded a 39.39% weight loss. Although sample S29 recorded a large weight loss at this stage, this sample exhibited poor thermal properties since the intumescent process was not fully able to take place due to minimal water content evaporated when exposed to the fire and generated less pressure in the pores of the material for thermal expansion.
The final stage of the TGA curve (500–1000 °C) displayed the region where the material approached thermal stability. By investigating the rate of water loss between 500 and 1000 °C for each sample, sample S26 indicated a lower rate of water loss with 0.009216 (%/°C) compared to sample S29 with 0.00976 (%/°C). This shows that sample S26 might reach thermal stability faster at a temperature over 1000 °C compared to sample S29.
Furthermore, at the end of the experiment, the residual weight of the coating for samples S26 and S29 was 59.15% and 47.81%, respectively. This indicated that sample S26 decomposed minimally compared to sample S29. This phenomenon was due to the catalyst effects of the FR additive. The presence of the RHA-based GB has led to improved thermal stability and fire retardancy of the coating sample. Furthermore, a suitable amount of RHA-based GB can enhance the thermal stability of the alkyd paint, which in this case was 50 wt. % FR and 70 wt. % paint.
By taking into account the thermal degradation and thermal stability of each sample, sample S26 possessed the best thermal performance as the sample that successfully thermally degraded and formed the intumescent layer during the fire resistance test, which helps to protect the mild steel substrate and lowered the heat of the sample at a much faster rate of time compared to other samples.


 ,
, 


