1. Introduction
World electricity consumption increased by 4% last year to over 23,000 TWh, and the share of electricity in global energy consumption was 20%. According to the data from IEA [
1], the largest end user of energy is transport (36%) and manufacturing, which is responsible for 23%. Machining is one of the most commonly used and energy consuming manufacturing processes [
2]. Therefore, research is being carried out and methods are being developed to optimize and reduce energy demand. In the case of machining, methods are mainly used to reduce the value of cutting forces, increase productivity and optimize processes. Bhaumik et al. [
3] analyzed machining titanium alloys with tools made of more durable tool materials, in particular cubic boron nitride (CBN). Da Silva et al. [
4] mentioned that the use of coatings for cutting tools reduces the coefficient of friction. Zhang et al. [
5] described the use of new insert designs like Wiper. Many authors analyzed the issue of process optimization, due to the time, number and place of machining operations. This was described by Rao et al. [
6], Słodki et al. [
7] and Jawahir et al. [
8]. Currently, due to the use of new machining methods, like Done in One [
9], the optimization of tool movement trajectories to increase process efficiency is becoming increasingly important. In this context, Bohez et al. [
10] described the optimization of tool motion kinematics.
Increasing productivity while reducing energy, material and tool costs is particularly difficult when machining difficult-to-cut materials [
11], including titanium alloys [
12,
13]. These materials have found a wide application in many industrial branches, such as chemical, petrochemical and shipbuilding, because of their excellent corrosion resistance. Niinomi [
14] and Sha et al. [
15] analyzed the usage of titanium alloys in medicine and dental for surgical and prosthetic implants, as well as in the automotive, aviation and space industries in engine and chassis components, due to the high strength-to-weight ratio (titanium density is around 60%, compared to super alloys based on nickel or cobalt).
Improvement in the machinability of titanium alloys can be achieved by using various techniques from dry machining [
16,
17] to cooling and lubrication of the cutting zone [
18] such as minimum quantity lubrication (MQL) machining [
19,
20], cryogenic machining or high-pressure Cooling (HPC) machining, i.e., the use of systems enabling feeding of cutting fluid to the cutting zone with increased pressure (from 50 to 355 bar, and even 1000 bar). It was analyzed by many authors, such as Ezugwu et al. [
21], Çolak [
22], Khan et al. [
23] and Da Silva et al. [
4].
A separate issue is the chip forming process, especially in machining difficult-to-cut materials, including titanium alloys. It has been the subject of analyzes undertaken by many researchers (e.g., [
7,
12,
24,
25]). In industrial practice, chip geometry and its varieties can take different forms, such as short and long ribbon, spiral, helical, arc, etc. [
24,
25]. The radius of curvature of the chip depends on the tool geometry and degree of wear, workpiece properties and cutting parameters, mainly feed [
12]. Currently produced cutting inserts usually have rake face with a chip breaker or a chip former (name depends on a tool manufacturer). Chip breaking usually results from a chip hitting the raw surface of the workpiece, or the flank face of the insert. It has been shown [
26] that, in the process of turning difficult-to-cut materials, the dominant way of chip breaking (for 85% of cases) is chip hitting the flank face.
The main area of research regarding machining of titanium alloys is the impact of cutting speed, feed and cutting depth on the quality of the machined surface, chip formation and breaking, determination of the value of cutting forces and temperature [
27,
28]. Palanisamy et al. [
29] conducted research on turning of the Ti6Al4V alloy. A series of experiments were carried out at various cutting parameters and pressure levels (i.e., 6 bar—standard pressure—or 90 bar—high coolant pressure), for machining with uncoated cemented carbide inserts. Studies have shown that the use of a high-pressure technique improves chip breaking and evacuation, due to the mechanical effect of high-pressure fluid. They also found that HPC treatment increased tool life almost three times, compared to conventional cooling. Çolak [
22] investigated the machinability of titanium alloy in conventional and high-pressure cooling conditions at different cutting speeds, feeds and depths of cut with a carbide tool coated with (Ti, Al) N + TiN. He stated that feeding the coolant under high pressure to the cutting zone reduces the values of the cutting forces, ensures the desired chip breaking and reduces wear of the cutting tool. Da Silva at al. [
4] analyzed the tool wear mechanism during high speed machining of titanium alloys. Tool life decreased with increasing cutting speed, despite the cooling system. A meaningful improvement of productivity was obtained when machining with a high pressure coolant supply, which causes the lowering friction and temperature and influence on the reduction of the tool-chip contact length and chip curl radius [
21,
30]. Segmented chips were generated when machining with HPC system. In case of machining with conventional coolant flow continuous chips were forming. In turn, Kamiński et al. [
28] analyzed the temperature in the cutting zone under HPC conditions. The authors say that the application of coolant pressure between 20 and 70 MPa decreases the temperature in conventional cooling in comparison with dry machining (about 15%). The reduction of temperature when HPC is used may be even about 40%–45%. Higher coolant pressure strongly influences the chips breaking.
Many researchers were involved in optimization of titanium alloys machining using various methods and mathematical models [
31]. For example, Cus et al. [
32] demonstrated the usefulness of genetic algorithms (GA) for online optimization of cutting parameters in the milling process. Heron et al. [
19] and Wang et al. [
33] developed an optimization model for the turning process, taking into consideration factors affecting machining, such as: cutting force (
Fc), tool life (
T), surface roughness (
Ra), material removal rate and chip breaking.
The purpose of the article is to develop a method for reducing power demand in turning Ti6Al4V titanium alloy using the HPC system. The paper consists of four sections. After introduction, the second section describes the experimental procedures and case study, and offers a description of chip breakability and the energy requirements of turning titanium alloy. Results of the experiments are presented in section three. At the end of the paper (
Section 4), the authors summarize the investigation.
3. Results of Experiment and Discussion
The influence of the variable cutting parameters on the values of the total cutting force components, main
Fc, feed
Ff and radial
Fp, was analyzed.
Table 4 presents the results of the S/N parameter and the average values of the individual components obtained in the individual tests system.
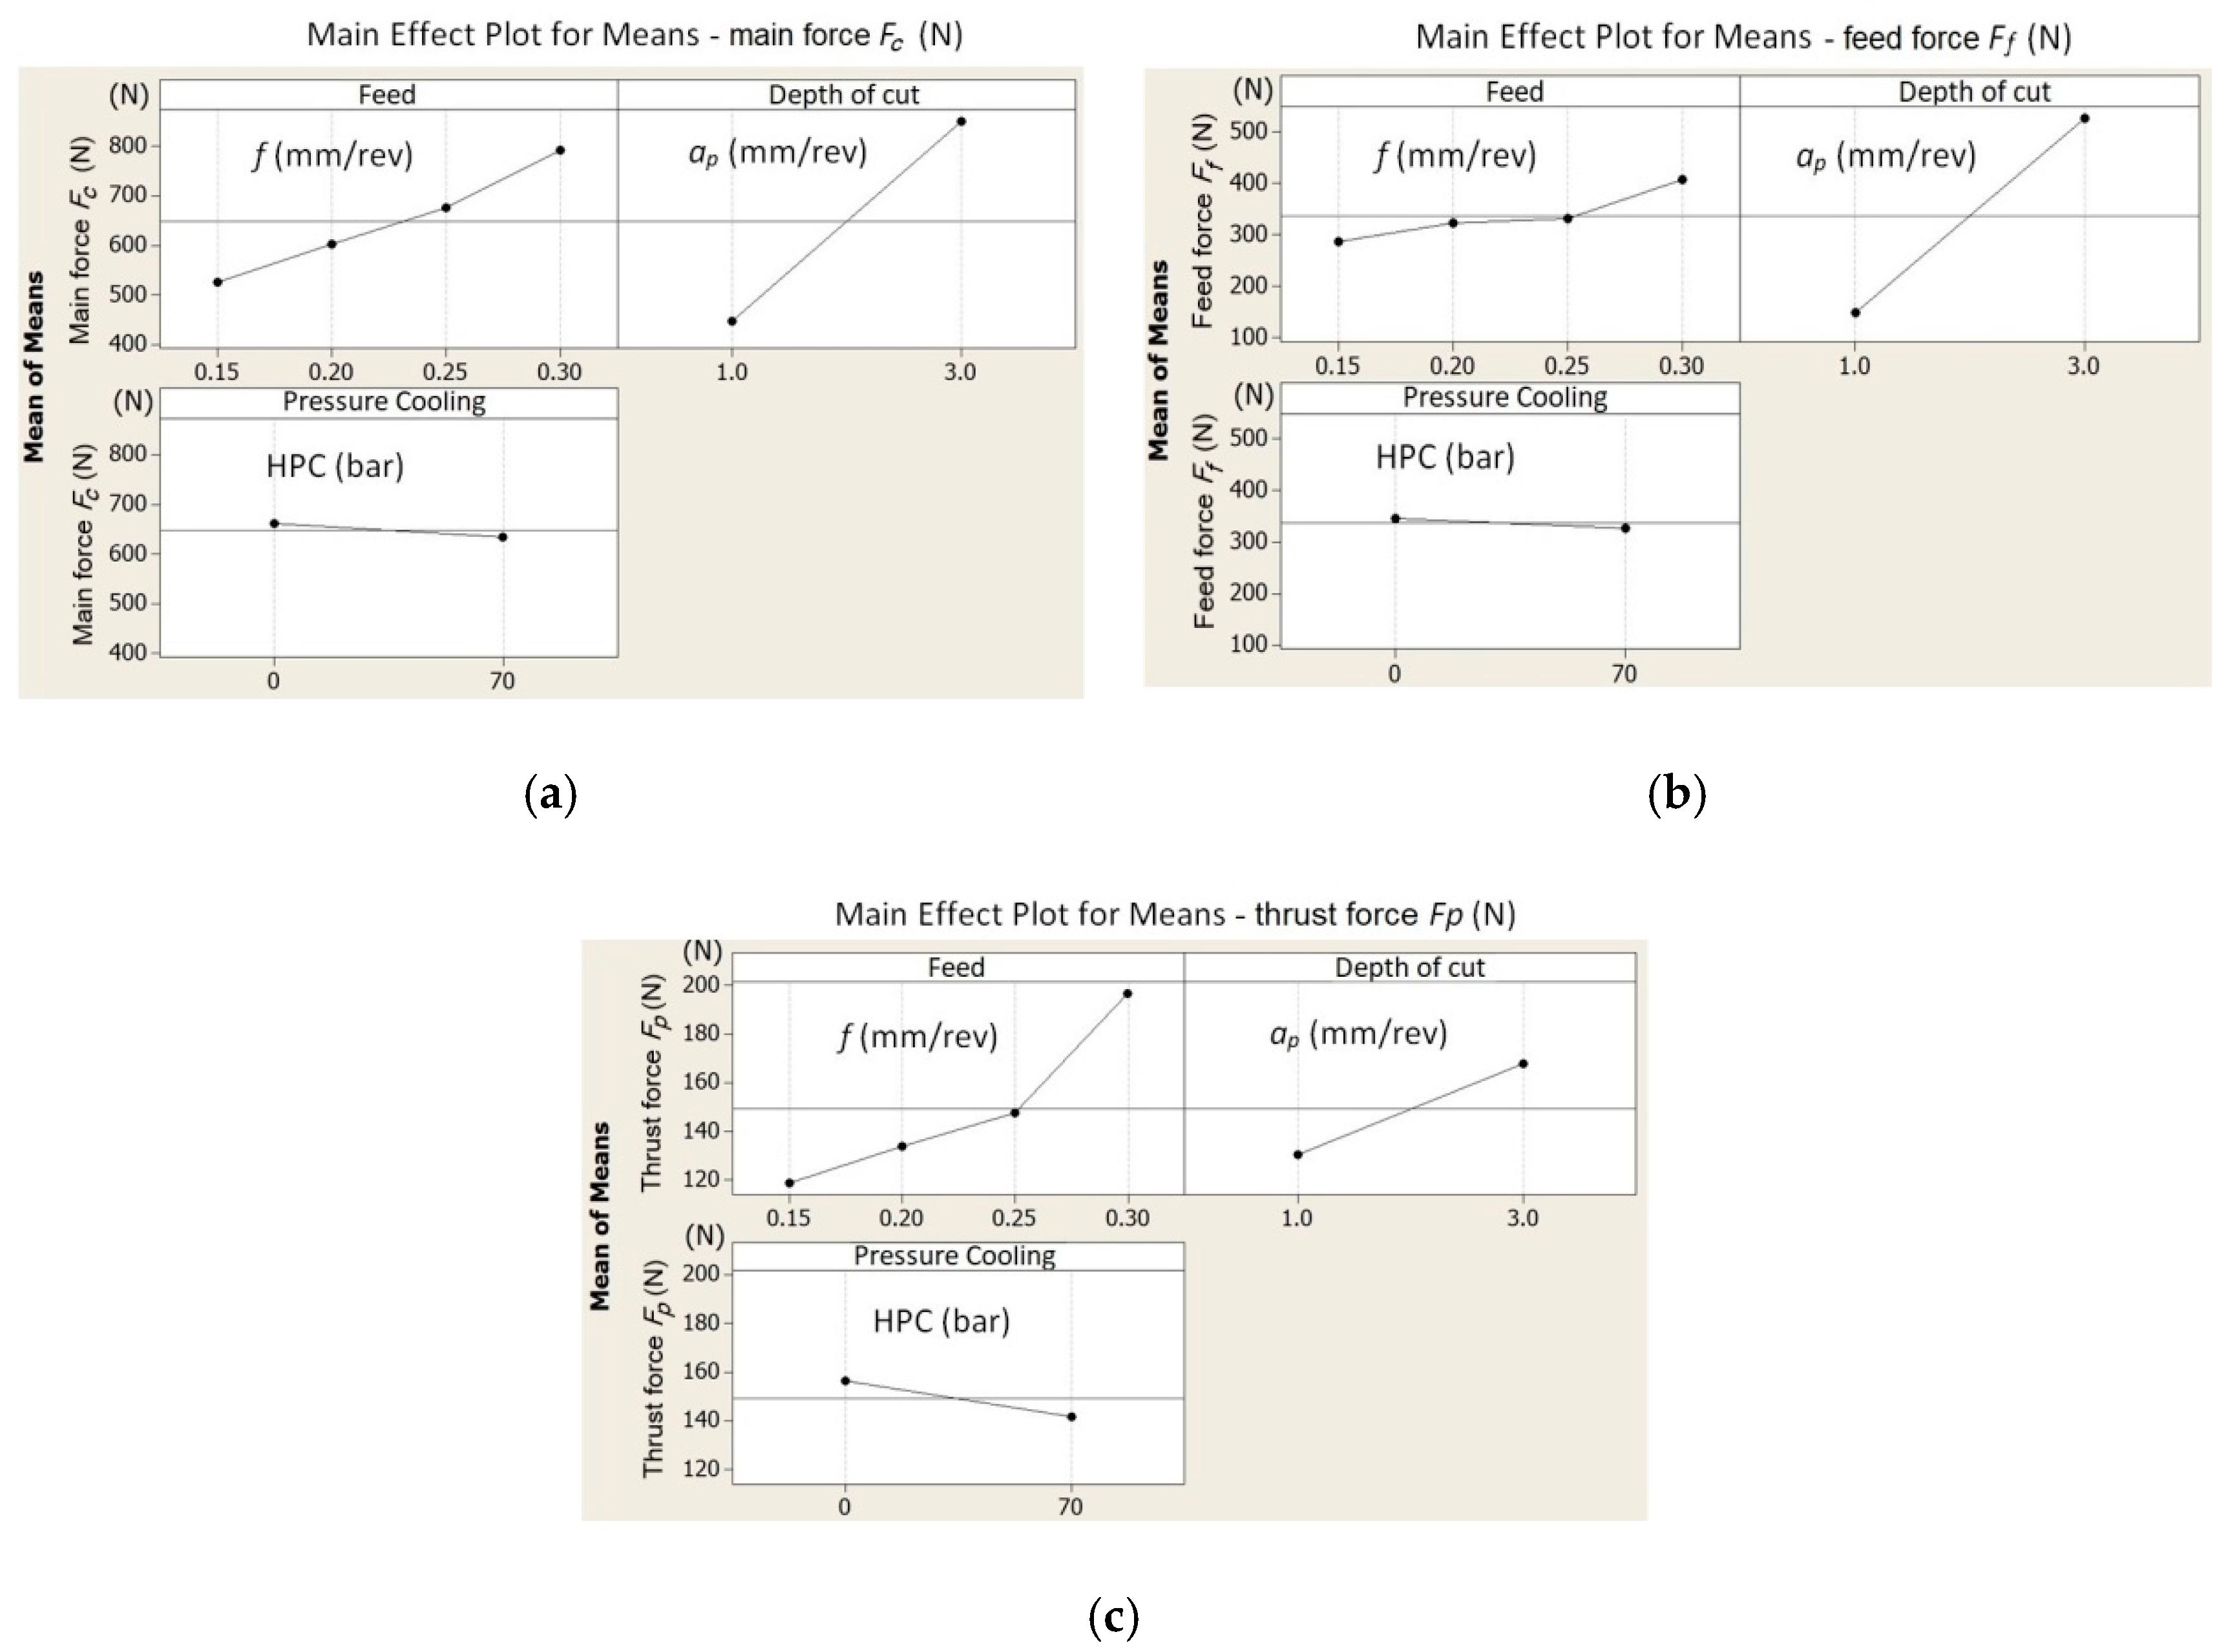
Figure 6 shows, in graphic form, the influence of the particular cutting data on the values of the cutting force components.
Analysis of the test results showed that the coolant pressure value has no significant effect on the values of the components of the total cutting force. An increase of the pressure to 70 bar caused a decrease of the values of
Fc and
Ff by several percent (3%–8%). A greater pressure effect (9%–15%) is visible for the
Fp component (
Figure 6c). It may result from the direct influence of the cutting fluid stream fed in the same direction, i.e., the addition of forces resulting from the machining process and the pressure of the liquid.
Table 5,
Table 6 and
Table 7 show the analysis of variance (ANOVA) regression analysis results of the components for the total cutting force (where:
DF—degrees of freedom,
Seq SS—sums of squares,
Adj SS—adjusted sums of squares,
Adj MS—adjusted means squares).
The parameters significantly affecting the values of the cutting forces are the feed and depth of cut. An increase of the value of the peripheral component
Fc by about 200 N was observed when changing the feed from
f = 0.15 mm/rev to
f = 0.30 mm/rev. A similar trend is visible for changing the depth of cut. The research also showed no significant effect of coolant pressure on the surface roughness values
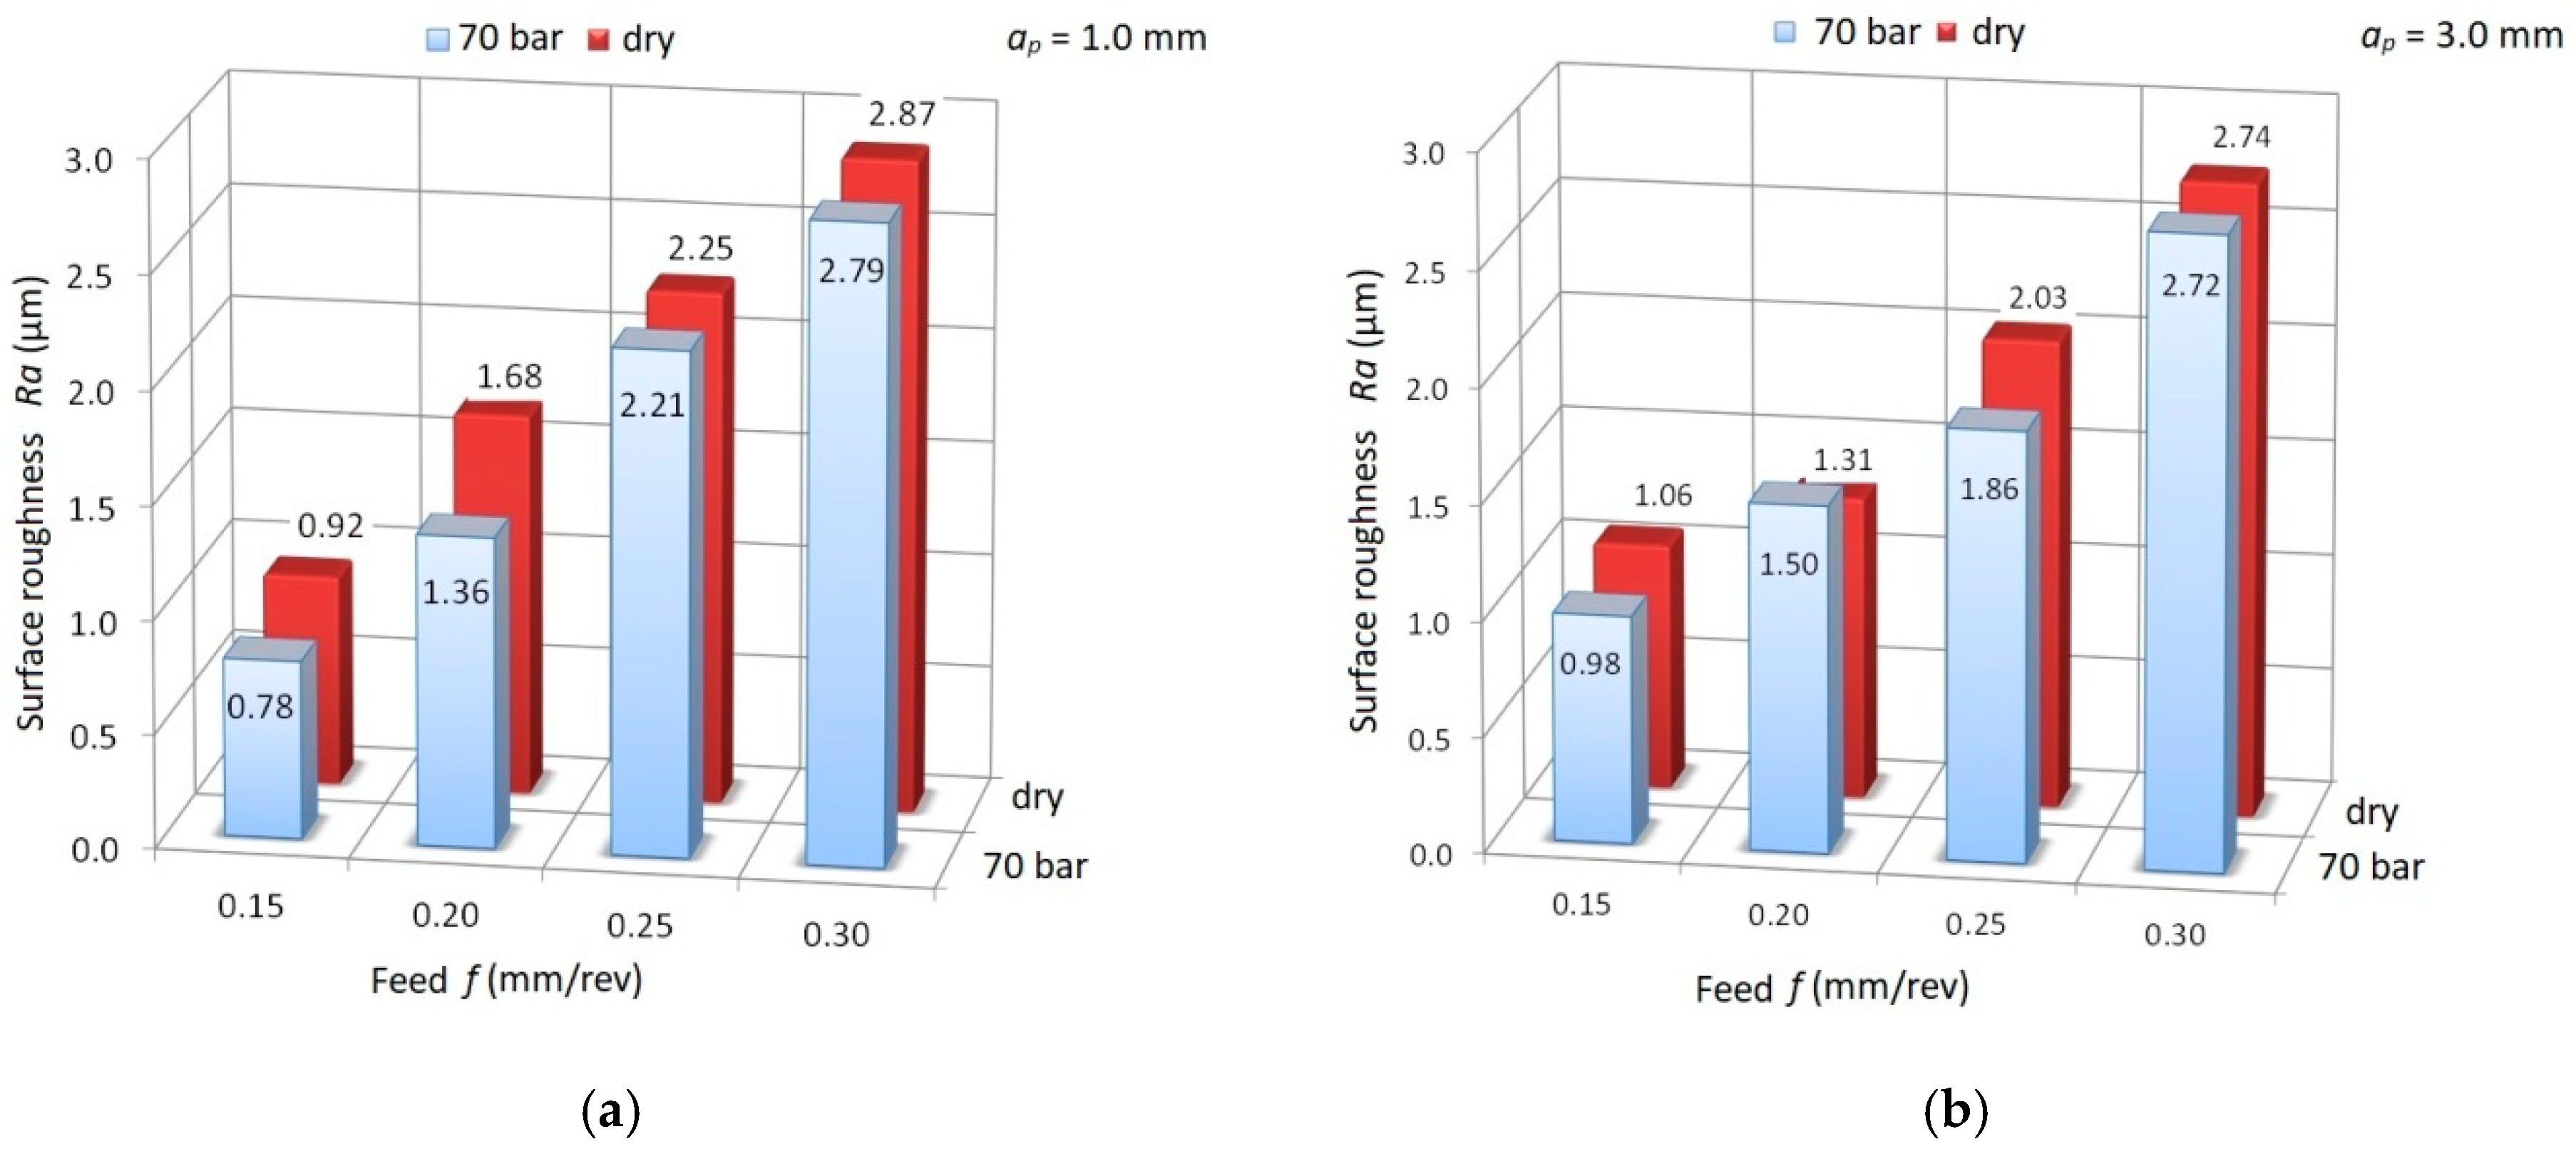
Ra.
Figure 7 shows a comparison of the measurement results for
Ra for dry machining and HPC.
It follows from the above that increasing coolant pressure in the cutting process mainly supports the chip breaking process. Therefore, an analysis of the chip geometry obtained in experimental studies was carried out.
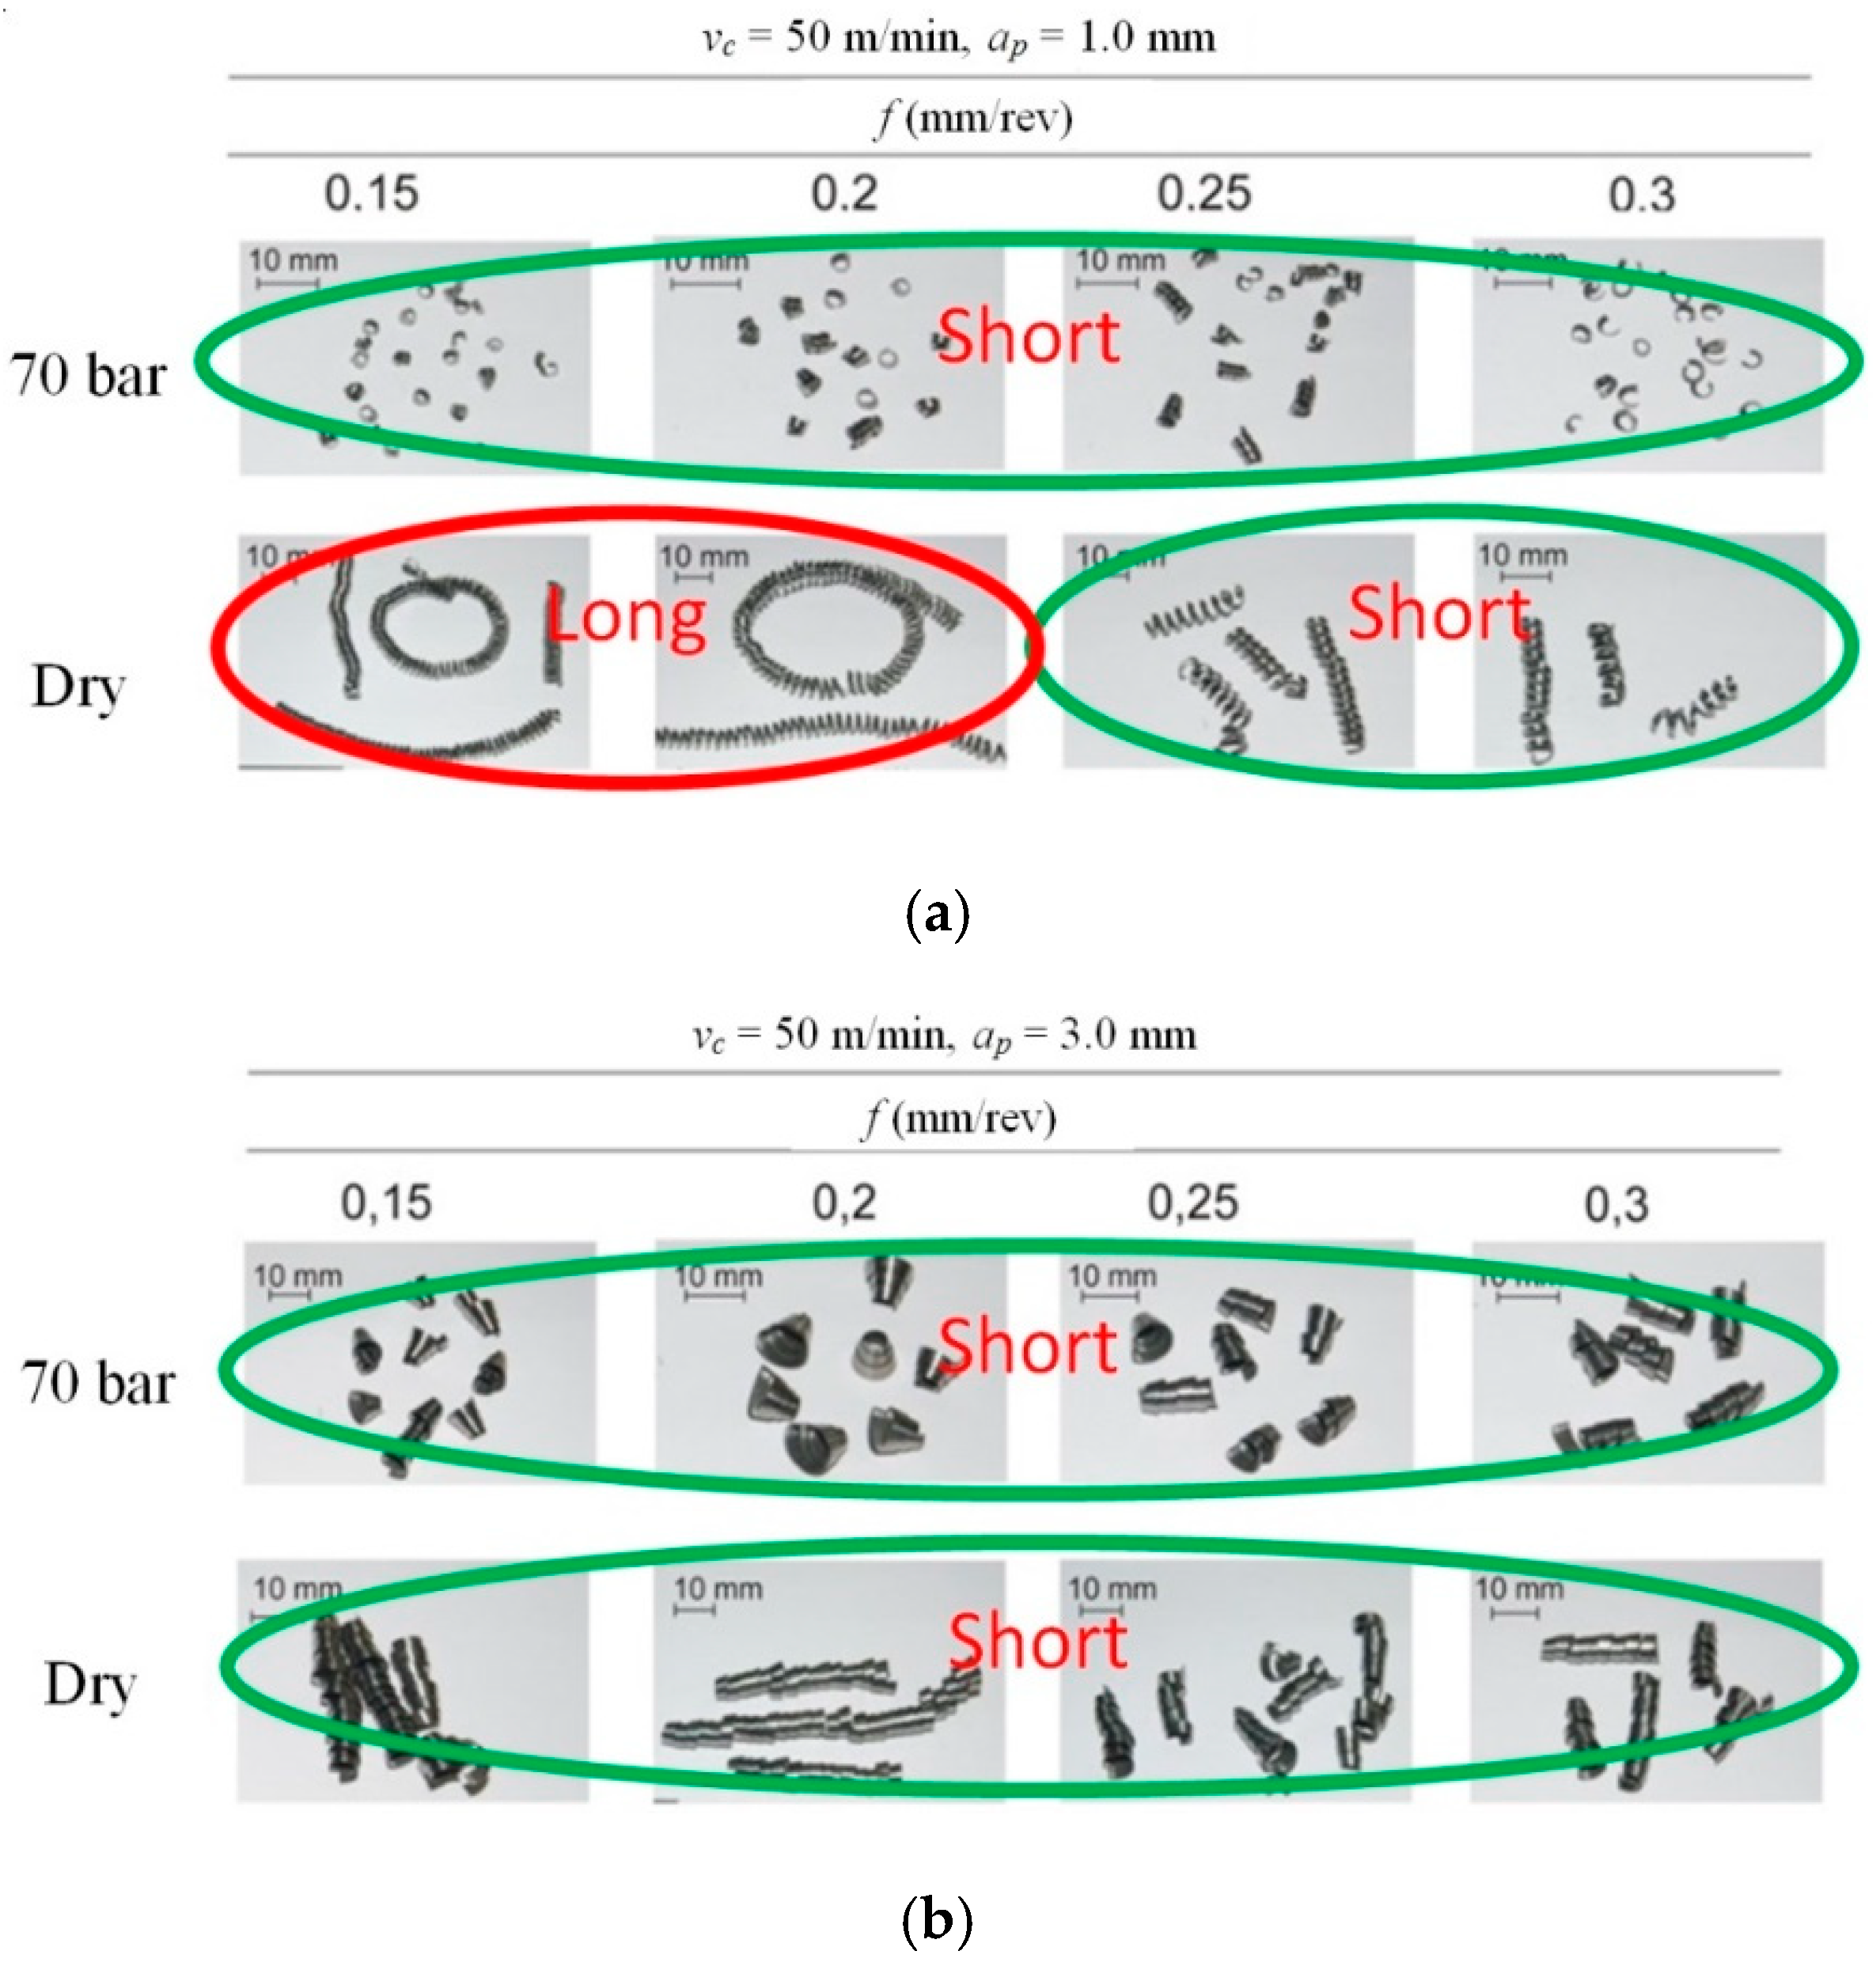
Figure 8 shows photographs of chips of various forms. Short, broken chips were obtained in all cutting tests with HPC pressure
p = 70 bar. For dry machining, a change of the form of chips from long to short was observed by increasing the feed values
f and cutting depth
ap, and, hence, higher values of the cross-section of the chip were created. This is due to the better filling of the chip groove by the created chip. This phenomenon was also analyzed by Balaji et al. [
48].
The next step taken in the research was to determine the effect of cutting zone cooling on the power consumption (
Pc) and the chip breaking index (
Cin). Power value was calculated according to the formula:
In
Table 8 and
Table 9, the results of measurements of the average chip length (
Lch), the power (
Pc) and the chip breaking coefficient (
Cin) are compared.
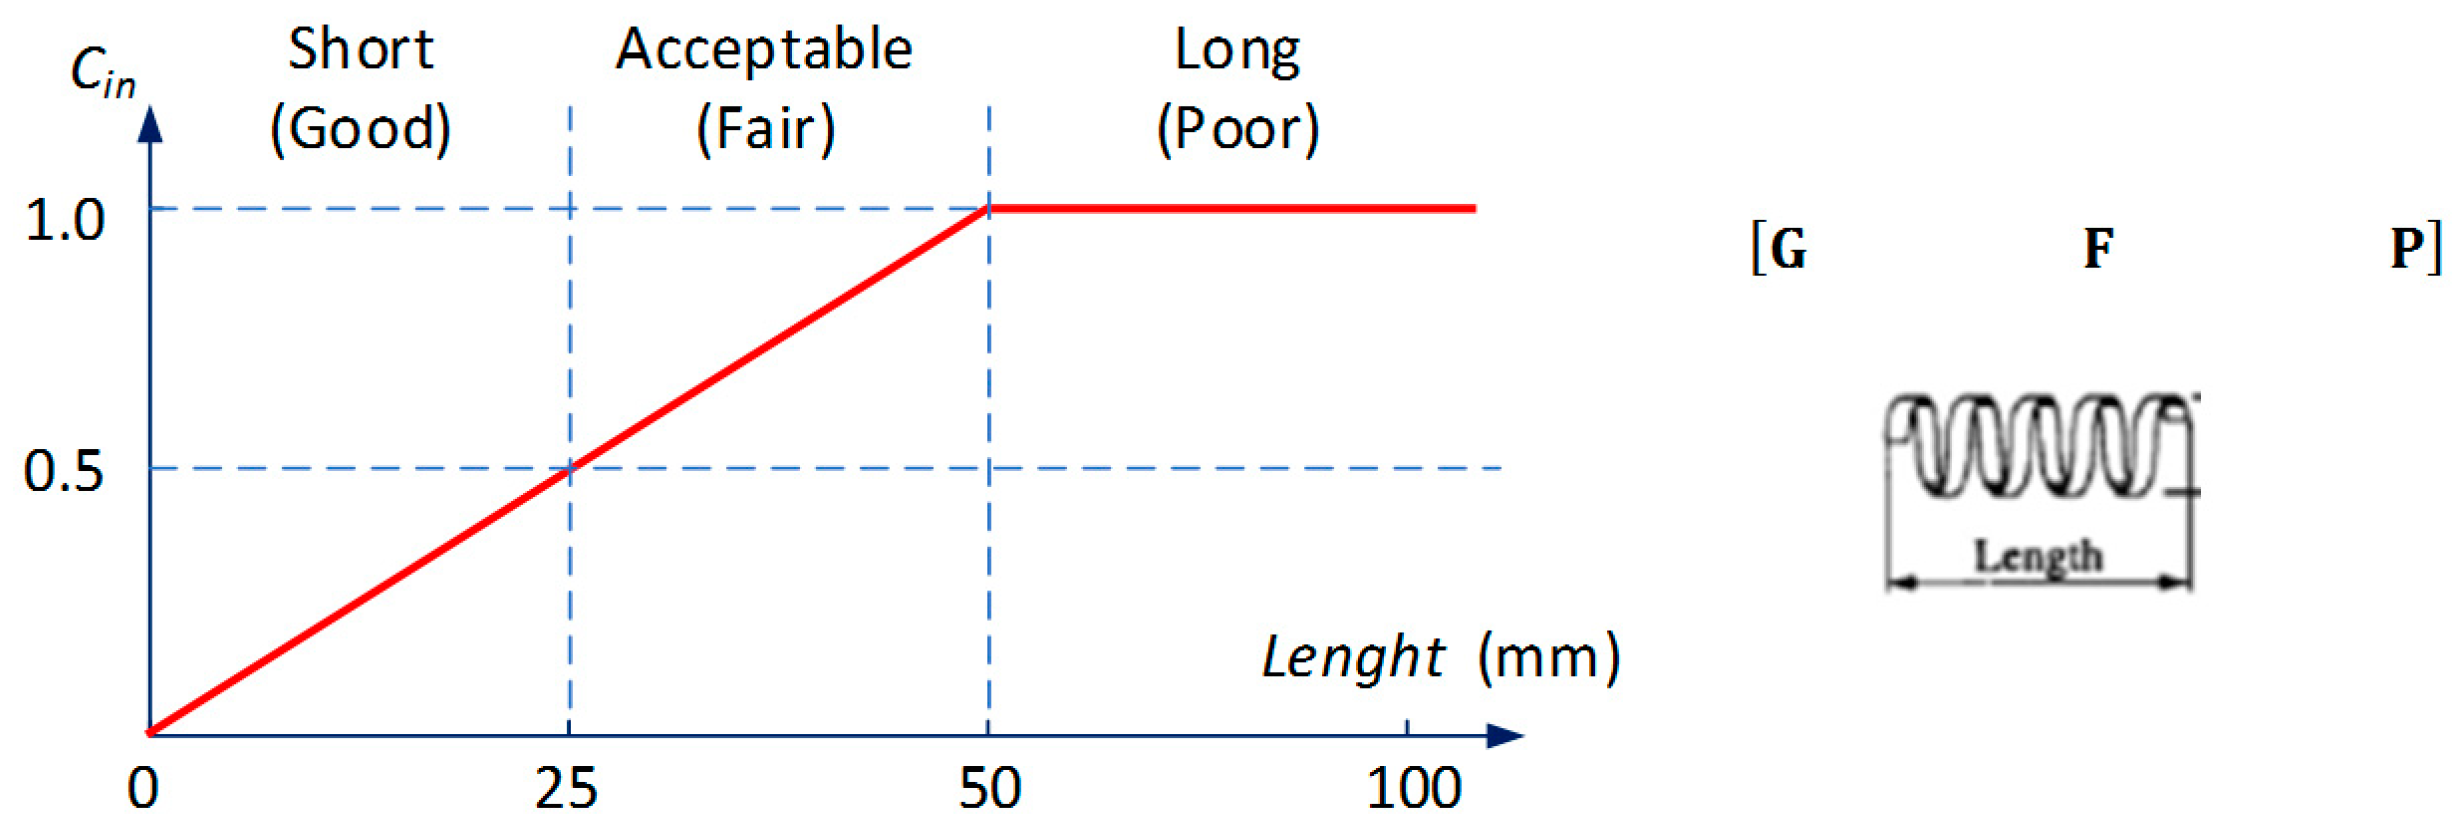
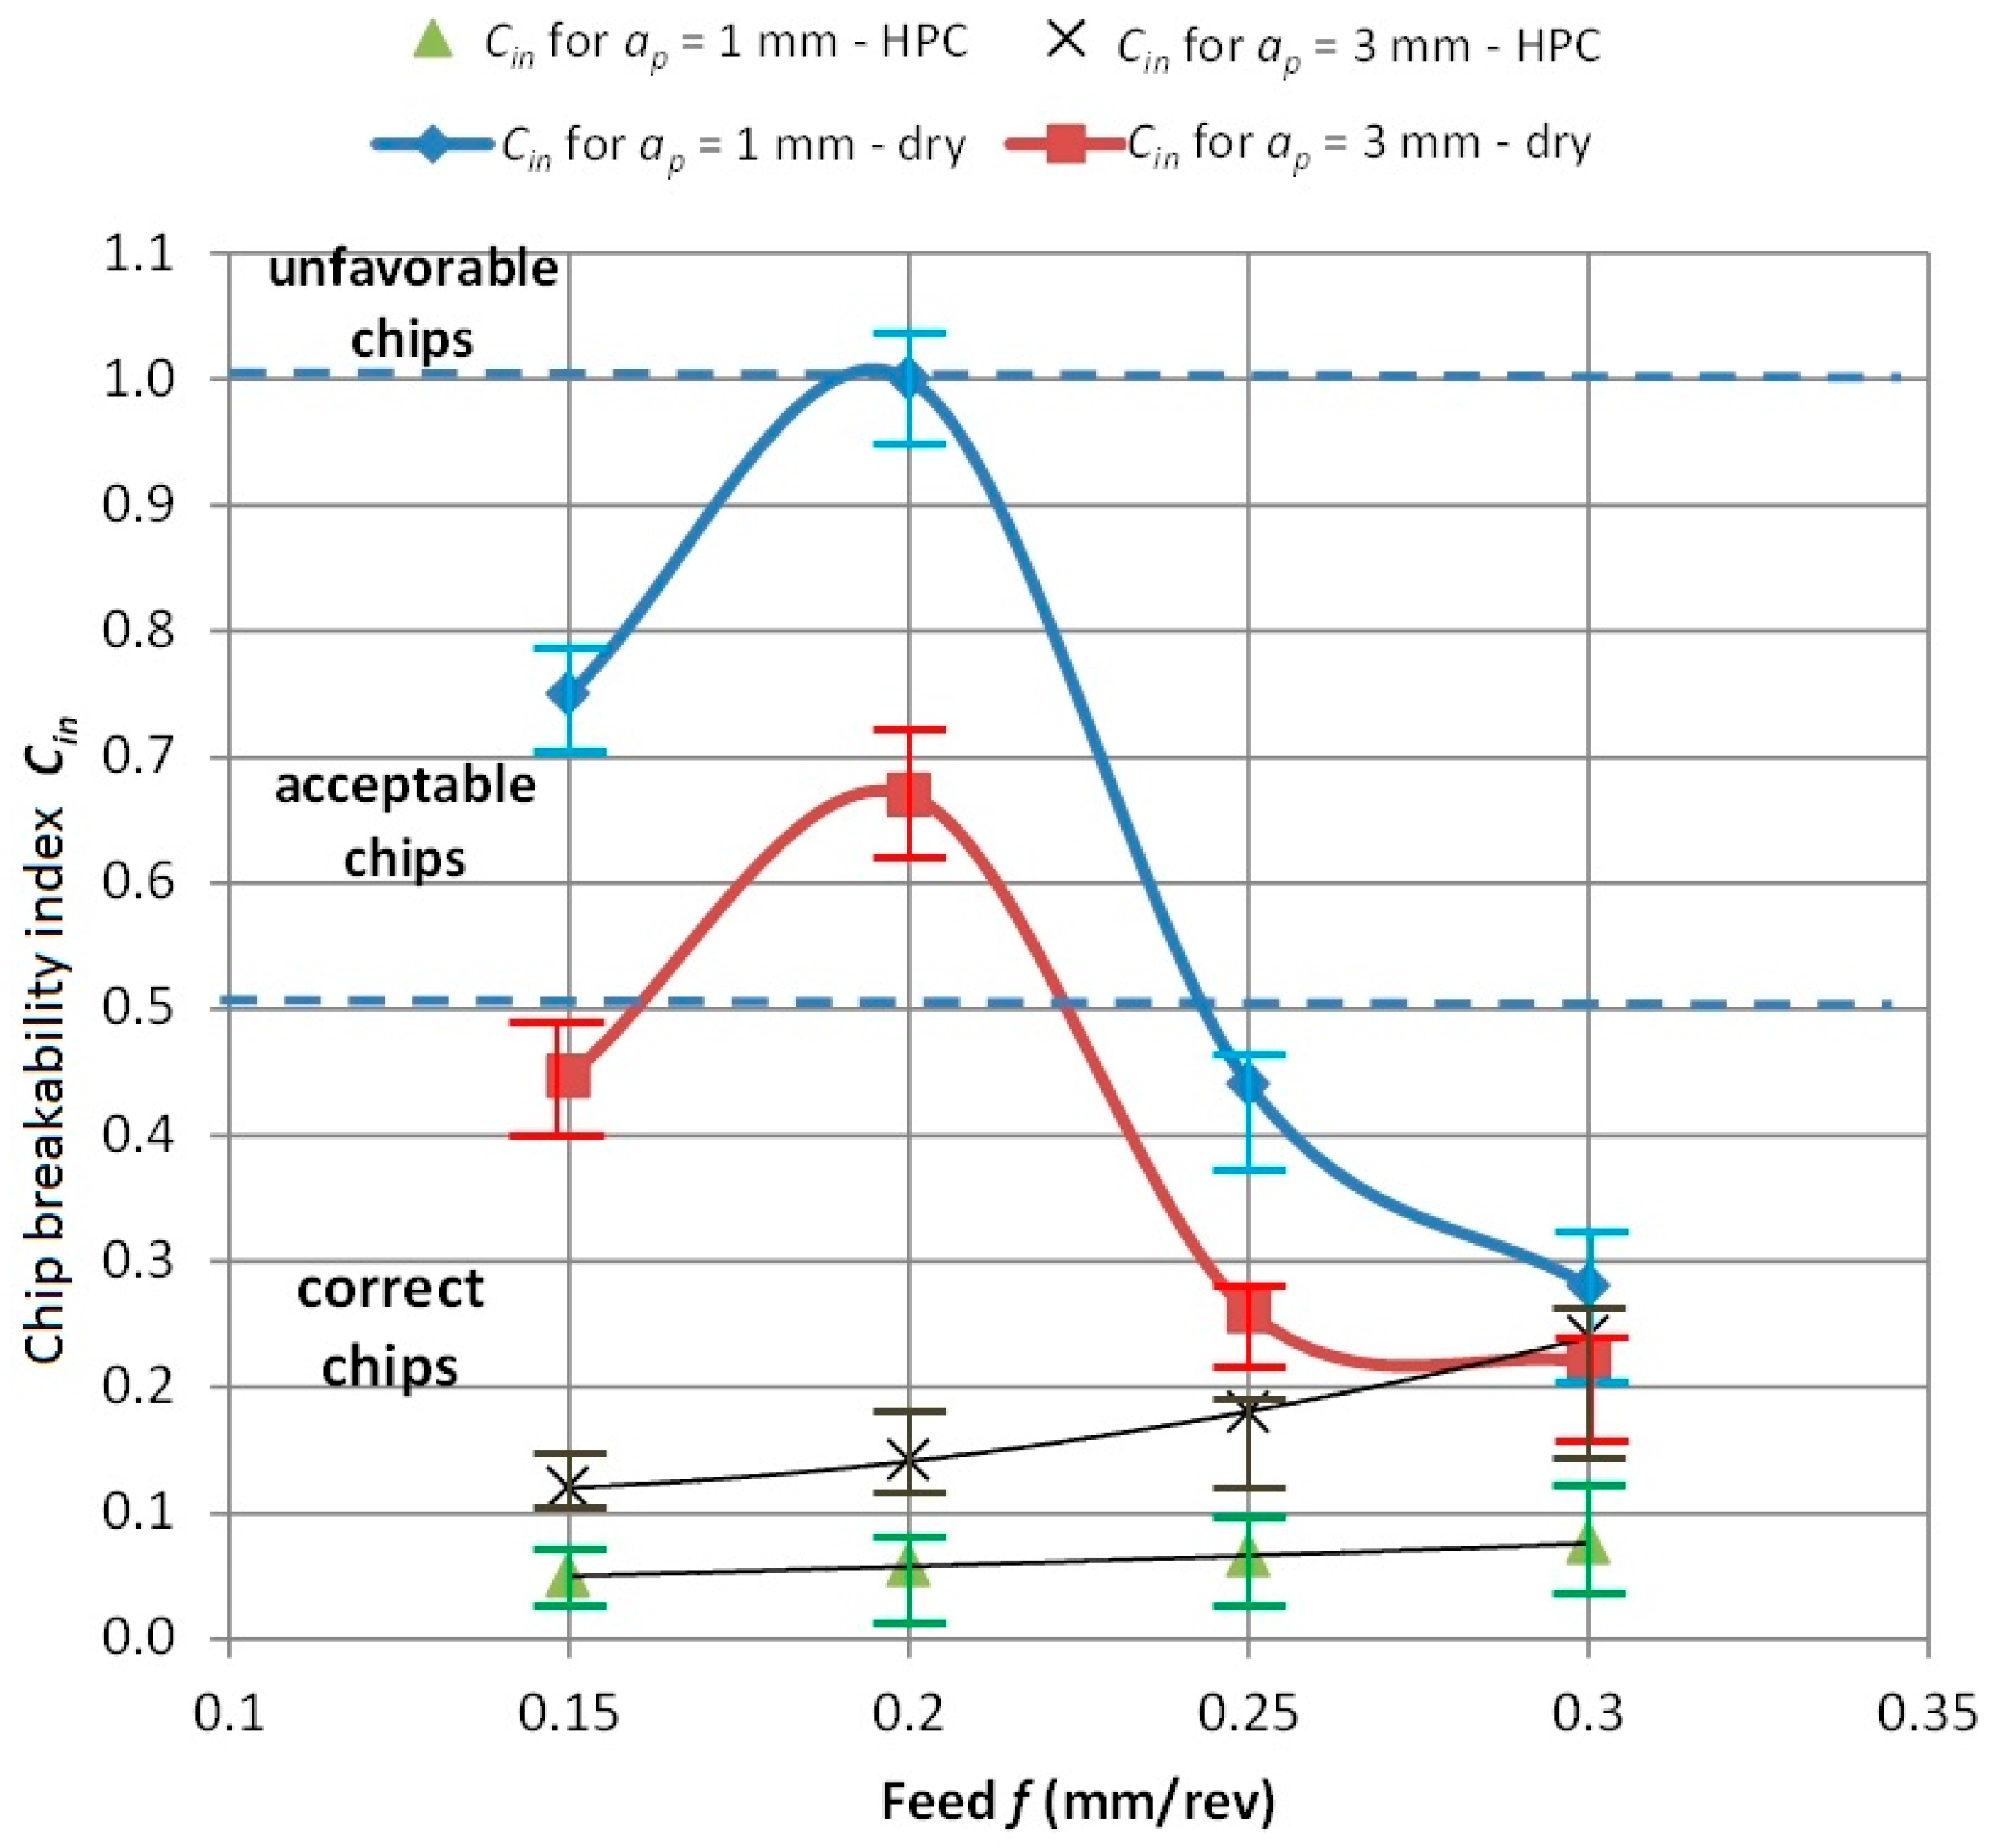
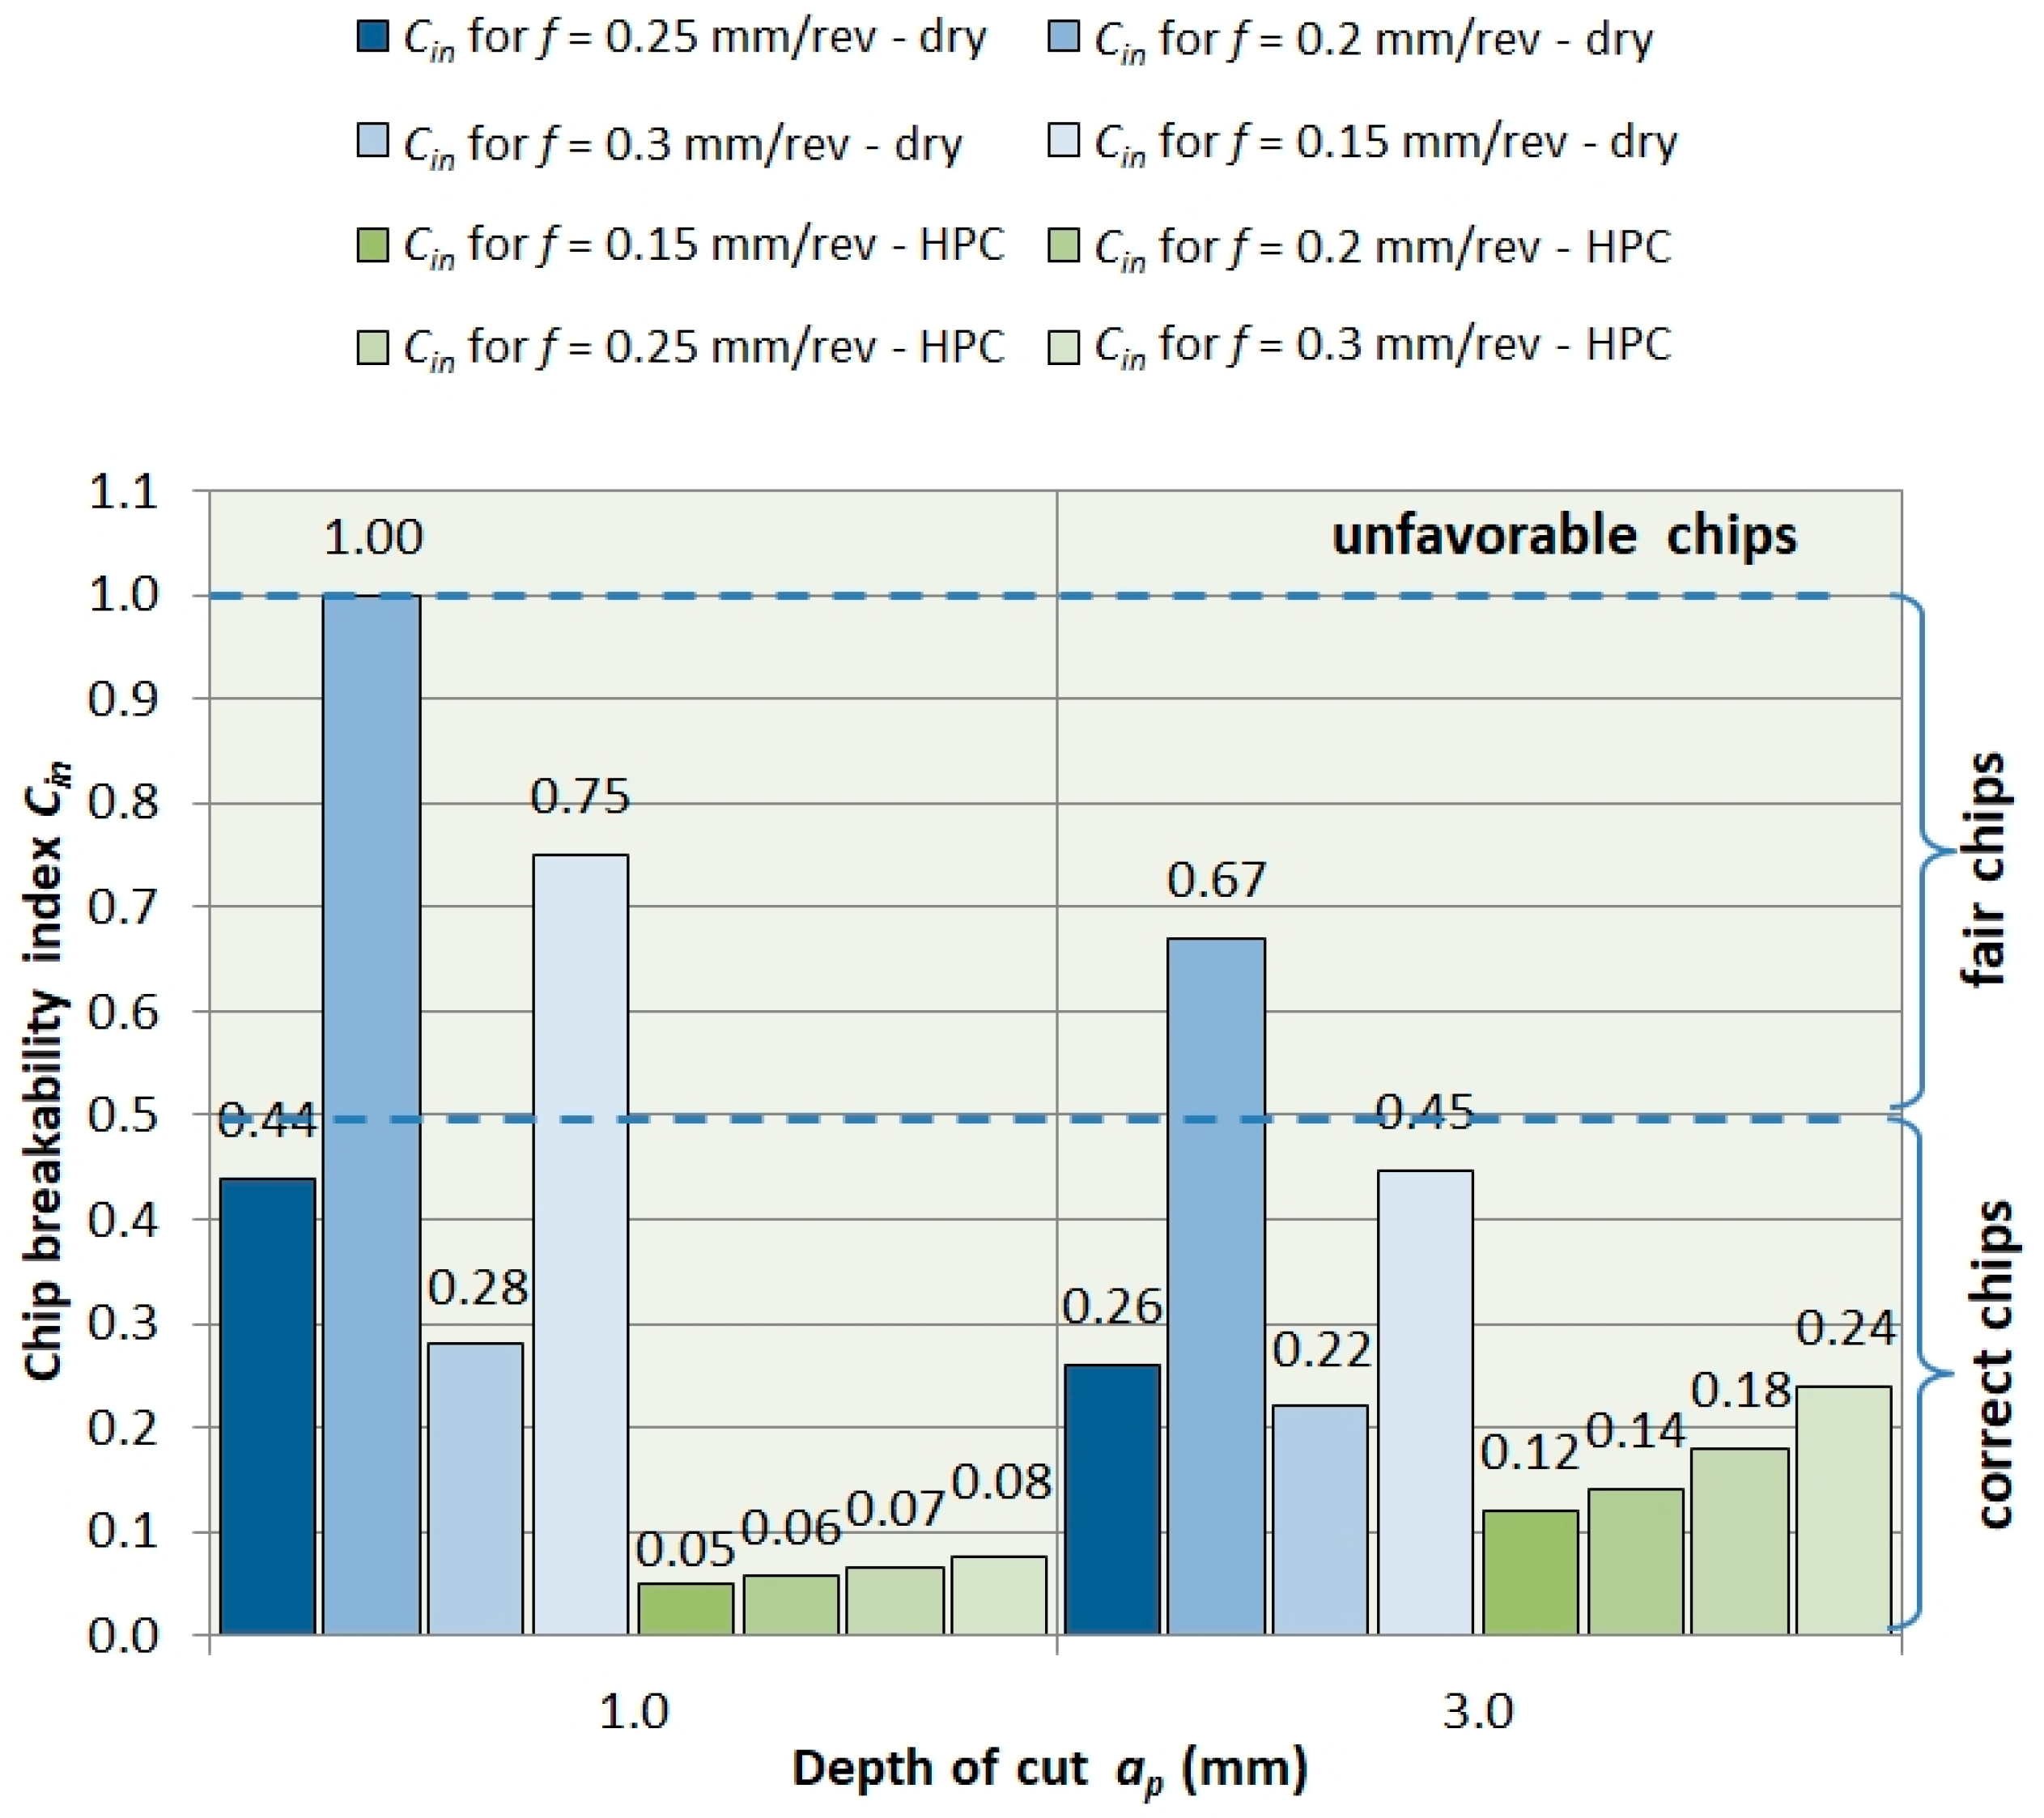
Figure 9 and
Figure 10 show the dependence of the chip breaking index
Cin from the feed
f and depth of cut
ap. The drawings indicate three areas for classification of correct, acceptable and unfavorable chips. It can be seen that in the case of dry machining, the chip geometry is variable and depends on the feed value
f. In the feed range of 0.15 <
f < 0.25 mm/rev, three forms are observed. For tested feed
f > 0.25 mm/rev, a correct chip shape was obtained with the
Cin coefficient similar to HPC machining.
In turn, increasing the depth of cut
ap strengthens the chip breaking process
Figure 10. Chip geometry tends towards correct chips. For the HPC turning case, in all analyzed cases, the chips had a correct form.
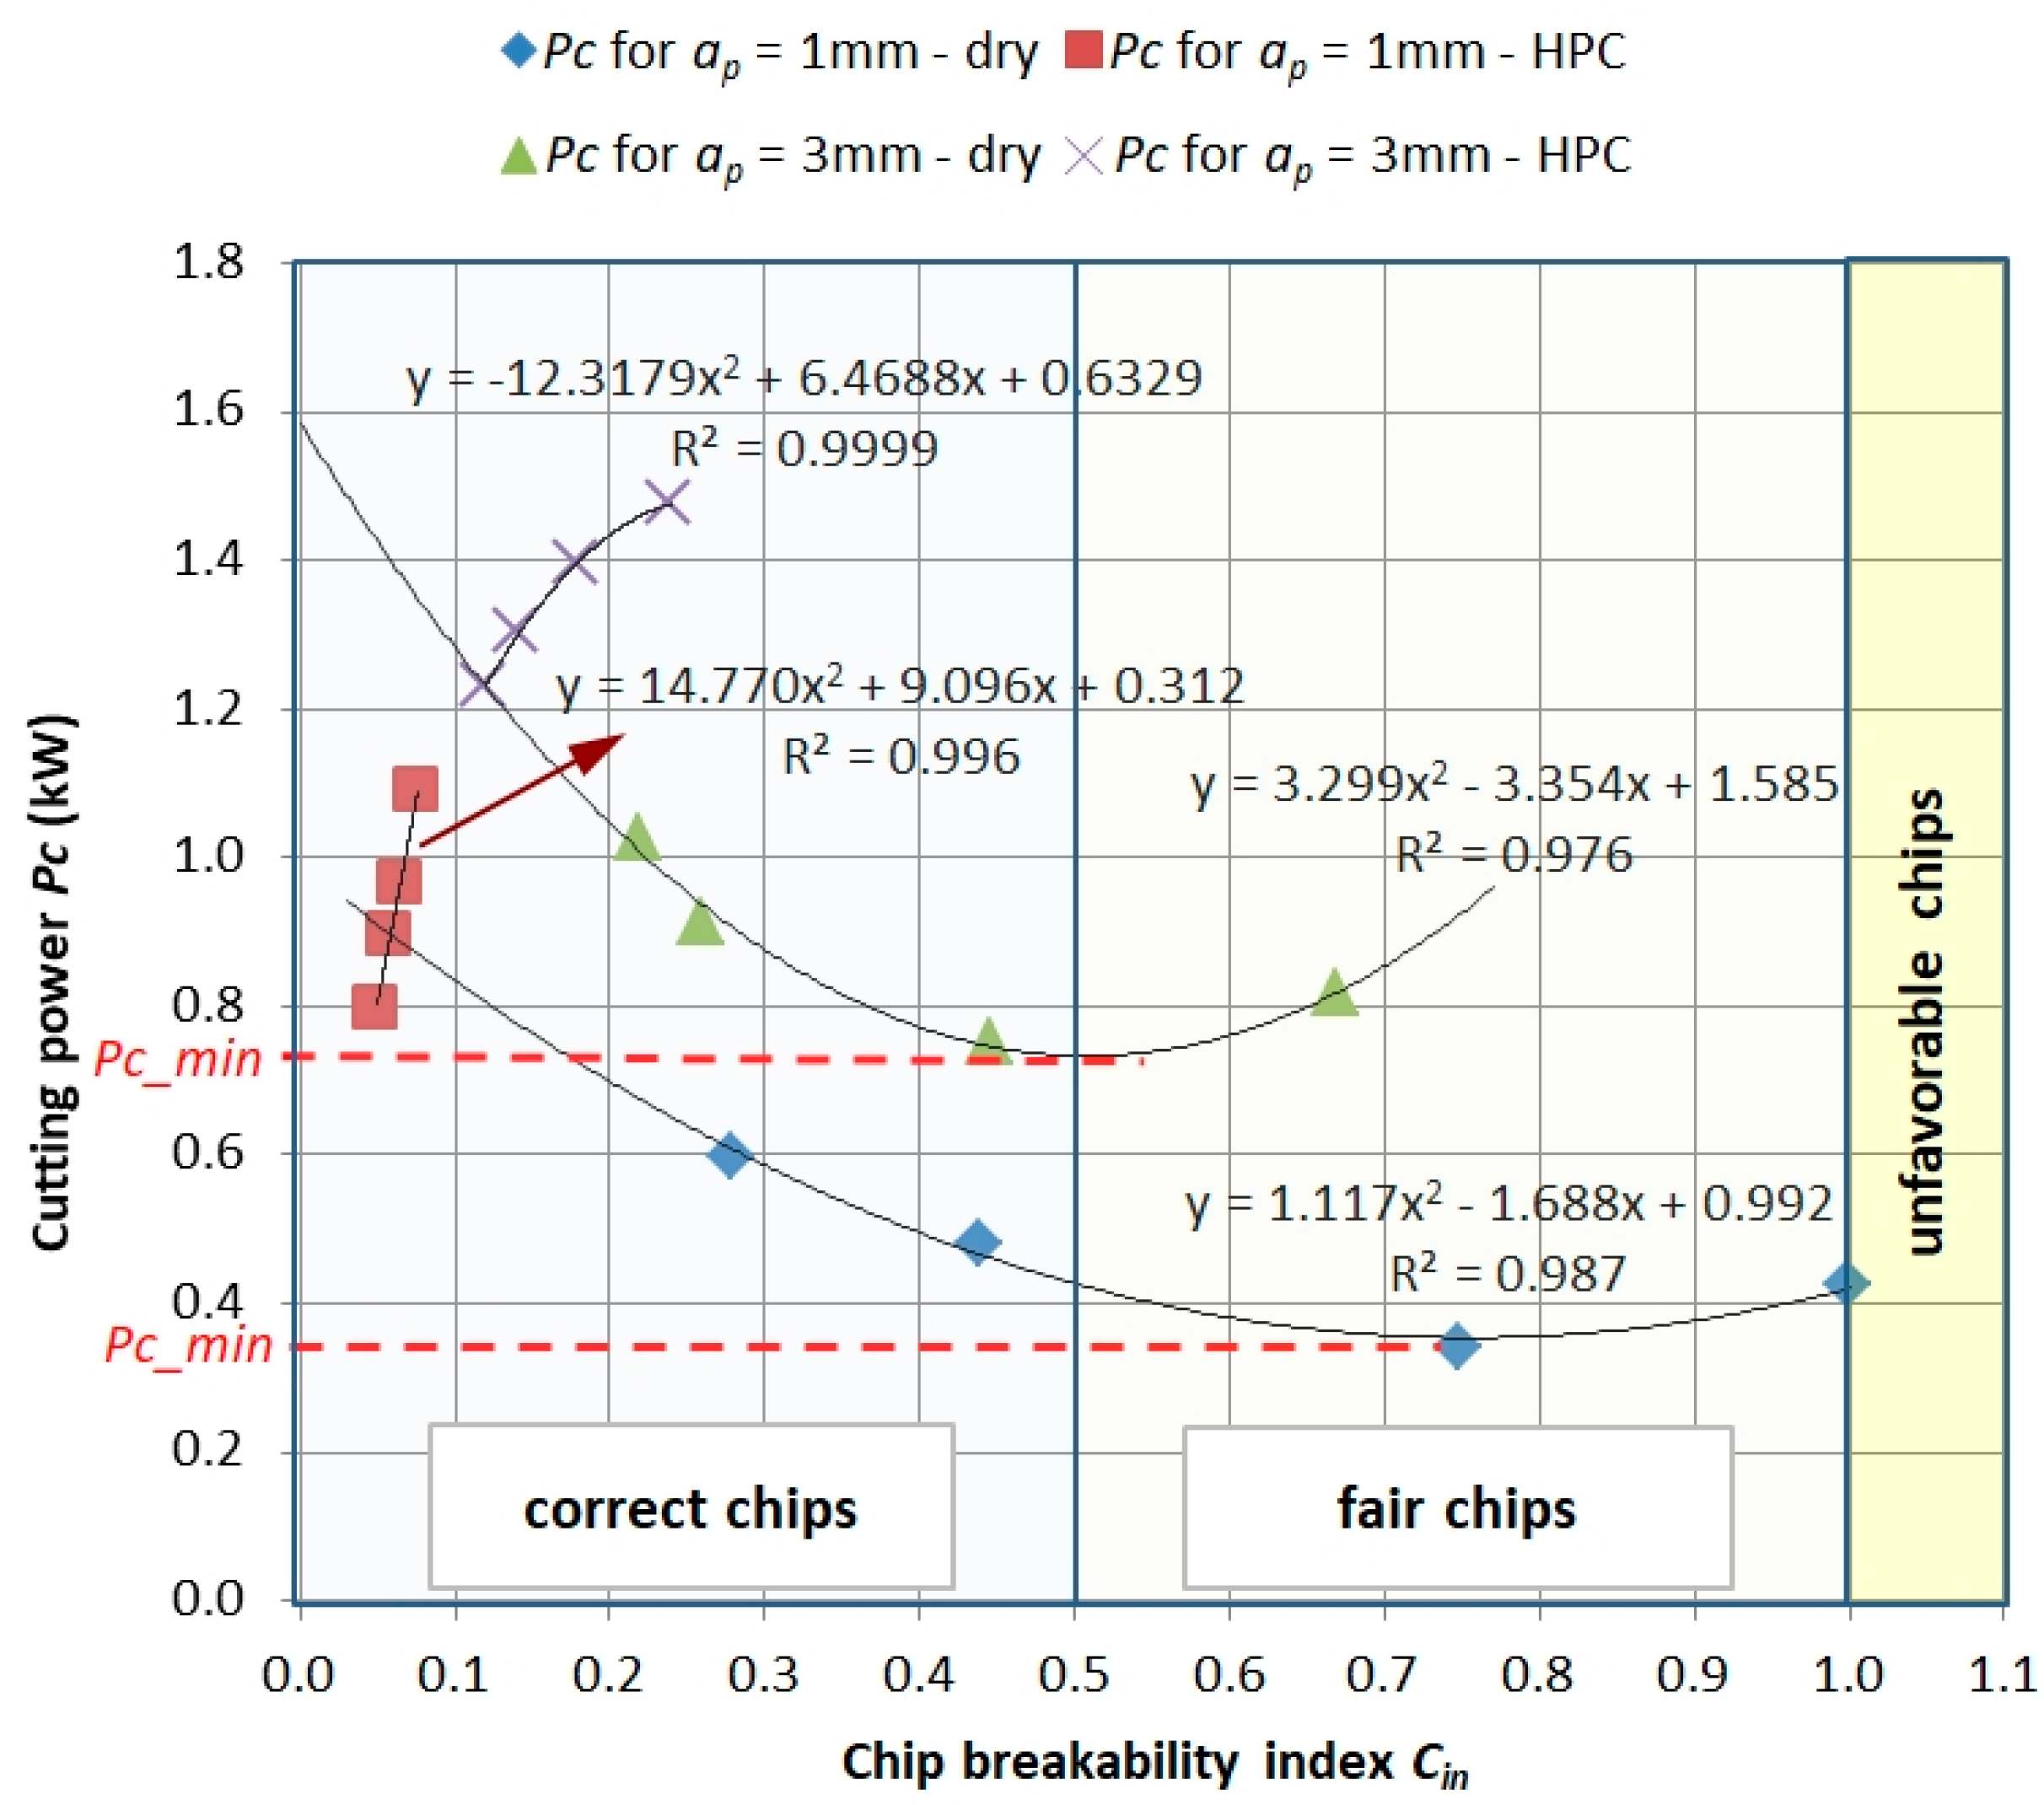
Figure 11 shows the dependence of the
Pc power demand as a function of the chip breaking ratio
Cin. The presented relationships show that a correct and acceptable form of chips can be obtained with a reduced demand of cutting power. The minimum value
Pcmin depends on the feed value
f and depth of cut
ap, i.e., on the cross-section of the cut layer. The machining method, in this case the change from dry machining to HPC machining, reduces the value of the
Cin chip breakage index (i.e., shorter, more broken chips) but also significantly increases the demand for cutting power
Pc.
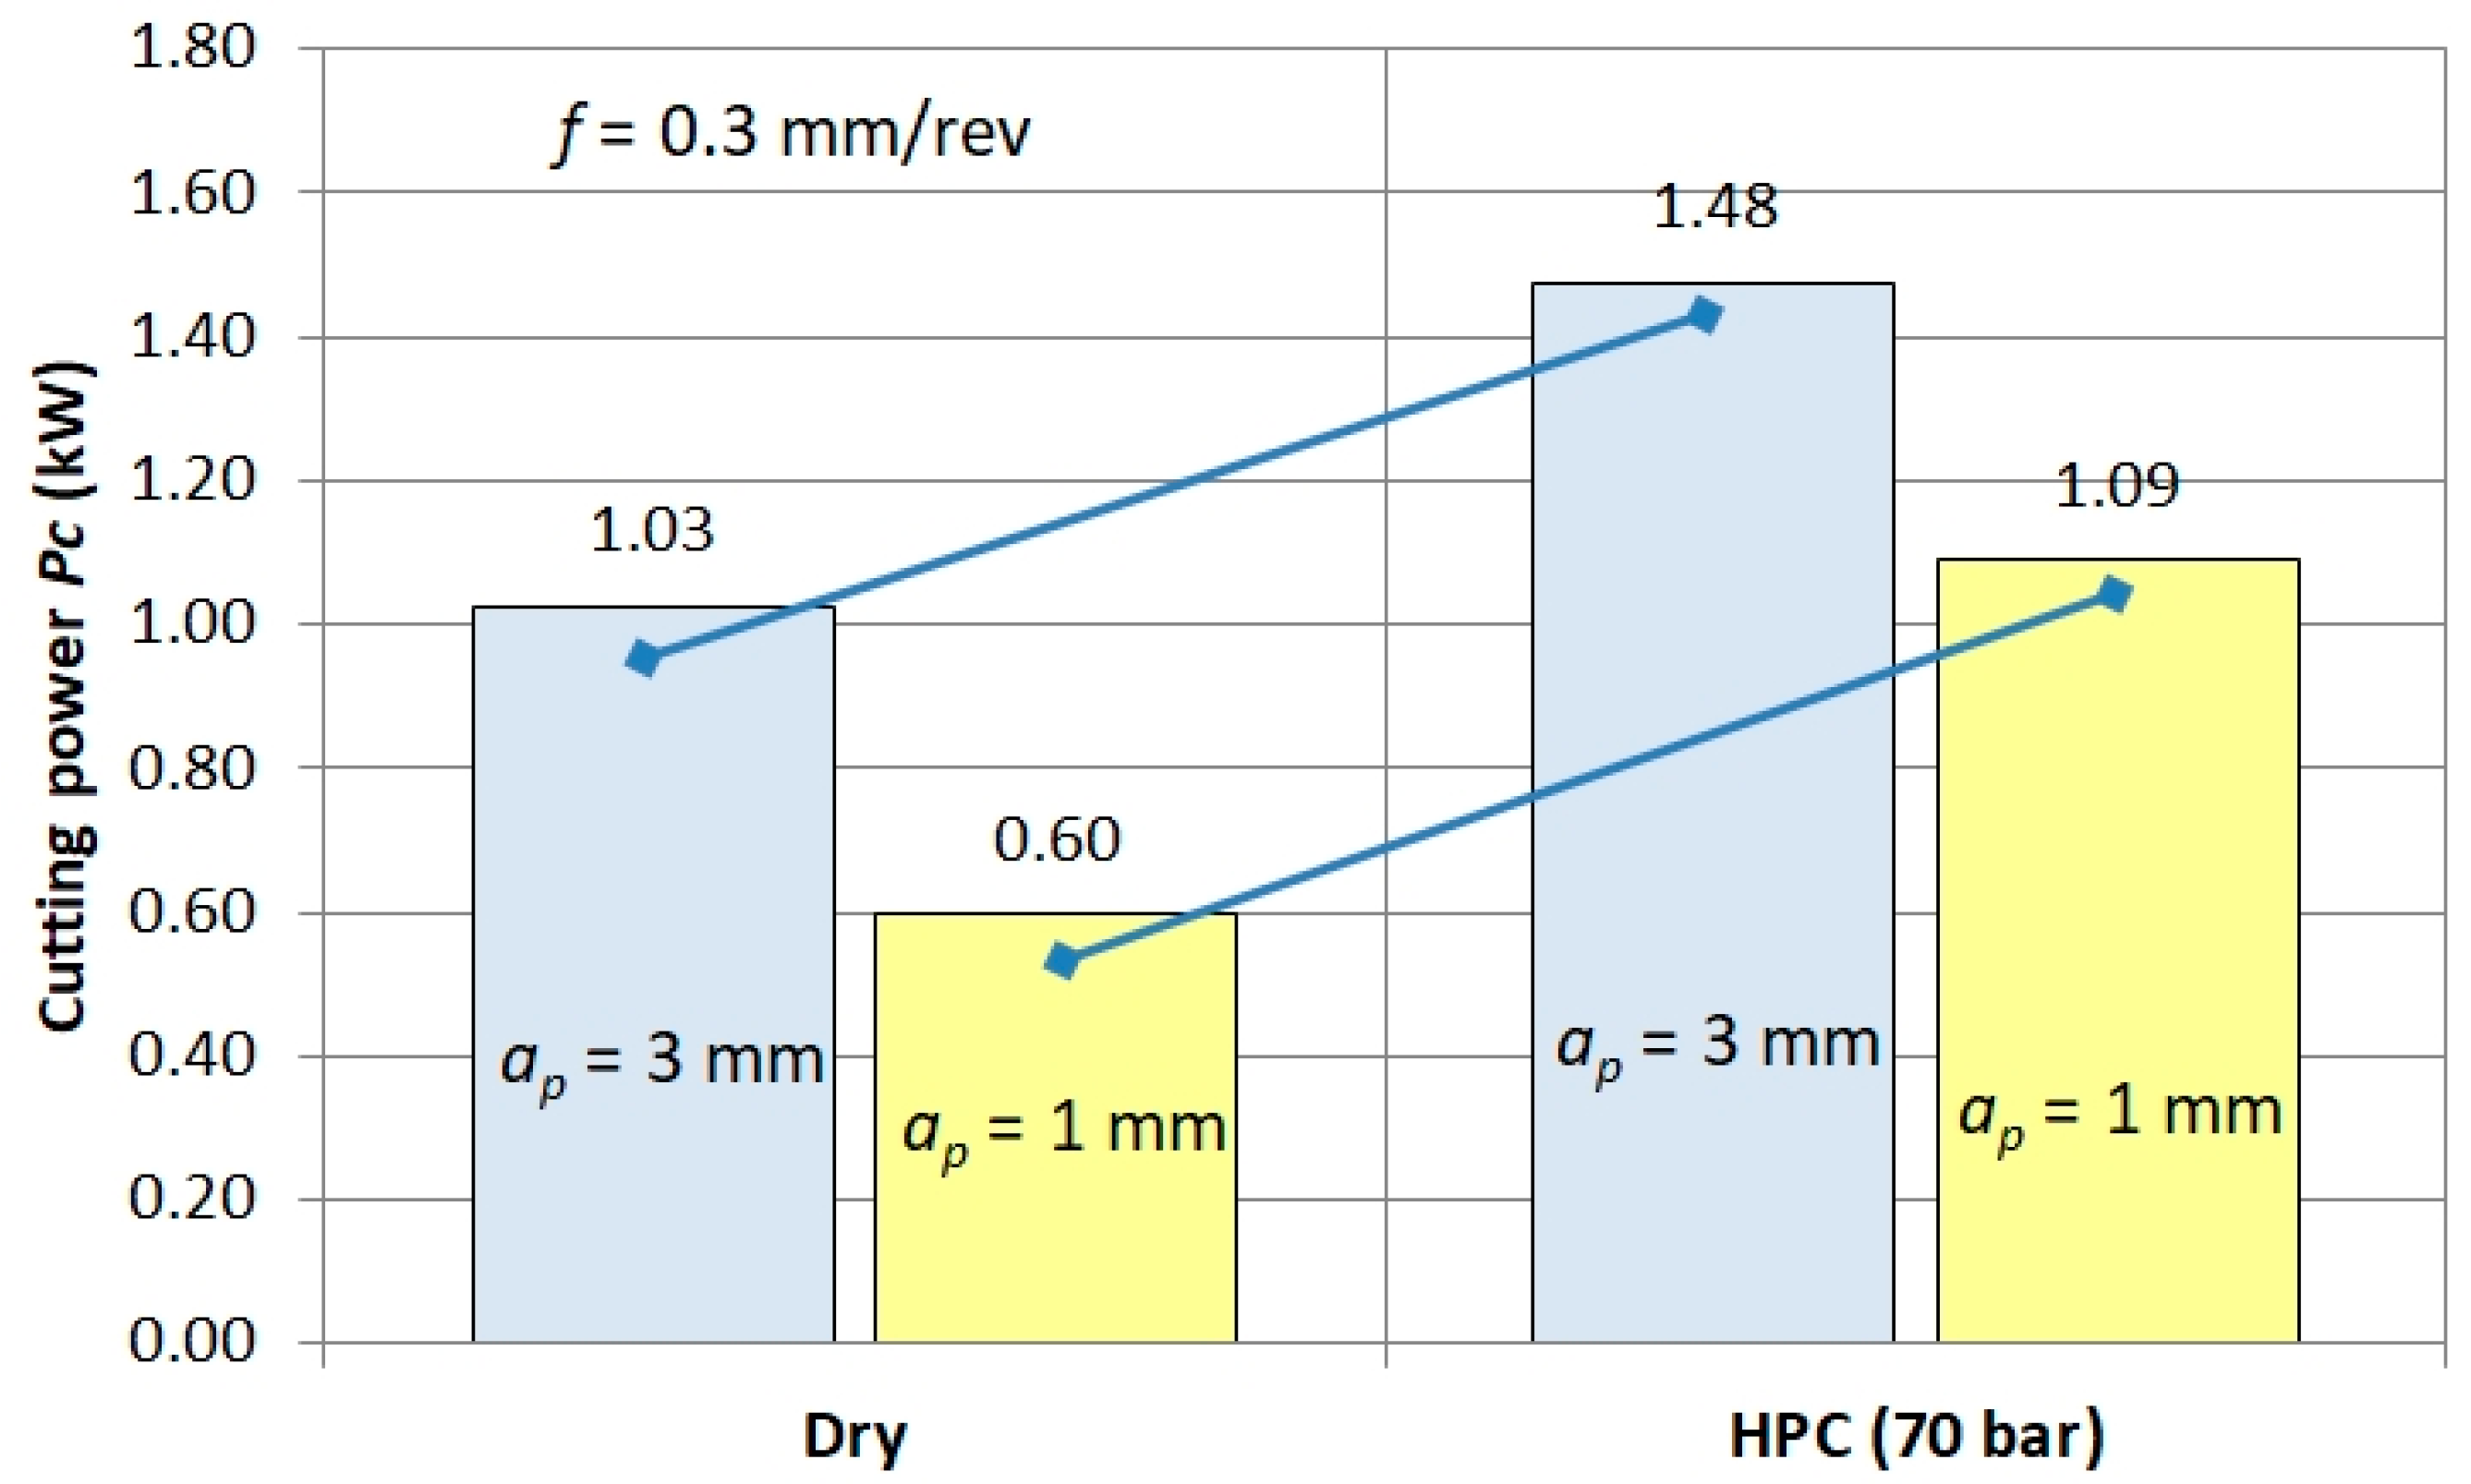
An exemplary combination of
Pc power for dry machining and HPC is shown in
Figure 12. It follows that the power demand for HPC machining is greater by about
Pc ≈ 0.5 kW. This also confirms the thesis that, due to the form of chips, the application of the machining process at elevated pressure should be reduced.
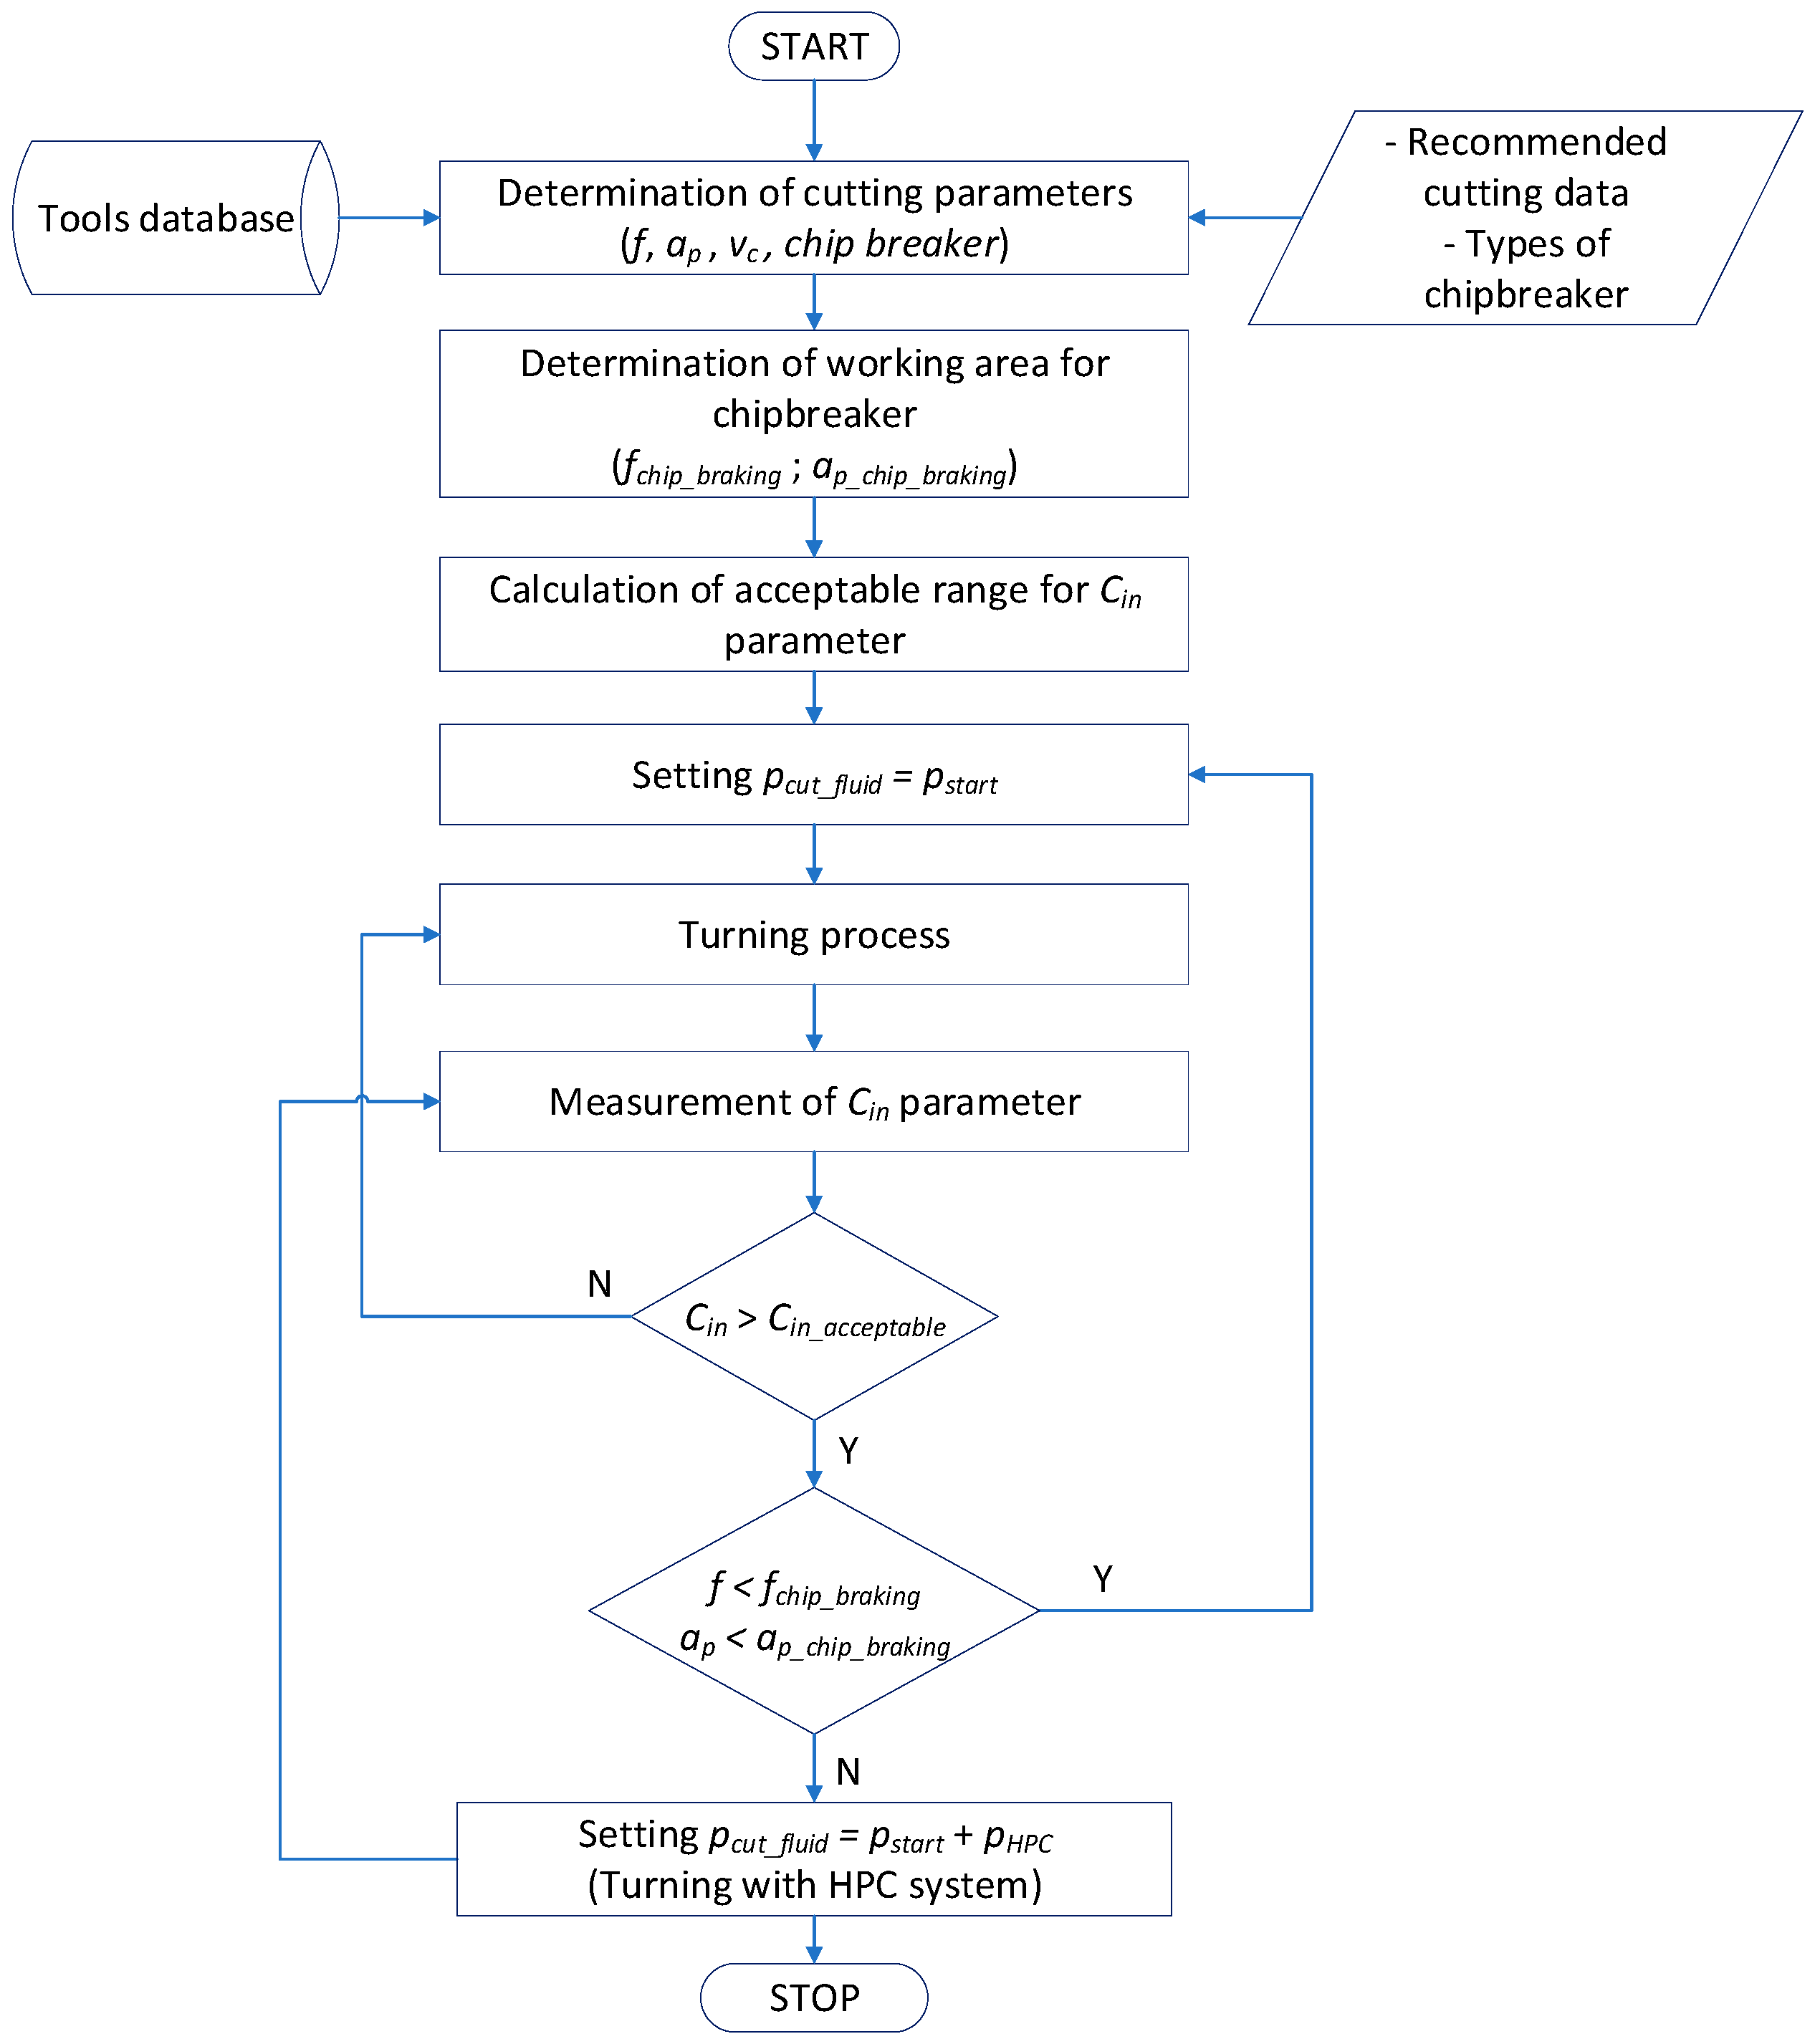
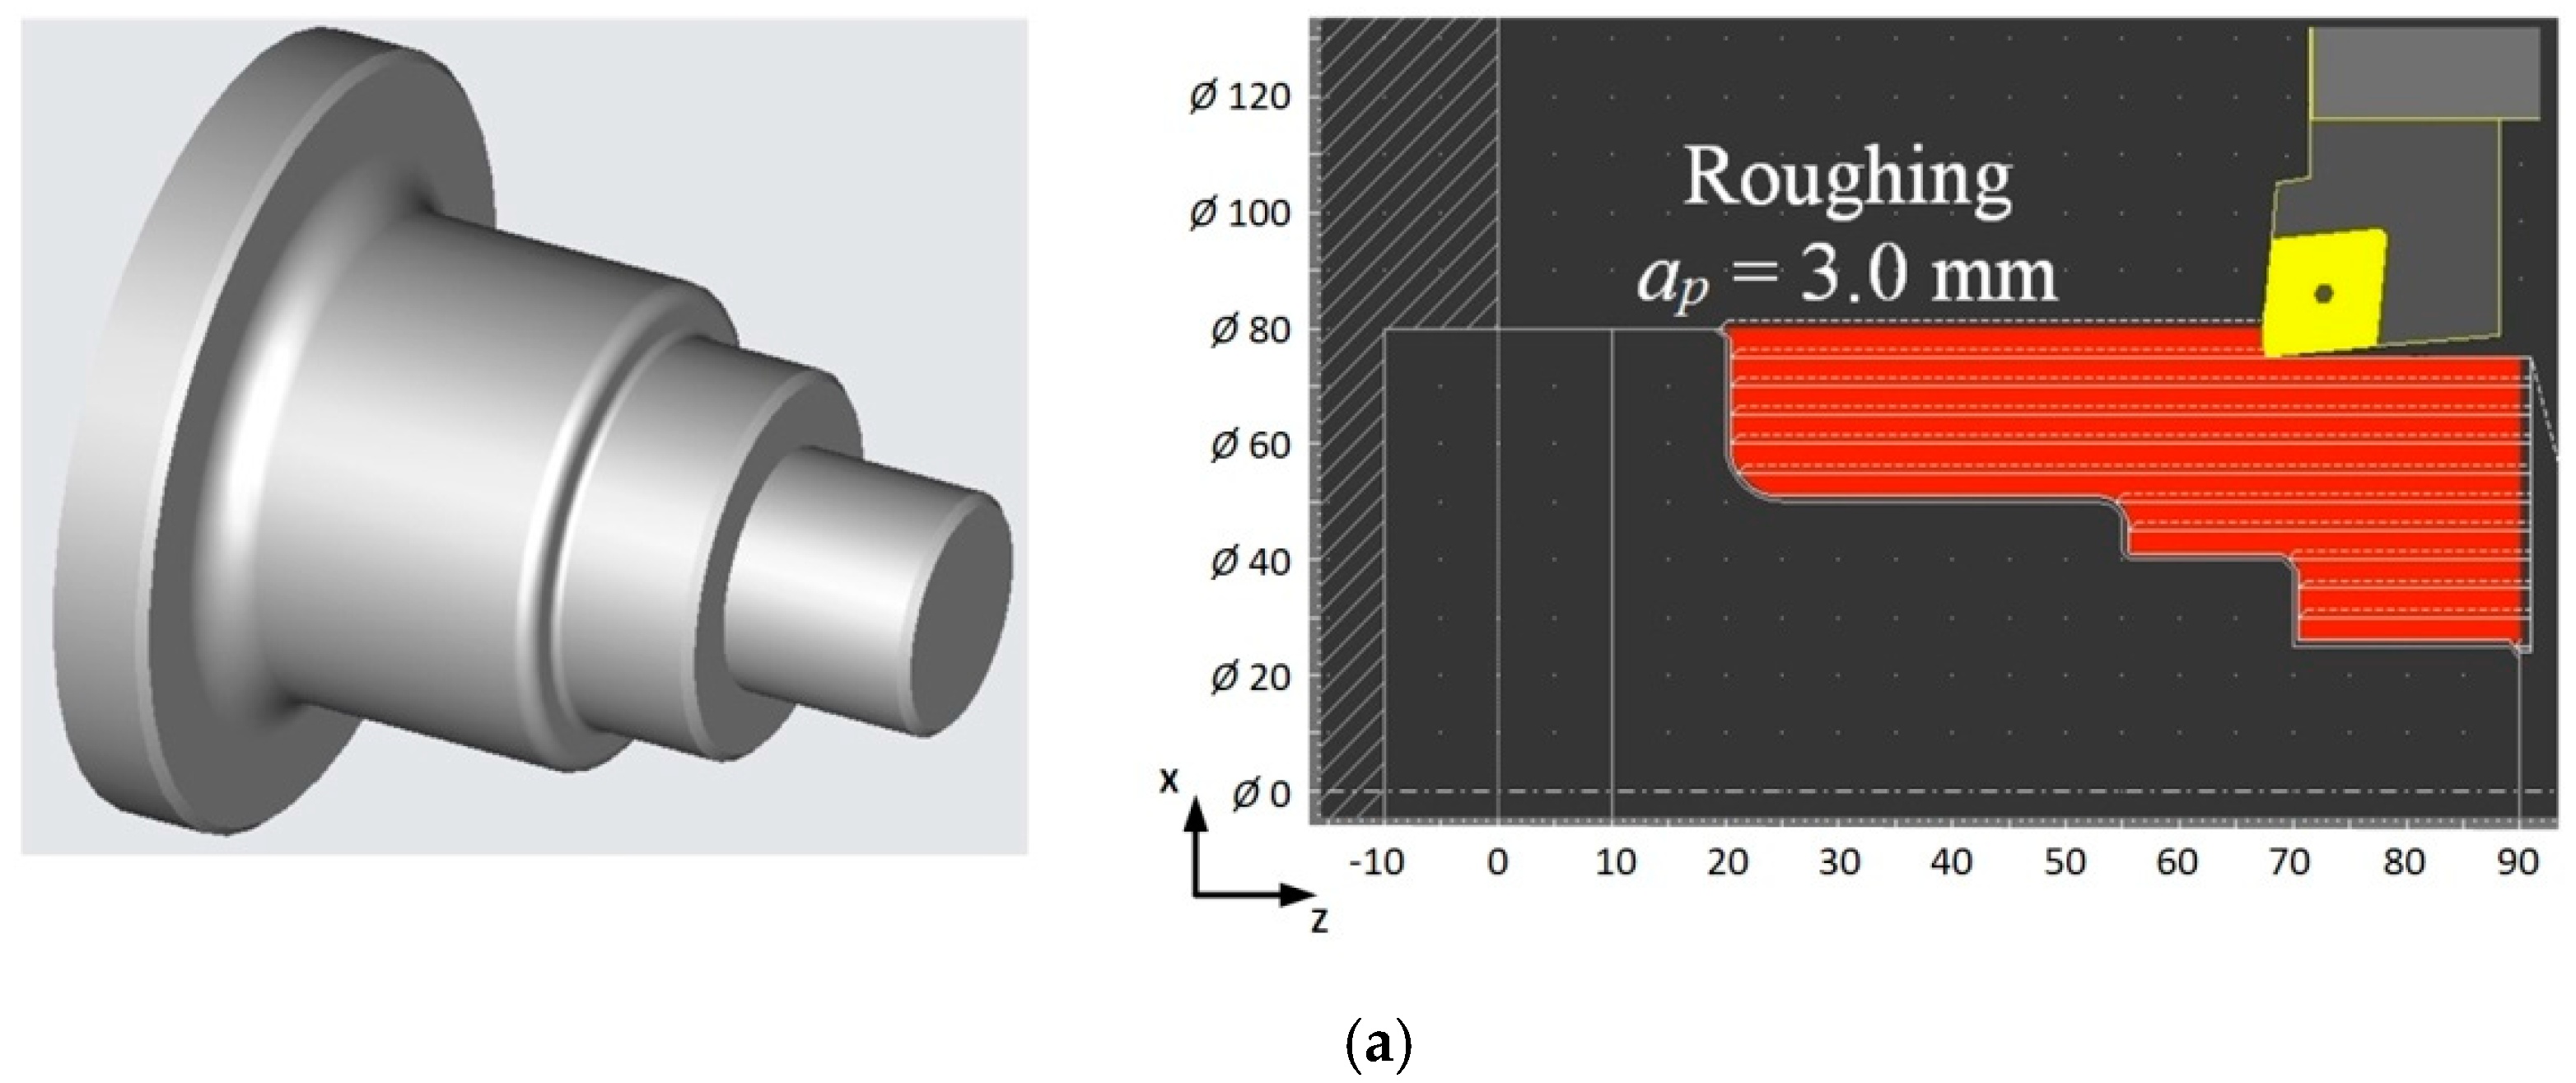
In connection with the above, a case study was carried out, for which the algorithm shown in
Figure 4 was used. It was assumed that the workpiece was a stepped shaft with external dimensions Ø50 × 80 mm. The cutting depth for roughing operations is
ap = 3.0 mm and for finishing
ap = 1.0 mm. The number of passes for rough turning
n = 11 and one pass for finishing turning along the contour were assumed.
Figure 13a shows a view of the workpiece and the cutting tool path during roughing turning.
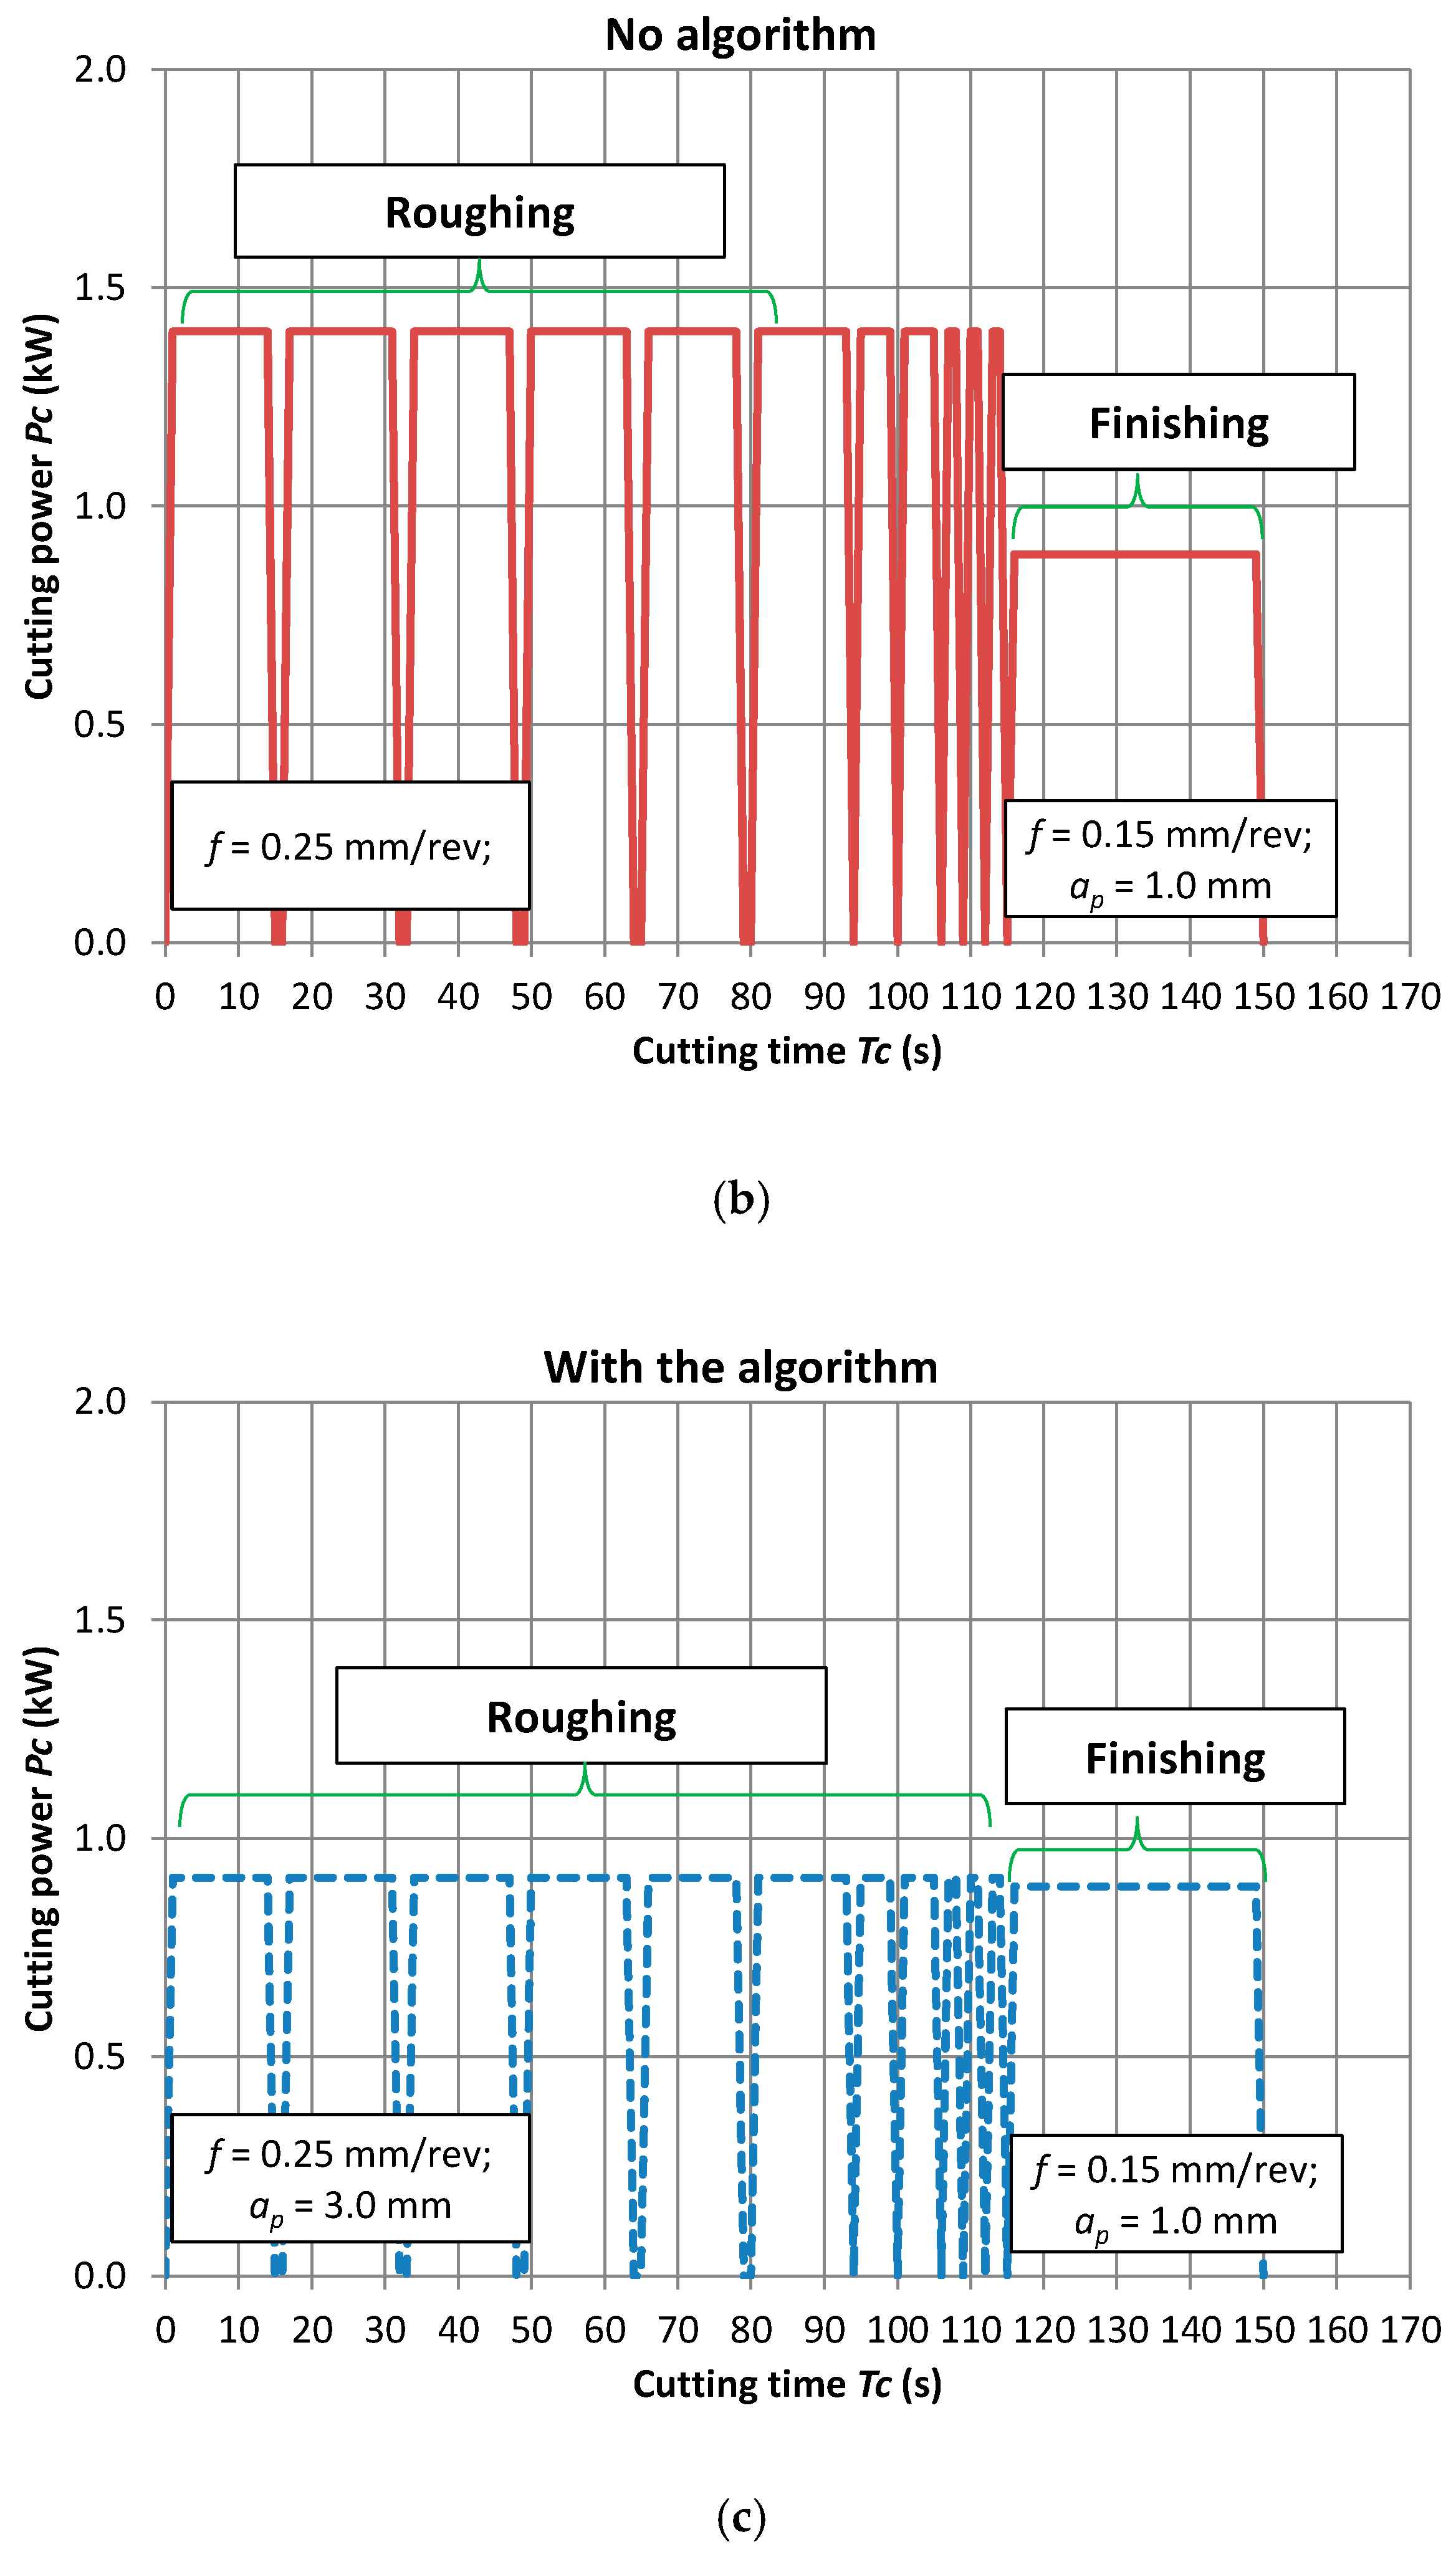
Figure 13b shows the diagram of power demand for the case of HPC turning throughout the entire cutting time (
Tc).
Figure 13c depicts the diagram of power demand for the case of HPC turning with the implementation of the algorithm. As a result, the cutting power for rough turning was reduced, while ensuring the required chip geometry.
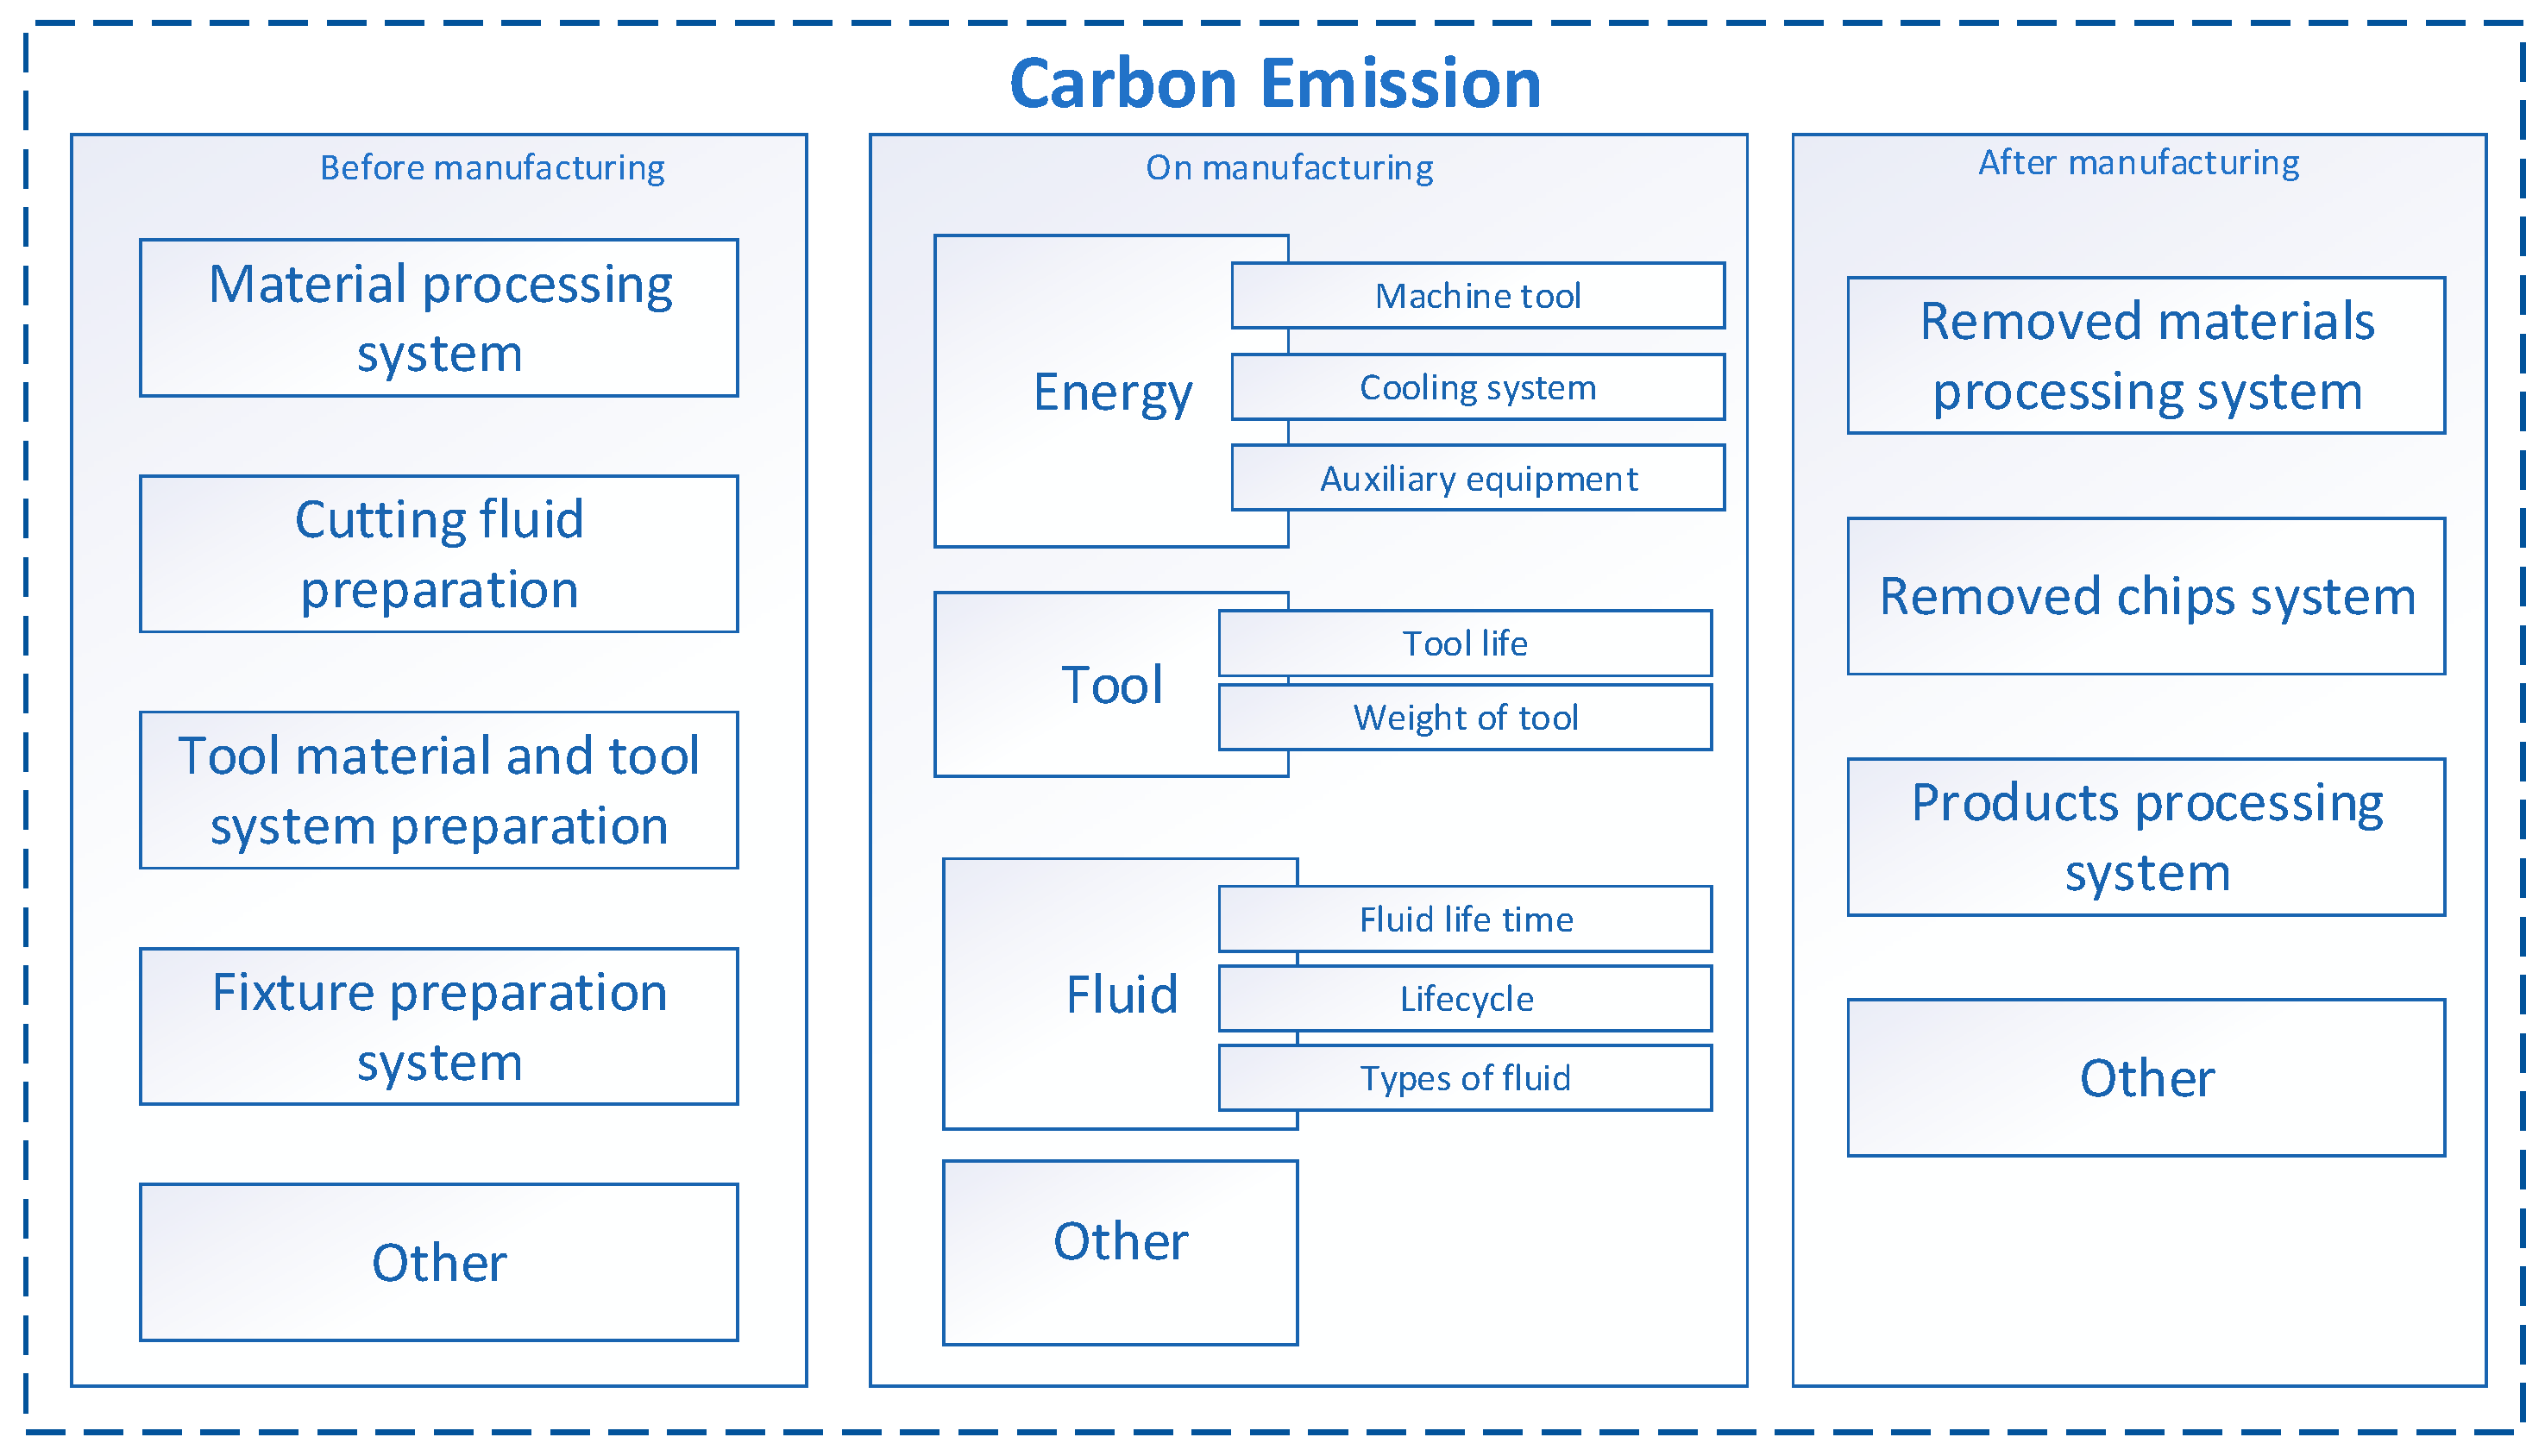
Approximate CO2 emission for dry machining and HPC was estimated in accordance with formulas (2) to (4). The following assumptions were made for the calculations:
Value of the emission factor for electricity of the final customers in Poland in 2019,
CEFelec = 765 kg/MWh (data based on KOBiZE [
49]);
Pc value for roughing based on the case study: Pc = 0.91 kW;
Pa = 0.2∙
Pc = 0.182 kW (the value of the coefficient
bm = 0.2 was adopted based on Liu et al. [
47]);
Machine tool power consumption when idle Pair = 1.0 kW;
Padd system = 0.5 kW – 40% of the maximum load of the machine tool pump feeding the coolant was taken for calculations;
Total roughing time in one business day Tc roughing = 8 h.
On the basis of the adopted values, the energy consumption and carbon emission were calculated, i.e., ECprocess dry = 2.1 kW and ECprocess HPC = 2.6 kW. This means that the value of carbon emissions per year is: CEelec dry = 3083 kgCO2/year and CEelec HPC = 3817 kgCO2/year. It follows that, for such assumptions, the difference in carbon emissions within one year is CEelec HPC − CEelec dry = 734 kgCO2.
4. Summary and Conclusions
An algorithm (
Figure 5) for the optimization of the cutting process due to the chip’s geometry obtained during machining of titanium alloy was elaborated. A simplified method of determining the coefficient indicating the geometry and chip breaking, which can be used in industrial practice, was developed and presented.
On the basis of the obtained results and the performed analysis, the following conclusions can be drawn. Obtaining the appropriate chip geometry in the turning process with elevated coolant pressure can be achieved with reduced power requirements. This is due to the selected cutting parameters values, i.e., the feed f and cutting depth ap, for which the chip breaker groove is correctly filled. This translates into improved chip breaking process and the creation of the correct/acceptable chip geometry. In the analyzed case, it was shown that the correct chip geometry can be obtained with a reduced power requirement by approximately Pc = 0.5 kW. It was estimated that, for the analyzed case, the CO2 savings during the year was approximately 734 kgCO2.
It has been proven that there is no significant influence of HPC turning on the workpiece surface roughness. However, for finishing, the recommended machining method should implement HPC system, taking into account chip geometry.
Although in the presented case the saving is obvious, there is a need to continue testing the algorithm taking into account the wear process of the cutting edge. It can have significant impact on chip geometry. In addition, the limitation is the scope of research covering one type, although the most popular in industrial applications, of titanium alloy i.e., Ti6Al4V. This issue requires further research and analysis in the field of turning difficult to cut materials.


