Abstract
A series of Dy3+ ion doped Sr2CaWO6 phosphors with double perovskite structure were synthesized by traditional high temperature solid-state method. It was found that there is significant energy transfer between Dy3+ and the host lattice, and the intensities of emission peaks at 449 nm (blue), 499 nm (cyan), 599 nm (orange), 670 nm (red), and 766 nm (infra-red) can be changed by adjusting the concentration of dopant amount of Dy3+ ion in Sr2CaWO6. The correlated color temperature of Dy3+ ion doped Sr2CaWO6 phosphors can be tuned by adjusting the concentration of Dy3+ ion. Upon optimal doping at 1.00 mol% Dy3+, white light with chromaticity coordinate (0.34, 0.33) was emitted under excitation at 310 nm. Thus, single composition white emission is realized in Dy3+ doped Sr2CaWO6.
1. Introduction
In recent years, phosphor-covered white light-emitting diodes (pc-WLEDs) have become more and more prevalent due to their superior performance, such as energy saving, long life time, small volume, and high brightness, compared to the conventional white light sources [1]. The commercial approach for obtaining white light-emitting diode (WLED) typically involves covering blue chips with yellow light-emitting phosphors such as Y3Al5O12:Ce3+ (YAG:Ce3+). Nevertheless, the lack of strong visible red-light emission makes it difficult to fabricate WLEDs with a high color-rendering index (CRI) and low correlated color temperature (CCT) [2,3,4,5,6], which limit their applications. In order to overcome these difficulties, red, green, and blue (RGB) tricolor phosphors pumped by ultra-violet (UV) LED chips (300–400 nm) are used to fabricate WLEDs with high CRI. However, it is difficult to fabricate WLED with high conversion efficiency as there is strong reabsorption of the blue-light by the green and red phosphors [7,8]. Thus, single-composition white light-emitting phosphors pumped by near ultra-violet (n-UV) light-emitting diodes are desired to fabricate WLEDs [9,10,11].
Double perovskite has the formula of A2BB’O6 [12,13]. The tungstate with double perovskite structure has important physical properties, such as magnetic [14], electrical [15], photocatalytic [16], and optical properties [17]. The luminescence properties of [WO6]6− group in A2BWO6 has been reported [18]. As previously reported, the emission colors of [WO6]6− group in A2BWO6 could range from blue to yellow (e.g., Ba2CaWO6, blue; Sr3WO6, green, and Ba2MgWO6, yellow), which strongly depends on the choice of A and B ions [18]. Rare earth (RE) ion doped double perovskite tungstate has been shown to have promising photoluminescence properties [19], such as Ba2CaWO6:Eu3+ [20], Ba2ZnWO6:Eu3+, Li+ [17], Sr2CaWO6:Eu3+, Na+ [21], and Sr2CaWO6:Sm3+, Na+ [22]. The emission peak at yellow region of Dy3+ ion which corresponding to the transition of 4F9/2 → 6H13/2 is greatly influenced by the coordination environment [23]. Furthermore, the ratio of emission peak intensities in blue (4F9/2 → 6H15/2) and yellow (4F9/2 → 6H13/2) region for Dy3+ ion is influenced by the coordination environment, and when there is an inversion center the emission in blue region is of significant intensity [24].
In the present work, Dy3+ was used to replace the Ca2+ ion in Sr2CaWO6, which is with an inversion center. Single-composition white light emitting phosphors with tunable correlated color temperature were successfully synthesized by adjusting the concentration of Dy3+ ions. There are some single-composition white light emission phosphors materials can be obtained at near ultra-violet(n-UV), such as Ca9Gd(PO4)7:Eu2+, Mn2+ [25], NaBaBO3:Dy3+, K+ [26], and Sr3Y(PO4)3:Dy3+ [27]. However, many materials need UV excitation under 300 nm to realize white light emission, such as Y(P,V)O4:Dy3+ [28], β-GdB3O6:Bi3+, Tb3+, Eu3+ [29], LaNbO4:Dy3+ [30], and LuNbO4:Dy3+ [31]. Taking LuNbO4:Dy3+ as example, the excitation peak of LuNbO4:Dy3+ phosphors centered in 261 nm. In comparison, Sr2CaWO6:Dy3+ phosphors can be excited under a relatively longer wavelength of 310 nm. In the present work, the photoluminescence properties of Dy3+ ions doped Sr2CaWO6 with different concentrations of Dy3+ ions and white light emission upon optimal doping are reported.
2. Material and Methods
The powder samples of Sr2Ca(1−1.5x%)WO6: x mol% Dy3+ (x = 0, 0.1, 0.3, 0.5, 1.0, 1.5, 2.0, 3.0) and Sr2Ca0.99WO6: 0.5 mol% Dy3+, 0.5 mol% M+ (M+ = Li+, Na+, K+) were synthesized by high-temperature solid-state method. The starting materials SrCO3 (99.9%, Sigma-Aldrich), CaCO3 (99.95–100.05%, Alfa), WO3 (99.90%, Adamas), Li2CO3 (99%, Alfa), Na2CO3 (99.8%, General-Reagent), K2CO3 (99%, Sigma-Aldrich), and Dy2O3 (99.99%, Adamas) were weighed by stoichiometric ratio. Then the starting materials were mixed and ground in an agate mortar. The mixture was transferred to a corundum crucible and preheated under 850 °C for 5 h in a box furnace. After the sample was cooled down to room temperature, the mixture was thoroughly ground, calcined at 1200 °C for 12 h, cooled to room temperature, and reground to obtain the final powder sample.
The powder XRD date of Sr2Ca(1−1.5×%)WO6: x mol% Dy3+ were collected in the range of 10° ≤ 2θ ≤ 70° using a Rigaku D/MAX 2550 diffract meter (Cu-Kα, λ = 1.54059 Å), operated at 40 kV and 40 mA. The UV–Vis absorption spectra of Sr2CaWO6 and Sr2CaWO6: doped with 1 mol% Dy3+ were collected with a UV–Vis spectrometer (Lambda 950, Perkin-Elmer, Waltham, MA, USA) with a polytetrafluoroethylene plate as a reference. The excitation spectra and emission spectra were collected with a photoluminescence spectrometer (FS5, Edinburgh Instruments, Livingston, UK) equipped with a 150 W xenon lamp as the excitation source. The lifetime of Sr2Ca0.985WO6: 1.00 mol% Dy3+ was measured with an FLS-980 fluorometer (Edinburgh Instruments, Livingston, UK).
3. Results and Discussion
3.1. Structural characterization
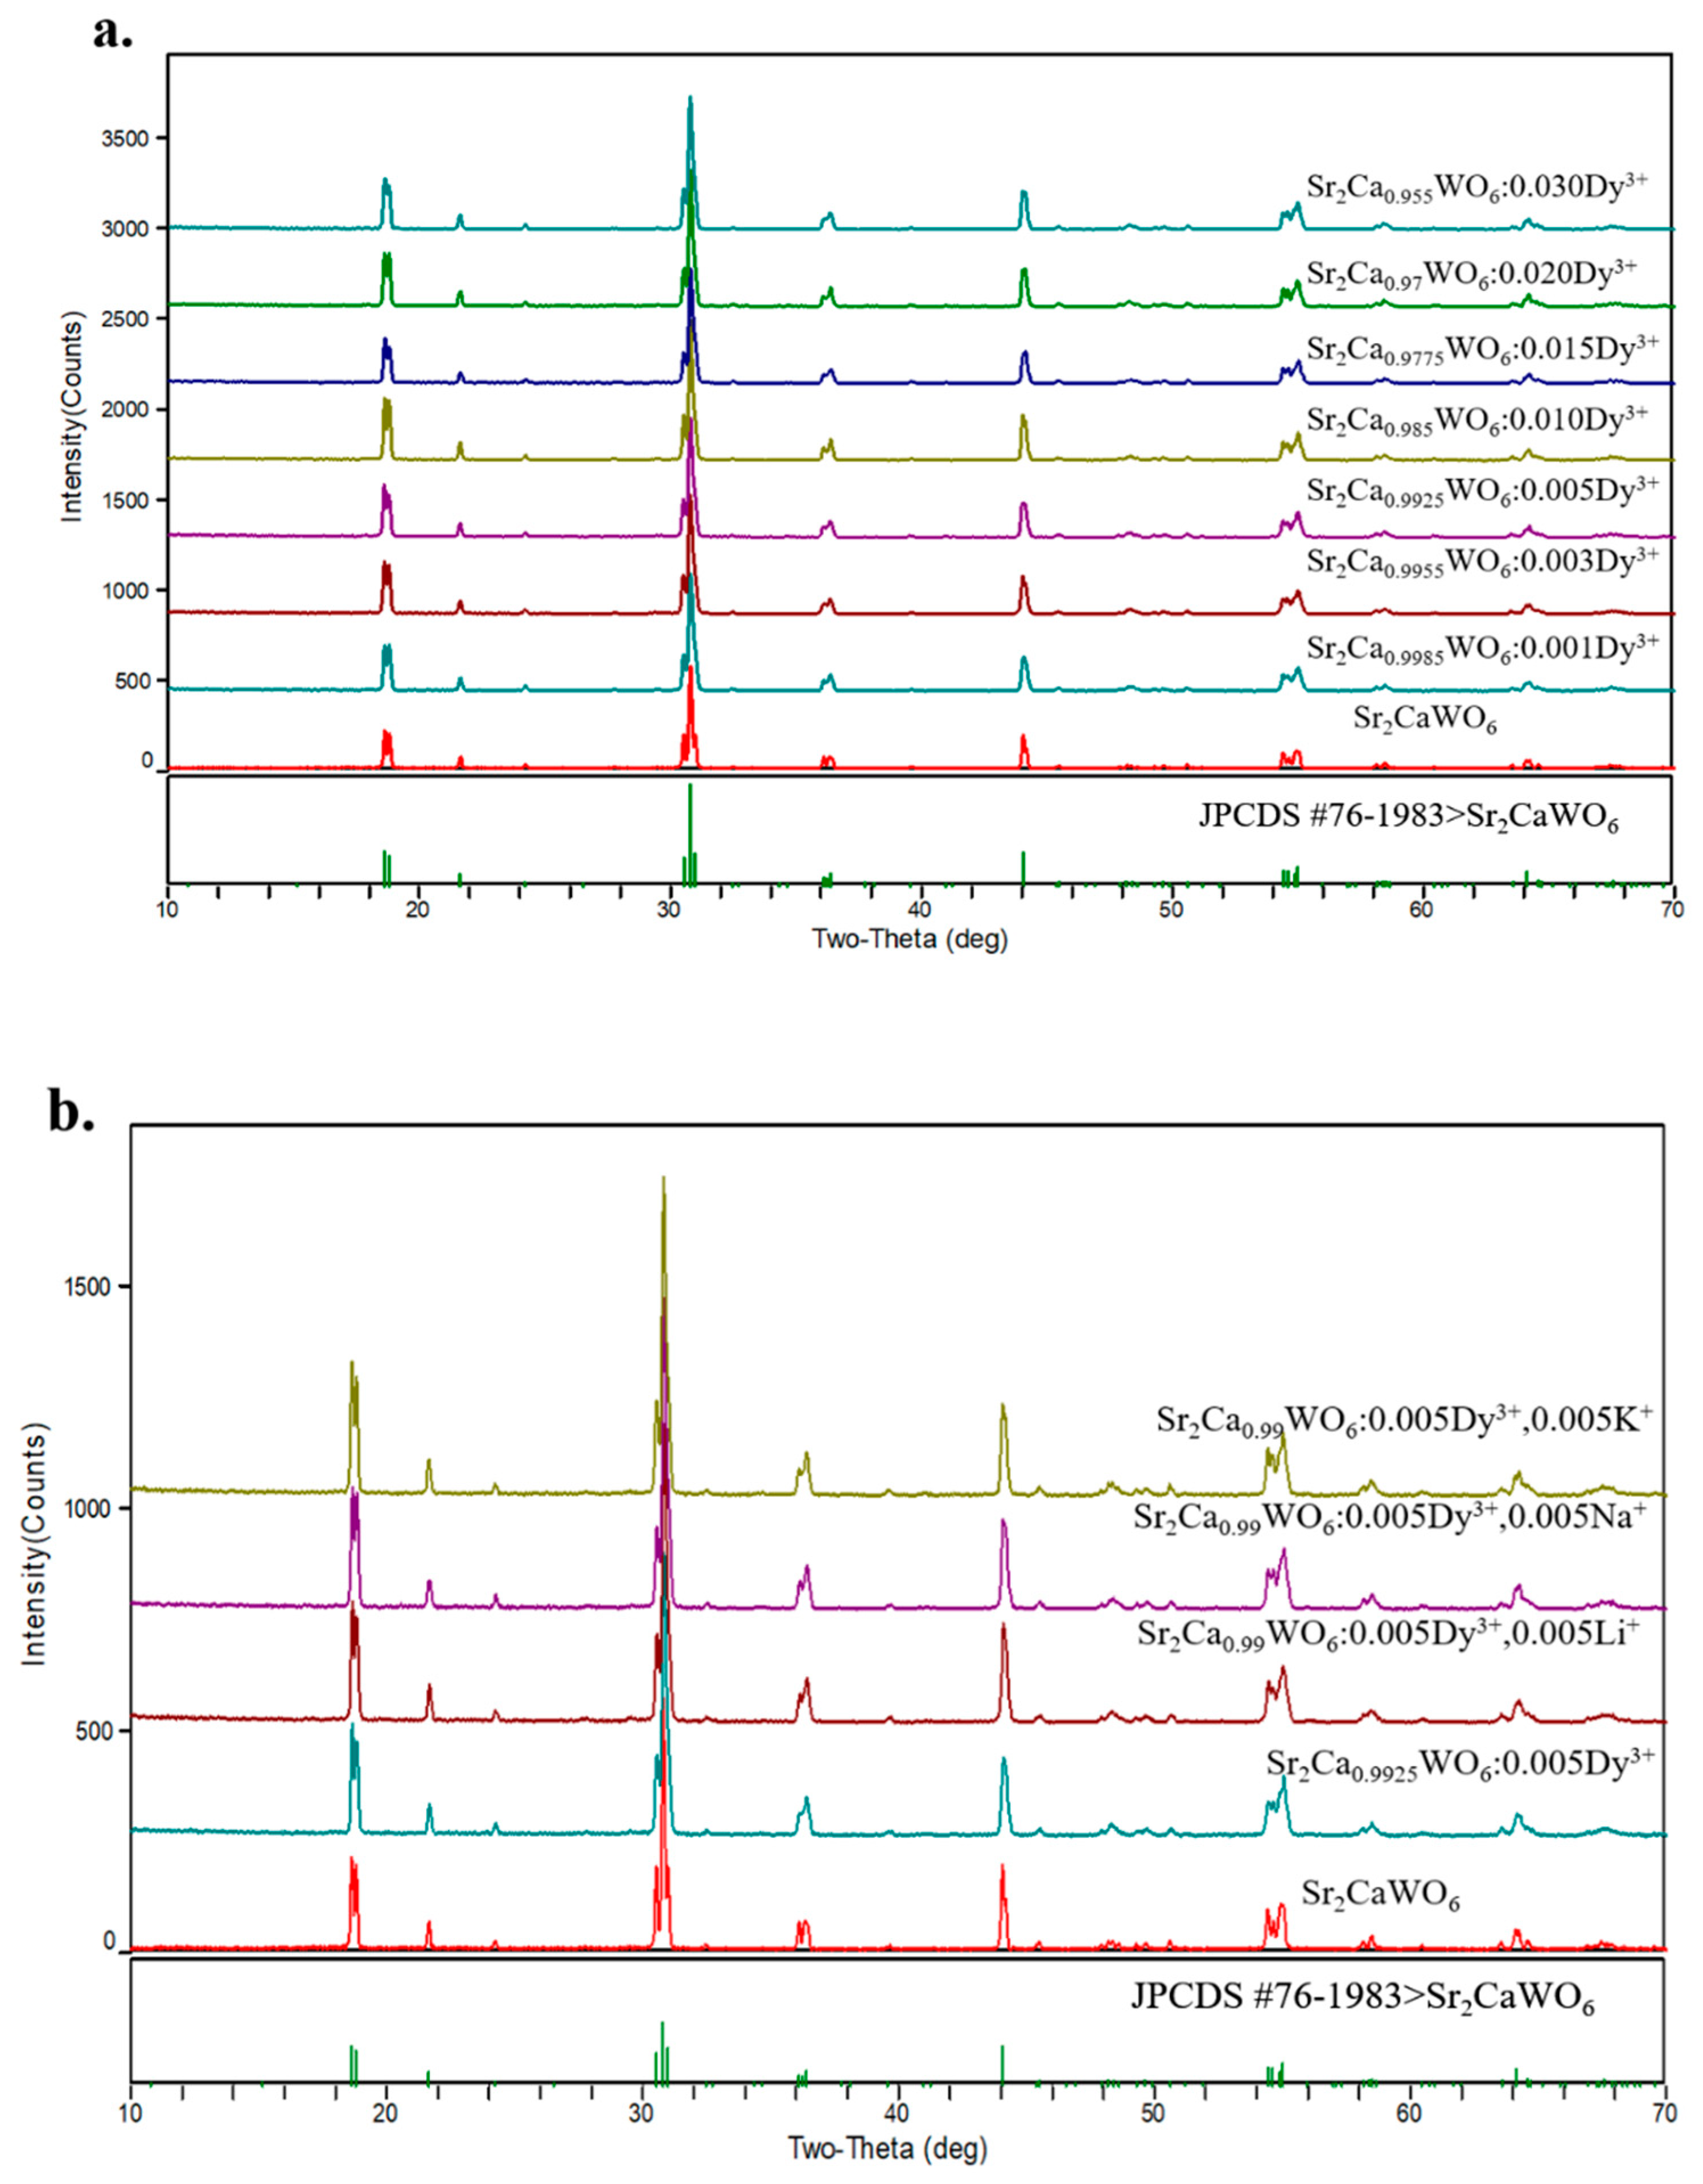
XRD patterns were collected to determine the phases of Sr2Ca(1−1.5x%)WO6: x mol% Dy3+ (x = 0, 0.1, 0.3, 0.5, 1.0, 1.5, 2.0, 3.0). Meanwhile, we also characterized the structure of Sr2Ca0.99WO6: 0.5% Dy3+, 0.5 mol% M+ (M+ = Li+, Na+, K+), for which Li+, Na+, and K+ ions were introduced as charge compensators. The ionic radius of Dy3+ ion in six-fold coordination is 0.912 Å, close to Ca2+ ion, which has an ionic radius of 1.0 Å for six-fold coordination, while the ionic radius of Sr2+ ion is 1.44 Å [32]. As shown in Figure 1a, the XRD patterns of Sr2Ca(1−1.5x%)WO6: x mol% Dy3+ (x = 0, 0.1, 0.3, 0.5, 1.0, 1.5, 2.0, 3.0) matched well with JPCDS card of Sr2CaWO6 (JPCDS #76-1983). As shown in Figure 1b, compared with JPCDS cards of Sr2CaWO6, the XRD patterns of Sr2Ca0.99WO6: 0.5 mol% Dy3+, 0.5 mol% M+ (M+ = Li+, Na+, or K+) have no obvious change. Thus, the introduction of the charge compensator has little influence on the crystal structure of Sr2CaWO6. These results indicated that the host structure of double perovskite was well preserved for both the samples with and without charge compensators.
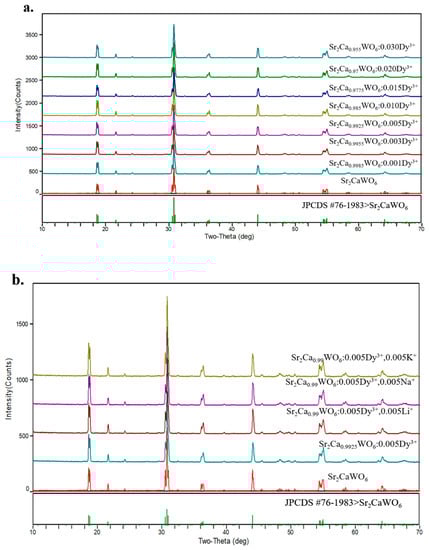
Figure 1.
(a). The X-ray diffraction patterns of Sr2Ca(1−1.5x%)WO6: x mol% Dy3+ (x = 0, 0.1, 0.3, 0.5, 1.0, 1.5, 2.0, 3.0); (b). The X-ray diffraction patterns of Sr2CaWO6, Sr2Ca0.9925WO6: 0.5 mol% Dy3+ and Sr2Ca0.99WO6: 0.5 mol% Dy3+, 0.5 mol% M+ (M+ = Li+, Na+, or K+).
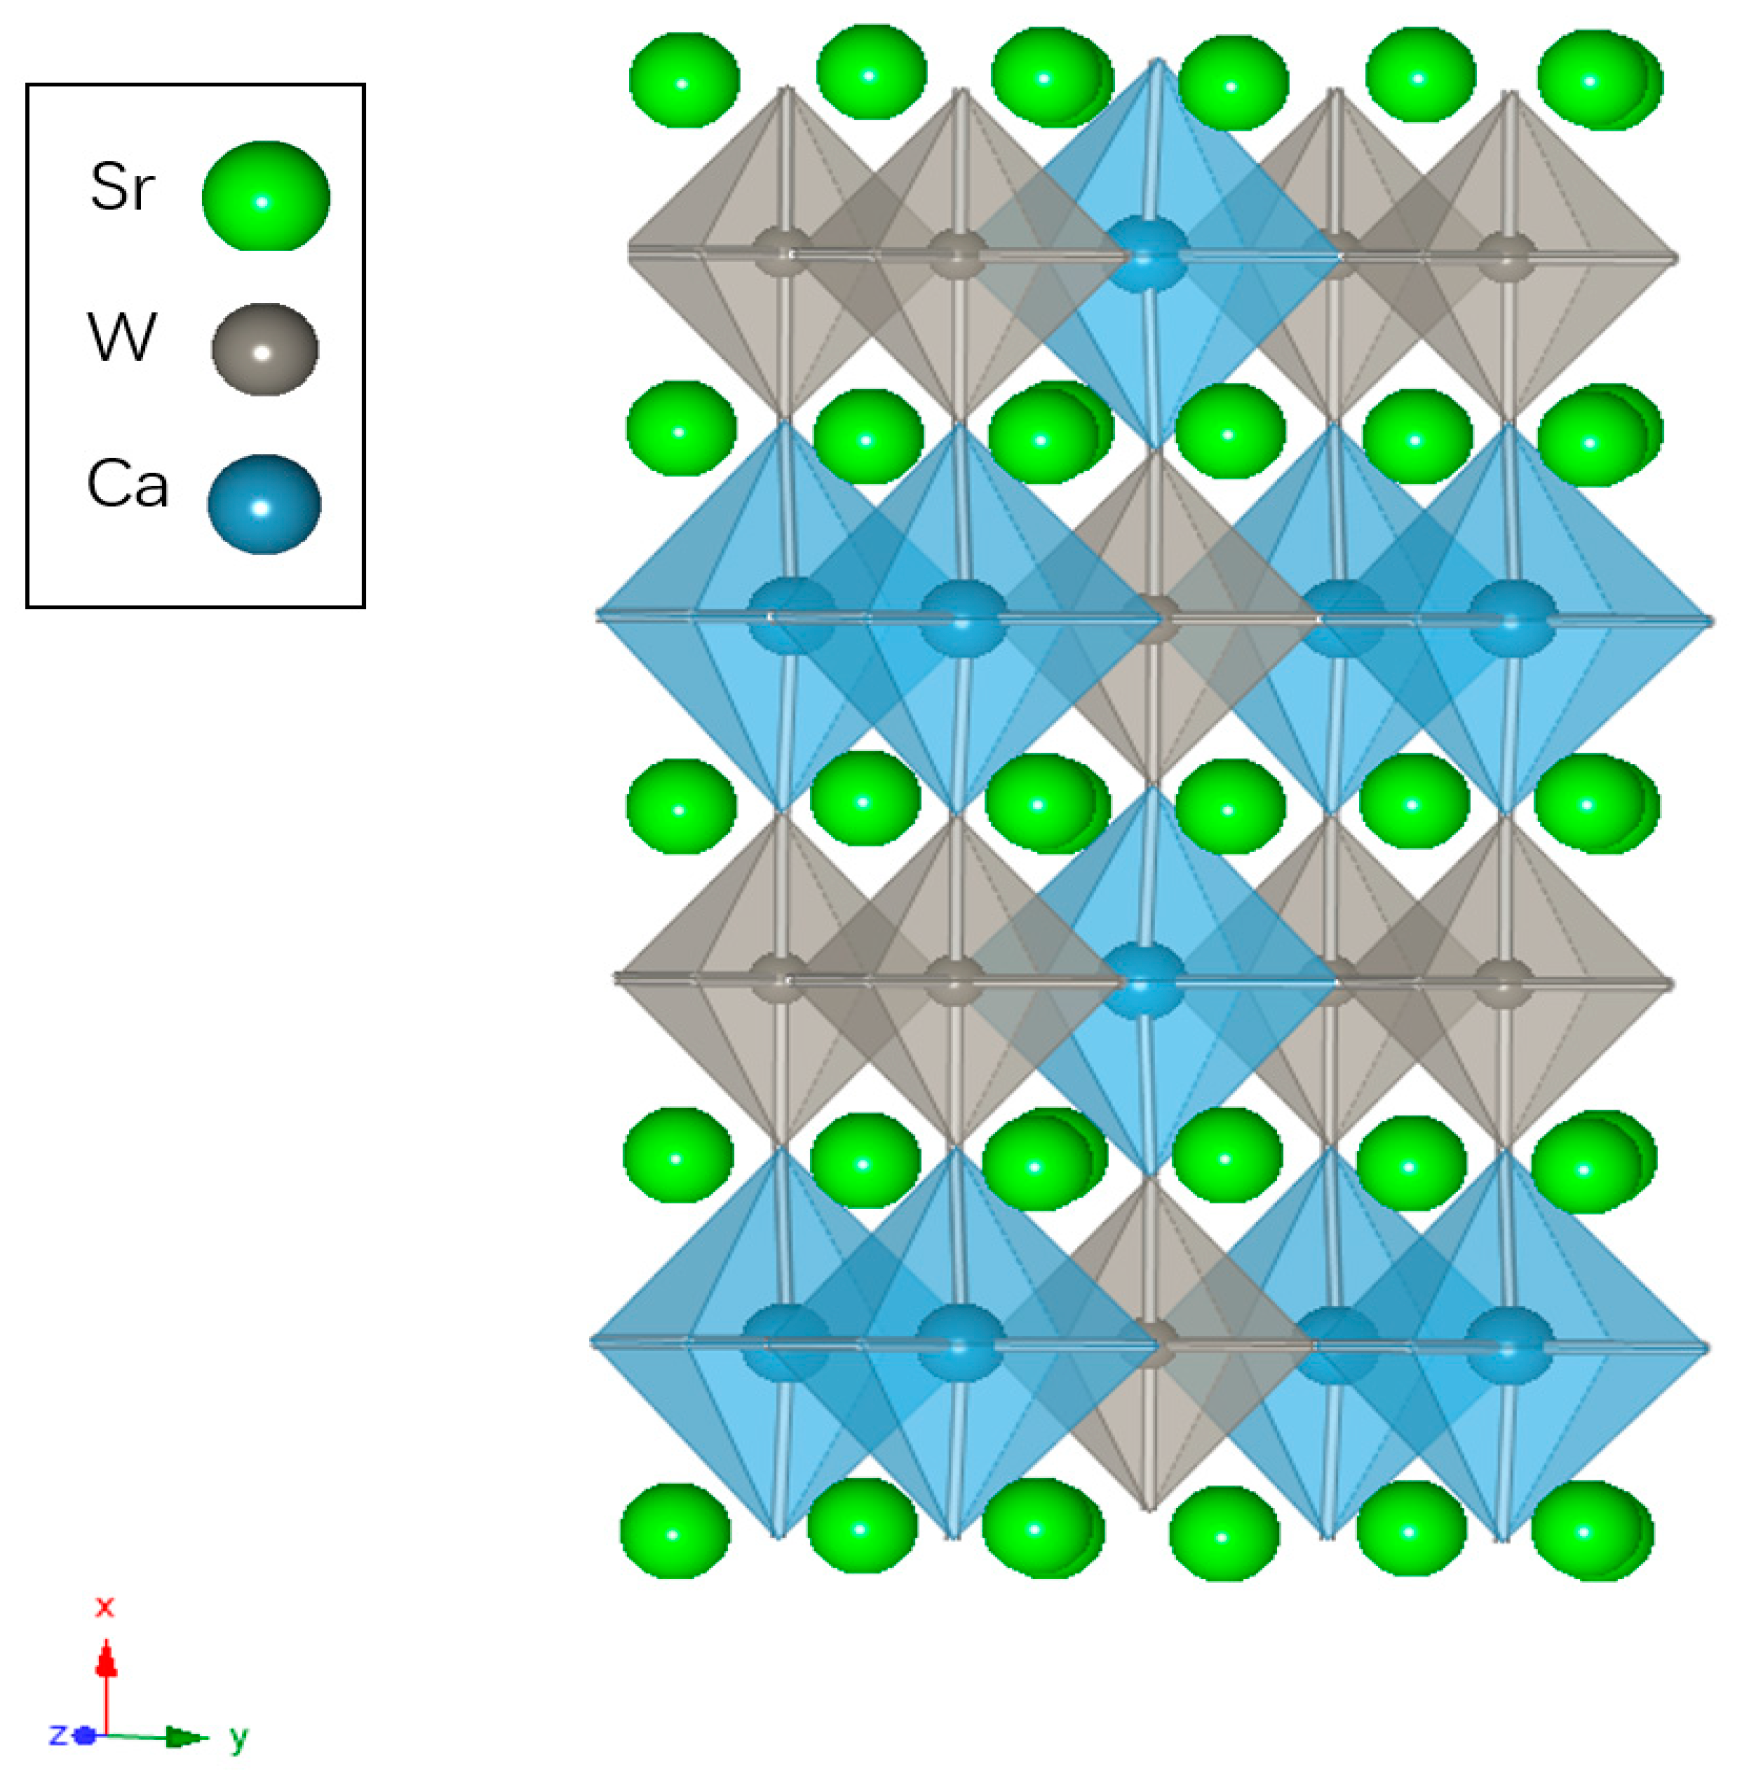
The host compound Sr2CaWO6 is in orthorhombic system with Pmm2 space group (a = 8.1918 Å, b = 5.7653 Å, c = 5.8491 Å, V = 276.24 Å3). In the host lattice of Sr2CaWO6, with the formula of A2BB’O6, Ca2+ ions and W6+ ions reside at B and B’ sites, respectively. Ca atoms and W atoms are coordinated by 6 O atoms (Figure 2). The cations and the coordinated oxygen ions form an octahedral structure with an inversion center. Each CaO6 octahedron shared its O atoms with six adjacent WO6 octahedron, and each WO6 octahedron also shared its O atoms with six adjacent CaO6 octahedron. Sr atoms are located at the interspace of CaO6 octahedron and WO6 octahedron and coordinated by 12 O atoms, without an inversion center [21,22].
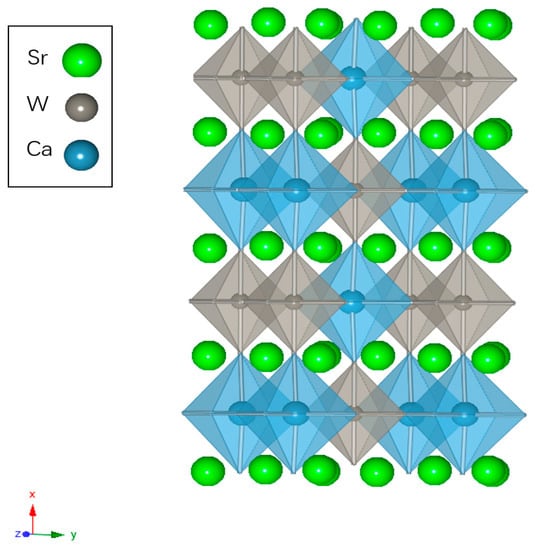
Figure 2.
The crystal structure of Sr2CaWO6 in which Sr atoms are marked with green ball, gray WO6 octahedrons and cerulean CaO6 octahedron are shown to represent coordination of W atoms and Ca atoms.
3.2. UV–Vis Absorption Spectra
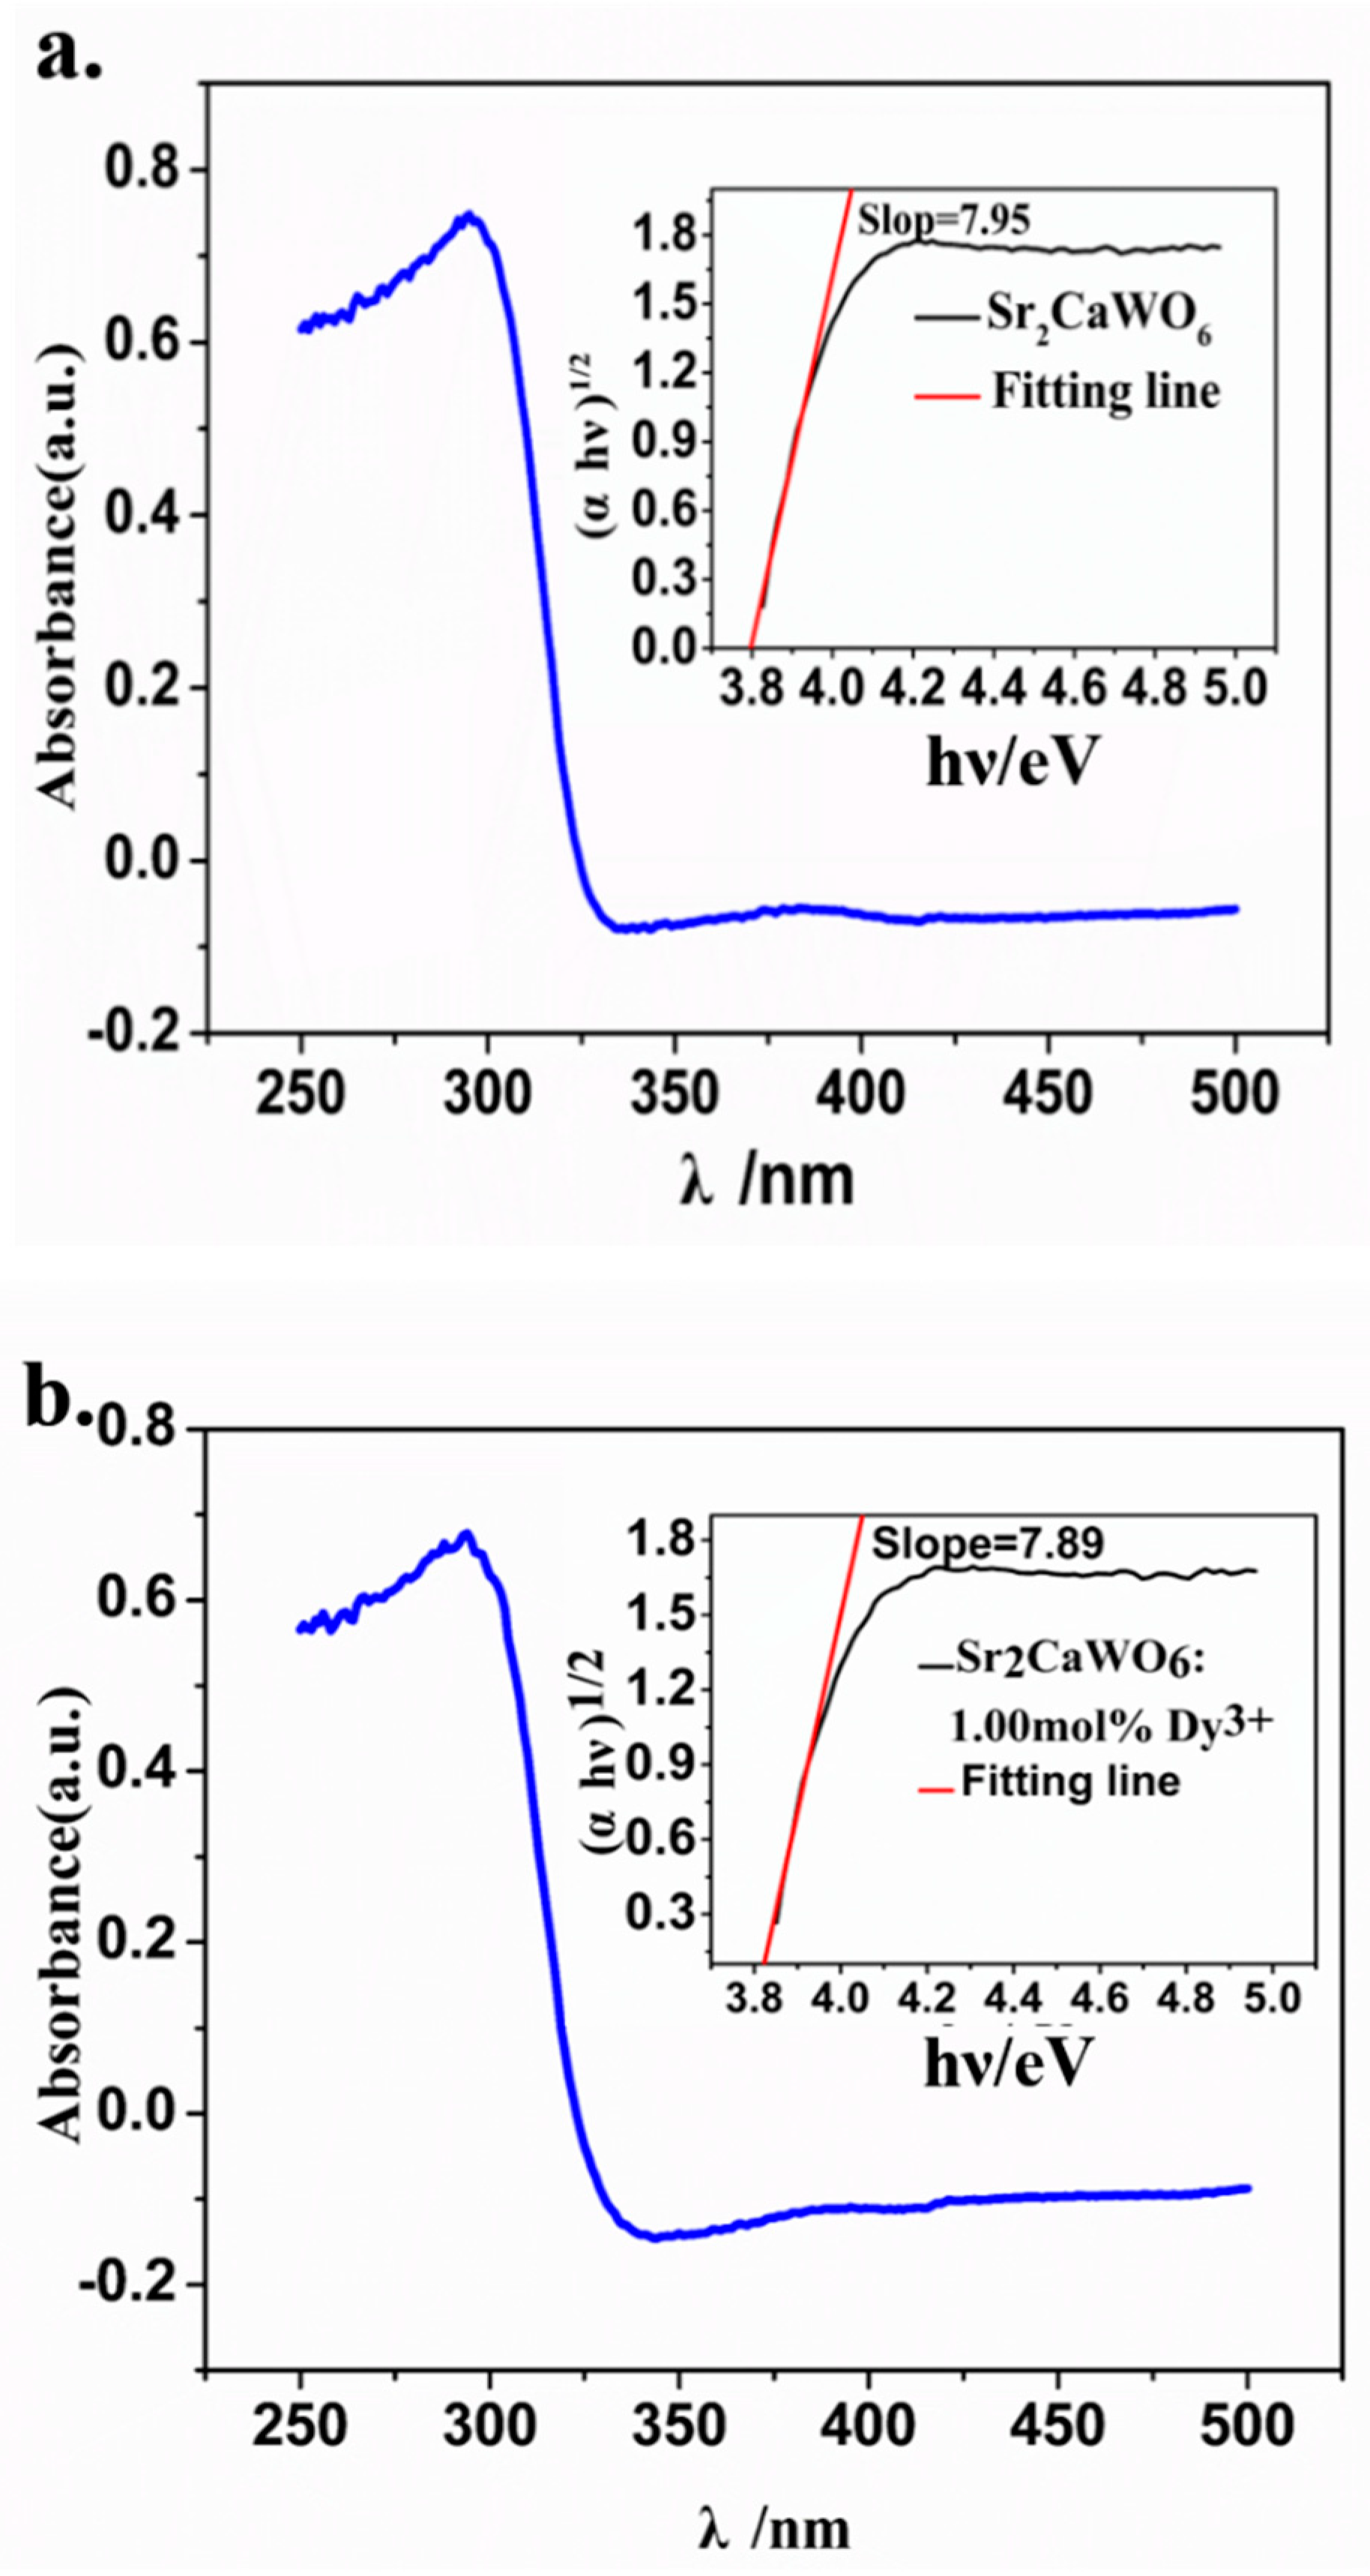
The UV–Vis absorption spectrum of Sr2CaWO6 is shown in Figure 3a. There is a broad absorption band in UV region. The calculated band structure and partial densities of Sr2CaWO6 and the atoms constituting Sr2CaWO6, such as strontium, calcium, tungsten, and oxygen have been reported before [22]. The strong absorption in the ultraviolet region 270–330 nm is attributed to the charge transfer from O atom to W atom. With the UV–Vis absorption spectra, the optical band gap (Eg) of Sr2CaWO6 can be calculated with the following equation [33]:
where α is the absorbance, h is the Planck’s constant, ν is the frequency, k is a constant, n is equal to 1/2, 2, 3/2, or 3, which is dependent on whether the transition is direct allowed, indirect allowed, direct forbidden of indirect forbidden, respectively. Wang et al reported the calculated band structure of Sr2CaWO6 and the result indicated that the Sr2CaWO6 is an indirect band gap insulator [22]. Considering the transition is indirect allowed, here n = 2. The optical band gap of Sr2CaWO6 is calculated to be 3.79 eV, while the optical band gap of Sr2CaWO6: 1.0 mol% Dy3+ is 3.81 eV (Figure 3b). The optical band gap of Sr2CaWO6 synthesized by sol-gel method was calculated to be 3.51 eV, which is 0.30 eV smaller than the value obtained from the present sample [22]. This suggests that the preparation conditions have appreciable influence on the optical band gap.
αhν = k(hν − Eg) n
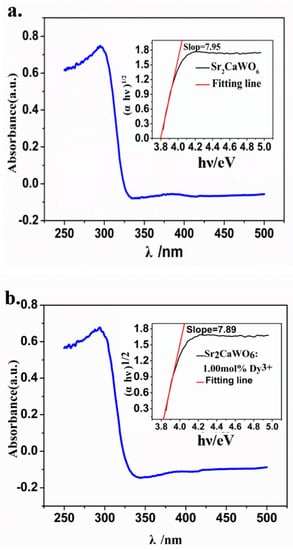
Figure 3.
The UV–Vis absorption spectra of Sr2CaWO6 (a) and Sr2CaWO6: 1.0 mol% Dy3+ (b), the insert shows variation of (αhν)1/2 under different photon energy.
3.3. Luminescence Properties
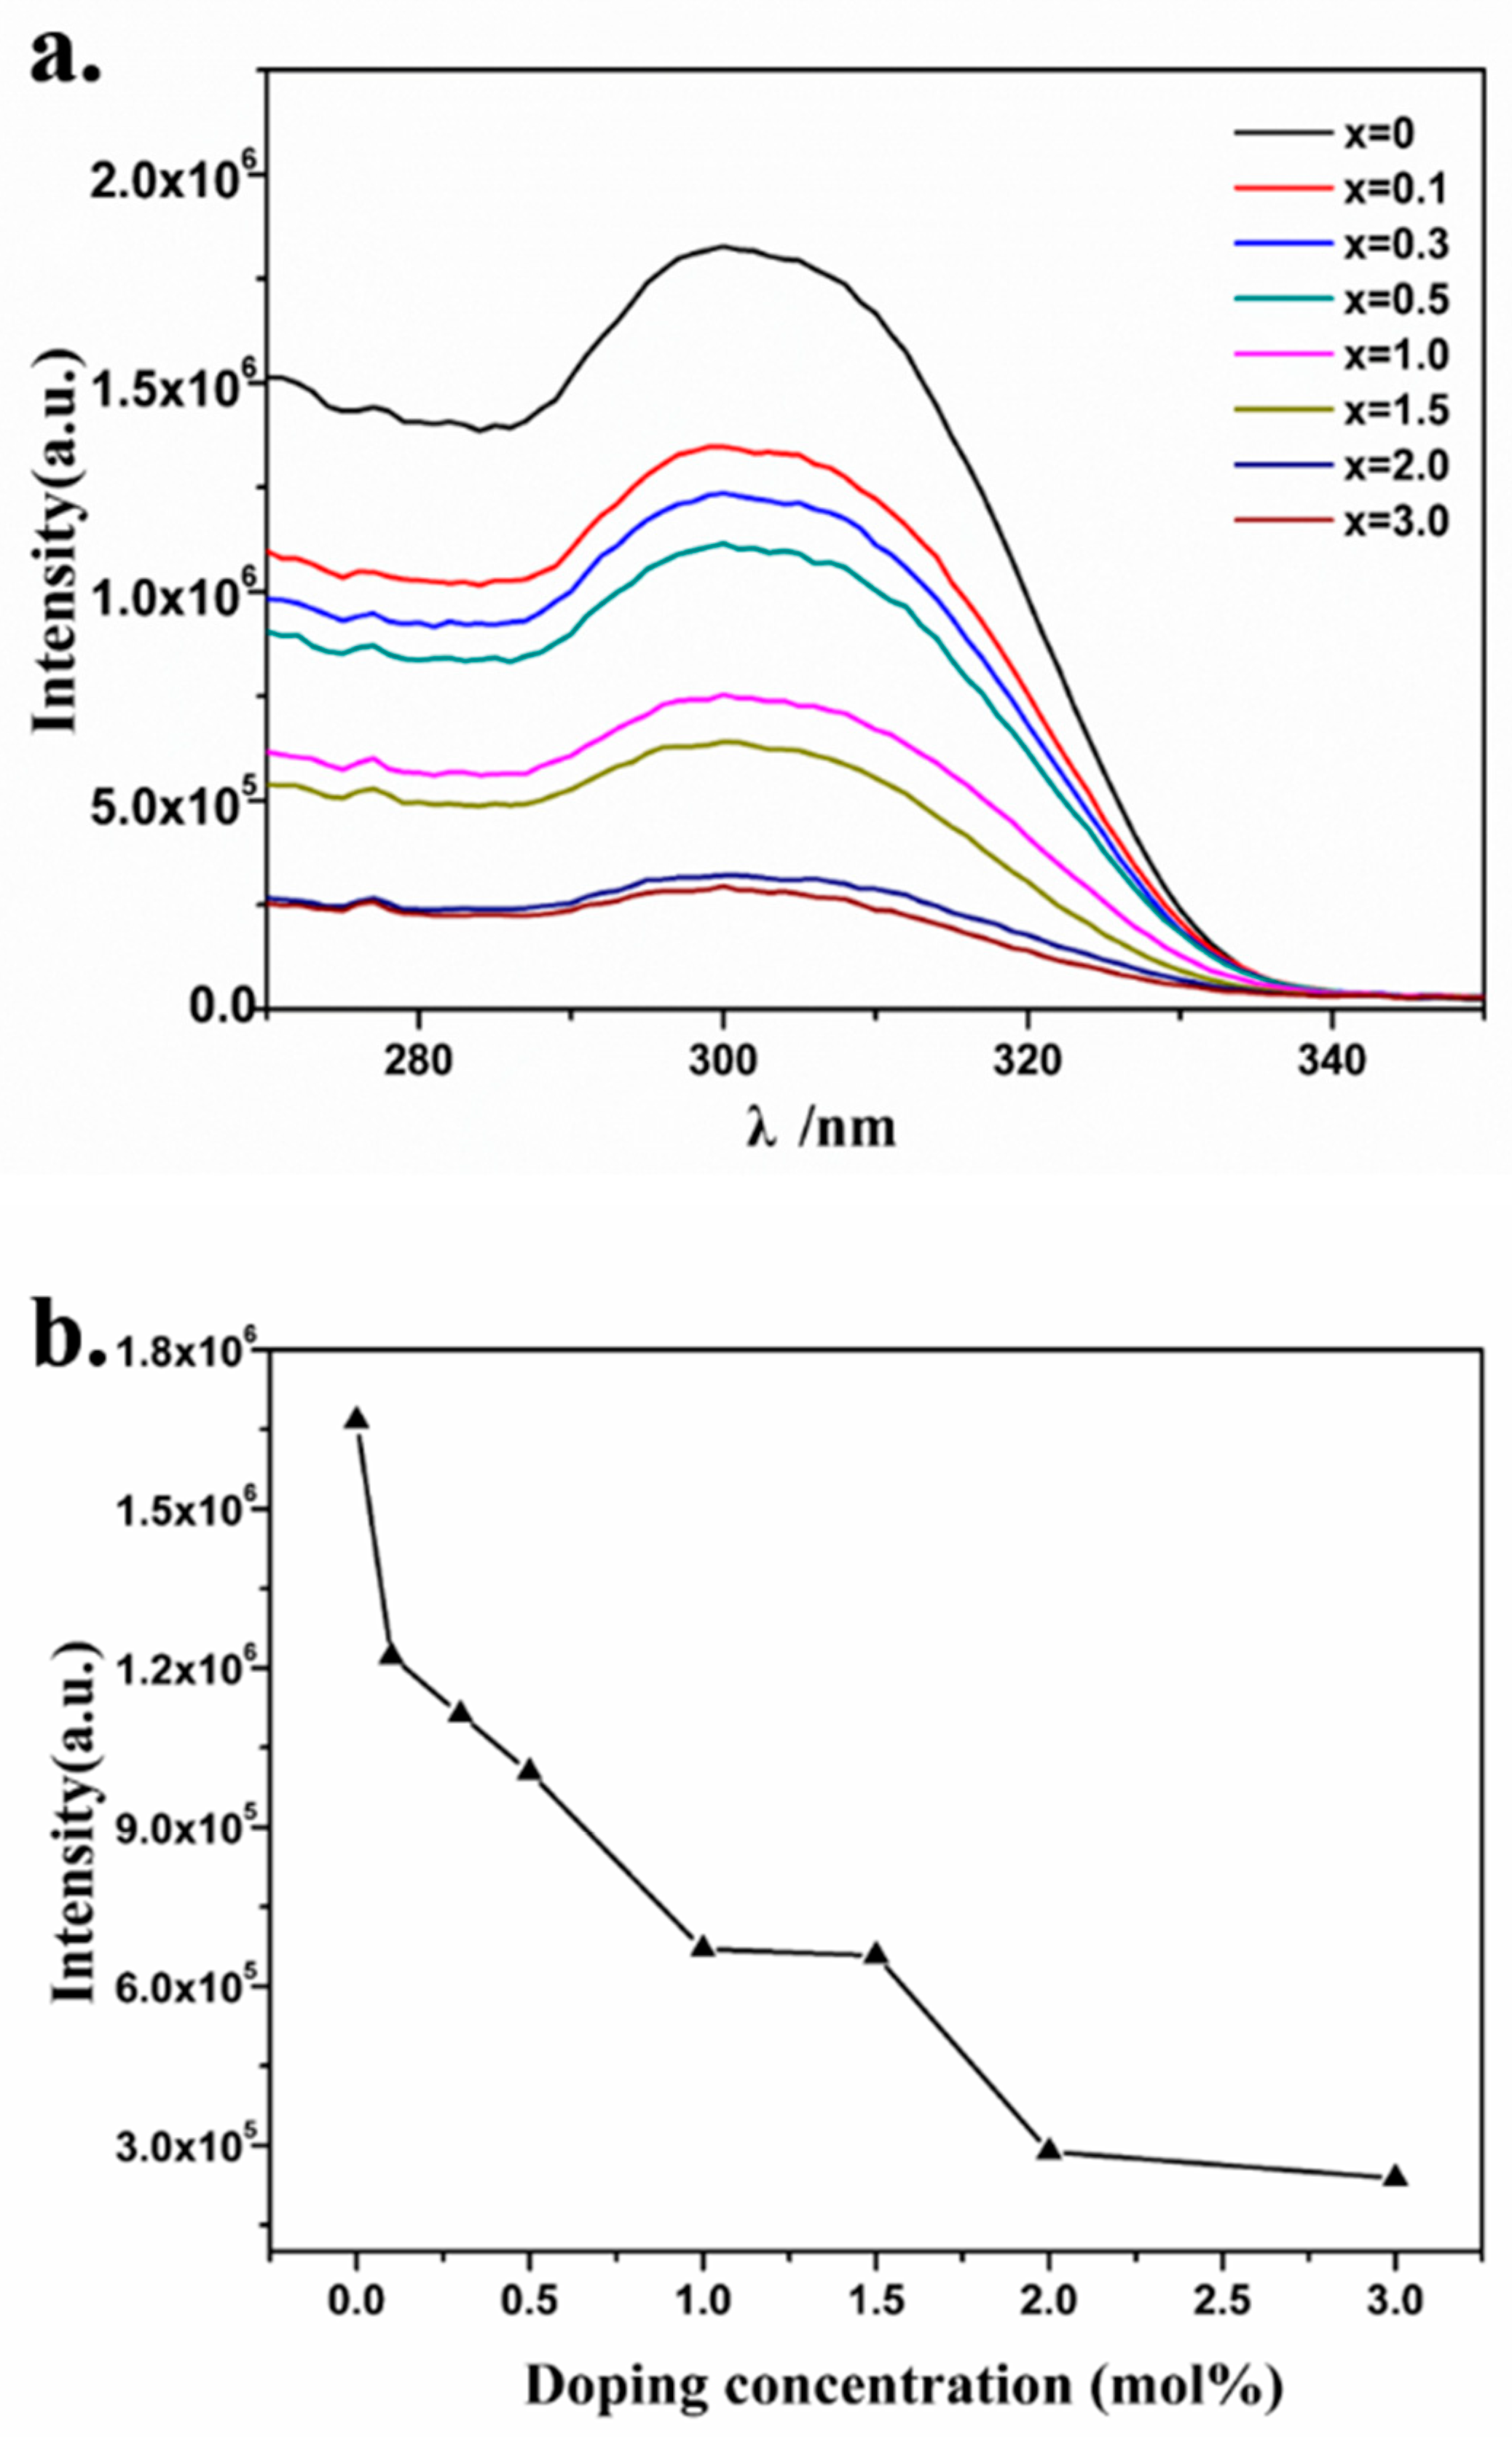
The photoluminescence excitation spectra of Sr2Ca (1−1.5x%) WO6: x mol% Dy3+ (x = 0, 0.1, 0.3, 0.5, 1.0, 1.5, 2.0, 3.0), which were measured at emission wavelength of 499 nm, are shown in Figure 4a. As shown in Figure 4a, there is a broad excitation band in the region of 270–330 nm. The calculated band structure and total densities of states of Sr2CaWO6 near the Fermi energy level have been reported [22]. The broad excitation band centered at 310 nm was attributed to the charge transfer from O2− to W6+ ions. The doping concentrations of Dy3+ ion have significant influence on the excitation band of the host lattice. With the increase of doping concentration, the excitation intensity at 310 nm decreased. The concentration dependent excitation intensity of phosphors at 310 nm is shown in Figure 4b.
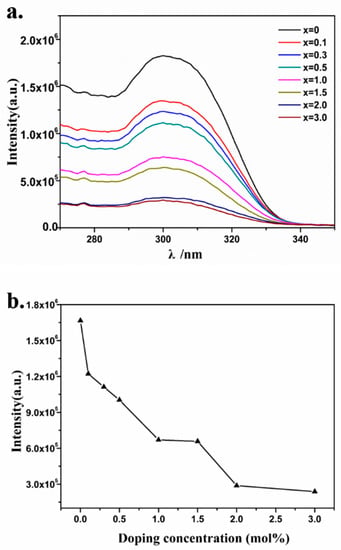
Figure 4.
(a) The photoluminescence excitation spectra (λem = 499 nm) of Sr2Ca(1−1.5x%)WO6: x mol% Dy3+ (x = 0, 0.1, 0.3, 0.5, 1.0, 1.5, 2.0, 3.0). (b) The concentration-dependent excitation intensity variation of phosphors at 310 nm.
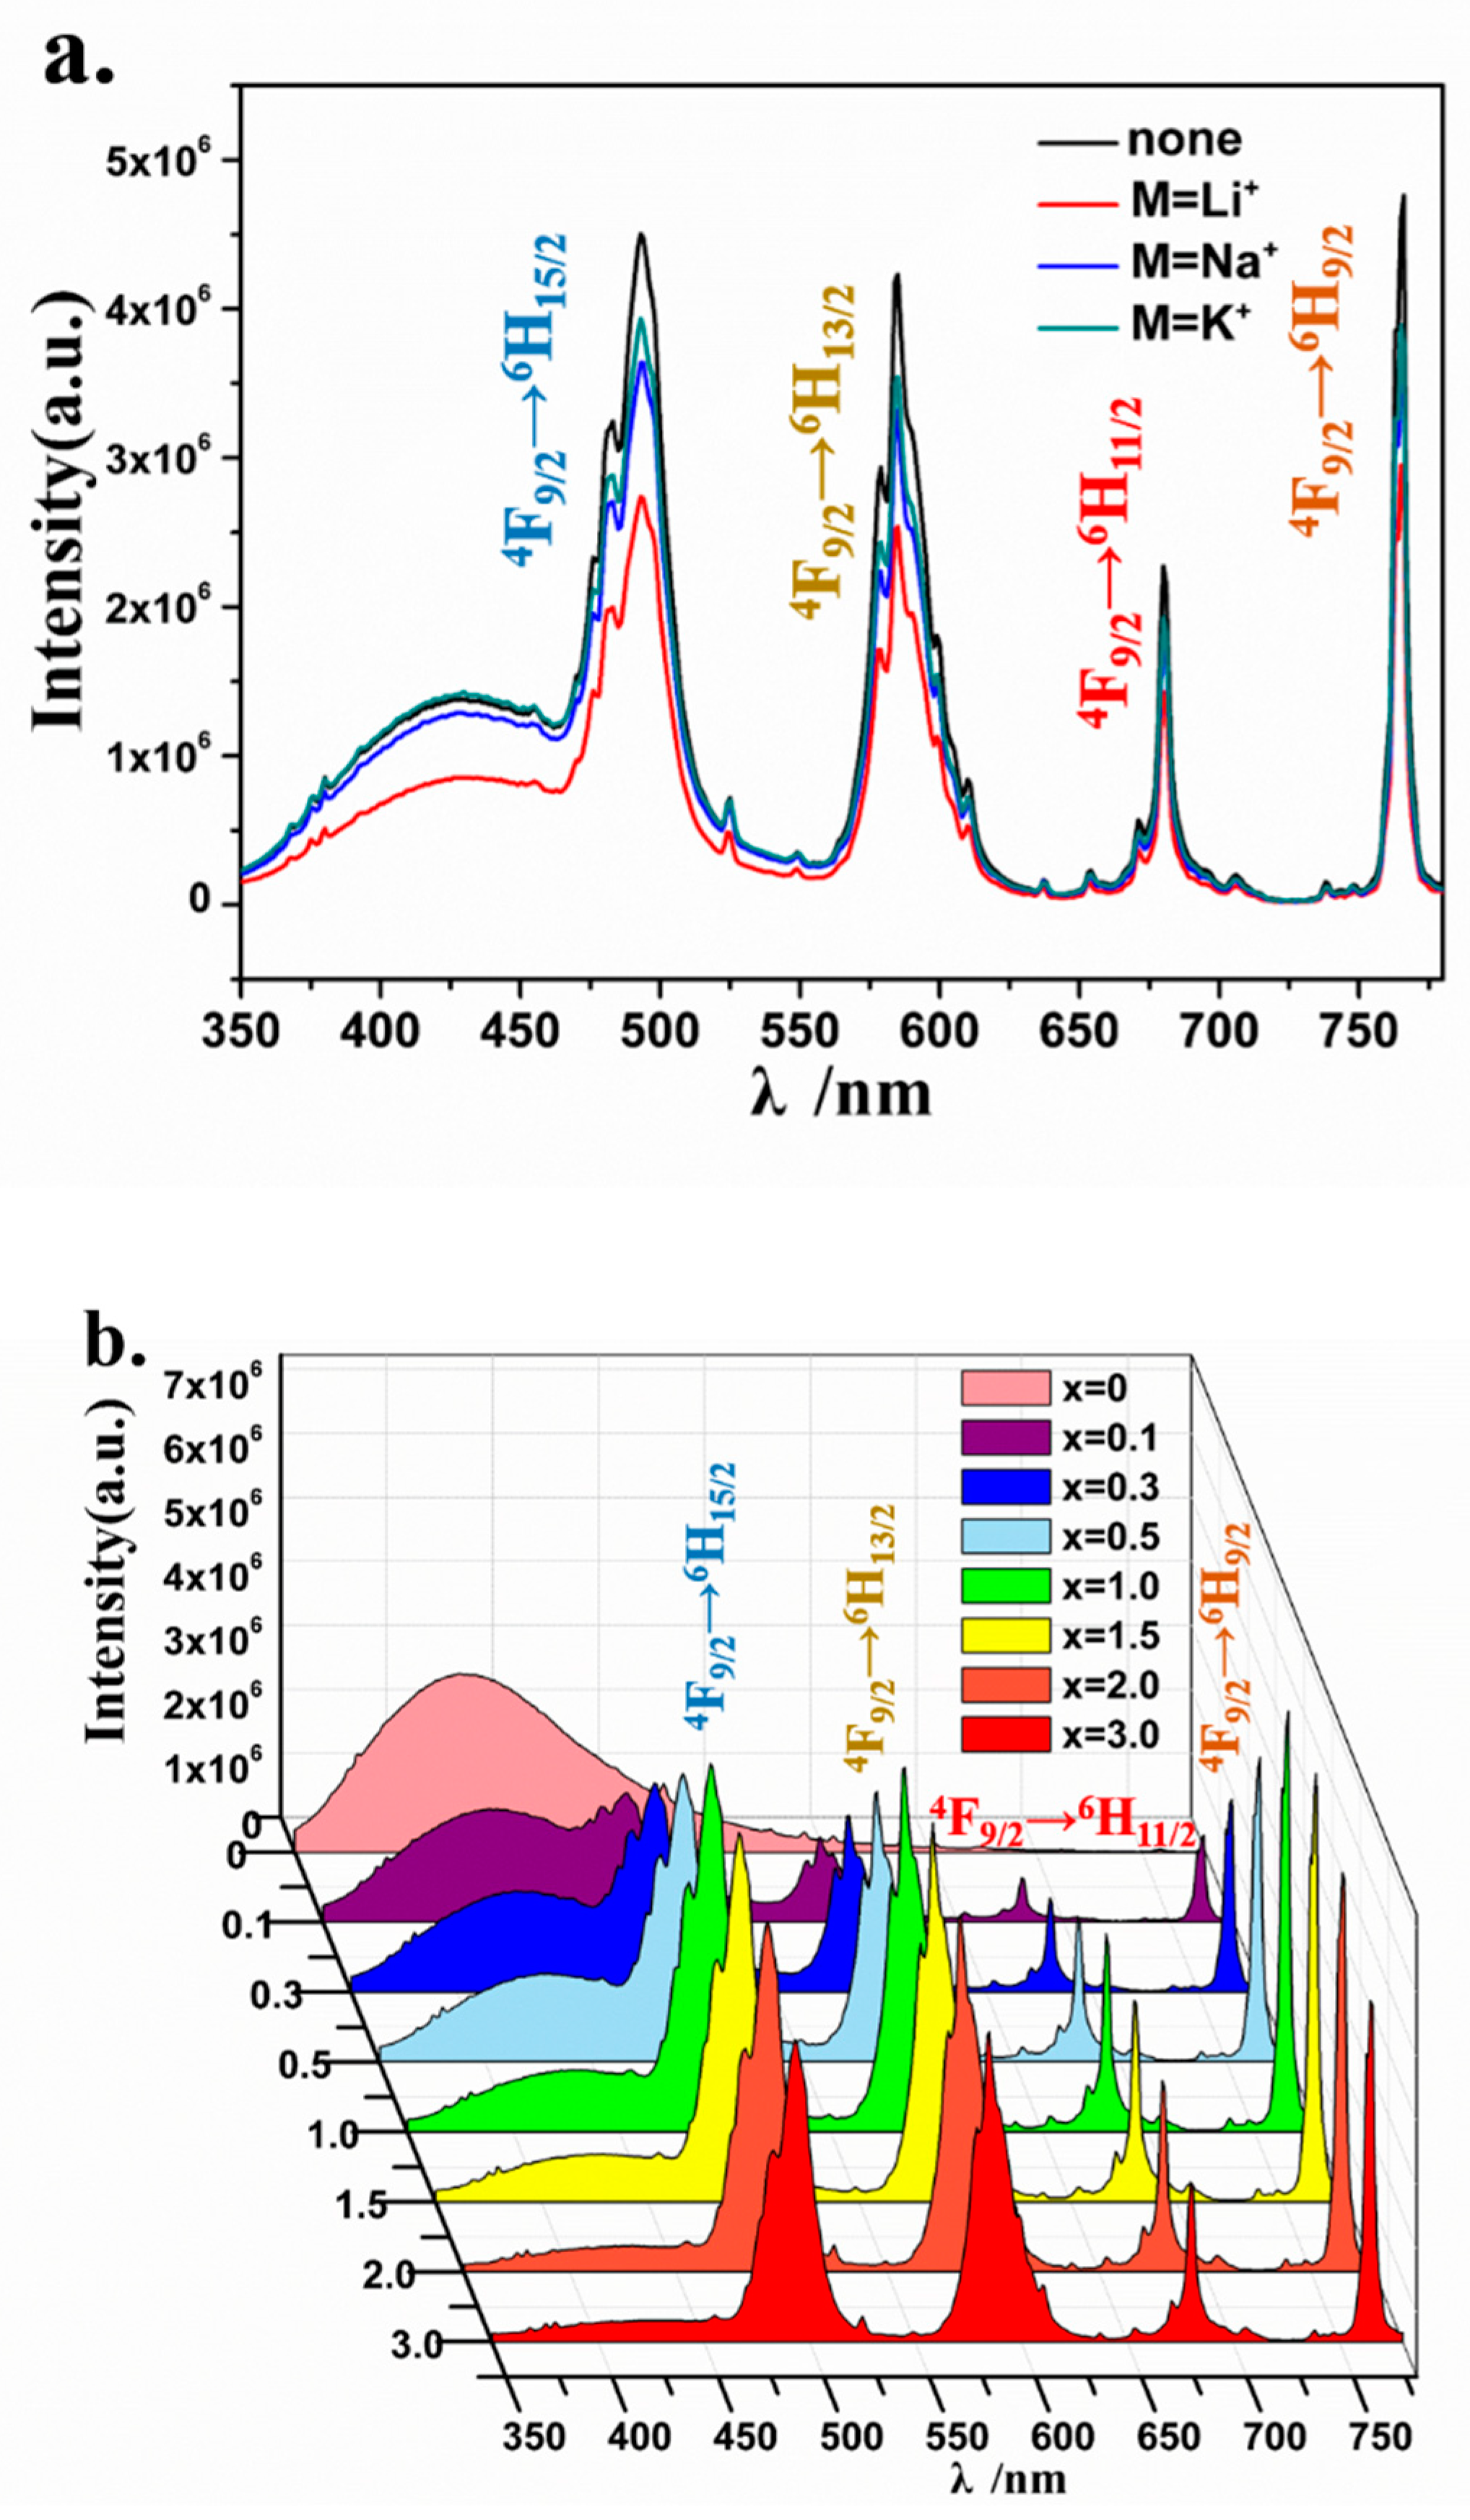
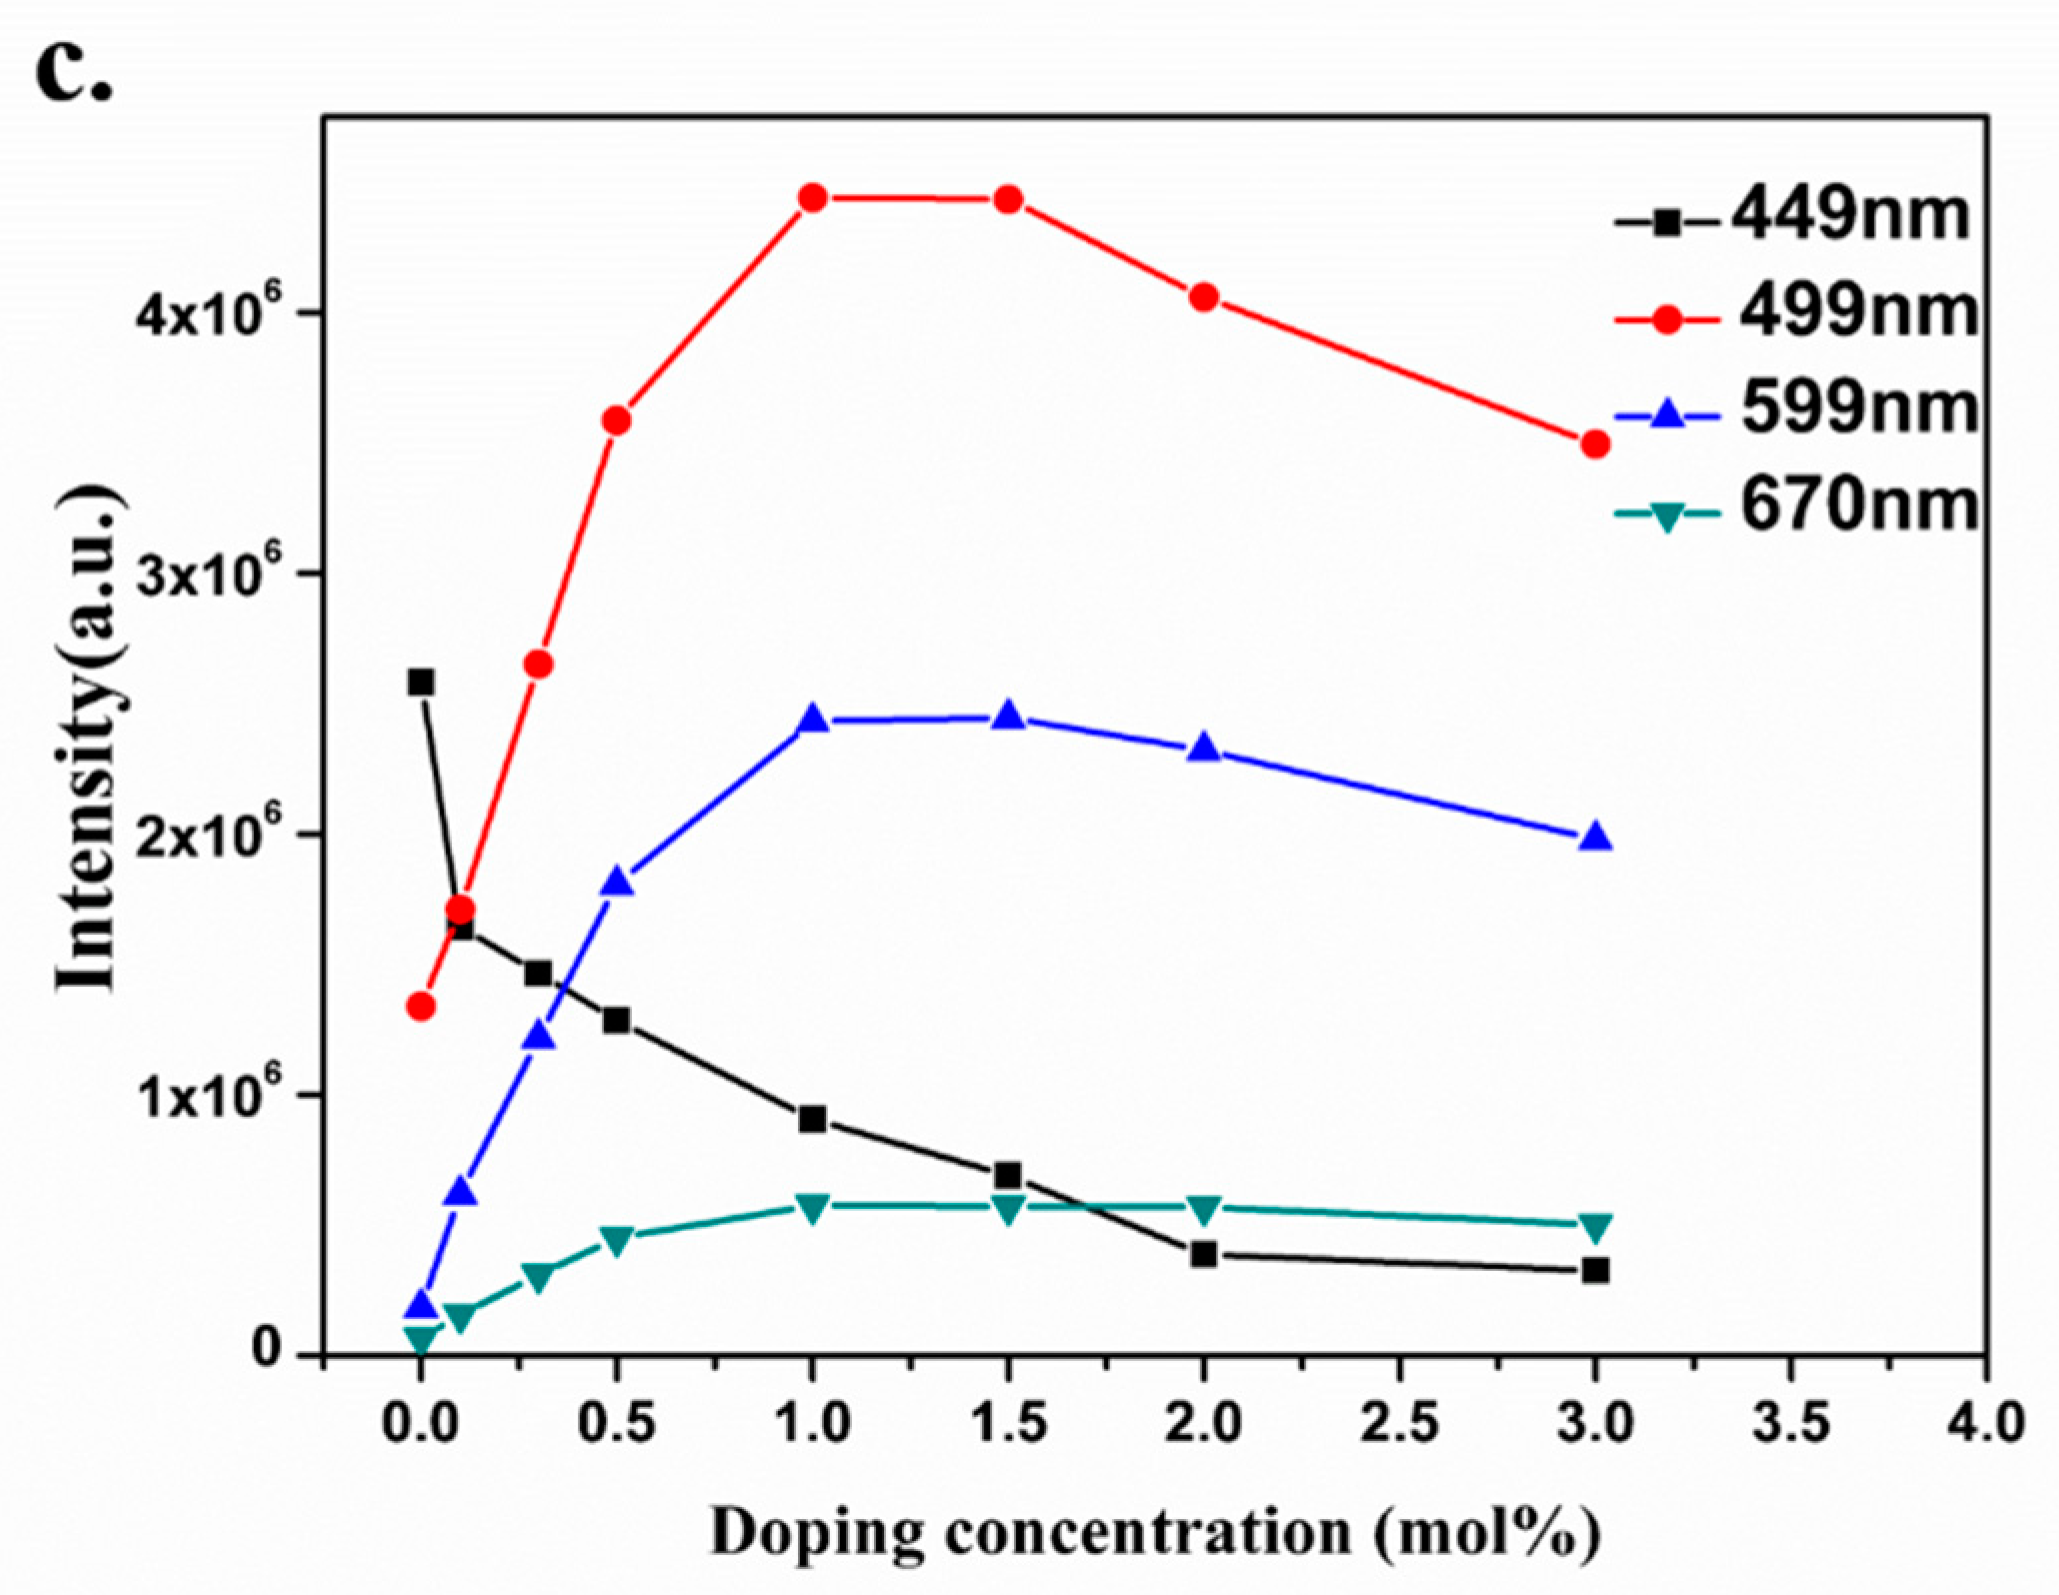
The photoluminescence emission spectra of Dy3+ doped Sr2CaWO6 phosphors were collected under excitation at 310 nm. Figure 5a shows the emission spectra of Sr2Ca0.99WO6: 0.5 mol% Dy3+, 0.5 mol% M+ (M+ = Li+, Na+ or K+). The introduction of charge compensation ions had no significant influence on the emission of Dy3+ ion doped Sr2CaWO6 phosphors. A broad emission band centered at 449 nm, which is due to self-trapped luminescent recombination in [WO6]6− octahedral [19,34]. The emission peaks at 499 nm (4F9/2 → 6H15/2), 599 nm (4F9/2 → 6H13/2), 670 nm (4F9/2 → 6H11/2) and 766 nm (4F9/2 → 6H9/2) are attributed to f–f transitions of Dy3+ ions. As shown in Figure 5a, the emission intensity of Sr2Ca0.99WO6: 0.5 mol% Dy3+, 0.5 mol% M+ decreased in different degrees with introducing charge compensation ions, which indicated that the defects caused by the introduction of charge compensation ions cause more energy loss. The emission spectra of Sr2Ca(1−1.5x%)WO6: x mol% Dy3+ (x = 0, 0.1, 0.3, 0.5, 1.0, 1.5, 2.0, 3.0) is shown in Figure 5b. The concentration-dependent emission intensity variations at 449 nm, 499 nm, 599 nm and 670 nm are shown in Figure 5c.
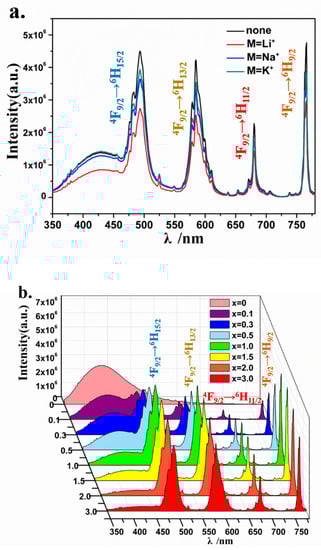
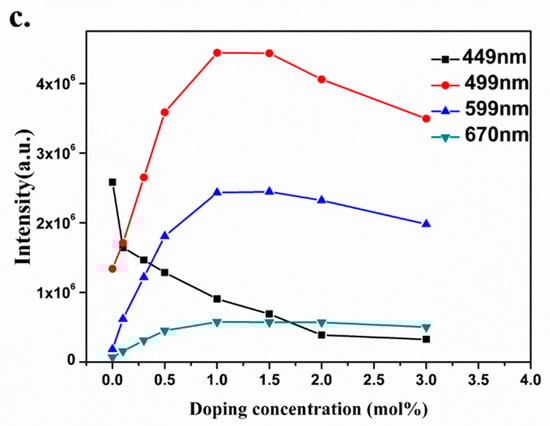
Figure 5.
(a) Emission spectrum of Sr2Ca0.99WO6: 0.5 mol% Dy3+, 0.5 mol% M+ (M+ = Li+, Na+ or K+) under 310 nm excitation; (b) Emission spectrum of Sr2Ca(1−1.5x%)WO6: x mol% Dy3+ (x = 0, 0.1, 0.3, 0.5, 1.0, 1.5, 2.0, 3.0) under 310 nm excitation. (c) The concentration-dependent emission intensity variations at 449 nm, 499 nm, 599 nm and 670 nm respectively.
The electric dipole transition of 4F9/2 → 6H13/2 emission of Dy3+ ion is sensitive to surrounding environment [24]. If there is no inversion center, the 4F9/2 → 6H13/2 emission of Dy3+ ions will be strong. Otherwise, the 4F9/2 → 6H13/2 emission of Dy3+ ion will be weak. However, the transition of 4F9/2 → 6H15/2 is not as sensitive to coordinate surroundings [24,35]. Therefore, the symmetry of the environment in which Dy3+ ions are located can be judged by comparing the relative intensity of 4F9/2 → 6H13/2 and 4F9/2 → 6H15/2 transition [36]. In most fluorescent materials, with Dy3+ ions in the asymmetric position the transition intensity of 4F9/2 → 6H13/2 is much stronger than that of 4F9/2 → 6H15/2 (such as SrMoO4:Dy3+ [37], LuNbO4:Dy3+ [31], and Sr2ZnWO6:Dy3+ [19]). With Dy3+ ion located at a position with high symmetry, the transition intensity of 4F9/2 → 6H13/2 is almost the same as that of 4F9/2 → 6H15/2, or even weaker than that of 4F9/2 → 6H15/2 (such as Ba3La2−x(BO3)4:xDy3+ [38], Ba2Ca(1−x)WO6:xDy3+ [20], Sr3Sc1−x(PO4)3:xDy3+ [39]). As can be seen from the emission spectra of Dy3+ ion doped Sr2CaWO6, the emission intensity of 4F9/2 → 6H15/2 at 499 nm is similar to 4F9/2 → 6H13/2 centered at 599 nm, which indicates that Dy3+ replaces the position with high symmetry.
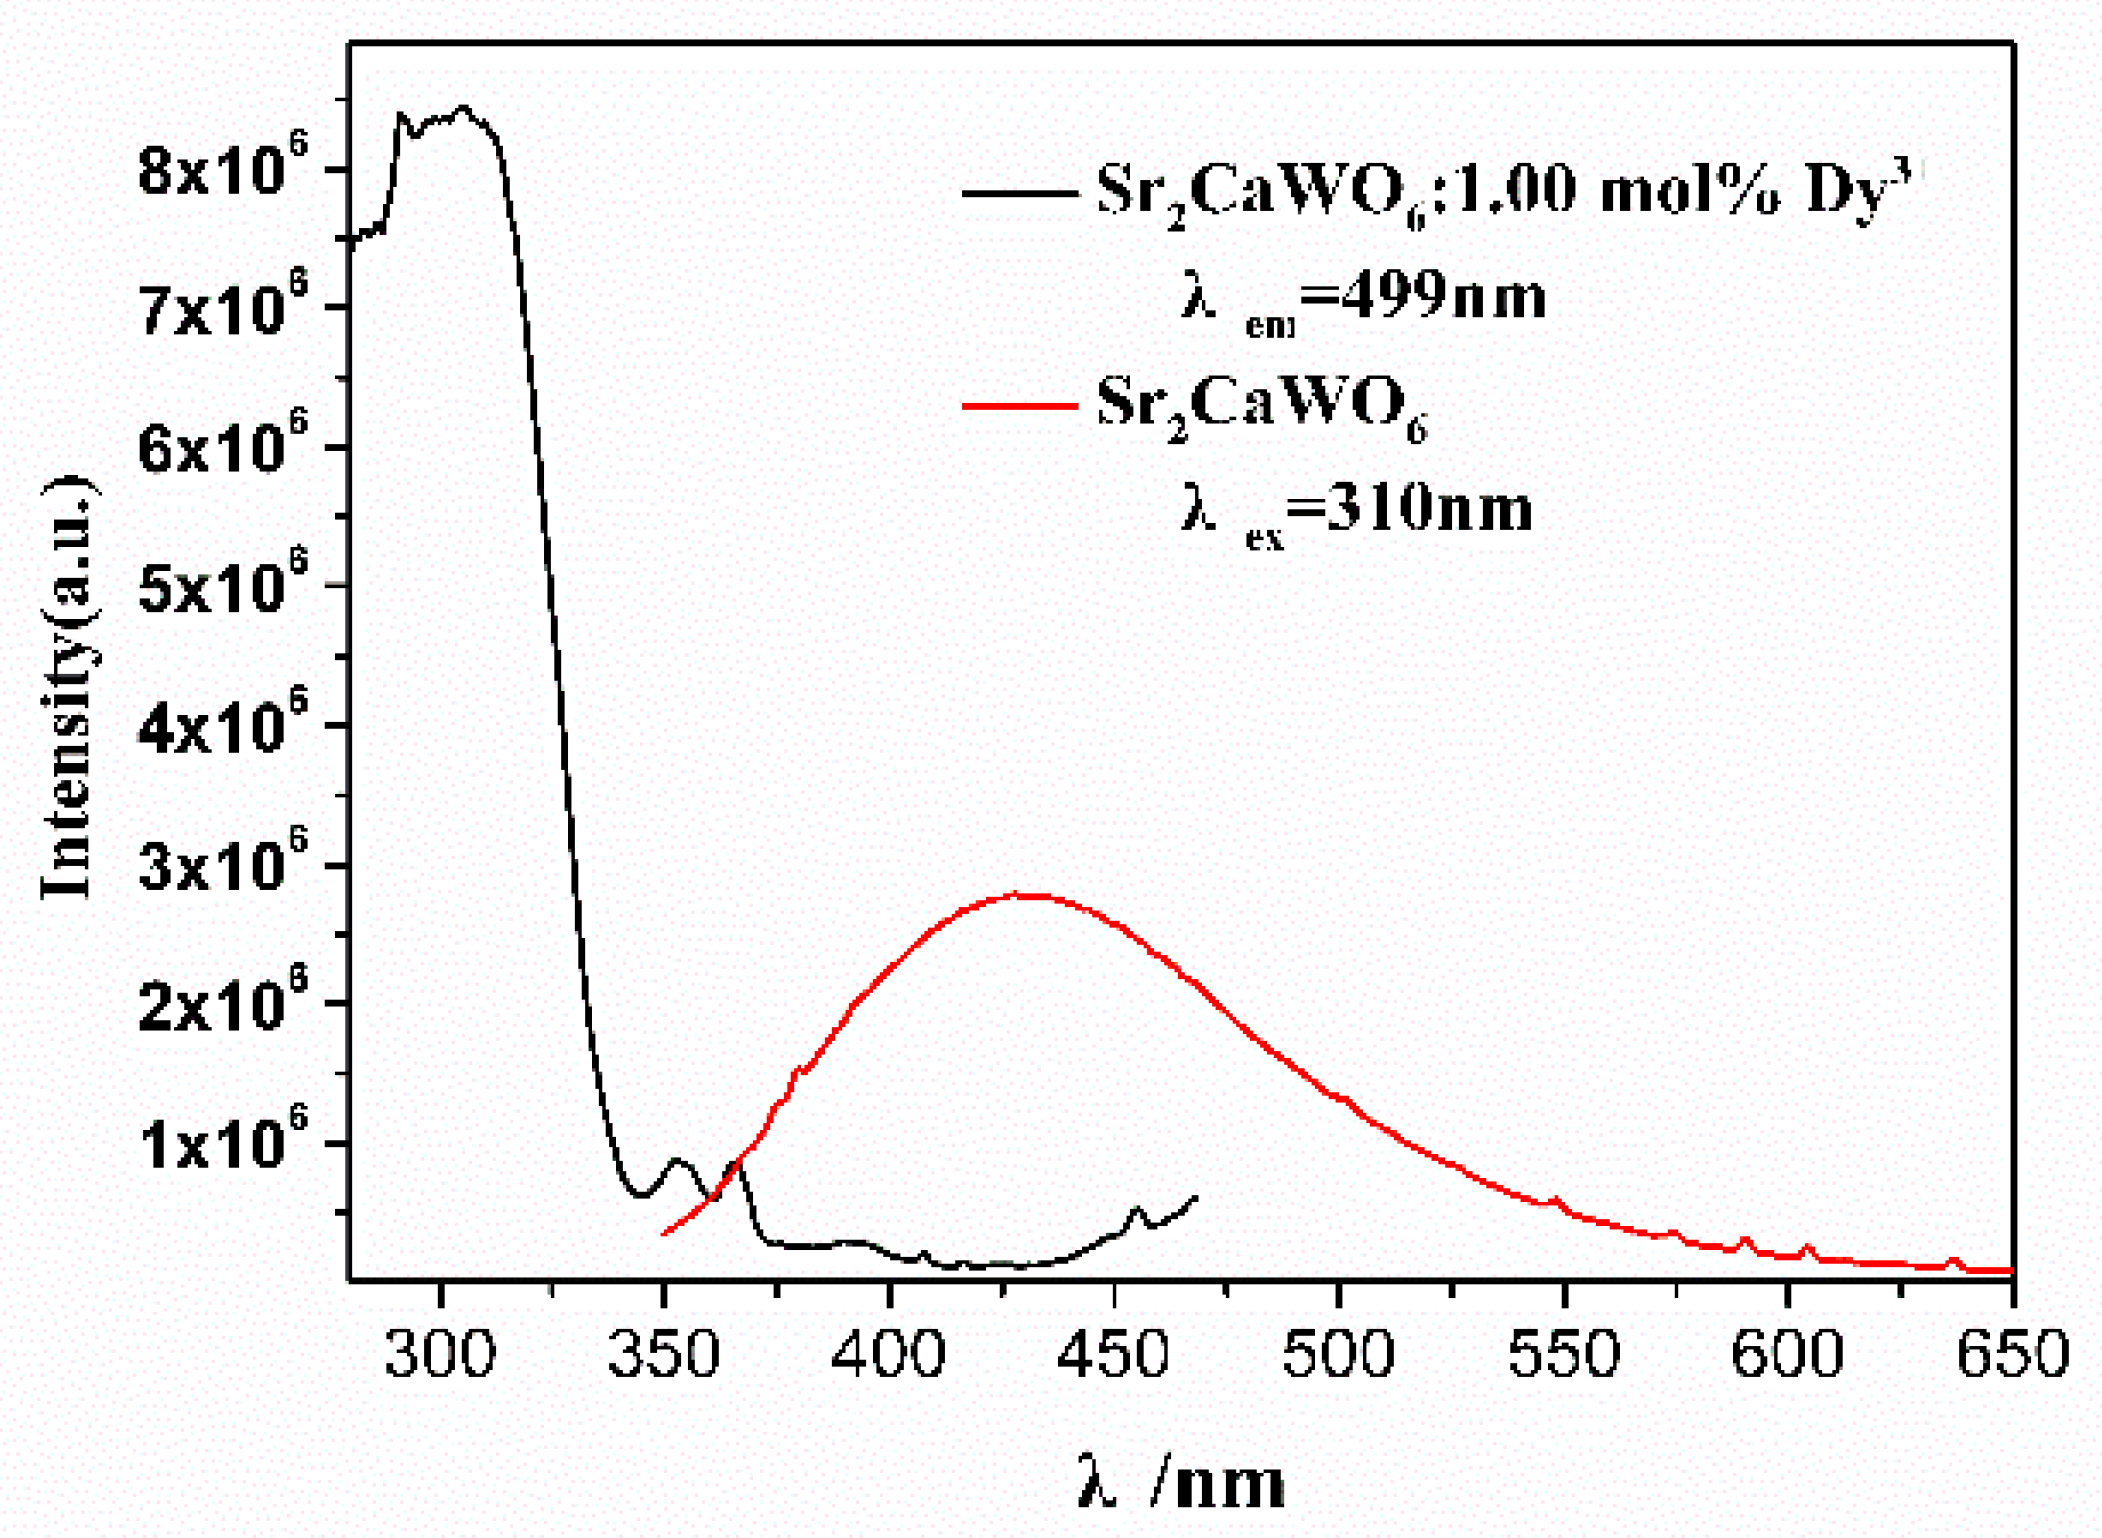
As shown in Figure 6, the excitation peaks located at 352 nm, 366 nm, and 455 nm are attributed to the f-f transition absorptions of Dy3+ ions. The excitation spectra of Dy3+ ions have significant overlap with the emission spectra of Sr2CaWO6, and there is energy radiation transfer from Sr2CaWO6 host lattice (donors) to Dy3+ ions (acceptors) [40]. Hence, the emission peak intensity at 449 nm decreased with the increase of the concentration of Dy3+ ion, while the emission peak intensities at 499 nm, 599 nm, 670 nm, and 766 nm increased with higher doping concentration of Dy3+ ion when x ≤ 1.0. However, when x >1.0, the emission peak intensities at 499 nm, 599 nm, 670 nm, and 766 nm decreased with the increase of the concentration of Dy3+ ion. The emission peak-intensities at 449 nm, 499 nm, 599 nm, and 670 nm changed with concentration of Dy3+ ion, and single-composition WLED phosphors with tunable correlated color temperature were successfully generated through adjusting the concentration of Dy3+ ion.

Figure 6.
The excitation spectrum of Sr2Ca0.985WO6: 1 mol% Dy3+ (λem = 499 nm) is shown in black, and the emission spectrum of Sr2CaWO6 under 310 nm excitation is shown in red.
The critical distance (Rc) between Dy3+ ions were calculated by the concentration quenching method. The critical transfer distance (Rc) was calculated with the following formula (Equation (2)) which was proposed by Blasse [41]:
In this equation, V is the volume of crystallographic unit cell, xc is the critical concentration, and N is the lattice site number in a unit cell which can be replaced by sensitizers. In Sr2CaWO6, V = 276.24 Å3, N = 2, and xc = 0.01, Rc of Dy3+ ion is calculated to be 29.8 Å. In general, for the energy transfer process, the exchange interaction and multipole interaction are the two mechanisms that can play important roles [40]. Exchange interactions take place over a distance shorter than 5 Å, while multipole interaction can occur at a distance as large as 30 Å [42,43]. The critical distance of Dy3+ ion in Sr2CaWO6 equal to 29.8 Å, which is much larger than 5 Å. Therefore, the energy transfer process belongs to multipole interaction instead of exchange interaction.
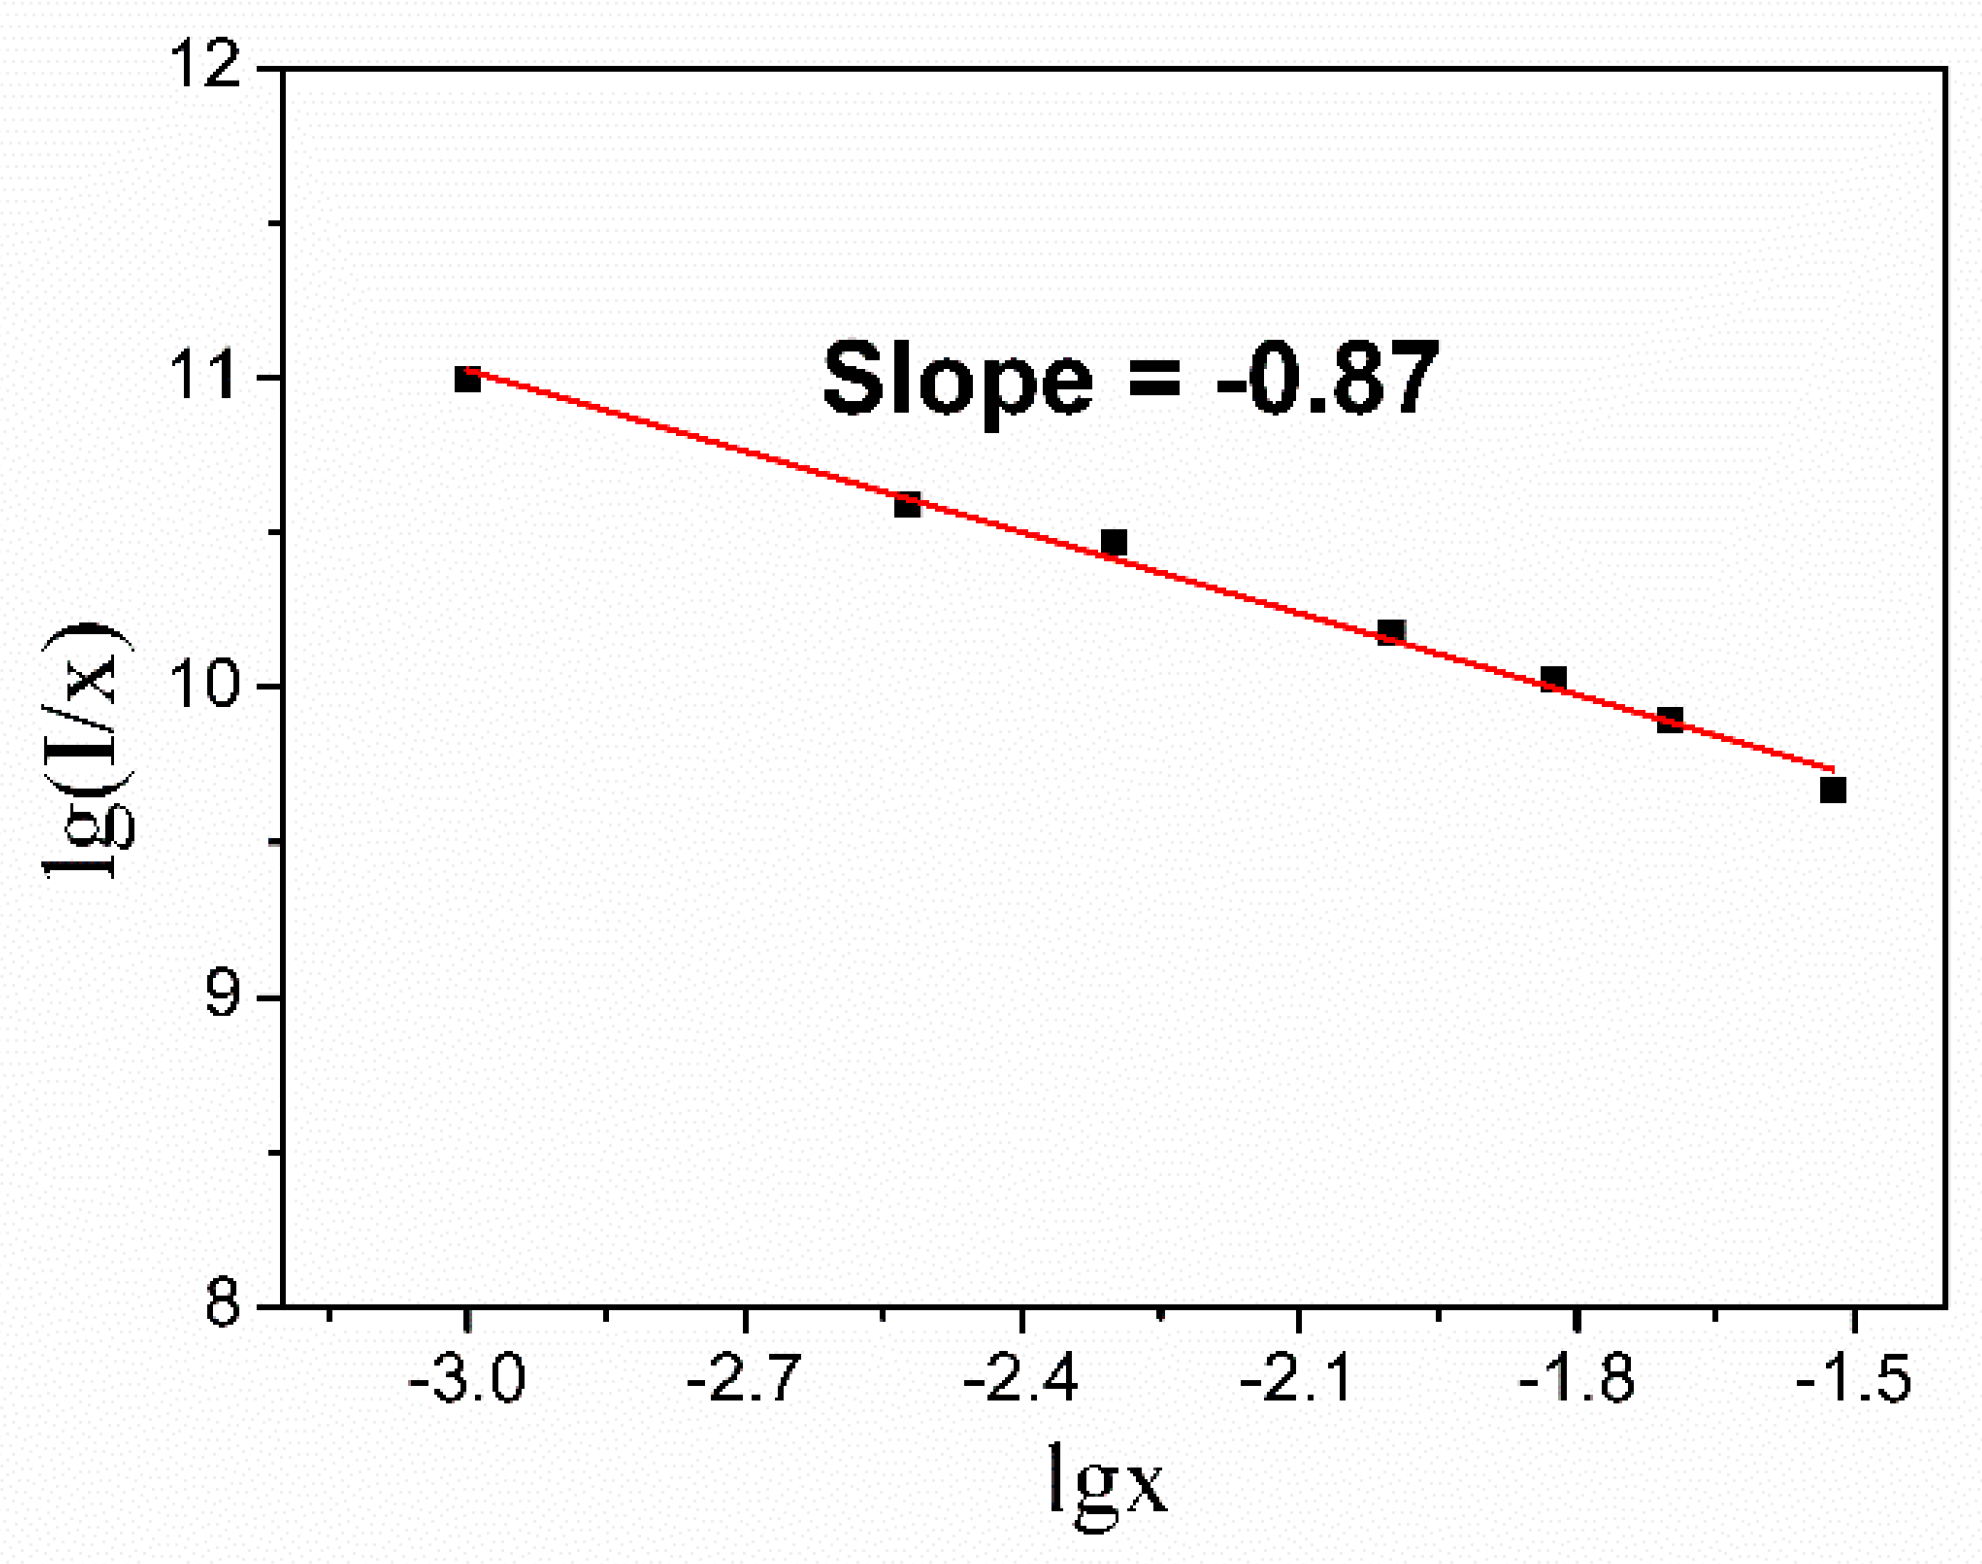
Van Uitert [40] has pointed out that when non-radiative losses are attributed to multipolar transfer, the strength of multipolar interaction can be determined from the change in the emission intensity of activator. The relation between the emission intensity of each activator and the concentration of each activator can be expressed by Equation (3) [44,45]:
where I is the integral emission intensity of 6F5/2 → 4H13/2, x is the corresponding doping concentration, A is a constant which independent on the dopant concentration, and s is dependent on the interaction process. The value of s can be 6, 8, and 10, corresponding to electric dipole–dipole, electric dipole–quadrupole or electric quadrupole–quadrupole interaction, respectively. When s equal to 3, the energy transfer among nearest-neighbor ions plays a major role in quenching. As shown in Figure 7, the slope was calculated to be −0.87, thus s is most approximate 3. Therefore, the energy transfer process is most likely caused by energy transfer among nearest-neighbor ions.

Figure 7.
The function relation between lg (I/x) and lg x.
Figure 8 shows the decay curve of Sr2CaWO6: 1.00 mol% Dy3+ phosphors excited at 310 nm and monitored at 499 nm. The decay curve fits well with the following single-exponential Equation (4):
where I(t) is the emission intensity at time t and A is a constant. Thus, the lifetime value of τ is calculated to be 0.48 ns. The reported lifetime value of Sr1.99CaWO6:0.01Dy3+ is 127 μs [34]. Therefore, synthesis methods and doping sites appear to have significant influence on fluorescence lifetime.
I(t) = A exp (−t/τ)
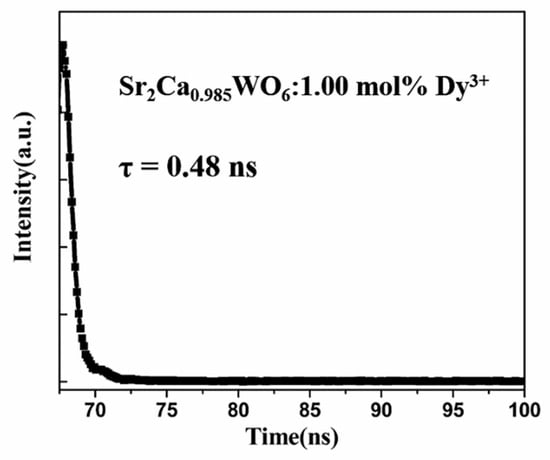
Figure 8.
Decay curve of Sr2CaWO6: 1.00 mol% Dy3+ at room temperature with λex = 310 nm and λem = 499 nm.
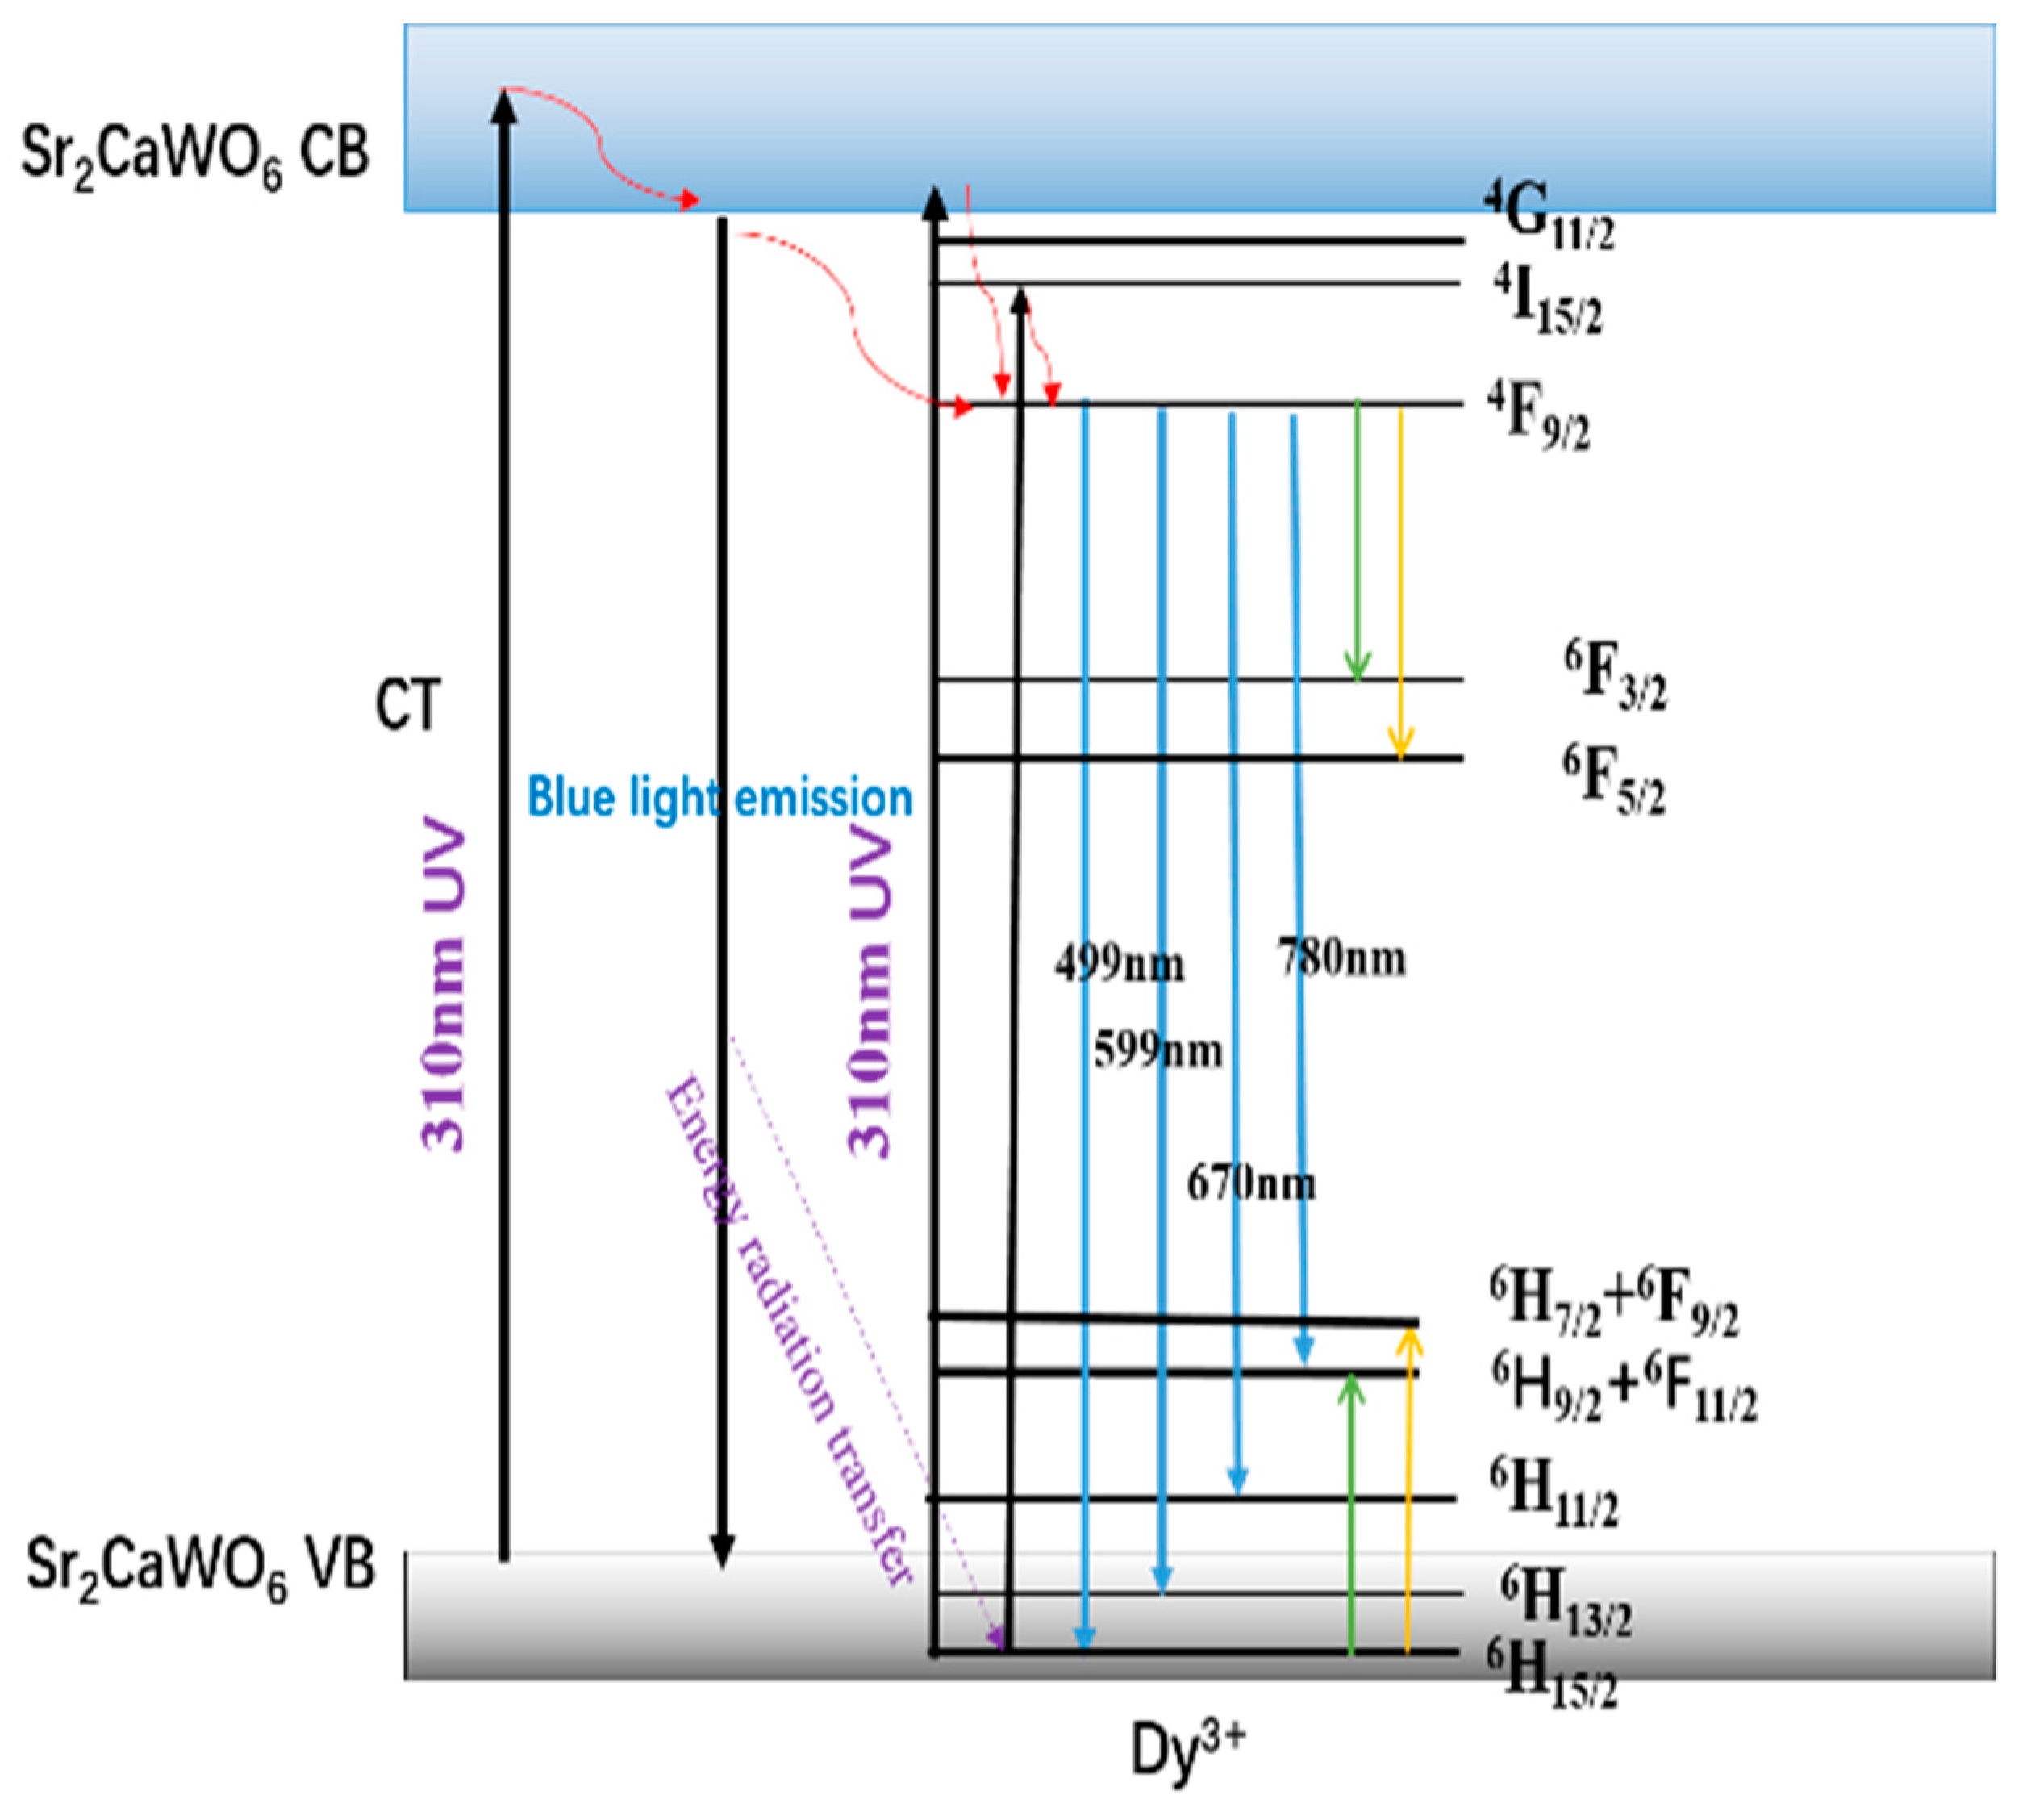
The proposed energy transfer mechanism of Sr2CaWO6:Dy3+ phosphors are shown in Figure 9. In Sr2CaWO6, electrons at valance band top were excited under 310 nm ultraviolet irradiation and transferred to conduction band, which is mainly attributed to the charge transfer from O atoms to W atoms. Electrons at conduction band returned to conduction band bottom through non-radiative transition. When electrons at conduction band bottom transfer to the top of valance band, energy is released by radiative transition. Thus, there is a broad blue light emission band in Sr2CaWO6. In Sr2Ca(1−1.5x%)WO6: x mol% Dy3+ phosphors, besides the excitation of charge transfer from O atoms to W atoms, Dy3+ ions are also excited by the ultraviolet under 310 nm. Dy3+ ions can be excited to energy levels higher than 4F9/2 by visible light from 350 nm until 450 nm. Electrons at high energy levels return to 4F9/2 configuration through non-radiative transition, then release to 6HJ (J = 11/2, 13/2, 15/2) configuration through radiative transition. It is well known that Dy3+ ions have matched energy level pairs which produce strong cross relaxation and lead to concentration quenching. Therefore, it can be inferred that besides the energy transfer among nearest-neighbor ion, the concentration quenching is also related to cross relaxation of Dy3+ ions (4F9/2:6H15/2 → 6H9/2 + 6F11/2:6F3/2 and 4F9/2:6H15/2 → 6F5/2:6H7/2 + 6F9/2, where 6H9/2 + 6F11/2 and 6H7/2 + 6F9/2 mean the energy level of 6H9/2 and 6H7/2 are very close to those of 6F11/2, and 6F9/2, respectively) [45].
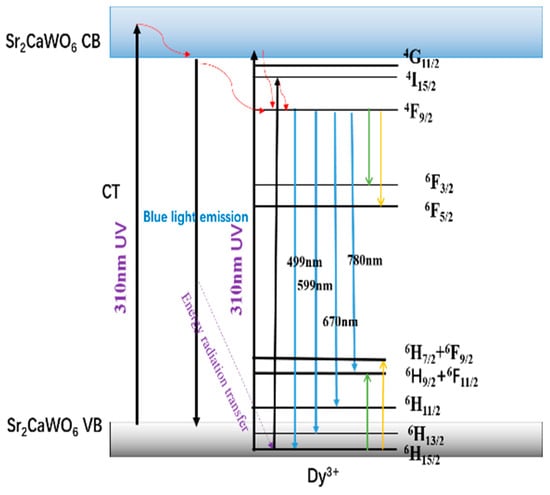
Figure 9.
Schematic illustration of the energy transfer mechanism for Sr2CaWO6:Dy3+. The red solid curve with an arrow means the vibrational relaxation of excited Dy3+ ion in Sr2CaWO6. The green solid line with an arrow and the yellow one means the cross relaxation 4F9/2:6H15/2 → 6H9/2 + 6F11/2:6F3/2 and 4F9/2:6H15/2 → 6F5/2:6H7/2 + 6F9/2 of Dy3+ ions, respectively.
3.4. Commission International de I’Eclairage (CIE) chromaticity diagram
As shown in Table 1, with the increase of doping concentration, the CIE coordinates of Sr2Ca(1-1.5x%)WO6: x mol% Dy3+ phosphors can be adjusted from the blue region (0.18, 0.16) to white (0.34, 0.33) (x = 1), which is very close to the coordinate of standard white light (0.33, 0.33). As the doping concentration continues to increase, the CIE coordinates gradually shift to the yellow region (0.37, 0.36). By adjusting the concentration of Dy3+ ion, a series of phosphors with different CIE coordinates were successfully obtained and white light from a single host was successfully obtained (Figure 10).

Table 1.
Commission International de I’Eclairage (CIE) coordinates of different Dy3+ ion concentration of Sr2CaWO6.
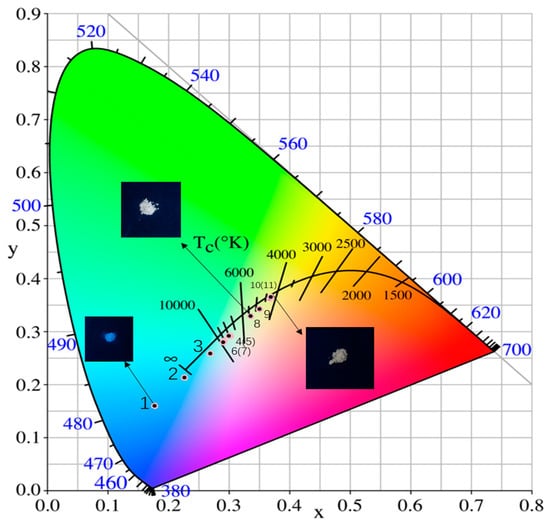
Figure 10.
CIE 1931 color coordinates of Sr2Ca(1-1.5x%)WO6: x mol% Dy3+ (x = 0, 0.1, 0.3, 0.5, 1.0, 1.5, 2.0, 3.0) and Sr2Ca0.99WO6: 0.5 mol% Dy3+, 0.5 mol% M+ (M+ = Li+, Na+ or K+).
Chromaticity coordinates of Sr2Ca(1−1.5x%)WO6: x mol% Dy3+ (x = 0, 0.1, 0.3, 0.5, 1.0, 2.0, 3.0) and Sr2Ca0.99WO6: 0.5 mol% Dy3+, 0.5 mol% M+ (M+ = Li+, Na+ or K+) were compared at various Dy3+ ion concentration. It can be seen that the CIE coordinates of the samples with and without charge compensation ions are very close (Figure 10). Therefore, the introduction of charge compensation ion does not significantly affect the chromaticity coordinates.
4. Conclusions
In summary, phosphors with Dy3+ doped on the Ca site of Sr2CaWO6 were prepared by high temperature solid state method, and they can be excited under 310 nm ultraviolet. The host compound, Sr2CaWO6 emits blue light centered at 449 nm with the color coordinate of (0.18, 0.16) under ultraviolet excitation at 310 nm. The intensity of emission peaks under 310 nm excitation can be tuned by adjusting the concentration of Dy3+ ion. White light emission with CIE coordinate (0.34, 0.33) was successfully generated in Sr2CaWO6:Dy3+ phosphors at the doping level of 1 mol% on the Ca site. Considering the overlap between the emission spectra of host lattice and the excitation spectra of Dy3+ ions, it is expected that there is efficient energy transfer from host lattice to Dy3+ ions.
Author Contributions
Data curation, Y.D. and S.Y.; Formal analysis, Y.D.; Investigation, Y.D.; Methodology, Y.D., Y.S., C.-G.D., H.P., F.Y. and Q.Z.; Resources, Y.D.; Writing—original draft, Y.D.; Writing—review & editing, F.Y. and Q.Z.
Funding
This research was funded by East China Normal University through startup funding grant number 11200-120215-10363.
Acknowledgments
Support from East China Normal University through startup funding is acknowledged.
Conflicts of Interest
The authors declare no conflict of interest.
References
- Ye, S.; Xiao, F.; Pan, Y.X.; Ma, Y.Y.; Zhang, Q.Y. Phosphors in phosphor-converted white light-emitting diodes: Recent advances in materials, techniques and properties. Mater. Sci. Eng. R 2010, 71, 1–34. [Google Scholar] [CrossRef]
- Hong, W.T.; Lee, J.H.; Son, J.W.; Lee, Z.; Park, H.J.; Kim, H.S.; Lee, J.S.; Yang, H.K. Color rendering improvement of the YAG:Ce3+ phosphors by co-doping with Gd3+ ions. Ceram. Int. 2016, 42, 2204–2208. [Google Scholar] [CrossRef]
- Jang, H.S.; Won, Y.H.; Jeon, D.Y. Improvement of electroluminescent property of blue LED coated with highly luminescent yellow-emitting phosphors. Appl. Phys. B 2009, 95, 715–720. [Google Scholar] [CrossRef]
- Sheu, J.K.; Chang, S.J.; Kuo, C.H.; Su, Y.K.; Wu, L.W.; Lin, Y.C.; Lai, W.C.; Tsai, J.M.; Chi, G.C.; Wu, R.K. White-light emission from near UV InGaN-GaN LED chip precoated with blue/green/red phosphors. IEEE J. Quantum Electron. 2003, 15, 18–20. [Google Scholar] [CrossRef]
- Wang, D.Y.; Huang, C.H.; Wu, Y.C.; Chen, T.M. BaZrSi3O9:Eu2+: a cyan-emitting phosphor with high quantum efficiency for white light-emitting diodes. J. Mater. Chem. 2011, 21, 10818–10822. [Google Scholar] [CrossRef]
- Kim, Y.H.; Viswanath, N.S.M.; Unithrattil, S.; Kim, H.J.; Im, W.B. Review—Phosphor Plates for High-Power LED Applications: Challenges and Opportunities toward Perfect Lighting. ECS J. Solid State Sci. Technol. 2018, 7, R3134–R3147. [Google Scholar] [CrossRef]
- Ci, Z.; Sun, Q.; Qin, S.; Sun, M.; Jiang, X.; Zhang, X.; Wang, Y. Warm white light generation from a single phase Dy3+ doped Mg2Al4Si5O18 phosphor for white UV-LEDs. Phys. Chem. Chem. Phys. 2014, 16, 11597–11602. [Google Scholar] [CrossRef]
- Kim, J.S.; Jeon, P.E.; Choi, J.C.; Park, H.L.; Mho, S.I.; Kim, G.C. Warm-white-light emitting diode utilizing a single-phase full-color Ba3MgSi2O8:Eu2+, Mn2+ phosphor. Appl. Phys. Lett. 2004, 84, 2931–2933. [Google Scholar] [CrossRef]
- Vishwakarma, A.K.; Jha, K.; Jayasimhadri, M.; Sivaiah, B.; Gahtori, B.; Haranath, D. Emerging cool white light emission from Dy3+ doped single phase alkaline earth niobate phosphors for indoor lighting applications. Dalton Trans. 2015, 44, 17166–17174. [Google Scholar] [CrossRef]
- Li, G.G.; Lin, J. Recent progress in low-voltage cathodoluminescent materials: synthesis, improvement and emission properties. Chem. Soc. Rev. 2014, 43, 7099–7131. [Google Scholar] [CrossRef]
- Zhong, J.S.; Chen, D.Q.; Zhou, Y.; Wan, Z.Y.; Ding, M.Y.; Bai, W.F.; Ji, Z.G. New Eu3+-activated perovskite La0.5Na0.5TiO3 phosphors in glass for warm white light emitting diodes. Dalton Trans. 2016, 45, 4762–4770. [Google Scholar] [CrossRef] [PubMed]
- Zheng, W.J.; Pang, W.Q.; Meng, G.Y. Hydrothermal synthesis and characterization of perovskite-type Ba2SbMO6 (M = In, Y, Nd) oxides. Mater. Lett. 1998, 37, 276–280. [Google Scholar] [CrossRef]
- Macquart, R.B.; Kennedy, B.J. Synthesis and Structural Studies of the A-Site Substituted Bismuth Double Perovskites, Ba2-xSrxLuBiO6. Chem. Mater. 2005, 1905–1909. [Google Scholar] [CrossRef]
- Lopez, C.A.; Curiale, J.; Viola, M.D.C.; Pedregosa, J.C.; Sanchez, R.D. Magnetic behavior of Ca2NiWO6 double perovskite. Physica B 2007, 398, 256–258. [Google Scholar] [CrossRef]
- Khalyavin, D.D.; Han, J.P.; Senos, A.M.R.; Mantas, P.Q. Synthesis and dielectric properties of tungsten-based complex perovskites. J. Mater. Res. 2003, 18, 2600–2607. [Google Scholar] [CrossRef]
- Tablero, C. Optical absorption analysis of quaternary molybdate- and tungstate-ordered double perovskites. J. Alloys Compd. 2015, 639, 203–209. [Google Scholar] [CrossRef]
- Bugaris, D.E.; Hodges, J.P.; Huq, A.; zur Loye, H.-C. Crystal growth, structures, and optical properties of the cubic double perovskites Ba2MgWO6 and Ba2ZnWO6. J. Solid State Chem. 2011, 184, 2293–2298. [Google Scholar] [CrossRef]
- Blasse, G.; Corsmit, A.F.; Pas, M.v.d. On the WO6 luminescence in ordered perovskites. Springer US 1973, 612–615. [Google Scholar]
- Dabre, K.V.; Park, K.; Dhoble, S.J. Synthesis and photoluminescence properties of microcrystalline Sr2ZnWO6:RE3+ (RE = Eu, Dy, Sm and Pr) phosphors. J. Alloys Compd. 2014, 617, 129–134. [Google Scholar] [CrossRef]
- Yu, R.; Mi Noh, H.; Kee Moon, B.; Chun Choi, B.; Hyun Jeong, J.; Sueb Lee, H.; Jang, K.; Soo Yi, S. Photoluminescence characteristics of Sm3+-doped Ba2CaWO6 as new orange–red emitting phosphors. J. Lumin. 2014, 152, 133–137. [Google Scholar] [CrossRef]
- Yang, Y.; Wang, L.; Huang, P.; Shi, Q.; Tian, Y.; Cui, C.e. Luminescence properties, local symmetry and Judd–Ofelt analysis of a Sr2CaWO6:Eu3+, Na+ red phosphor. Polyhedron 2017, 129, 65–70. [Google Scholar] [CrossRef]
- Wang, L.; Moon, B.K.; Park, S.H.; Kim, J.H.; Shi, J.; Kim, K.H.; Jeong, J.H. Photoluminescence properties, crystal structure and electronic structure of a Sr2CaWO6:Sm3+ red phosphor. RSC Adv. 2015, 5, 89290–89298. [Google Scholar] [CrossRef]
- Yu, R.; Shin, D.S.; Jang, K.; Guo, Y.; Noh, H.M.; Moon, B.K.; Choi, B.C.; Jeong, J.H.; Yi, S.S. Luminescence and thermal-quenching properties of Dy3+-doped Ba2CaWO6 phosphors. Spectrochim. Acta Part A 2014, 125, 458–462. [Google Scholar] [CrossRef] [PubMed]
- Qiang, S. Influence of environment on the luminescence of rare earths. J. Lumin. 1988, 41, 113–114. [Google Scholar] [CrossRef]
- Huang, C.H.; Liu, W.R.; Chen, T.M. Single-phased white-light phosphors Ca9Gd(PO4)7:Eu2+,Mn2+ under near-ultraviolet excitation. J. Phys. Chem. C 2010, 114, 18698–18701. [Google Scholar] [CrossRef]
- Zheng, J.; Cheng, Q.; Wu, J.; Cui, X.; Chen, R.; Chen, W.; Chen, C. A novel single-phase white phosphor NaBaBO3:Dy3+,K+ for near-UV white light-emitting diodes. Mater. Res. Bull. 2016, 73, 38–47. [Google Scholar] [CrossRef]
- Seo, Y.W.; Park, S.H.; Chang, S.H.; Jeong, J.H.; Kim, K.H.; Bae, J.S. Tunable single-phased white-emitting Sr3Y(PO4)3:Dy3+ phosphors for near-ultraviolet white light-emitting diodes. Ceram. Int. 2017, 43, 8497–8501. [Google Scholar] [CrossRef]
- Hou, Z.; Yang, P.; Li, C.; Wang, L.; Lian, H.; Quan, Z.; Lin, J. Preparation and luminescence properties of YVO4:Ln and Y(V, P)O4:Ln (Ln = Eu3+, Sm3+, Dy3+) nanofibers and microbelts by sol−gel/electrospinning process. Chem. Mater. 2008, 20, 6686–6696. [Google Scholar] [CrossRef]
- Yang, T.; Sun, X.; Jiang, P.; Gao, W.; Zhou, X.; Cong, R. Ambient-pressure stabilization of β-GdB3O6 by doping Bi3+ and color-tunable emissions by co-doping Tb3+ and Eu3+: the first photoluminescence study on the high-pressure polymorph. Chem. Asian J. 2017, 12, 1353–1363. [Google Scholar]
- Mohan, P.R.; Vidyadharan, V.; Sreeja, E.; Joseph, C.; Unnikrishnan, N.V.; Biju, P.R. Judd–Ofelt analysis, structural and spectroscopic properties of sol–gel derived LaNbO4:Dy3+ phosphors. J. Mater. Sci. Mater. Electron. 2017, 28, 1–12. [Google Scholar]
- Liu, C.; Zhou, W.; Shi, R.; Lin, L.T.; Zhou, R.F.; Chen, J.; Li, Z.; Liang, H. Host-sensitized luminescence of Dy3+ in LuNbO4 under ultraviolet light and low-voltage electron beam excitation: Energy transfer and white emission. J. Mater. Chem. C 2017, 5, 9012–9020. [Google Scholar] [CrossRef]
- Shannon, R.D. Revised effective ionic radii and systematic studies of interatomic distances in halides and chalcogenides. Acta Crystallogr. 2015, 32, 751–767. [Google Scholar] [CrossRef]
- Wood, D.L.; Tauc, J. Weak absorption tails in amorphous semiconductors. Phys. Rev. B 1972, 5, 3144–3151. [Google Scholar] [CrossRef]
- Song, X.; Wang, X.; Xu, X.; Liu, X.; Ge, X.; Meng, F. Crystal structure and magnetic-dipole emissions of Sr2CaWO6:RE3+ (RE = Dy, Sm and Eu) phosphors. J. Alloys Compd. 2018, 739, 660–668. [Google Scholar] [CrossRef]
- Blasse, G.; Bril, A. Hypersensitivity of the 5D0—7F2 transition of trivalent Europium in the garnet structure. J. Chem. Phys. 1967, 47, 5442–5443. [Google Scholar] [CrossRef]
- Yu, M.; Lin, J.; Wang, Z.; Fu, J.; Wang, S.; Zhang, H.J.; Han, Y.C. Fabrication, patterning, and optical properties of nanocrystalline YVO4: A (A = Eu3+, Dy3+, Sm3+, Er3+) phosphor films via sol−gel soft lithography. Chem. Mater. 2002, 14, 2224–2231. [Google Scholar] [CrossRef]
- Li, X.; Li, G.; Sun, M.; Liu, H.; Yang, Z.; Guo, Q.; Fu, G. Luminescent properties of Dy3+ doped SrMoO4 phosphor. J. Lumin. 2011, 131, 1022–1025. [Google Scholar] [CrossRef]
- Qiang, S.; Pei, Z.; Chi, L.; Zhang, H.; Zhang, Z.; Feng, Z. The yellow-to-blue intensity ratio (Y/B) of Dy3+ emission. J. Alloys Compd. 1993, 192, 25–27. [Google Scholar]
- Du, J.; Xu, D.; Gao, X.; Li, J.; Yang, Z.; Li, X.; Sun, J. Synthesis and photoluminescence properties of a novel white-light-emitting Dy3+-activated Sr3Sc(PO4)3 phosphor. J. Mater. Sci. Mater. Electron. 2017, 29, 1–9. [Google Scholar] [CrossRef]
- Van Uitert, L.G.; Johnson, L.F. Energy transfer between rare-earth ions. J. Chem. Phys. 1966, 44, 3514–3522. [Google Scholar] [CrossRef]
- Blasse, G. Energy transfer in oxidic phosphors. Phys. Lett. A 1968, 28, 444–445. [Google Scholar] [CrossRef]
- Dexter, D.L.; Schulman, J.H. Theory of concentration quenching in inorganic phosphors. J. Chem. Phys. (USA) 1954, 22, 1063–1070. [Google Scholar] [CrossRef]
- Guo, H.; Devakumar, B.; Li, B.; Huang, X. Novel Na3Sc2(PO4)3:Ce3+,Tb3+ phosphors for white LEDs: Tunable blue-green color emission, high quantum efficiency and excellent thermal stability. Dyes Pigm. 2017, 151, 81–88. [Google Scholar] [CrossRef]
- Deng, D.; Yu, H.; Li, Y.; Hua, Y.; Jia, G.; Zhao, S.; Wang, H.; Huang, L.; Li, Y.; Li, C. Ca4(PO4)2O:Eu2+ red-emitting phosphor for solid-state lighting: structure, luminescent properties and white light emitting diode application. J. Mater. Chem. C 2013, 1, 3194–3199. [Google Scholar] [CrossRef]
- Ozawa, L.; Jaffe, P.M. The mechanism of the emission color shift with activator concentration in Eu3+ activated phosphors. J. Electrochem. Soc. 1971, 118, 1678–1679. [Google Scholar] [CrossRef]


© 2019 by the authors. Licensee MDPI, Basel, Switzerland. This article is an open access article distributed under the terms and conditions of the Creative Commons Attribution (CC BY) license (http://creativecommons.org/licenses/by/4.0/).