Article

Atomic-Approach to Predict the Energetically Favored Composition Region and to Characterize the Short-, Medium-, and Extended-Range Structures of the Ti-Nb-Al Ternary Metallic Glasses

1
Key Laboratory of Advanced Materials (MOE), School of Materials science and Engineering, Tsinghua University, Beijing 100084, China
2
Ames Laboratory, US Department of Energy, Ames, IA 50011, USA
*
Author to whom correspondence should be addressed.
Materials 2019, 12(3), 432; https://doi.org/10.3390/ma12030432
Submission received: 25 December 2018 / Revised: 24 January 2019 / Accepted: 28 January 2019 / Published: 31 January 2019
(This article belongs to the Special Issue Multi-scale Modeling of Materials and Structures)

Abstract

:
Ab initio calculations were conducted to assist the construction of the n-body potential of the Ti-Nb-Al ternary metal system. Applying the constructed Ti-Nb-Al interatomic potential, molecular dynamics and Monte Carlo simulations were performed to predict a quadrilateral composition region, within which metallic glass was energetically favored to be formed. In addition, the amorphous driving force of those predicted possible glassy alloys was derived and an optimized composition around Ti15Nb45Al40 was pinpointed, implying that this alloy was easier to be obtained. The atomic structure of Ti-Nb-Al metallic glasses was identified by short-, medium-, and extended-range analysis/calculations, and their hierarchical structures were responsible to the formation ability and unique properties in many aspects.

Graphical Abstract

1. Introduction

Al-based metallic glasses were discovered around 1960, and they have plenty of potential applications owing to their unique properties, i.e., high corrosion resistance and excellent wear resistance, high strength, and superior hardness [1,2,3]. Moreover, the high-strength, but abnormally low-density, properties of Al-based amorphous alloys are of great significance for solving the energy-saving problems nowadays [4,5]. Al-based metallic glasses were first prepared in the Al-Si-TM (TM = Fe, Co, Ni, Cu) system [6,7]. The tensile strength of Al-Ln-TM amorphous alloys could be higher than 980 MPa [8], with the highest value of >1500 MPa in Al-Y-Ni-Co-Sc metallic glass [9]. Then the Vickers hardness and tensile fracture strength of Al87Y8Ni5 metallic glass could reach 300 DPN and 1140 MPa, respectively [8,10,11]. The recently discovered Ti-based metallic glass Ti40Zr25Ni3Cu12Be20 had superior plasticity and strength when deformed at a cryogenic temperature [12]. For Nb-based amorphous alloys, Nb-Si-X (X = V, Zr, Mo, Ta, W, C, B, and Ge) alloys have demonstrated a large amorphous-forming range, superconductivity, and remarkable mechanical properties [13]. Therefore, these experimental findings inspired the Ti-Nb-Al system to be selected for investigation.
In practice, researchers frequently use some technical parameters to describe the glass-formation ability (GFA) of an alloy or to compare the GFAs of two alloys. However, the GFA of a metal system may vary while using different glass-producing techniques. Thus, many long-standing criteria for predicting the glass-forming ability (GFA) of alloys have been put forward [14,15,16], which are independent of the glass-producing techniques and facilitate the comparison of GFAs of different alloys, such as the reduced glass transition temperature Trg (= Tg/Tm) [14], the supercooled liquid region ΔTxg (= TxTg) [15], and the new parameter γ = Tx/(Tg + Tm) [16], where Tg, Tx and Tm are the glass transition temperature, onset crystallization temperature, and melting temperature, respectively. However, these criteria are still empirical or semi-empirical regulations, sometimes limited in predicting the GFA of metallic glasses and failing to provide valuable guidance for the composition design and preparation of metallic glasses [17,18]. Hence the development of glassy alloys urgently requires exploration of more effective theoretical methods to predict the GFA and glass-formation range/region (GFR). Long-standing research has shown that metallic glass formation is an intrinsic property of the alloy system, and the interactions between atoms determine the physicochemical properties [19]. Therefore, it is possible to predict GFAs of glassy alloys from atomic-scale, drawing supports from molecular dynamics (MD) and Monte Carlo (MC) simulations by constructing the inter-atomic interaction potential [20].
Apart from the formation mechanism of metallic glass, the atomic structure of metallic glass is also one of the most challenging fundamental problems in this field. It is necessary to mention that different atomistic simulation procedures, such as liquid melt quenching (LMQ) and solid-state amorphization (SSA), yield similar atomic structures [21]. The physical description and modeling of the atomic structure will help in essentially revealing the structural origin of metallic glass formation and properties [22,23]. Owing to the close packing in space and energy minimization, the atomic packing mode possesses short-range order (SRO) and medium-range order (MRO), but expresses long-range disorder. On the SRO scale, we mainly analyzed the local neighboring clusters around atoms [24,25,26,27,28,29,30,31]. It has been authenticated by experimental studies that icosahedral or icosahedral-like clusters are the basic building component in metallic glasses. The interconnection of local clusters further form MRO [32,33,34,35,36,37,38]. The characteristics of MRO shed new light on understanding of the mechanical properties and stability of monolithic metallic glasses. Sheng et al. proposed the quasi-cluster packing model [33], in which clusters establish an interpenetrated network through the vertex, edge, face, and volume linkages [33,35,39], and show icosahedral-like packing on the MRO scale. Compared with other types of linking modes, the icosahedral network is structurally more stable and more energy efficient. Ichitsubo et al. [40] observed the existence of so-called “hard zones” and “soft zones” in Pd-Ni-Cu-P metallic glass. The heterogeneity of structure and properties in metallic glass can be traced back to the heterogeneous connectivity among different cluster-types [41,42,43,44]. The interpenetrating linkages of icosahedra-like and icosahedra exhibit strong correlation in space and tend to aggregate and form an even higher hierarchical level, i.e., structural skeleton. Therefore, clarifying the multi-hierarchical structural characteristics is vital to further demonstrate the structure-property relationship in metallic glass.

2. Construction of Ti-Nb-Al Interatomic Potential

A long-range empirical potential [45,46,47] was constructed for the Ti-Nb-Al system. The total energy Ei of atom i can be computed by:
E i = 1 2 j i V ( r i j ) j i Φ ( r i j )
Here rij is a distance between atoms i and j, and the two terms, V(rij) and Φ(rij) of Equation (1), are the pair part and the electron density term, respectively. They can be expressed as:
V ( r i j ) = ( r c 1 r i j ) m ( c 0 + c 1 r i j + c 2 r i j 2 + c 3 r i j 3 + c 4 r i j 4 ) , 0 < r i j r c 1
Φ ( r i j ) = α 2 ( r c 2 r i j ) n , 0 < r i j r c 2
Here, rc1 and rc2 are designed for the pair part and electron density term, respectively. m and n are integers adjusted according to the specific metals, and α and ci (i = 0,1,2,3,4) are the potential parameters to be determined through the fitting process.
In this work, we used a MATLAB code developed by the researcher’s group for the fitting of the potential parameters. The Ti-Nb-Al system includes six sets of potential parameters for Ti-Ti, Nb-Nb, Al-Al, Ti-Nb, Ti-Al, and Nb-Al, of which the Nb-Nb, Al-Al, and Nb-Al cross-potential parameters have been previously fitted by the author [48]. The physical properties (the lattice constants, elastic modulus, elastic constants, and cohesive energies) of hcp-Ti metal were obtained from the relevant literature [49], while the physical properties of the metastable bcc- and fcc-Ti were calculated by ab initio, their physical properties then applied to fit potential parameters. When fitting the cross-potential parameters of Ti-Nb and Ti-Al, several intermetallic compounds with different structures and alloy compositions were selected to cover as wide a composition range as possible in the binary alloy phase diagrams. Ab initio calculations based on density functional theory (DFT) aided the construction of n-body potential, which was conducted using CASTEP in Material Studio [50,51,52] in order to ensure that the calculation met the energy convergence and the accuracy requirements. In the calculation process, the exchange correlation functional was constructed based on the generalized gradient approximation of Perdew and Wang (PW91) [52]. The Brillouin zones of different structures employed the same k-points grid separation of 0.02 Å−1. The cutoff energy of the plane wave was 700 eV.
Table 1 lists the potential parameters of Ti-Nb-Al ternary alloys. To verify whether the potential parameters obtained in this work were reasonable, Table 2, Table 3 and Table 4 show the physical properties derived from n-body potential. They all matched well with the experimental or ab initio calculated values, indicating that the constructed potential could reasonably describe the static physical properties of intermetallics.
We further examined whether the potential was consistent with the atomic interactions in a non-equilibrium state, i.e., comparing the equation of state (EOS) derived from the constructed potential with the Rose Equation [53]. As shown in Figure 1, the EOS curve was basically consistent with the ROSE curve, especially near the equilibrium position a = a0. Hence, it could be further applied to MD simulations to explore the scientific issues even farther away from the equilibrium state, i.e., the glass formation mechanism and its atomic-scale structure.

3. Metallic Glass Formation of Ti-Nb-Al System

3.1. Atomic Simulation Methods

The preparation of metallic glass is always far away from the equilibrium state, and the dynamic conditions are very strict and harsh. Therefore, the rearrangement and diffusion of atoms in the alloy are greatly hindered, leading to the difficulty of nucleation and growth of those intermetallics with complex structures. At this point, the competing phase against amorphous is the solid solution with a simple structure, such as the hcp, bcc, and fcc structure [54]. Consequently, the problem of predicting the GFR of a Ti-Nb-Al alloy system could be converted into one of comparing the relative stability of the solid solution phase with the metallic glass within the full composition triangle. It would then be possible to determine the composition region in which the metallic glass presented as stable.
From a physics perspective, based on the constructed atomic interaction potentials, at least 231 initial solid solution models were established within the entire composition triangle of the TixNbyAl1−x−y system, given the composition interval of x, y = 5 at.%. It is possible to predict the GFR of the alloy system with the help of Large-scale Atomic/Molecular Massively Parallel Simulator (LAMMPS) packages [55,56]. For the Ti-Nb-Al ternary system, we achieved the target composition of the constructed model by replacing solvent atoms with solute atoms at random. When the dominant component of the alloy composition is Ti, the hcp initial solid solution model is constructed. Similarly, for the Nb-based and Al-based alloys, we applied the bcc and fcc initial solid solution models, respectively. For the hcp model, the (100), (120) and (001) crystalline directions are designed to be parallel to the x-, y- and z-axes. Whereas for both bcc and fcc models, the x-, y-, and z-axes are parallel to three crystalline orientations (100), (010), and (001), respectively. Periodic boundary conditions were applied to the x-, y-, and z-coordinate directions. Considering the simulation time on the atomic scale, the size of the simulated cells was set to consist of 4000 (10 × 10 × 10 × 4) atoms, 3456 (12 × 12 × 12 × 2) atoms, and 6912 (12 × 12 × 12 × 4) atoms for the hcp, bcc, and fcc solid solution models, respectively. MD and MC simulations were adopted in this work. For MD simulations, the isothermal-isobaric (NPT) ensemble with a time step of 5 femtoseconds was selected [57], and the simulation temperature and pressure were designed by the Nose–Hoover thermostat and barostat to be 300 K and 0 Pa, respectively [58,59]. Moreover, the simulation process ran for 1 × 10⁶ MD time steps to reach a stable state. MC simulations were proceeded for thousands of steps at 300 K, 0 Pa under NPT ensemble to fully relax the initial solid solution model. Atom displacement and box deformation are the two types of “moves” during MC simulations. From a thermodynamics viewpoint, the energy difference between the amorphous phase and the real solid solution, is the driving force for the solid solution to amorphize.
The structural transition from crystal to amorphous is monitored by the pair correlation function [60] g(r), which can clearly describe the distribution of bond lengths between atoms and the disordered trend of structures with increasing distance. Details for g(r) equation can be found in Ref. [60].
According to the Voronoi tessellation analysis [61,62,63], an envelope of a family of perpendicular bisectors between a central atom and all of its nearby atoms constitutes the surface of a Voronoi polyhedron for the central atom, which can be differentiated by the indices <n3, n4, n5, n6,…>, where ni stands for the number of i-edged faces of the Voronoi polyhedron and is the total coordination numbers (CNs). In addition, 3D atomic configurations were applied to assist in the analysis of the alloy structure. In this article, we mainly focused on analyzing and characterizing microscopic heterogeneity and multiple hierarchical structure under the optimal composition of Ti15Nb45Al40. Finally, the formation mechanism and structure of metallic glass are linked.

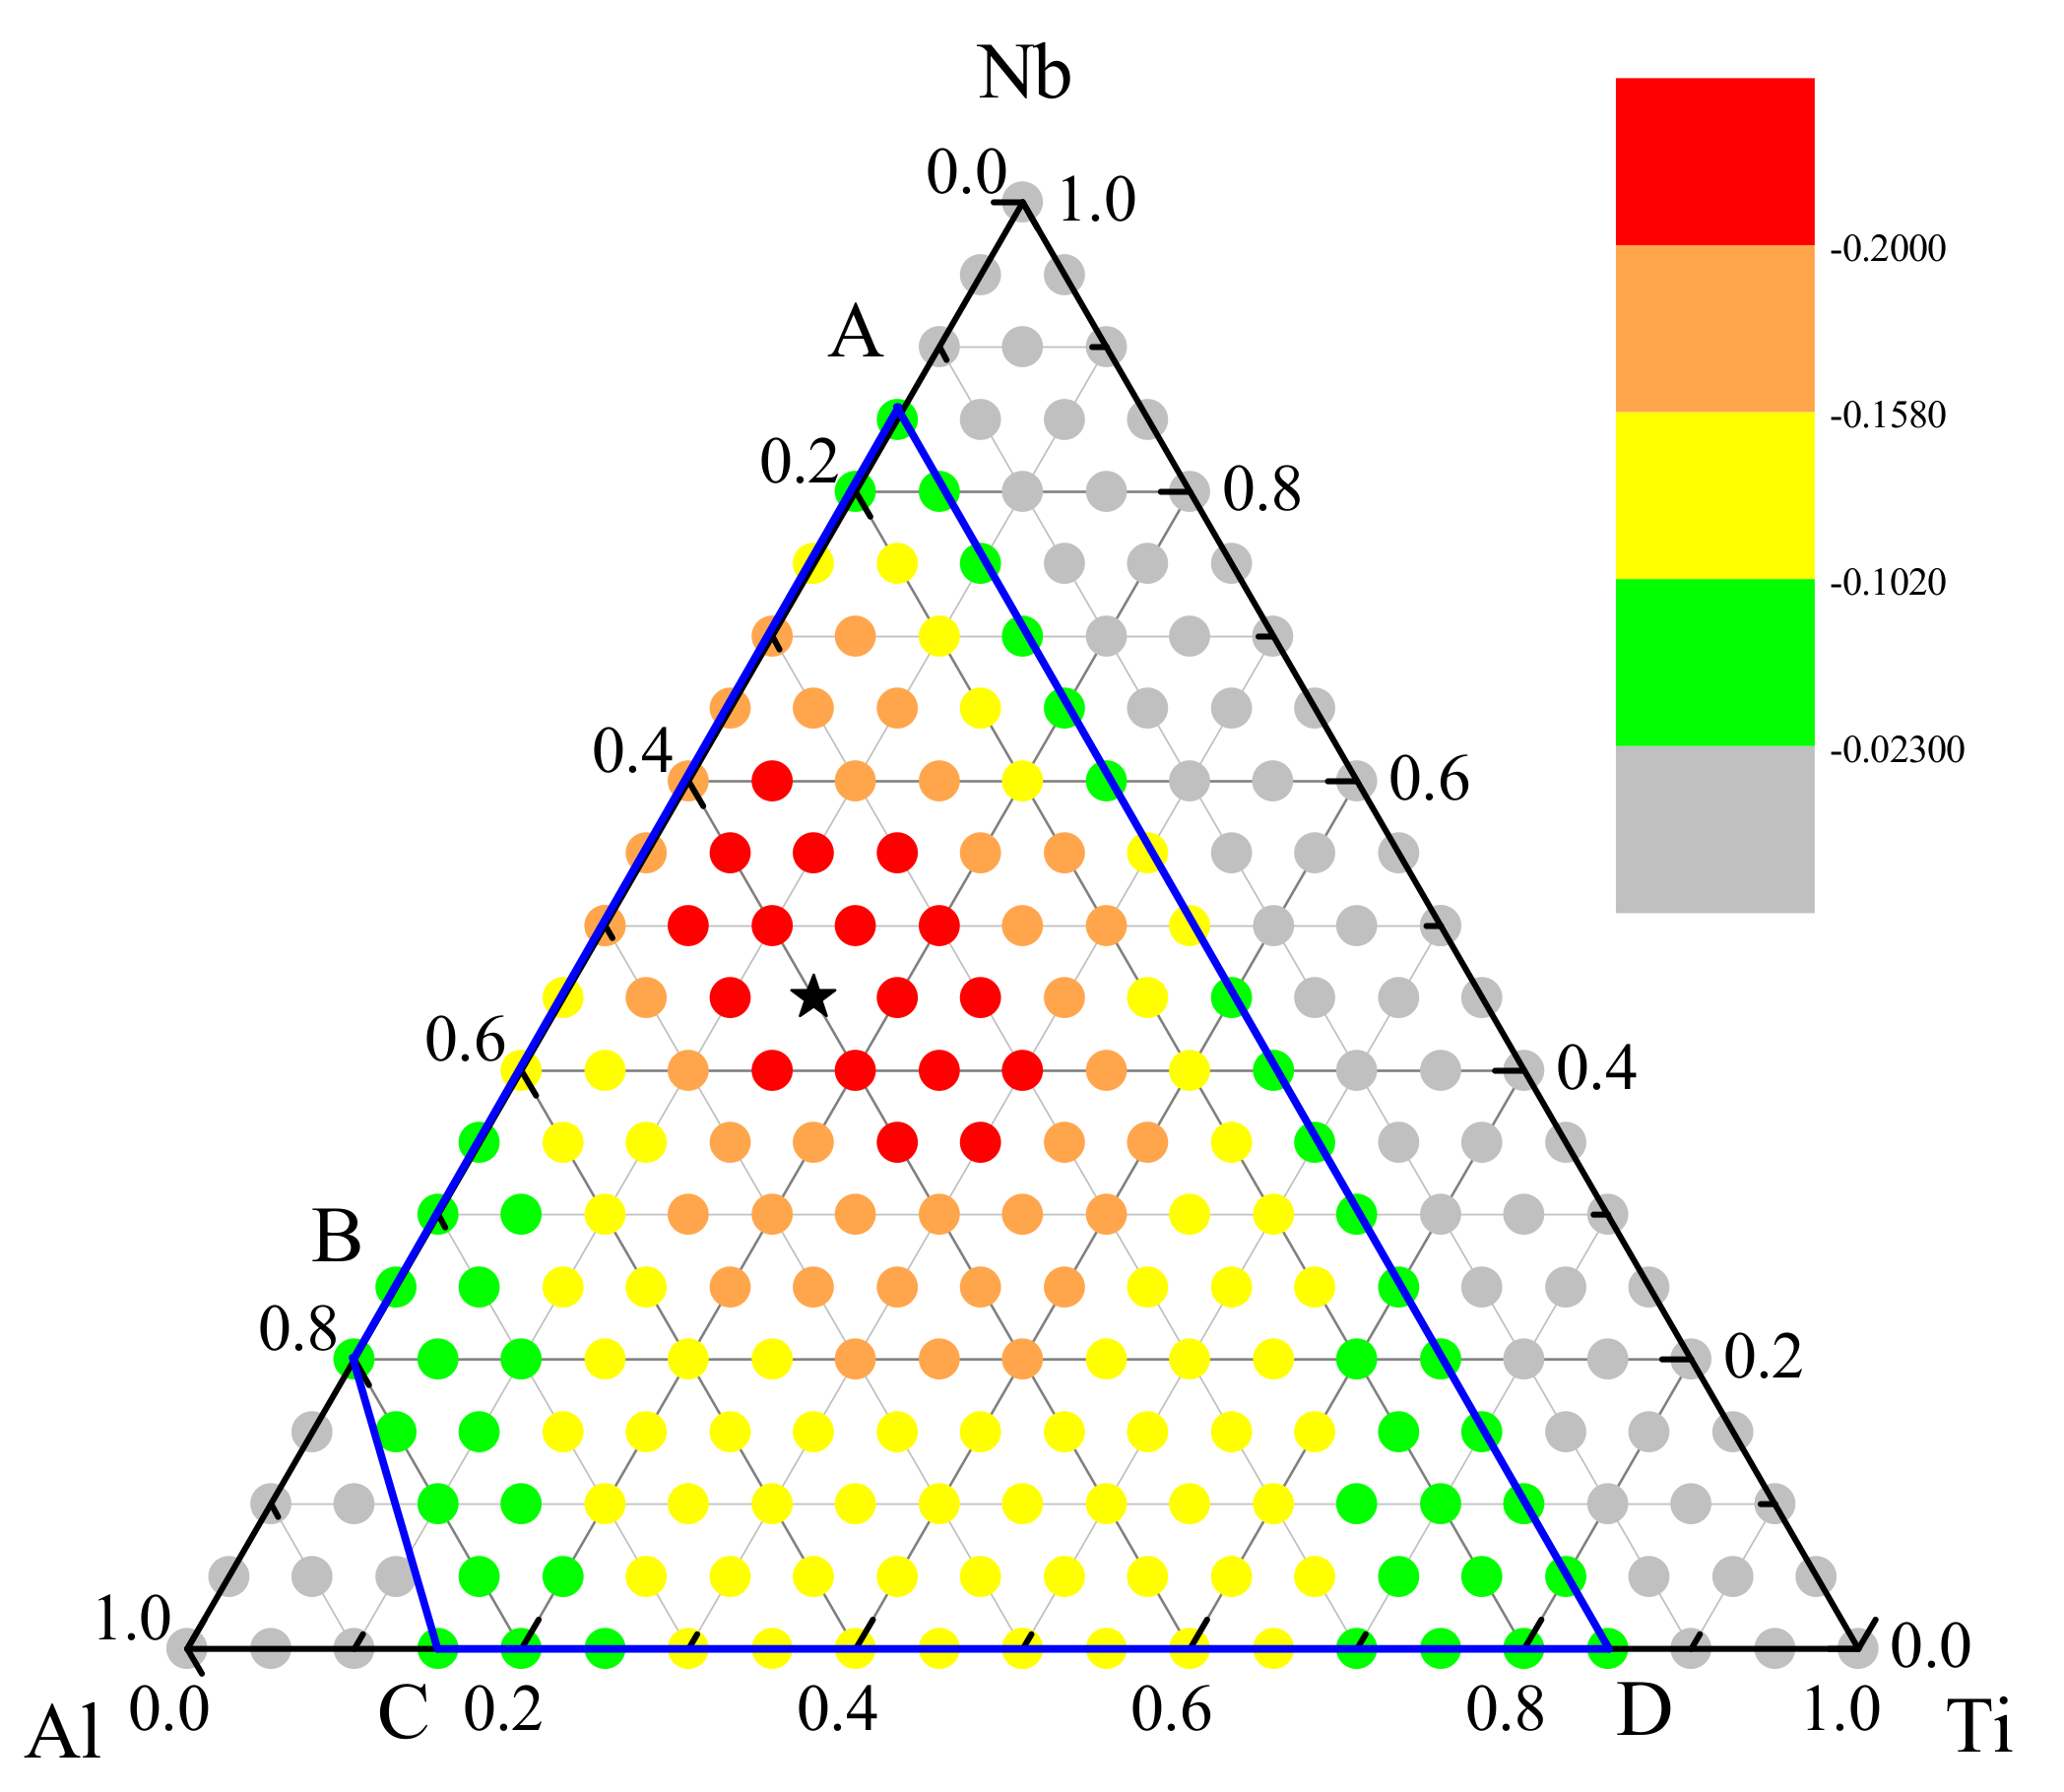
3.2. Glass Formation Region of Ti-Nb-Al System

We now discuss the structure factor g(r) and the 3D atomic position projection for two alloys in the Nb-rich corner, i.e., Ti5Nb90Al5 and Ti10Nb70Al20. Figure 2a,b illustrated that the atomic configuration of Ti5Nb90Al5 alloy was similar to that of bcc structure and remained in a crystalline state after relaxation. When the Ti content increased to 10 at.%, it could be seen from Figure 2c,d that the atomic arrangement was disordered, and the Ti10Nb70Al20 alloy underwent a crystal-to-amorphous transition, resulting in the formation of metallic glass. It revealed that the underlying physical process of the metallic glass formation was the collapse of the crystalline lattice while the solute concentrations exceeded the critical solid solubility.
Figure 3 explained the GFR of Ti-Nb-Al alloy system. The gray solid circles and hollow circles represented the alloy composition of the formed amorphous and crystal, respectively. When the alloy composition fell in the central quadrangle region surrounded by ABCD, the lattice of the solid solution rapidly collapsed, leading to the formation of metallic glass, while it was a stable crystalline region outside the ABCD quadrilateral. To check whether the predicted GFR was reliable, the composition points of Ti-Nb-Al metallic glass that were prepared experimentally were compared with the predicted range, as shown in Figure 3 with colored symbols. In the Al-Ti system, the amorphous phase was prepared by ion beam mixing (IBM) [64], and the preferred composition range was found to be at least 25–75 at.% Ti. Experimentally, Al-Ti bulk metallic glasses were prepared by liquid melt quenching (LMQ) [65]. The synthesis of amorphous powder was also attained by mechanical alloying (MA) for the composition range TixAl1−x (50 < x < 80 at.%) [66,67]. In addition, AlxNb1−x (15 < x < 75 at.%) alloys were prepared by MA of elemental crystalline powders [68]. Powders of Ti, Nb, and Al were raw materials, Ti52−xNb48Alx (x = 2, 4, 6, 8 at.%), Ti65Nb11Al24, Ti50Nb25Al25, Ti50Nb37.5Al12.5, and Ti47.6Nb28.5Al23.9 amorphous alloys were mechanically alloyed [69,70]. It could be seen from Figure 3 that the amorphous components obtained by experiments all fell within the blue quadrilateral ABCD, which proved that the GFR of Ti-Nb-Al metallic glass predicted by MD simulations was reliable and reasonable.

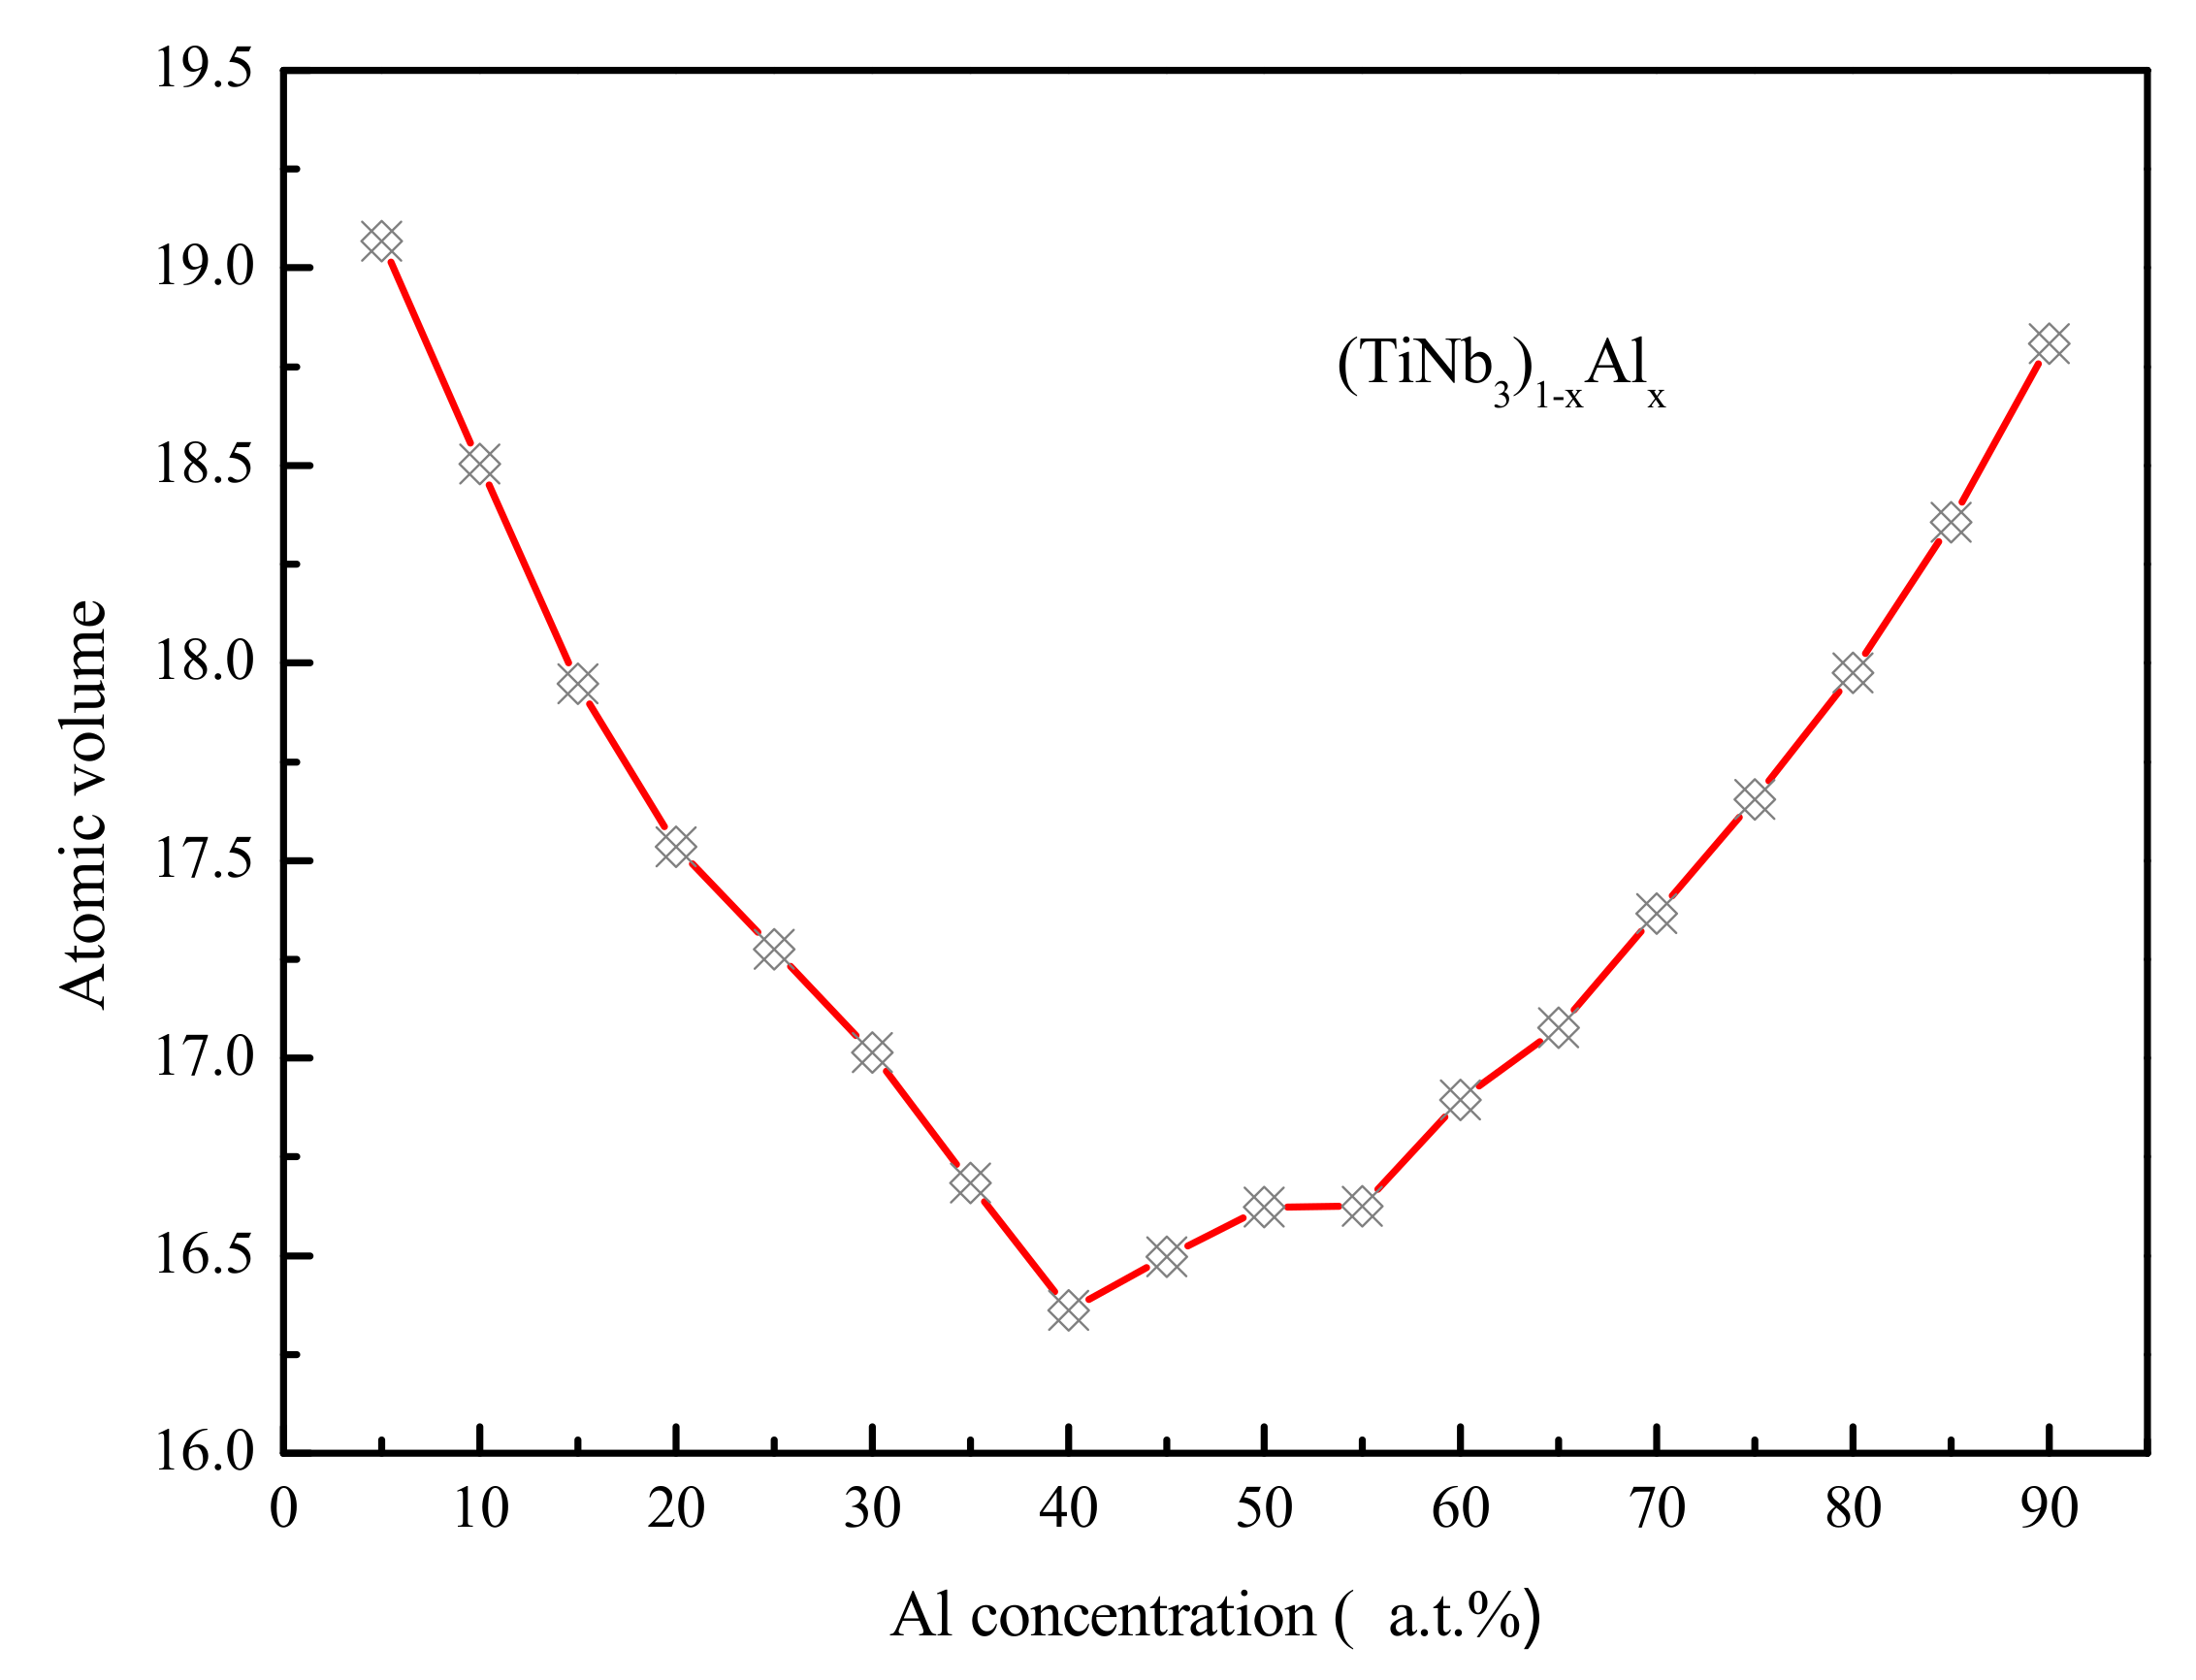
3.3. Optimization of Glass—Formation Compositions

Next, we studied the composition point of the Ti-Nb-Al system that had the largest glass-forming ability. The energy difference between solid solution and amorphous is defined as the amorphous driving force (ADF). As the energy difference increases, the ADF and corresponding GFA possessed by alloy are both larger, and the metallic glass is more and more easily to be prepared. Figure 4 showed the ADF of each composition point calculated in Ti-Nb-Al system. From the energy scale on the right side, it was known that the energy difference between the amorphous phase and the solid solution phase was negative, i.e., the metallic glass was easily formed within the predicted GFR. The composition point Ti15Nb45Al40 with the black pentagram symbol possessed the largest GFA, and metallic glass was most likely to be formed in the pentagram and its vicinity. To verify whether the GFA calculated was reasonable or not, the predictions were further compared with the experimental values marked in Figure 3. It could be seen that the composition points of the metallic glass that were experimentally prepared were basically concentrated in the optimized composition region near Ti15Nb45Al40. The simulated GFAs also agreed with the experimental data.

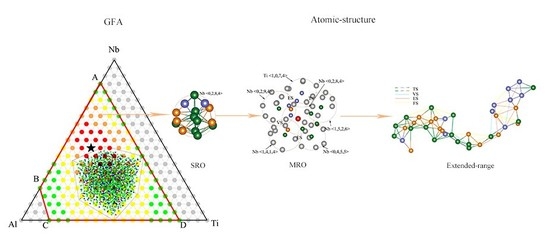
4. Atomic Structure of Ti-Nb-Al Metallic Glass

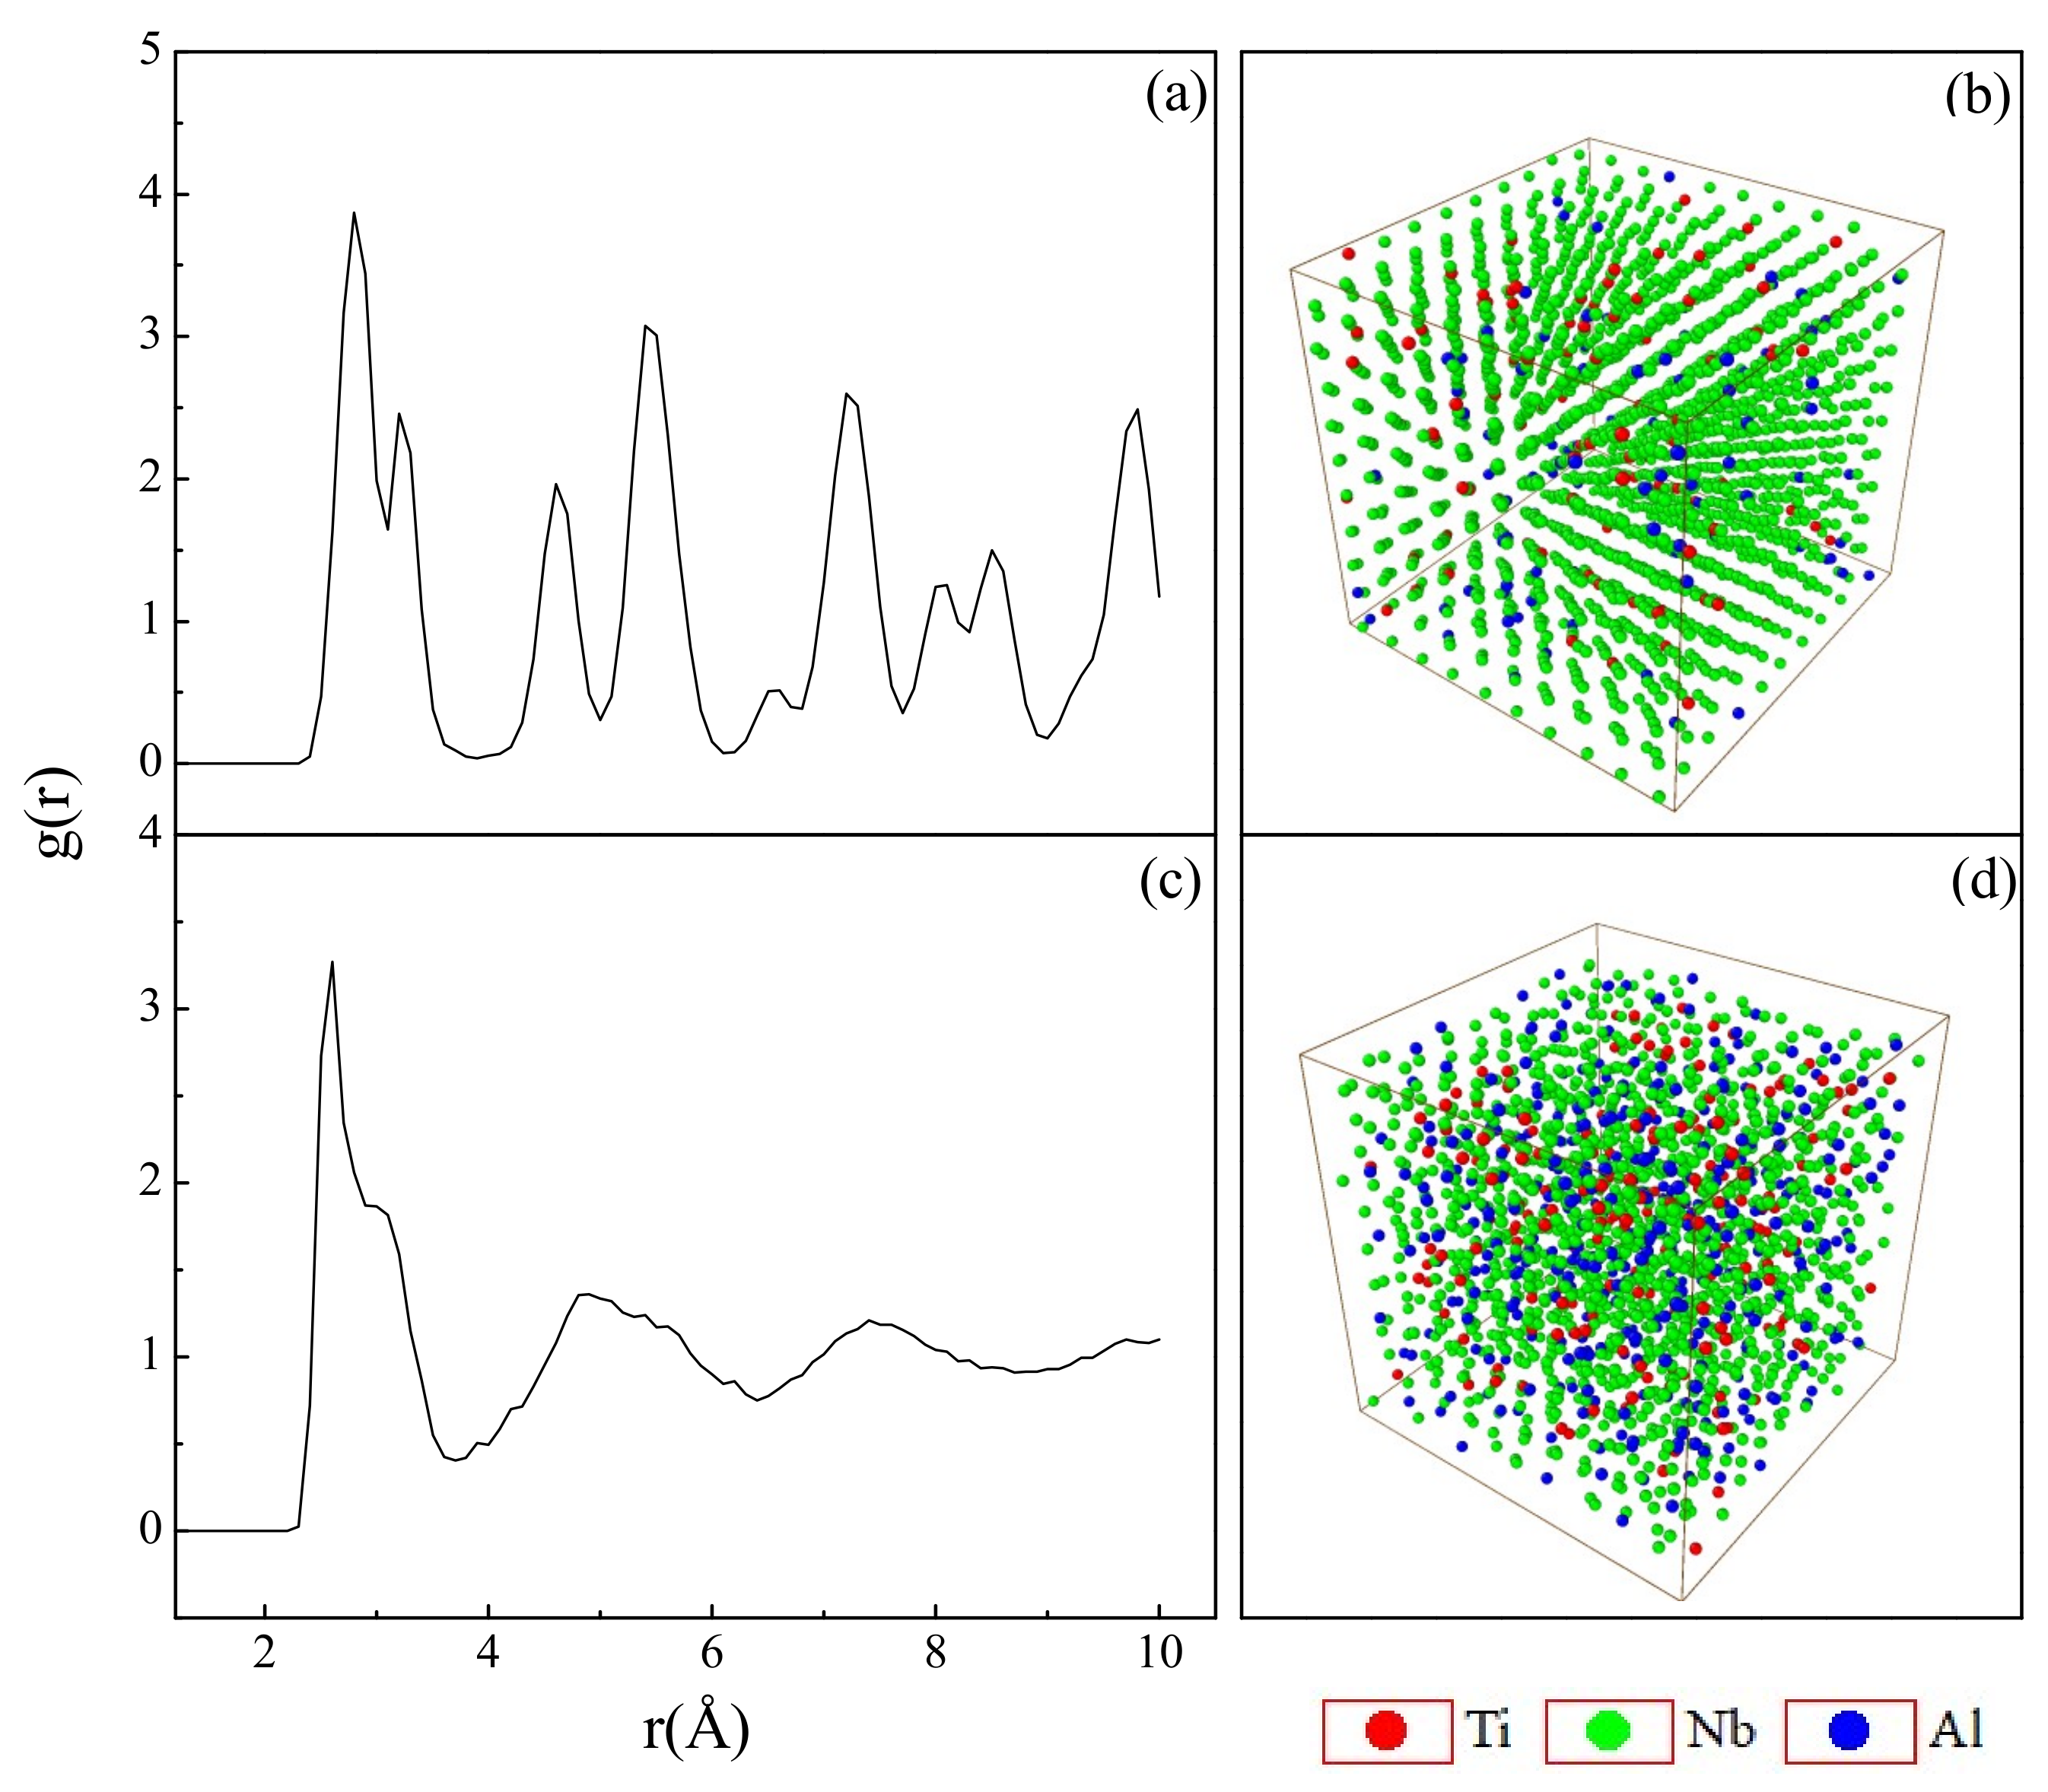
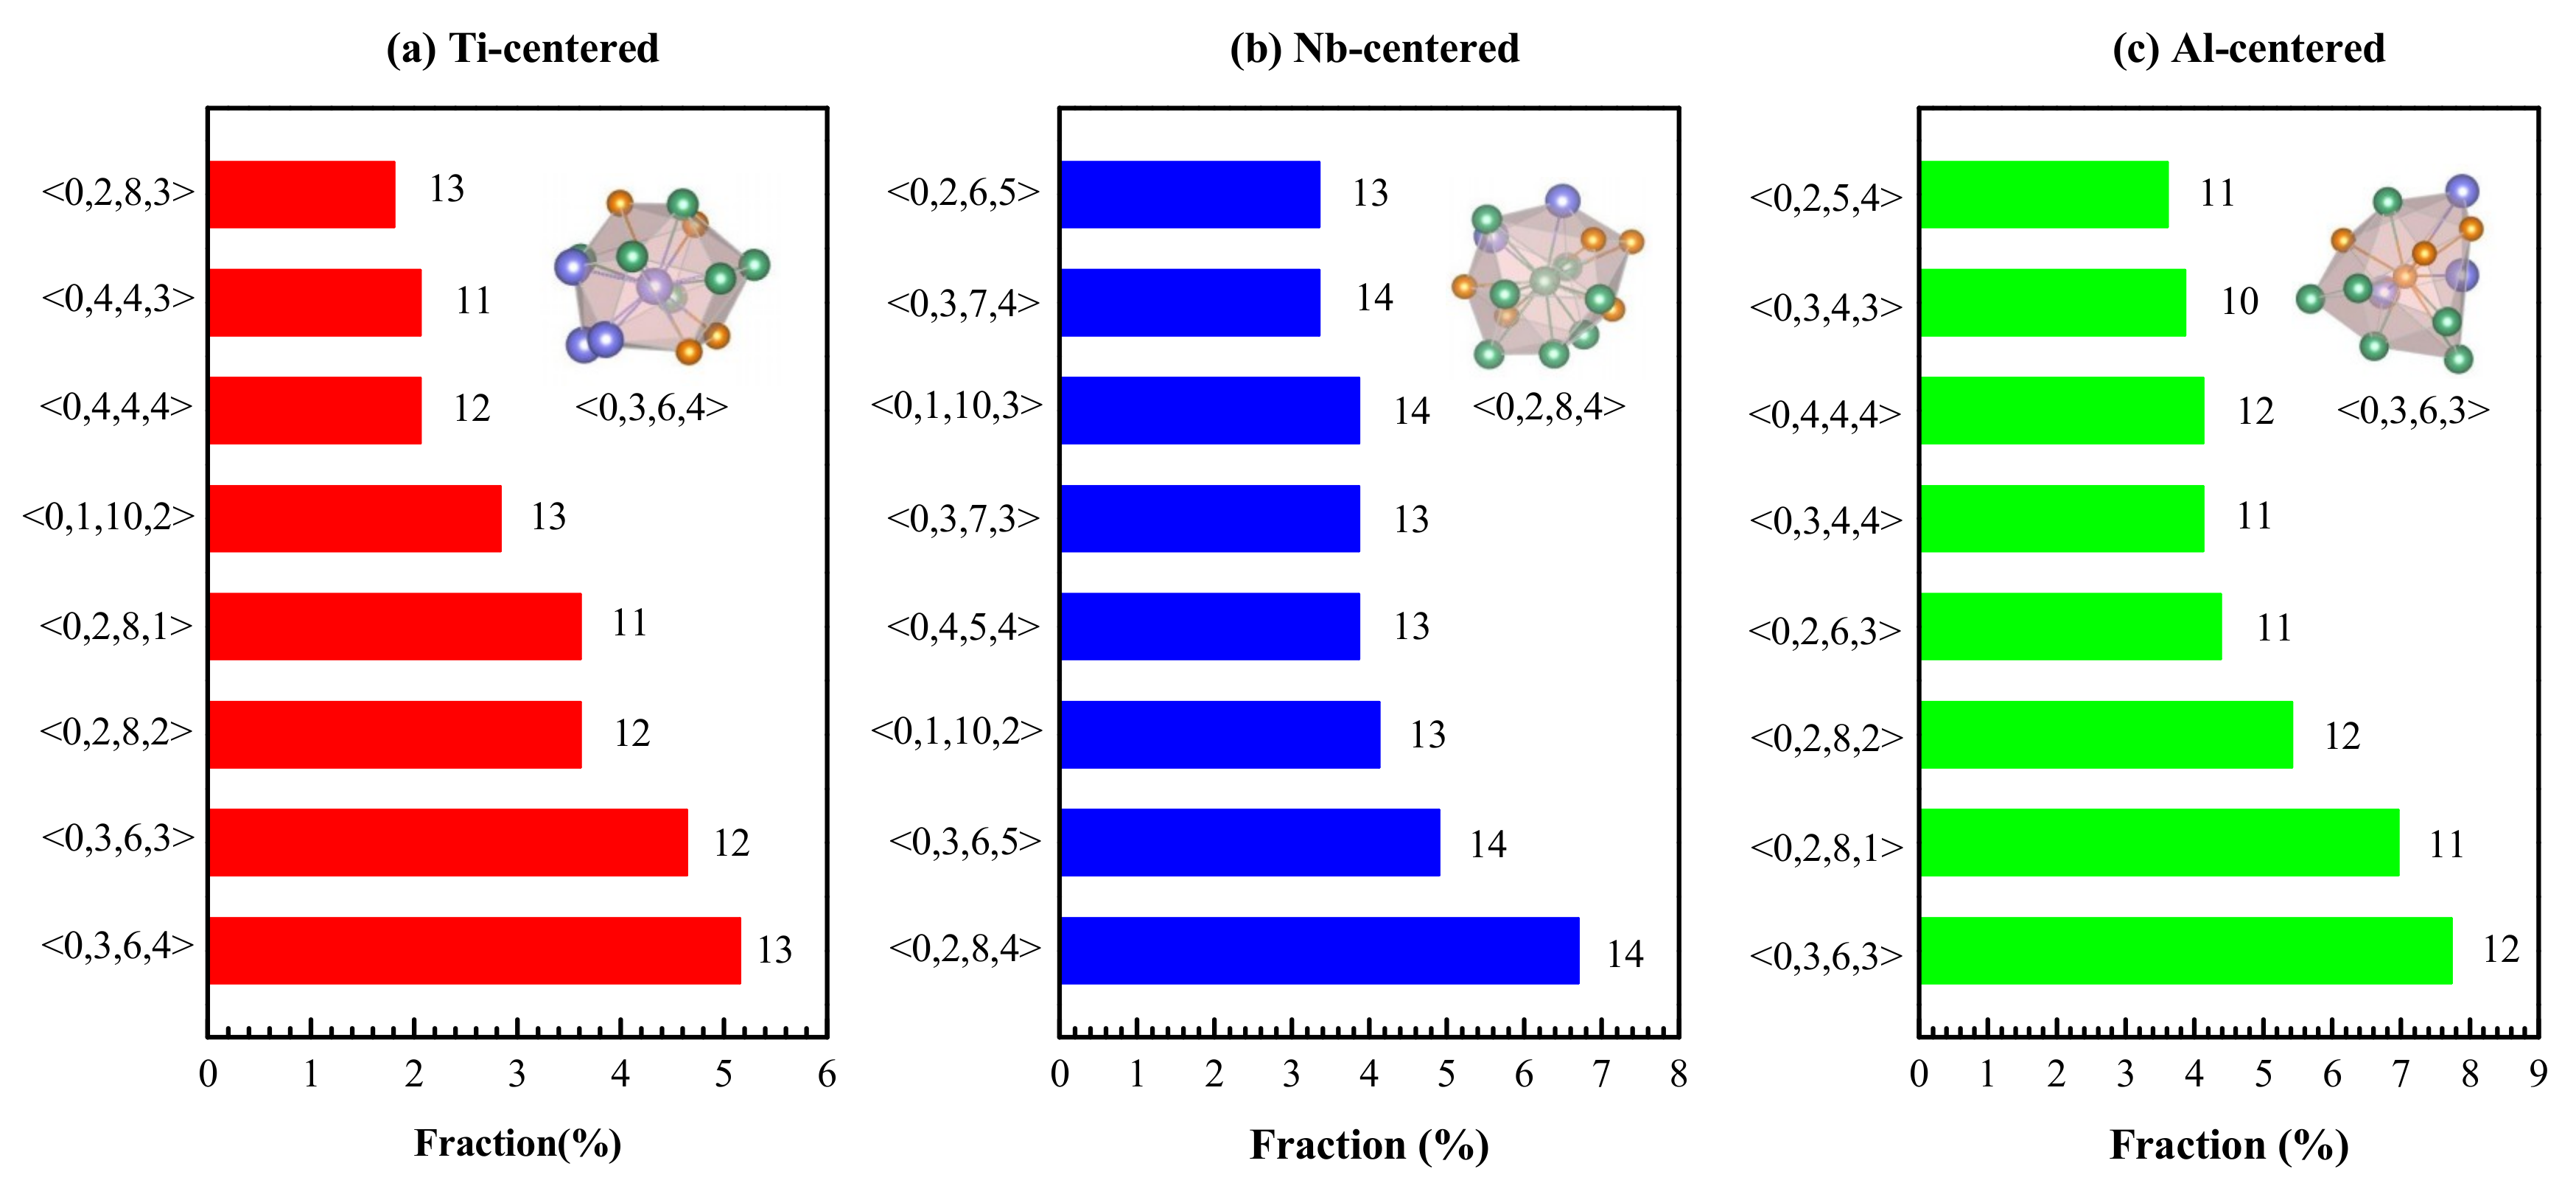
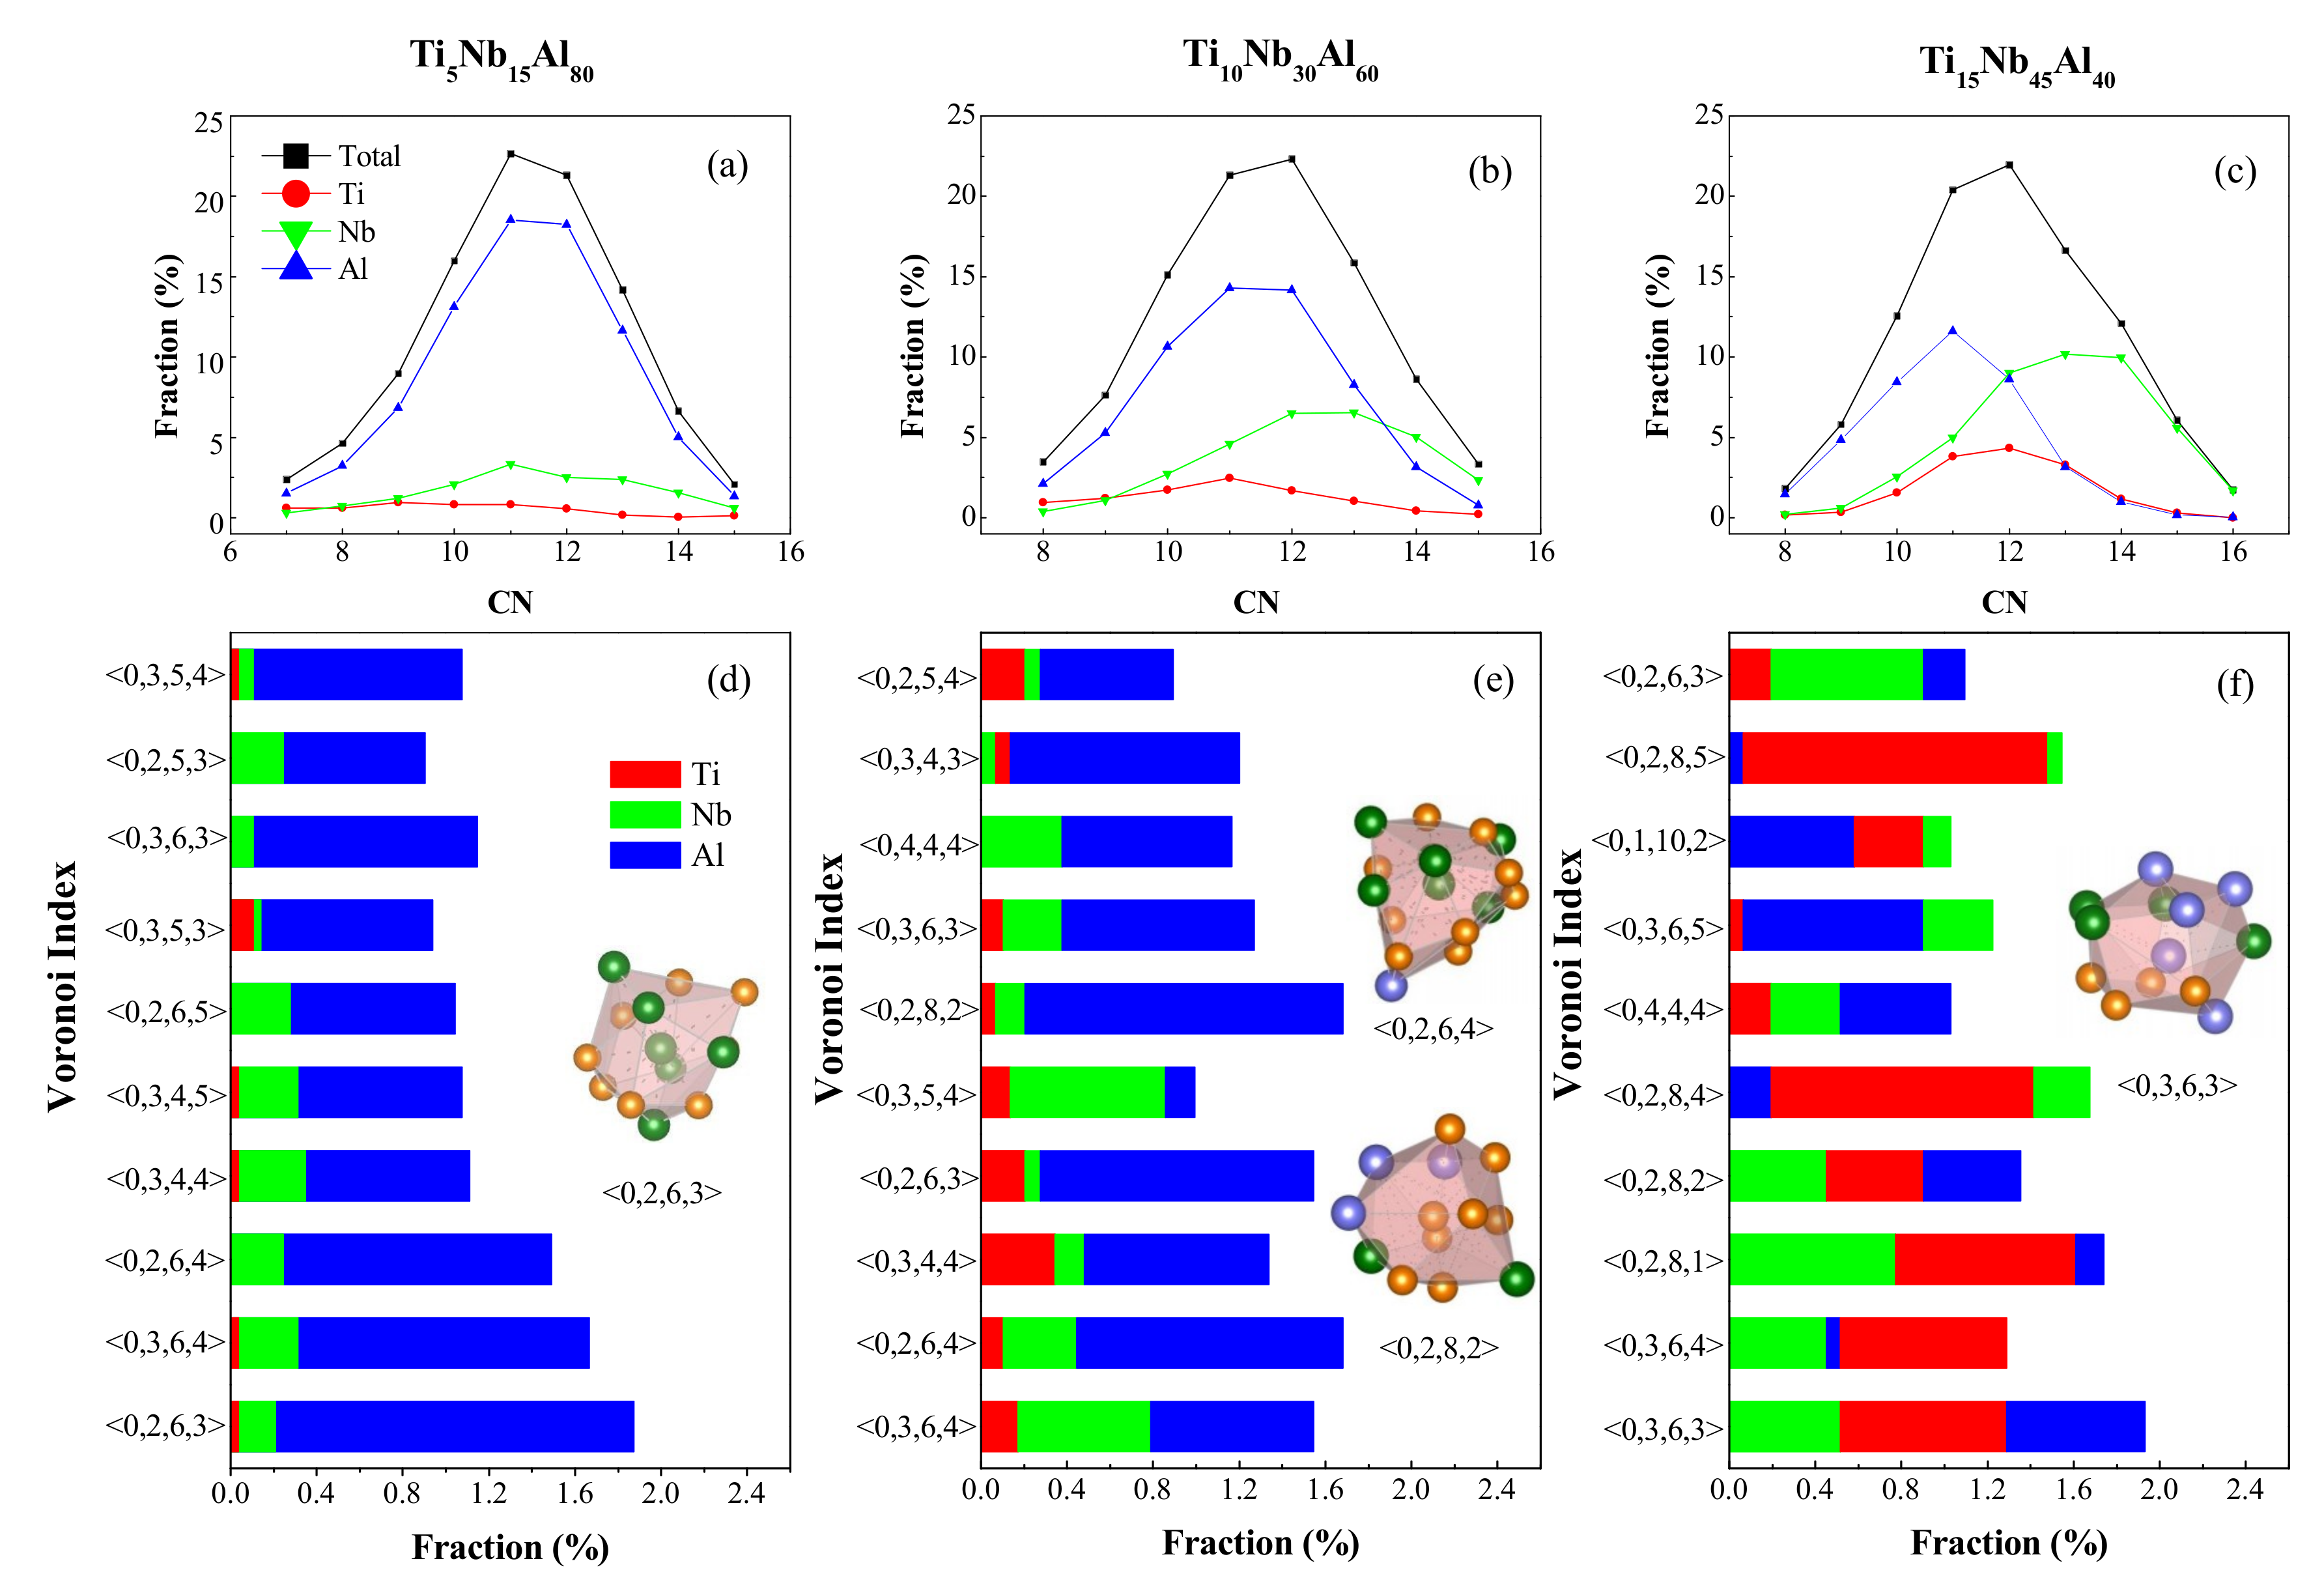
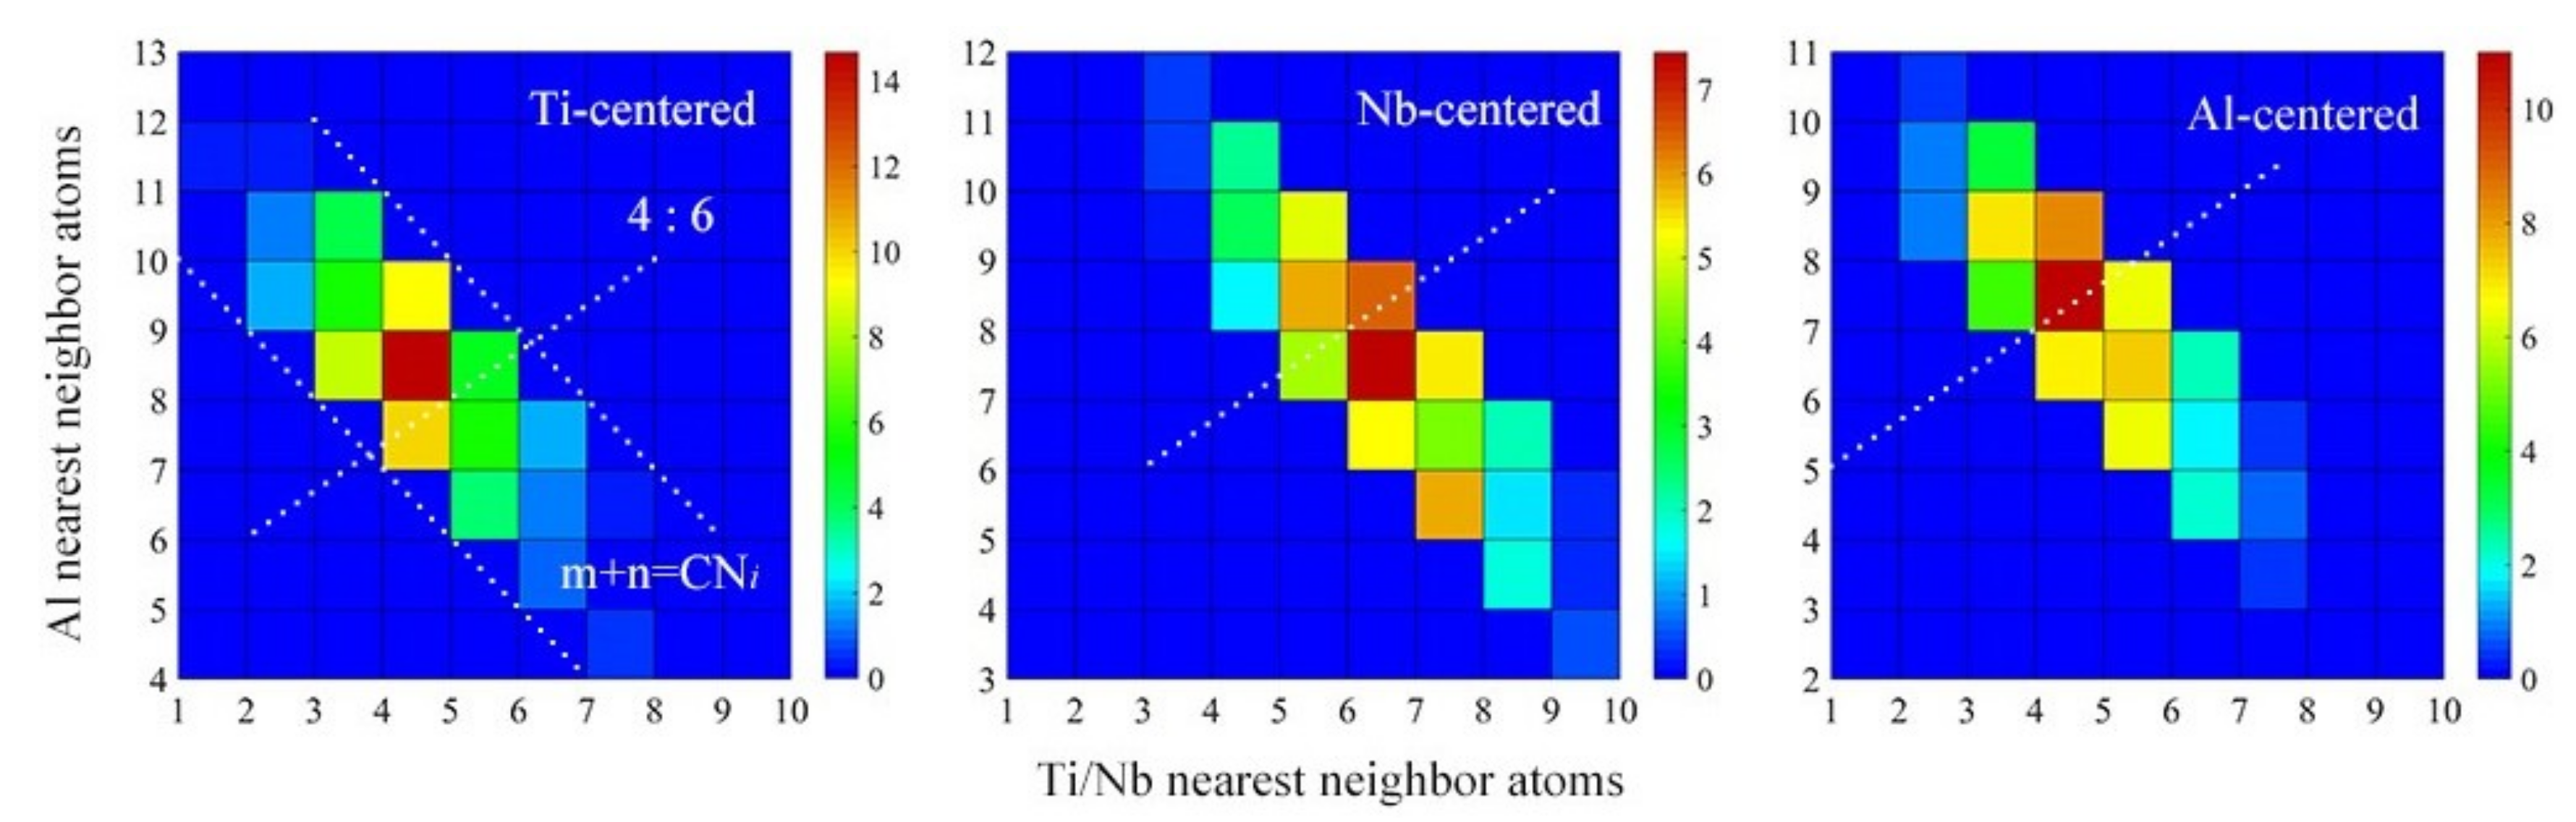
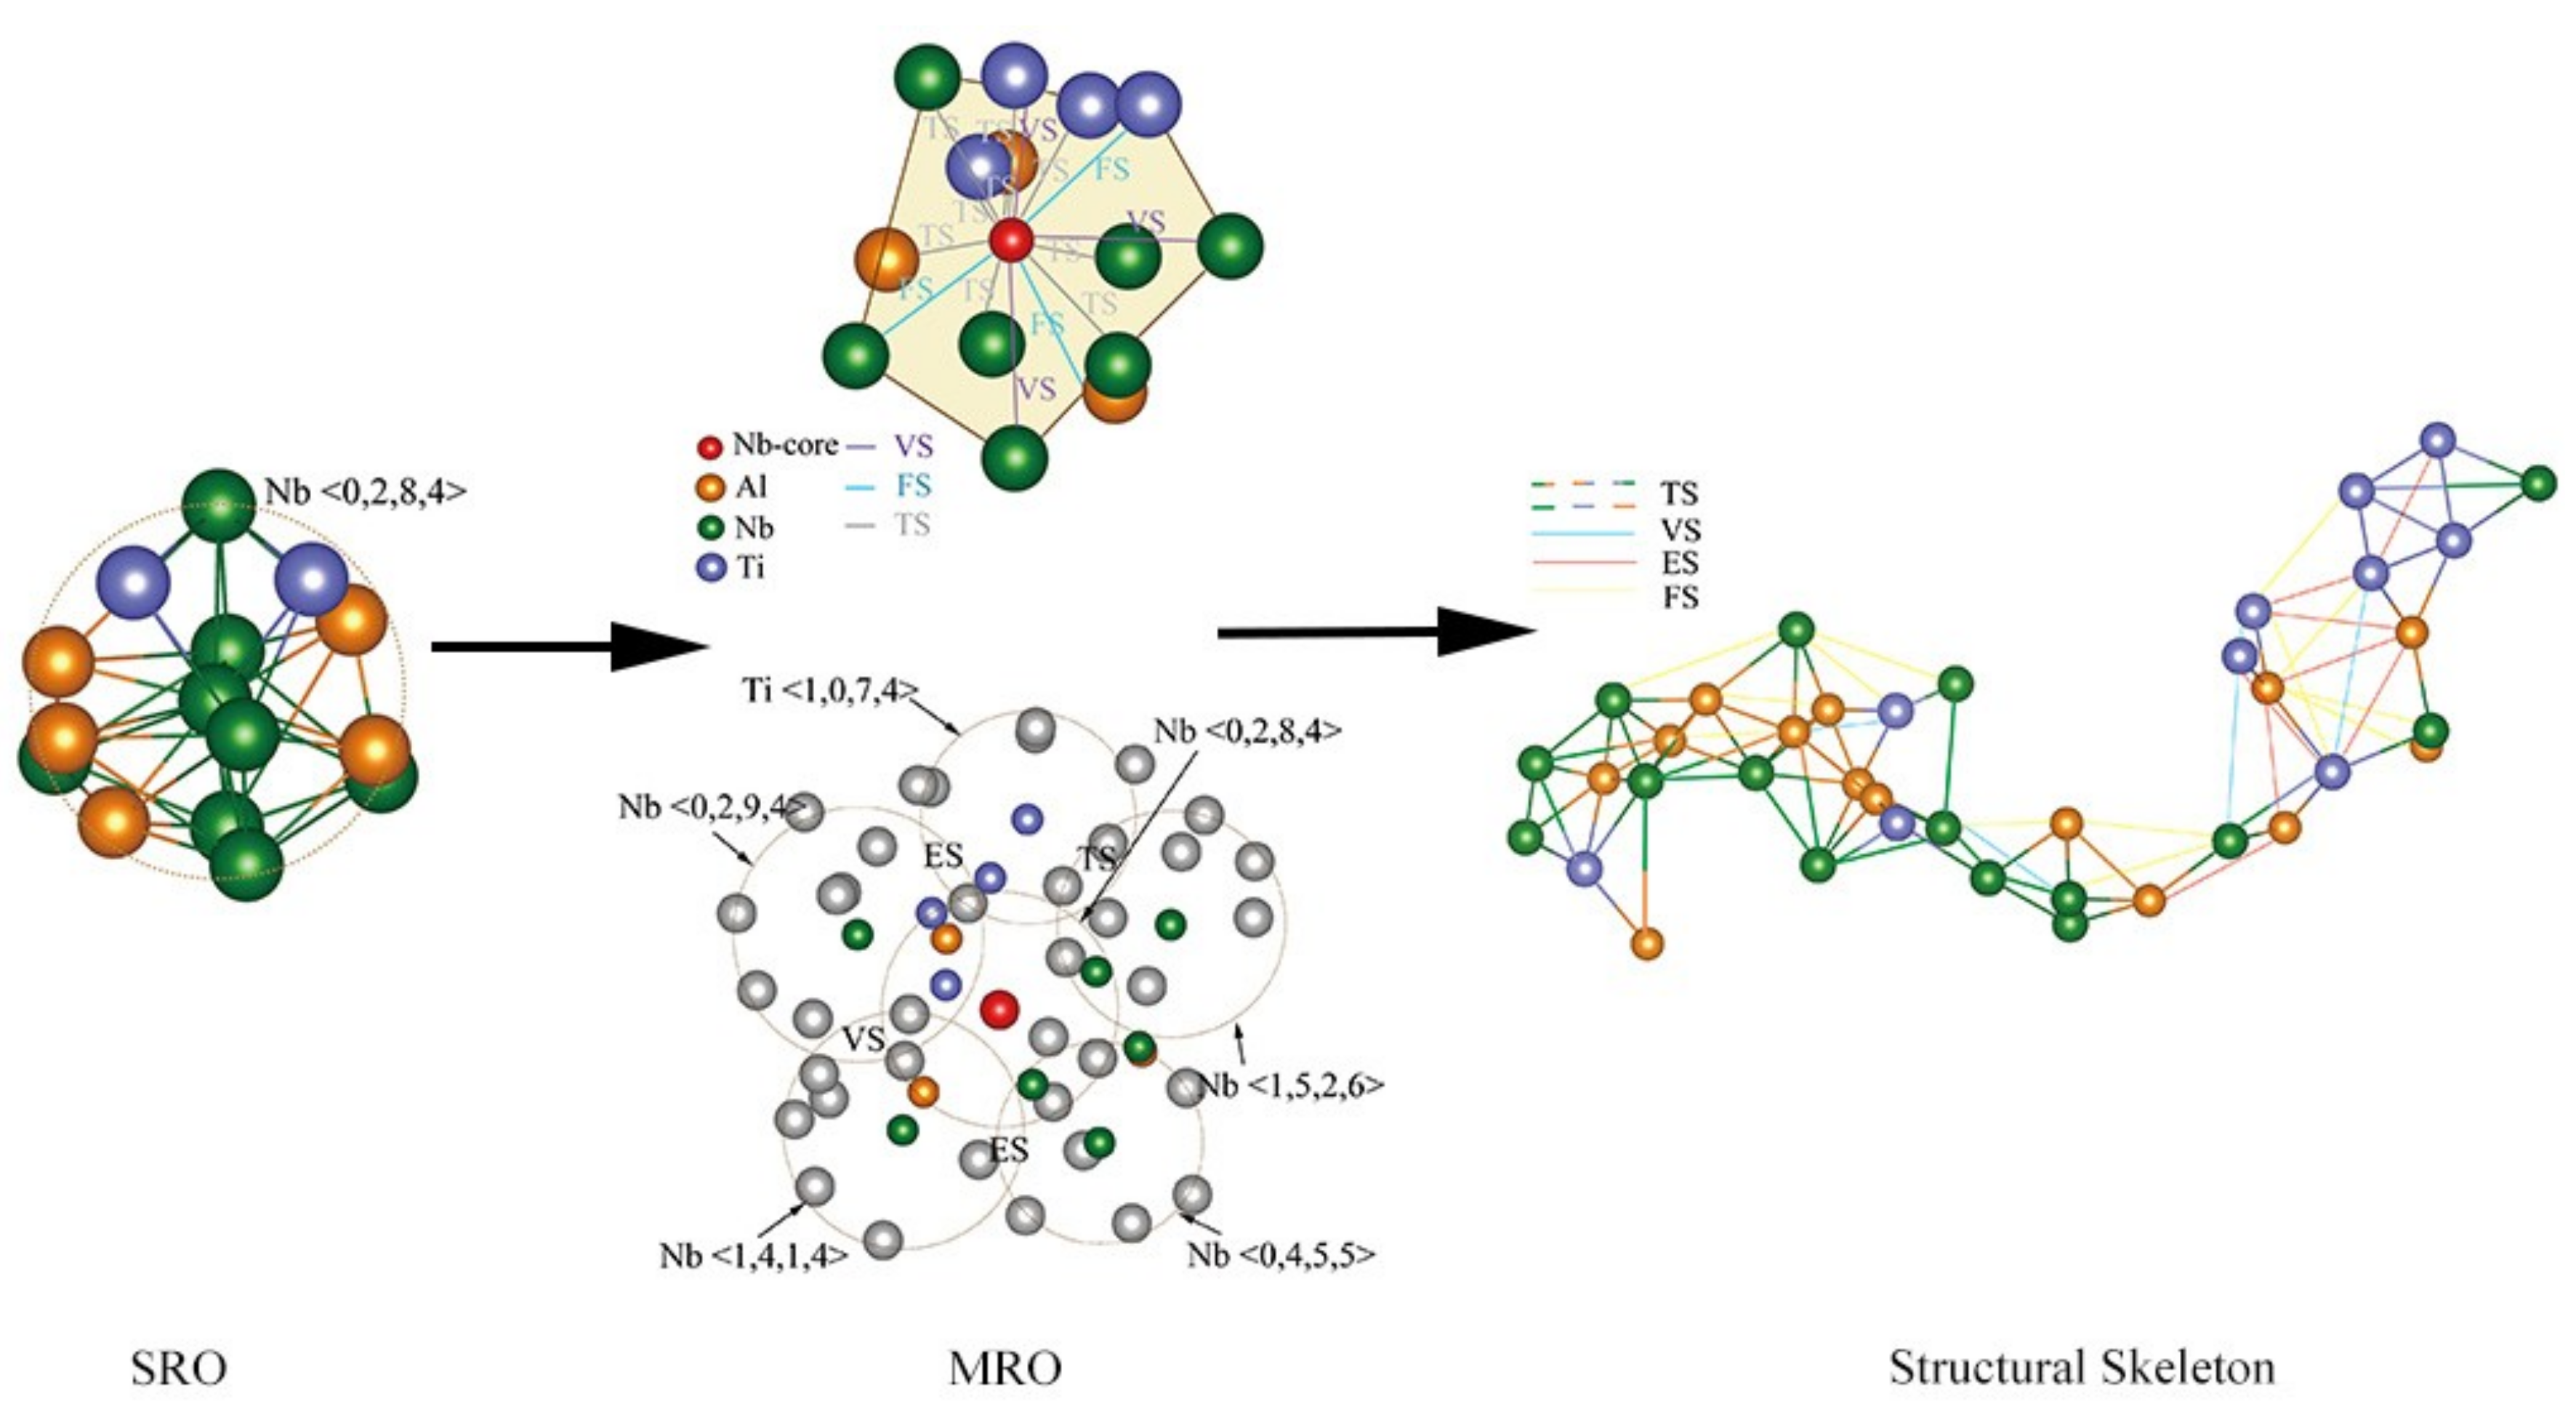
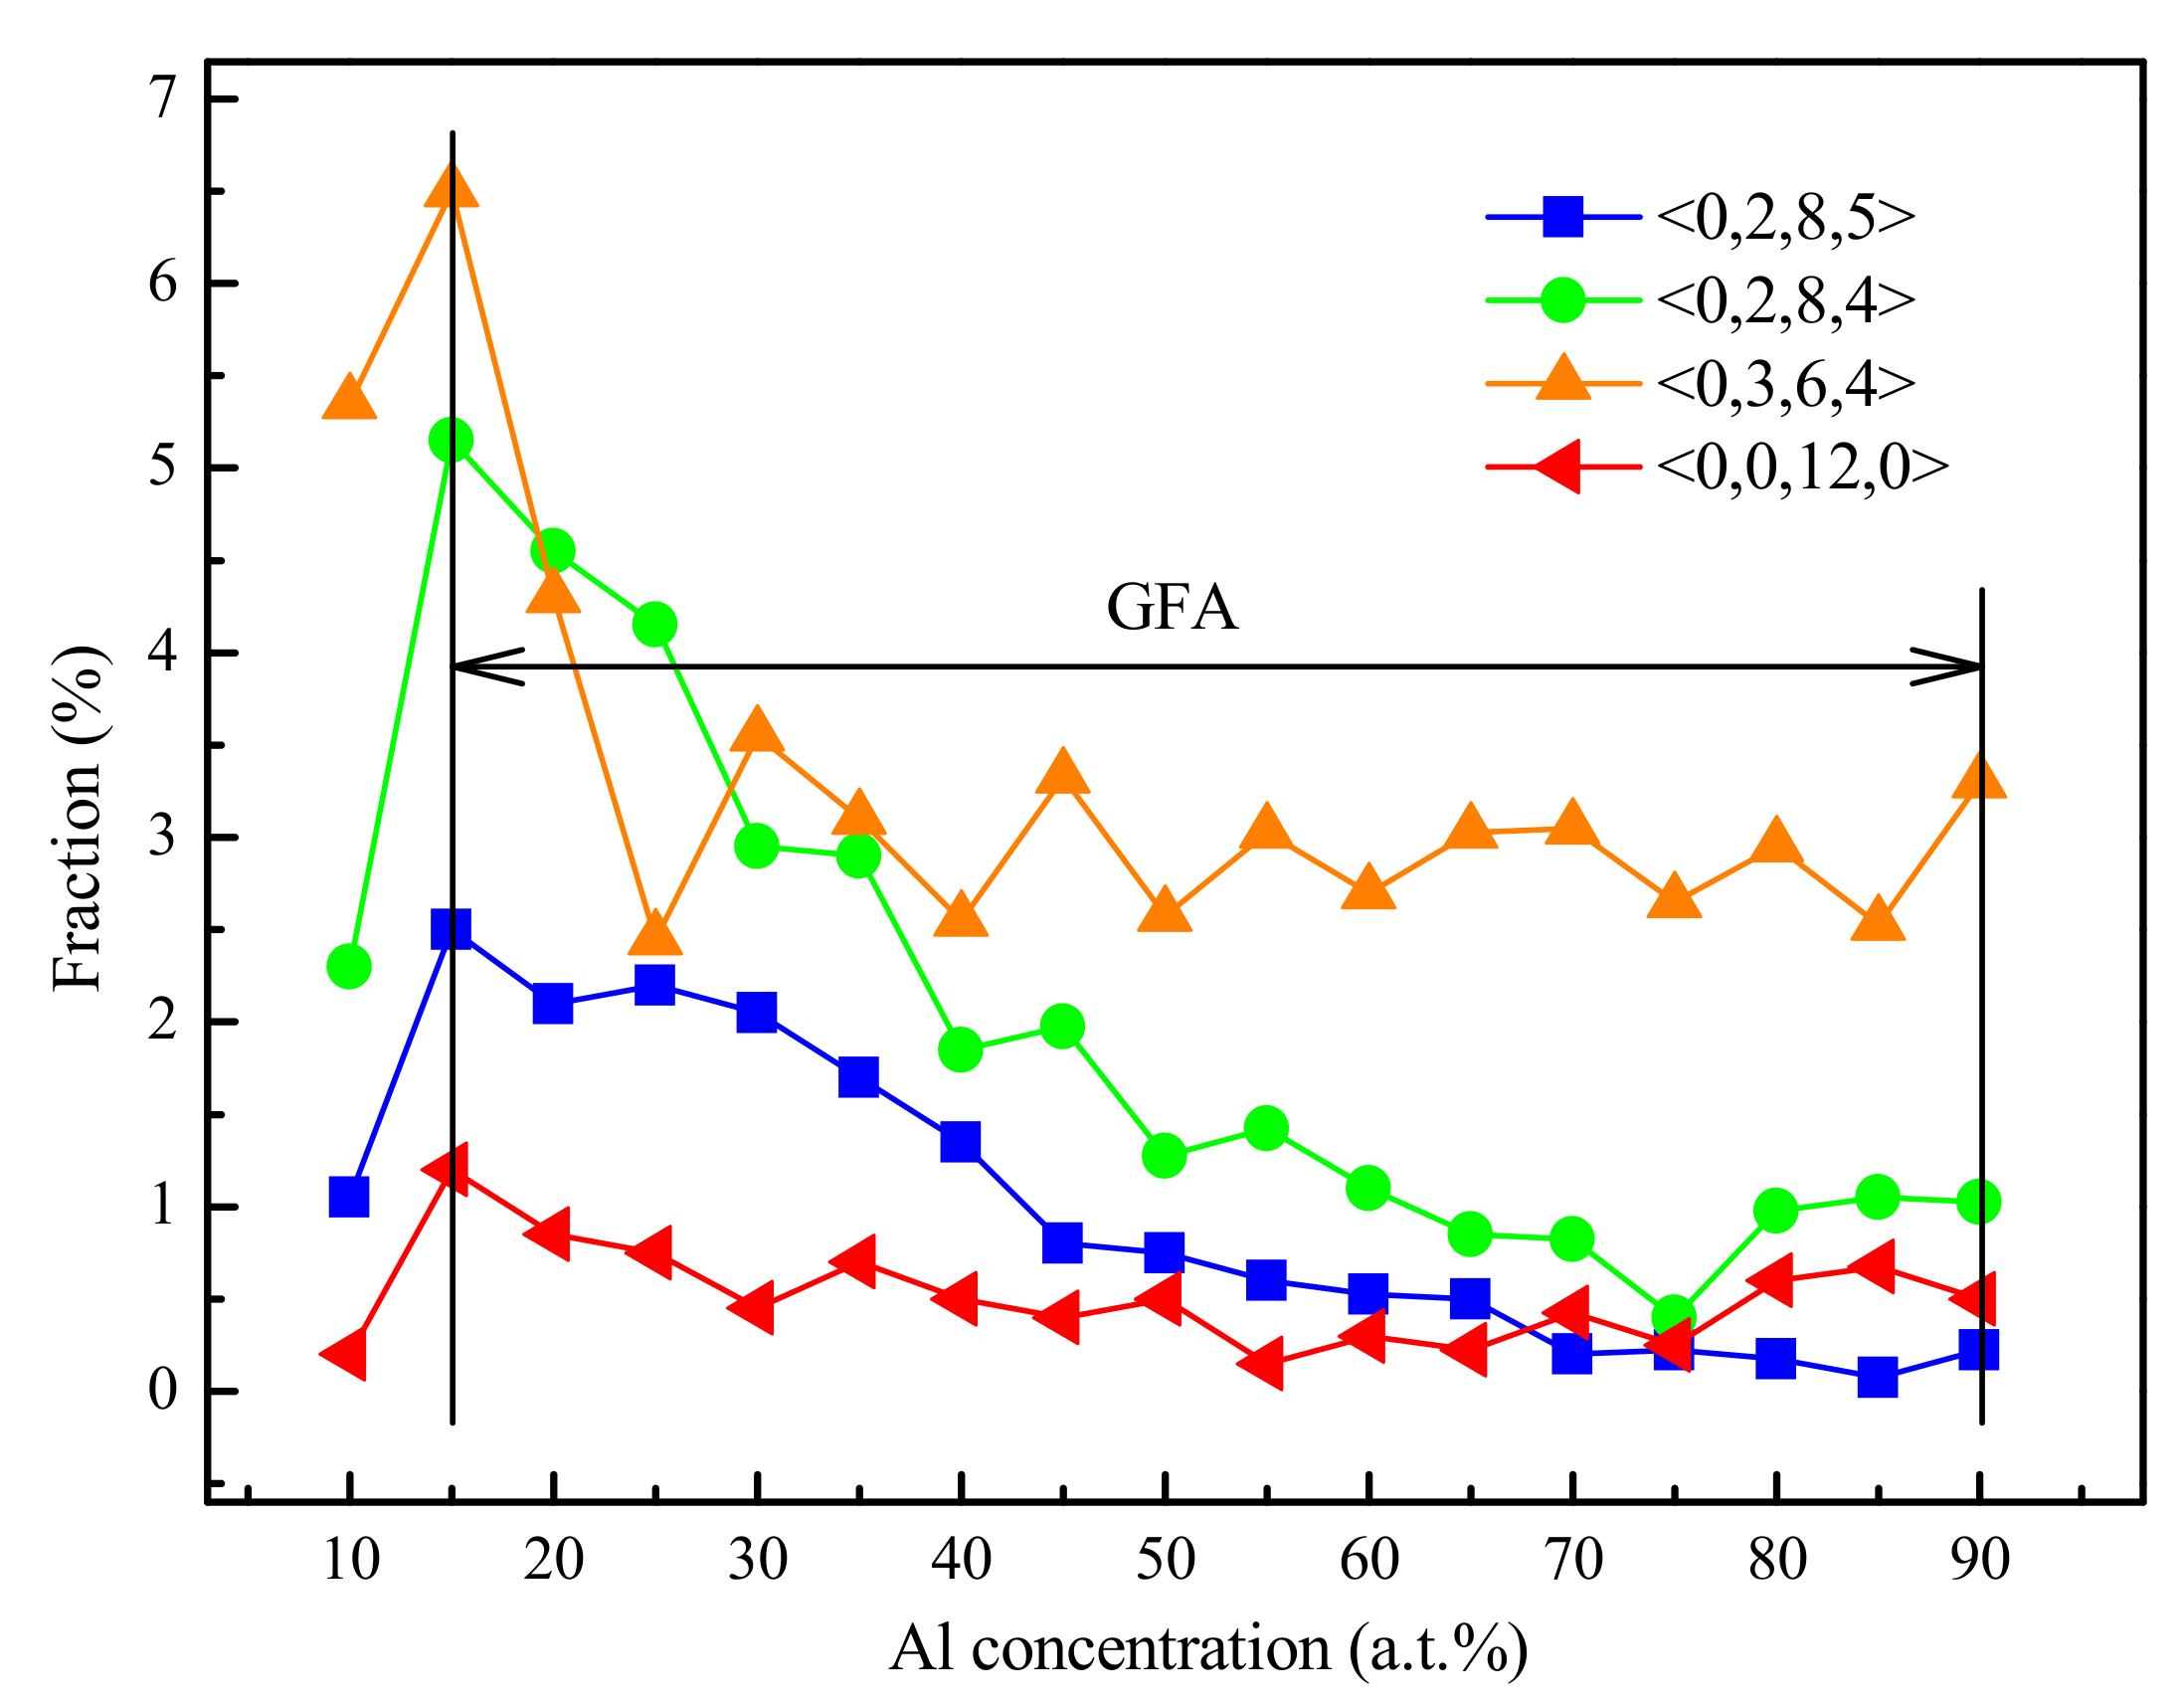
4.1. Short-Range Order and Chemical Microscopic Heterogeneity in Metallic Glass

The Voronoi polyhedron method was employed to analyze the SRO of metallic glass. As shown in Figure 5, the distribution of eight dominant Voronoi polyhedrons in Ti15Nb45Al40 alloy was calculated by Voronoi tessellation methods. It could be seen from Figure 5a that when Ti was used as a core, the polyhedral index with the highest content was <0,3,6,4>, followed by <0,3,6,3> and <0,2,8,2> clusters, while the atomic configuration of <0,3,6,4> cluster was shown as the embedded graph. All the three clusters defined as icosahedral-like had high local quintic symmetry and could be considered as an ideal icosahedral polyhedron that has undergone a distortion [34]. The polyhedrons with quartic or sextic symmetry assisted in the efficient packing of clusters in metallic glass [71]. It can be seen from Figure 5b that, when it was Nb-centered, the clusters with the highest proportion of the top three were <0,2,8,4>, <0,3,6,5>, and <0,1,10,2> clusters, respectively. As to Al-centered, a similar conclusion could be drawn from Figure 5c. These clusters could serve as basic building blocks of Ti15Nb45Al40, of which most were Kasper-type polyhedrons. Furthermore, they could be aggregated into MRO by inter-cross-sharing (IS) linkages.
Figure 6a–c analyzed the distributions of total and partial CN in (TiNb3)1−xAlx (x = 80, 60, 40 at.%) metallic glasses. It could be seen initially the polyhedrons with CN = 11, 12 and 13 possessed the highest proportion. Further inspecting the Figure, one can see that the dominant total coordination number was CN = 11 and 12. When it was Ti-centered, the Ti concentration was low at the beginning, and the trend of the curve changed slowly. As the Al concentration decreased from 60 to 40 at.%, the dominant CN of Ti (the red curve) moved to the right from CN = 11 to CN = 12. When it was Nb-centered, as the Al concentration decreased from 80 to 60, 40 at.%, the dominant CN of Nb (the green curve) moved to the right from CN = 11 to CN = 12, 13 and then to CN = 13, 14. Whereas the dominant clusters of Al-centered were similar to that of the total, the fraction of CN = 11 and CN = 12 account for the most. Because Nb possessed smaller atomic radii than Ti and Al, elements with smaller atomic radii required fewer short-range local packing unit to form clusters. Consequently, most of the coordination polyhedrons with CN > 12 were Nb-centered. Figure 6d–f listed the distributions of the dominant coordination polyhedrons centered on each unitized element to further deduce the atomic configurations. The main coordination polyhedron in Ti5Nb15Al80 was shown in Figure 6d; the concentration of Al-centered clusters was larger than that of Ti- and Nb-centered, the fractions of <0,2,6,3>, <0,3,6,4>, and <0,2,6,4> clusters account for the most. For the coordination polyhedron of Ti10Nb30Al60 metallic glass shown in Figure 6e, it could be seen that the prevailing clusters were indexed as <0,2,8,2>, <0,2,6,4>, <0,2,6,3>, and <0,3,6,4>, respectively. As the Al concentration decreased to 40 at.% shown in Figure 6f, the Al-centered <0,3,6,3> cluster possessed the largest fraction. It could be seen from Figure 6d–f that, as the Al concentration decreased, the fractions of <0,3,6,3> coordination polyhedrons increased correspondingly. However, the fraction of <0,3,6,4> and <0,2,6,3> coordination polyhedrons decreased. Overlooking the distribution of Voronoi polyhedrons in (TiNb3)1–xAlx (x = 80, 60, 40 at.%) metallic glass, we found that the preponderant interconnected icosahedral-like clusters were <0,3,6,3>, <0,2,8,1>, <0,2,8,4>, <0,2,8,5>, and <0,2,8,2>. It was known that icosahedral and icosahedral-like polyhedrons have the effect of stabilizing the structure of metallic glass because of energy minimization and efficient atomic packing [72].
In the previous section, the topological SRO in Ti15Nb45Al40 metallic glass was analyzed. Next, we took Ti15Nb45Al40 metallic glass as an example to further analyze the relationship of chemical SRO between crystalline phases and amorphous. The chemical SRO essentially described the extent to which the local atomic type deviated from the integral composition and characterized the degree of chemical microcosmic inhomogeneity presented in metallic glass. The CN distribution of the nearest neighbor atoms around Ti, Nb, and Al was shown in Figure 7, where the color depth of the grid indicated the percent value, referring to the color scale on the right for details. The double-index (m, n) represented the local chemical environment of each atom, where m denoted the number of Al neighbors, n represented the Ti and Nb neighbors, and Ti and Nb were not distinguished, for the time being. It was assumed here that Ti and Nb were quasi-neighbors to obtain a neat display. m + n was equal to the total CN. It could be seen from Figure 7 that the (m, n) indices around Ti, Nb and Al atoms regularly fell into a striped area, which was bordered by two boundary lines of m + n = CNi (i = min, max). The white dotted line (4:6) represented the corresponding apparent stoichiometry line. It could be seen that the local chemical environment in the metallic glass was dispersed and largely deviated from the apparent alloy composition, demonstrating the existence of chemical SRO. Further analysis of the double-index (m, n) with the highest percentage of Ti-, Nb-, and Al-centered revealed that the Ti/Nb atoms were more prone to neighboring Al atoms, that is, it contained more Al atoms compared with the apparent chemical composition. This was consistent with experimentally observed negative mixing enthalpy of Ti-Al and Nb-Al in Table 5, which facilitated mutual attraction among the corresponding atoms to meet the energy minimization.
In general, the topological and chemical SRO of metallic glass is more complex than that of crystalline phase. It promotes the crystallization resistance of the metallic glass but is not conducive to the nucleation of the intermetallic compound, thereby increasing the stability of the amorphous phase. In the meantime, the chemical SRO leads to a variety of cluster-types in metallic glass, increasing the efficient packing in space to reach structural stability and energy minimization [74].

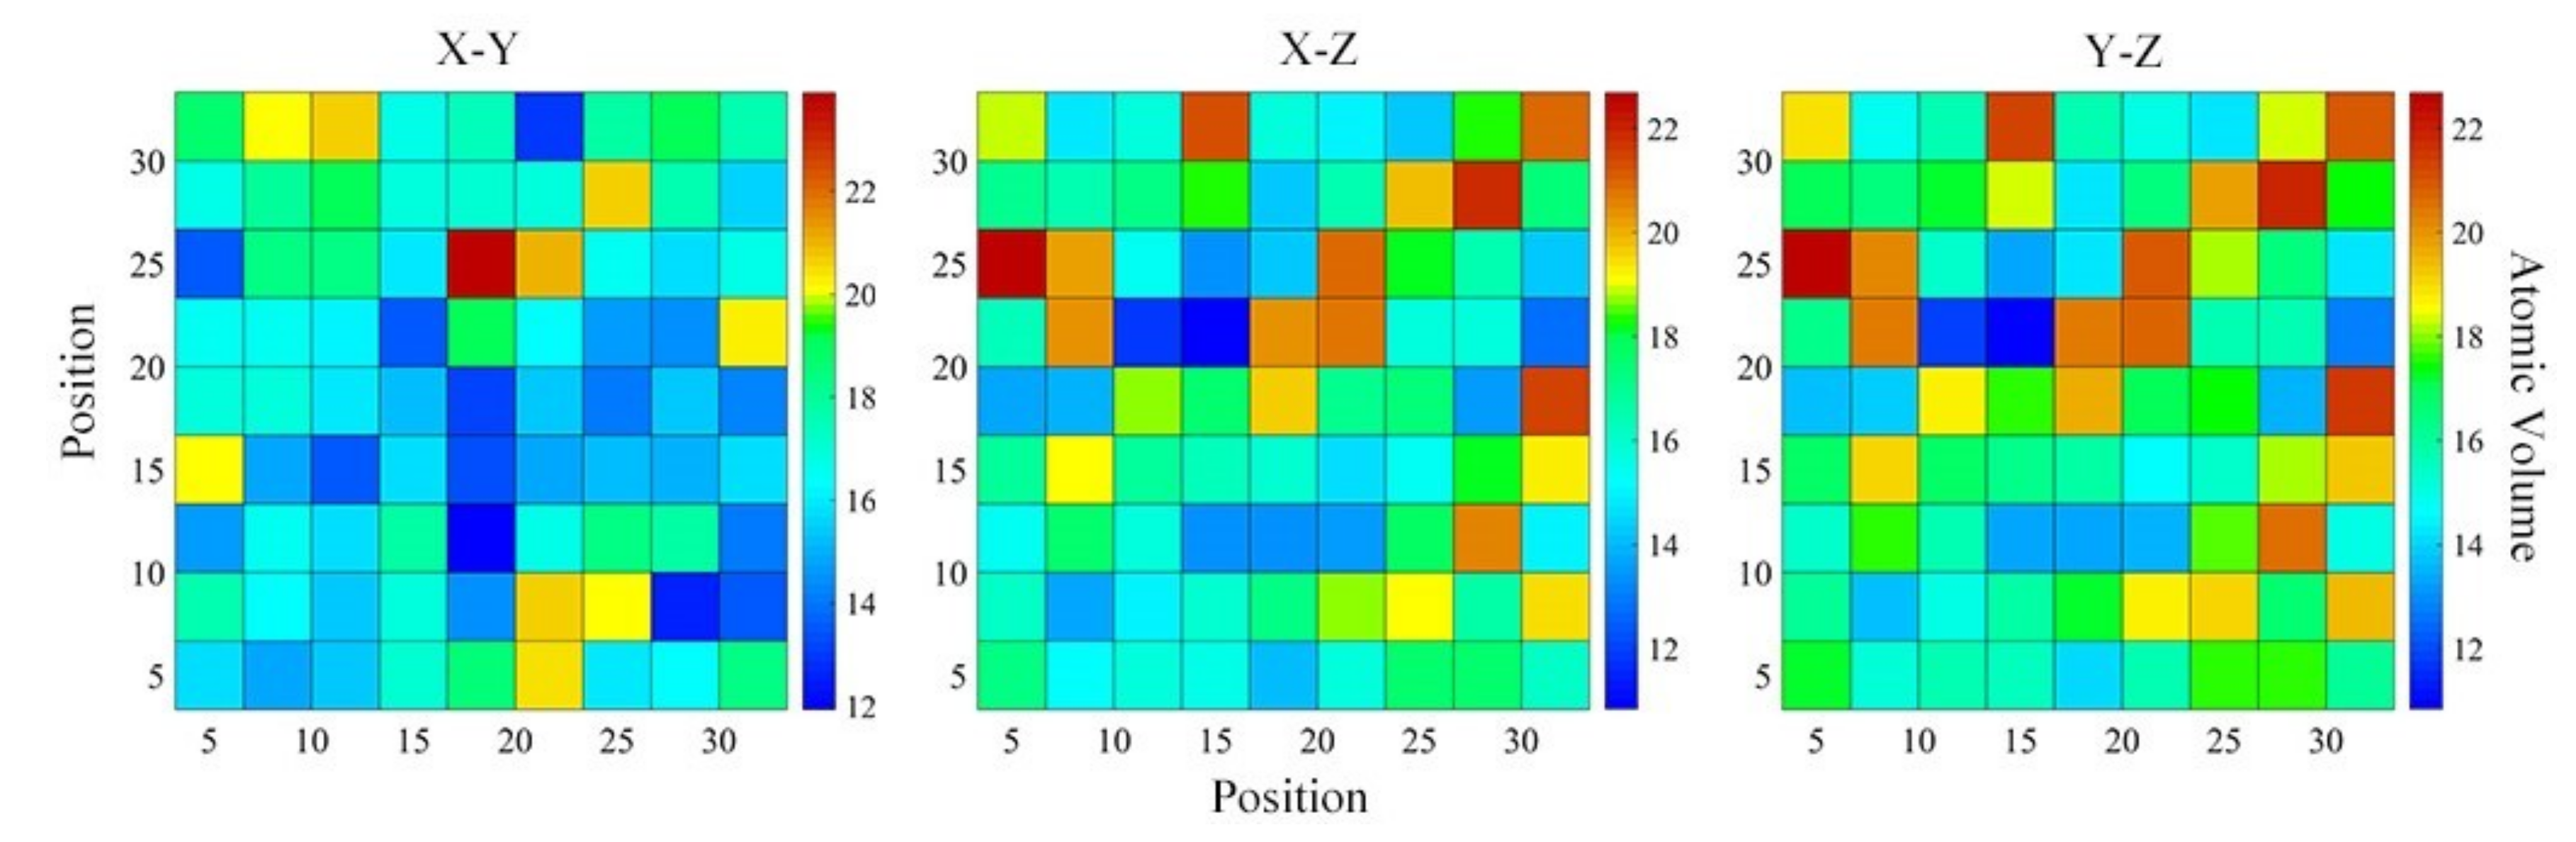
4.2. Medium-Range Order, Cluster Correlation Heterogeneity and Atomic Volume

On the MRO scale, local clusters overlap and interconnect with each other by sharing vertex, edge, face, or volume, i.e., VS, ES, FS, and TS. With the effective packing mode, the structural skeleton and percolated network of metallic glass is finally formed. The connection among local clusters is often tendentious and in-homogeneous, which directly leads to structural heterogeneity in metallic glass. For example, it explains the mechanical heterogeneity in the deformation process. Therefore, establishing an effective method to characterize correlation heterogeneity among enormous number of cluster-types is very crucial for further exploration of the structure-property relationship.
In this paper, we proposed a cluster connection factor (CCF) [75] to distinguish between the neighboring preferences of different cluster-types. The expression is defined as follows:
F mn = C mn C m N n N 1 .
Here, FmnFnm, Cmn represents the number of linkages between two m- and n-type clusters. Note, only the case of connections via TS linkages will be considered here. Cm is the total number of linkages between the m-type cluster and all the other types of clusters, Nn is the number of n-type clusters in the alloy, and N represents the total number of clusters of all types. If Fmn < 0, a repulsive-like interaction appears between m- and n-type clusters. If Fmn > 0, m- and n-type clusters tend to inter-linkage. If Fmn = 0, a random packing behavior occurs among different cluster-types.
For the selected eight typical Voronoi clusters of Ti15Nb45Al40 metallic glass, the calculated matrix of CCFs was shown in Figure 8. The color scale on the right indicated the corresponding CCF value. It could be seen from Figure 8 that there was a very strong connection heterogeneity on the MRO scale, and the packing mode diverged remarkably from the random packing mode. The Ti <0,3,6,3> and Ti <0,3,6,4> clusters exhibited intensive aggregation and interconnected tendencies. In terms of horizontal and vertical integration, Nb <0,2,8,4> were Kasper-type clusters with strong local quintic symmetry. It showed a favorable tendency to interconnect with other types of clusters, so it could serve as a hinge for interconnecting clusters. Due to the fact that the Nb element possessed the highest content in Ti15Nb45Al40 metallic glass, it could be treated as solvent atoms to promote the inter-connectivity of clusters centered on Ti and Al solute atoms. Meanwhile, Nb-centered clusters and Ti-, Al-centered clusters also aggregated and cooperated with each other, which was beneficial to increase the packing efficiency in space and thus achieve the purpose of strengthening the structural stability of glassy alloys.
Zhao and Louzguine–Luzgin et al. have investigated the structural relaxation and its influence on the mechanical properties and elastic properties of Cu-Zr-Ti-Pd and Mg-Zn-Ca bulk metallic glass (BMG) [76,77]. It was found that the distribution of free volume has an effect on the elastic properties of metallic glass. During the stage of plasticity deformation in glassy alloys, the macroscopic strengthening effect is manifested by the atomic micro-strengthening in shear band. The free volume (FV) is confined to the cage formed by “backbone”. Through the analysis of the atomic volume, with the increase of deformation, the growth and aggregation of FV become more and more difficult, the “backbone” becomes more and more dense, and eventually the deformation resistance is increased. Therefore, the study of atomic volume is of great significance. It preliminarily establishes the relationship between the amorphous structure and their macroscopic mechanical property. In this paper, the Voronoi tessellation of the simulation cell was calculated by the open visualization tool (OVITO) [78], with the particle positions as Voronoi polyhedron centers. By default, the volume of the Voronoi polyhedron are output by the analysis modifier, and the spatial bin is aligned parallel to the simulation box x-, y-, and z-axes. The atomic Voronoi volume calculated by proper averaging procedure can accurately measure the local density. In a given region, the larger Voronoi volume corresponds to the larger local FV, which involves the smaller local density in the region. Figure 9 showed the atomic volume distribution of Ti15Nb45Al40 metallic glass on the X–Y, X–Z and Y–Z plane of projection. As could be seen from Figure 9, along the x- and y-axis, the size and distribution of atomic volume in the Ti15Nb45Al40 metallic glass was greatly similar, and both were larger than the atomic volume along the z-axis, indicating that there were more FV along the x- and y-axis than that along the z-axis. Figure 10 exhibited the average atomic Voronoi volumes along the z-axis of the (TiNb3)1−xAlx (x = 5–90 at.%) system. It could be seen that as Al concentration increased, the average atomic volume decreased firstly and then increased. Its value was minimum at Al = 40 at.%, i.e., the Ti15Nb45Al40 glassy alloy possessed the smallest average atomic volume, the highest packing efficiency, and the lowest alloy energy.

4.3. Structural Skeleton in the Extended Scale

It could be known from Figure 8 that Nb <0,2,8,4> served as a hinge for interconnecting clusters. Hence, we took the Nb <0,2,8,4> cluster as the starting point of analysis. With the help of various structural characterization methods, the evolution of the glassy alloy from local cluster on the SRO scale and quintic-like packing on the MRO scale, to structural skeleton on an expanded scale was shown in Figure 11. The Nb <0,2,8,4> clusters on the SRO scale mainly focused on the configuration of the nearest neighbor atoms. On the MRO scale, Nb-centered icosahedral-like clusters could interconnect with about fourteen solute atoms-centered [25] clusters. They interconnect with each other by VS, ES, FS, and TS linkage-types. Ultimately, a nano-scale super-cluster was engendered by the effective packing of neighboring clusters. For the connection mode of the structural skeleton, the extracted cross-linked patch was shown in Figure 11, which contained 40 clusters. It could be seen that each cluster in the presented patch mainly interpenetrated with each other to form a cross-linked network in the form of TS linkages [39]. However, the VS, ES, and FS linkages assisted in constructing the network and helped to strengthen the stability of the metallic glass and affect the macroscopic properties of material [79].

5. Further Discussion about the GFA and Atomic Structure

Combined with the analysis in Figure 2 above, it could be found that the dominant interconnected Voronoi polyhedra in Ti15Nb45Al40 glassy alloy were <0,2,8,5>, <0,2,8,4>, and <0,3,6,4>. Adding the most stable icosahedral cluster <0,0,12,0>, Figure 12 illustrates the relationship between the above dominant interconnected clusters of the (TiNb3)1−xAlx system and the Al concentration. It was analyzed that the population of the four dominant clusters initially increased as Al concentration increased, until it reached the maximum value when the Al concentration was 15 at.%. It was followed by the reduced content as further increasing Al concentration. The aforementioned trend was consistent with the GFA of (TiNb3)1−xAlx metallic glass. It was further illustrated that there was a great difference in the topological SRO between the metallic glass and its corresponding crystal. The topological SRO would increase the crystallization resistance of metallic glass and consolidate the stability, thereby explicating the structural causation of the GFA. Therefore, the GFA in the Ti-Nb-Al system would mainly come from the instability of the crystalline phase. GFA determined from both structural and energetic perspectives showed a good consistency.

6. Concluding Remarks

Based on the constructed Ti-Nb-Al interatomic potential, MD and MC simulations not only clarified the mechanism of the metallic glass formation, but also predicted an energetically favored quadrangular metallic glass-formation region. Further calculations of the amorphous driving force for all of the possible glassy alloys in the predicted region pinpointed an optimized composition at Ti15Nb45Al40, and it could correspond to the one with a largest glass forming ability in the Ti-Nb-Al ternary alloy system. By means of multiple structural characterizations, a series of hierarchical structural analysis to the SRO, MRO, and even an expanded scale was performed for the Ti15Nb45Al40 metallic glass. The results showed that a large degree of topological and chemical SRO existed inside the Ti15Nb45Al40 glassy alloy, and in the MRO scale, with the aid of the CCF, it was revealed that a significant structural heterogeneity existed. By observing the variation of atomic volume, it was concluded that the Ti15Nb45Al40 metallic glass could possess the highest packing efficiency and lowest alloy energy. The changes in the content of the dominant clusters were consistent with the GFA of (TiNb3)1−xAlx alloys. In addition, in the structural evolution from SRO and MRO to the structural skeleton, we explored the structural origin of the glass-forming ability, as well as the unique properties of the Ti-Nb-Al metallic glasses.

Author Contributions

Investigation and writing—original draft preparation, B.C.; conceptualization, M.Y.; methodology, B.L.; writing—review and editing, J.L. (Jianbo Liu) and J.L. (Jiahao Li).

Funding

This research was funded by the Ministry of Science and Technology of China (2017YFB0702301, 2017YFB0702201, 2017YFB0702401), the National Natural Science Foundation of China (51571129, 51631005), and the Administration of Tsinghua University.

Conflicts of Interest

The authors declare no conflict of interest.

References

  1. Klement, W.; Willens, R.H.; Duwez, P. Non-crystalline Structure in Solidified Gold–Silicon Alloys. Nature 1960, 187, 869–870. [Google Scholar] [CrossRef]
  2. Greer, A.L. Metallic glasses. Science 1995, 267, 1947–1953. [Google Scholar] [CrossRef]
  3. Inoue, A. Stabilization of metallic super-cooled liquid and bulk amorphous alloys. Acta Mater. 2000, 48, 279–306. [Google Scholar] [CrossRef]
  4. Han, F.F.; Inoue, A.; Han, Y. Novel heating-induced reversion during crystallization of Al-based glassy alloys. Sci. Rep. 2017, 7, 46113. [Google Scholar] [CrossRef]
  5. Inoue, A. Amorphous, nano-quasi-crystalline and nano-crystalline alloys in Al-based systems. Prog. Mater. Sci. 1998, 43, 365–520. [Google Scholar] [CrossRef]
  6. Inoue, A.; Kimura, H.M.; Masumoto, T.; Tsai, A.P.; Bizen, Y. Al-Ge-(Cr or Mn) and Al-Si-(Cr or Mn) quasi-crystals with high metalloid concentration prepared by rapid quenching. J. Mater. Sci. Lett. 1987, 6, 771–774. [Google Scholar] [CrossRef]
  7. Inoue, A.; Yamamoto, M.; Kimura, H.M.; Masumoto, T. Ductile aluminium-base amorphous alloys with two separate phases. J. Mater. Sci. Lett. 1987, 6, 194–196. [Google Scholar] [CrossRef]
  8. Inoue, A.; Ohtera, K.; Tsai, A.P.; Masumoto, T. Aluminum-based amorphous alloys with tensile strength above 980 MPa (100 kg/mm2). Jpn. J. Appl. Phys. 1988, 27, 479–482. [Google Scholar] [CrossRef]
  9. Inoue, A.; Sobu, S.; Louzguine, D.V.; Kimura, H.; Sasamori, K. Ultrahigh strength Al-based amorphous alloys containing Sc. J. Mater. Res. 2004, 19, 1539–1543. [Google Scholar] [CrossRef]
  10. He, Y.; Poon, S.J.; Shiflet, G.J. Synthesis and properties of metallic glasses that contain aluminum. Science 1988, 241, 1640–1642. [Google Scholar] [CrossRef]
  11. Inoue, A.; Matsumoto, N.; Masumoto, T. Al-Ni-Y-Co amorphous alloys with high mechanical strengths, wide supercooled liquid region and large glass-forming capacity. Mater. Trans. JIM 2007, 31, 493–500. [Google Scholar] [CrossRef]
  12. Huang, Y.; Shen, J.; Sun, J.; Zhang, Z. Enhanced strength and plasticity of a Ti-based metallic glass at cryogenic temperatures. Mater. Sci. Eng. A 2008, 498, 203–207. [Google Scholar] [CrossRef]
  13. Masumoto, T.; Inoue, A.; Sakai, S.; Kimura, H.; Hoshi, A. Superconductivity of Ductile Nb-Based Amorphous Alloys. Trans. Jpn. Inst. Met. 1980, 21, 115–122. [Google Scholar] [CrossRef] [Green Version]
  14. Inoue, A.; Zhang, T.; Masumoto, T. Glass-forming ability of alloys. J. Non-Cryst. Solids 1993, 156, 473–480. [Google Scholar] [CrossRef]
  15. Turnbull, D. Kinetics of solidification of super-cooled liquid mercury droplets. J. Chem. Phys. 1952, 20, 411–424. [Google Scholar] [CrossRef]
  16. Xia, L.; Ding, D.; Shan, S.T.; Dong, Y.D. The glass forming ability of Cu-rich Cu-Hf binary alloys. J. Phys. Condens. Mater. 2006, 18, 3543–3548. [Google Scholar] [CrossRef]
  17. Guo, F.Q.; Enouf, S.; Shiflet, G.; Poon, J. Role of atomic size on glass forming ability and thermal stability of Al-based amorphous alloys. Mater. Trans. JIM 2000, 41, 1406–1409. [Google Scholar] [CrossRef]
  18. He, Y.; Dougherty, G.M.; Shiflet, G.J.; Poon, S.J. Unique metallic glass forming ability and ultra-high tensile strength in Al-Ni-Fe-Gd alloys. Acta Metall. Mater. 1993, 41, 337–343. [Google Scholar] [CrossRef]
  19. Li, J.H.; Dai, Y.; Cui, Y.Y. Atomic theory for predicting the binary metallic glass formation. Mater. Sci. Eng. R 2011, 72, 1–28. [Google Scholar] [CrossRef]
  20. Cui, Y.Y.; Wang, T.L.; Li, J.H.; Dai, Y.; Liu, B.X. Thermodynamic calculation and inter-atomic potential to predict the favored composition region for the Cu-Zr-Al metallic glass formation. Phys. Chem. Chem. Phys. 2011, 13, 4103–4108. [Google Scholar] [CrossRef]
  21. Yang, M.H.; Li, J.H.; Liu, B.X. Proposed correlation of structure network inherited from producing techniques and deformation behavior for Ni-Ti-Mo metallic glasses via atomistic simulations. Sci. Rep. 2016, 6, 29722. [Google Scholar] [CrossRef] [PubMed] [Green Version]
  22. Yavari, A.R. Materials science: A new order for metallic glasses. Nature 2006, 439, 405–406. [Google Scholar] [CrossRef] [PubMed]
  23. Cheng, Y.Q.; Ma, E. Atomic-level structure and structure-property relationship in metallic glasses. Prog. Mater. Sci. 2011, 56, 379–473. [Google Scholar] [CrossRef]
  24. Xing, L.Q.; Hufnagel, T.C.; Eckert, J.; Loser, W. Relation between short-range order and crystallization behavior in Zr-based amorphous alloys. Appl. Phys. Lett. 2000, 77, 1970–1972. [Google Scholar] [CrossRef]
  25. Peng, H.L.; Li, M.Z.; Wang, W.H.; Wang, C.Z.; Ho, K.M. Effect of local structures and atomic packing on glass forming ability in CuxZr100−x metallic glasse. Appl. Phys. Lett. 2010, 96, 021901. [Google Scholar] [CrossRef]
  26. Hirata, A.; Kang, L.J.; Fujita, T.; Klumov, B.; Matsue, K. Geometric frustration of icosahedron in metallic glasses. Science 2013, 341, 376–379. [Google Scholar] [CrossRef]
  27. Kartouzian, A. Cluster-assembled metallic glasses. Nanoscale Res. Lett. 2013, 8, 339. [Google Scholar] [CrossRef] [Green Version]
  28. Bednarcik, J.; Michalik, S.; Kolesar, V. In situ XRD studies of nanocrystallization of Fe-based metallic glass: A comparative study by reciprocal and direct space methods. Phys. Chem. Chem. Phys. 2013, 15, 8470–8479. [Google Scholar] [CrossRef]
  29. Jin, Z.H.; Lu, K.; Gong, Y.D.; Hu, Z.Q. Glass transition and atomic structures in supercooled Ga0.15Zn0.15Mg0.7 metallic liquids: A constant pressure molecular dynamics study. J. Chem. Phys. 1997, 106, 8830–8840. [Google Scholar] [CrossRef]
  30. Fan, C.; Liaw, P.K.; Wilson, T.W. Structural model for bulk amorphous alloys. Appl. Phys. Lett. 2006, 89, 111905. [Google Scholar] [CrossRef]
  31. Gonçalves, A.P.; Lopes, E.B.; Rouleau, O. Conducting glasses as new potential thermoelectric materials: The Cu–Ge–Te case. J. Mater. Chem. 2010, 20, 1516–1521. [Google Scholar] [CrossRef]
  32. Liu, X.J.; Xu, Y.; Hui, X. Metallic liquids and glasses: Atomic order and global packing. Phys. Rev. Lett. 2010, 105, 155501. [Google Scholar] [CrossRef] [PubMed]
  33. Sheng, H.W.; Luo, W.K.; Alamgir, F.M. Atomic packing and short-to-medium-range order in metallic glasses. Nature 2006, 439, 419–425. [Google Scholar] [CrossRef] [PubMed]
  34. Hirata, A.; Guan, P.; Fujita, T. Direct observation of local atomic order in a metallic glass. Nat. Mater. 2011, 10, 28–33. [Google Scholar] [CrossRef] [PubMed]
  35. Guan, P.F.; Fujita, T.; Hirata, A. Structural origins of the excellent glass forming ability of Pd40Ni40P20. Phys. Rev. Lett. 2012, 108, 175501. [Google Scholar] [CrossRef] [PubMed]
  36. Cheng, Y.Q.; Ma, E.; Sheng, H.W. Atomic level structure in multicomponent bulk metallic glass. Phys. Rev. Lett. 2009, 102, 245501. [Google Scholar] [CrossRef] [PubMed]
  37. Ma, D.; Stoica, A.D.; Wang, X.L. Power-law scaling and fractal nature of medium-range order in metallic glasses. Nat. Mater. 2009, 8, 30–34. [Google Scholar] [CrossRef] [PubMed]
  38. Wang, X.D.; Yin, S.; Cao, Q.P. Atomic structure of binary Cu64.5Zr35.5 bulk metallic glass. Appl. Phys. Lett. 2008, 92, 011902. [Google Scholar] [CrossRef]
  39. Lee, M.; Lee, C.M.; Lee, K.R. Networked interpenetrating connections of icosahedra: Effects on shear transformations in metallic glass. Acta Mater. 2011, 59, 159–170. [Google Scholar] [CrossRef]
  40. Ichitsubo, T.; Matsubara, E.; Yamamoto, T. Microstructure of fragile metallic glasses inferred from ultrasound-accelerated crystallization in Pd-based metallic glasses. Phys. Rev. Lett. 2005, 95, 245501. [Google Scholar] [CrossRef]
  41. Wu, Z.W.; Li, M.Z.; Wang, W.H. Correlation between structural relaxation and connectivity of icosahedral cluster in Cu-Zr metallic glass-forming liquids. Phys. Rev. B 2013, 88, 054202. [Google Scholar] [CrossRef]
  42. Luo, W.K.; Sheng, H.W.; Alamgir, F.M. Icosahedral short-range order in amorphous alloys. Phys. Rev. Lett. 2004, 92, 145502. [Google Scholar] [CrossRef] [PubMed]
  43. Soklaski, R.; Nussinov, Z.; Markow, Z. Connectivity of icosahedral network and a dramatically growing static length scale in Cu-Zr binary metallic glasses. Phys. Rev. B 2013, 87, 184203. [Google Scholar] [CrossRef]
  44. Li, M.; Wang, C.Z.; Hao, S.G. Structural heterogeneity and medium-range order in ZrxCu100−x metallic glasses. Phys. Rev. B 2009, 80, 184201. [Google Scholar] [CrossRef]
  45. Dai, X.D.; Kong, Y.; Li, J.H. Long-range empirical potential model: Application to fcc transition metals and alloys. Phys. Rev. B 2007, 75, 104101. [Google Scholar] [CrossRef]
  46. Dai, X.D.; Li, J.H.; Kong, Y. Long-range empirical potential for the bcc structured transition metals. Phys. Rev. B 2007, 75, 052102. [Google Scholar] [CrossRef]
  47. Dai, Y.; Li, J.H.; Liu, B.X. Long-range empirical potential model: Extension to hexagonal close-packed metals. J. Phys. Condens. Matter. 2009, 21, 385402. [Google Scholar] [CrossRef] [PubMed]
  48. Cai, B.; Yang, M.H.; Liu, J.B. Atomistic simulation study of favored compositions of Ni-Nb-Al metallic glasses. Sci. China. Technol. Sci. 2018, 61, 1829–1838. [Google Scholar] [CrossRef]
  49. Sabeena, M.; Murugesan, S.; Anees, P. Crystal structure and bonding characteristics of transformation products of bcc beta in Ti-Mo alloys. J. Alloys Compd. 2017, 705, 769–781. [Google Scholar] [CrossRef]
  50. Segall, M.D.; Lindan, P.J.D.; Probert, M.J. First-principles simulation: Ideas. illustrations and the CASTEP code. J. Phys. Condens. Mater. 2002, 14, 2717. [Google Scholar] [CrossRef]
  51. Clark, S.J.; Segall, M.D.; Pickard, C.J. First principles methods using CASTEP. Zeitschrift für Kristallographie 2005, 220, 567–570. [Google Scholar] [CrossRef]
  52. Perdew, J.P.; Wang, Y. Accurate and simple analytic representation of the electron-gas correlation energy. Phys. Rev. B 1992, 45, 13244. [Google Scholar] [CrossRef]
  53. Rose, J.H.; Smith, J.R.; Guinea, F. Universal features of the equation of state of metals. Phys. Rev. B 1984, 29, 2963. [Google Scholar] [CrossRef]
  54. Sheng, H.W.; Wilde, G.; Ma, E. The competing crystalline and amorphous solid solutions in the Ag-Cu system. Acta Mater. 2002, 50, 475–488. [Google Scholar] [CrossRef]
  55. LAMMPS Package. Available online: http://lammps.sandia.gov (accessed on 30 January 2019).
  56. Plimpton, S. Fast parallel algorithms for short-range molecular dynamics. J. Comput. Phys. 1995, 117, 1–19. [Google Scholar] [CrossRef]
  57. Panagiotopoulos, A.Z.; Quirke, N.; Stapleton, M. Phase equilibria by simulation in the Gibbs ensemble: Alternative derivation, generalization and application to mixture and membrane equilibria. Mol. Phys. 1988, 63, 527–545. [Google Scholar] [CrossRef]
  58. Allen, M.P.; Tildesley, D.J. Computer Simulation of Liquids; Oxford University Press: London, UK, 1987. [Google Scholar]
  59. Parrinello, M.; Rahman, A. Polymorphic transitions in single crystals: A new molecular dynamics method. J. Appl. Phys. 1981, 52, 7182–7190. [Google Scholar] [CrossRef]
  60. Dai, Y.; Li, J.H.; Che, X.L. Glass-forming region of the Ni-Nb-Ta ternary metal system determined directly from n-body potential through molecular dynamics simulations. J. Mater. Res. 2009, 24, 1815–1819. [Google Scholar] [CrossRef]
  61. Finney, J.L. Random Packings and the Structure of Simple Liquids. I. The Geometry of Random Close Packing. Proc. R. Soc. Lond. A 1970, 319, 479–493. [Google Scholar] [CrossRef]
  62. Hui, X.; Fang, H.Z.; Chen, G.L. Atomic structure of Zr41.2Ti13.8Cu12.5Ni10Be22.5 bulk metallic glass alloy. Acta Mater. 2009, 57, 376–391. [Google Scholar] [CrossRef]
  63. Wang, Q.; Li, J.H.; Cui, Y.Y. Calculation of driving force and local order to predict the favored and optimized compositions for Mg-Cu-Ni metallic glass formation. J. Appl. Phys. 2013, 114, 153503. [Google Scholar] [CrossRef]
  64. Liu, B.X.; Cheng, G.A. Glass Forming ability of the Al-Ti System under Ion Beam Mixing. Phys. Stat. Sol. A 1991, 125, 93–96. [Google Scholar] [CrossRef]
  65. Akiyama, E.; Yoshioka, H.; Kim, J.H. The effect of magnesium on the corrosion behavior of sputter-deposited amorphous Al-Mg-Ti ternary alloys in a neutral chloride solution. Corros. Sci. 1993, 34, 27–40. [Google Scholar] [CrossRef]
  66. Itsukaichi, T.; Masuyama, K.; Umemoto, M. Mechanical alloying of Al-Ti powder mixtures and their subsequent consolidation. J. Mater. Res. 1993, 8, 1817–1828. [Google Scholar] [CrossRef]
  67. El-Eskandarany, M.S. Amorphization process by rod-milling TixAl100−x and the effect of annealing. J. Alloys. Compd. 1996, 234, 67–82. [Google Scholar] [CrossRef]
  68. Yoo, D.J.; Hwang, S.M.; Lee, S.M. Phase formation in mechanically alloyed Nb-Al powders. Appl. Phys. Lett. 2000, 19, 1327–1329. [Google Scholar]
  69. Karimi, H.; Ghasemi, A.; Hadi, M. Microstructure and oxidation behaviour of TiAl(Nb)/Ti2AlC composites fabricated by mechanical alloying and hot pressing. Bull. Mater. Sci. 2016, 39, 1–10. [Google Scholar] [CrossRef]
  70. Chen, G.H.; Suryanarayana, C.; Froes, F.H.S. Structure of mechanically alloyed Ti-Al-Nb powders. Metall. Mater. Trans. A 1995, 26, 1379–1387. [Google Scholar] [CrossRef]
  71. Nelson, D.R. Order, frustration, and defects in liquids and glasses. Phys. Rev. B 1983, 28, 5515–5535. [Google Scholar] [CrossRef]
  72. Li, F.; Liu, X.J.; Lu, Z.P. Atomic structural evolution during glass formation of a Cu–Zr binary metallic glass. Comput. Mater. Sci. 2014, 85, 147–153. [Google Scholar] [CrossRef]
  73. Gong, Z.Q.; Chen, Z.Y.; Chai, L.H. Thermodynamic properties of high niobium containing Ti-Al based alloy with erbium. Trans. Mater. Heat Treat. 2014, 2, 205–208. [Google Scholar]
  74. Miracle, D.B. A structural model for metallic glasses. Nat. Mater. 2004, 3, 697–702. [Google Scholar] [CrossRef] [PubMed]
  75. Wang, Q.; Li, J.H.; Liu, J.B. Structural skeleton of preferentially interpenetrated clusters and correlation with shear localization in Mg-Cu-Ni ternary metallic glasses. Phys. Chem. Chem. Phys. 2014, 16, 19590–19601. [Google Scholar] [CrossRef] [PubMed]
  76. Zhao, Y.Y.; Zhao, X. Structural relaxation and its influence on the elastic properties and notch toughness of Mg-Zn-Ca bulk metallic glass. J. Alloys Compd. 2012, 515, 154–160. [Google Scholar] [CrossRef]
  77. Louzguine-Luzgin, D.V.; Yavari, A.R.; Fukuhara, M. Free volume and elastic properties changes in Cu-Zr-Ti-Pd bulk glassy alloy on heating. J. Alloys Compd. 2007, 431, 136–140. [Google Scholar] [CrossRef]
  78. Open Visualization Tool. Available online: http://www.ovito.org/ (accessed on 30 January 2019).
  79. Wang, Q.; Li, J.H.; Liu, J.B. Favored Composition Design and Atomic Structure Characterization for Ternary Al−Cu−Y Metallic Glasses via Proposed Interatomic Potential. Phys. Chem. B 2014, 118, 4442–4449. [Google Scholar] [CrossRef] [PubMed]
Figure 1. Potential energies (solid line) as a function of lattice constant compared with the Rose equation (dash line).
Materials 12 00432 g001
Figure 2. The g(r) and 3D atomic position projections for (a,b) Ti5Nb90Al5 (crystalline state) and (c,d) Ti10Nb70Al20 (amorphous state), respectively.
Materials 12 00432 g002
Figure 3. The glass formation range/region (GFR) (inside the quadrilateral) of the Ti-Nb-Al system obtained from Molecular Dynamics (MD) simulations.
Materials 12 00432 g003
Figure 4. The amorphous driving force (eV/atom) of Ti-Nb-Al solid solutions in the predicted GFR. The black pentagram indicates the alloy with the largest glass-formation ability (GFA).
Materials 12 00432 g004
Figure 5. The distribution of Voronoi polyhedrons around Ti, Nb, and Al atoms in Ti15Nb45Al40 glassy alloy. (a) Ti-centered; (b) Nb-centered; (c) Al-centered.
Materials 12 00432 g005
Figure 6. The distribution of Voronoi polyhedrons around Ti, Nb, and Al atoms in Ti15Nb45Al40 glassy alloy. (ac) The distributions of total and partial CN in (TiNb3)1−xAlx (x = 80, 60, 40 at.%) metallic glasses. (df) The distributions of the dominant coordination polyhedrons centered on each unitized element.
Materials 12 00432 g006
Figure 7. The distribution of the nearest neighboring atoms around Ti, Nb, and Al in Ti15Nb45Al40 glassy alloy.
Materials 12 00432 g007
Figure 8. The distribution of connection factor Fmn among eight typical Voronoi clusters in Ti15Nb45Al40 glassy alloy.
Materials 12 00432 g008
Figure 9. The distribution of atomic volumes along z-, y-, and x-axis in Ti15Nb45Al40 glassy alloys, respectively.
Materials 12 00432 g009
Figure 10. The variation of atomic volume as Al concentration increasing in (TiNb3)1−xAlx alloys.
Materials 12 00432 g010
Figure 11. The variation of atomic volume as Al concentration increasing in (TiNb3)1−xAlx alloys.
Materials 12 00432 g011
Figure 12. The distribution of main Voronoi clusters in (TiNb3)1−xAlx glassy alloys.
Materials 12 00432 g012
Table 1. The potential parameters for the Ti-Nb-Al system.
Potential ParametersTi-TiNb-NbAl-AlTi-AlNb-AlTi-Nb
c0 (10−19 J/Åm)1.14613716.7217530.5583550.3090511.7207075.543857
c1 (10−19 J/Åm + 1)−1.417844−22.891094−0.621271−0.338078−2.09683−8.078405
c2 (10−19 J/Åm + 2)0.70051211.8083890.2597020.1406560.9517594.703939
c3 (10−19 J/Åm + 3)−0.159982−2.695603−0.047246−0.025314−0.188004−1.241254
c4 (10−19 J/Åm + 4)0.0142620.2287060.0031480.0016210.0134340.124878
α (10−19 J/Ån)0.056220−0.021740.0353110.0625660.0721460.108197
m444444
n686666
rc1 (Å)5.1712964.8027745.8269466.5511395.5259924.499325
rc2 (Å)6.9354796.8185737.2469087.0682356.4524696.567841
Table 2. The lattice constants (a), cohesive energies (Ec), bulk modulus (B0), and elastic constants (Cij) of hcp-Ti, fcc-Ti and bcc-Ti fitted from potential and obtained by experiments [49] or ab initio.
Physical Propertieshcp-Tifcc-Tibcc-Ti
FittedExperimentsFittedAb InitioFittedAb Initio
a or a, c (Å)2.836, 4.7082.951, 4.6844.0084.0973.2173.246
Ec (eV/atom)4.7894.8504.7904.7924.7694.738
C11 (Mbar)1.5531.6241.1771.4000.9620.986
C12 (Mbar)0.8870.9201.0940.9721.1261.150
C44 (Mbar)0.3920.4670.5300.5920.5800.454
C13 (Mbar)0.7450.690
C33 (Mbar)1.8621.807
B0 (Mbar)1.0801.0511.1221.1151.0711.096
Table 3. The lattice constants (a, c), cohesive energies (Ec), and bulk modulus (B0) of Ti-Nb hypothetical compounds fitted by the potential (first line) and calculated from ab initio (second line).
Physical PropertiesMethodsTiNb3TiNbTi3Nb
L12B2L12
a or a, c (Å)Fitted4.3133.3944.235
Ab initio4.1833.2634.123
Ec (eV/atom)Fitted6.6966.1245.447
Ab initio6.6666.1355.446
B0 (Mbar)Fitted1.1741.5061.244
Ab initio1.3461.3651.236
Table 4. The lattice constants (a, c), cohesive energies (Ec), and bulk modulus (B0) of Ti-Al hypothetical compounds fitted by the potential and calculated from ab initio (second line).
Physical PropertiesMethodsAlTi3AlTiAl3Ti
L12D019B2L12D022
a or a, c (Å)Fitted4.0475.691, 4.7013.1634.0303.961, 8.590
Ab initio4.4085.780, 4.6473.1863.9833.854, 8.584
Ec (eV/atom)Fitted4.7644.7164.3974.1594.105
Ab initio4.7524.7384.3904.1374.132
B0 (Mbar)Fitted1.2221.1141.0931.0900.970
Ab initio1.2141.1191.0981.0341.030
Table 5. The heat of formation for each sub-binary system in Ti-Nb-Al ternary system [73].
Binary SystemEnthalpy (KJ/mol)
Ti-Al−92.23
Ti-Nb1.30
Al-Nb−9.99

