Abstract
The tempcore process is implemented in rolling mills to produce high strength reinforcing steel. Besides being used as reinforcement, rebars are also used as the base material for the manufacturing of anchor bolts. The mechanical properties of reinforcement bars used in Europe are assessed in accordance with Eurocode without the recommendations for cast-in anchor bolts. The material properties of Tempcore rebars are not homogenous over the bar cross section. The European Assessment Document (EAD) for the cast-in anchor bolts does not exactly specify the mechanical properties of the thread part. The aim of these experiments is to show the different mechanical properties of rebars and their thread parts. The experiments were performed on rebars modified by peeling to characterize the reduction of diameter in a thread part. As a possible way to predict mechanical properties in a non-destructive way, the hardness tests were performed. Next, the application of the correlation relationship between hardness and tensile strength has been determined. The paper formulates preliminary recommendations for assessment of the cast-in anchor bolts in practice.
1. Introduction
The mechanical properties of reinforcement bars used in Europe are assessed in accordance with Table C.1 of EN 1992-1-1 [1] by characteristic values of yield strength, a minimum ratio ft/fy, and a minimum characteristic strain at maximum force εuk. Those characteristics are determined by destructive testing. As the ultimate limit state of reinforced concrete structures is most often characterized by development of plastic hinges, the three earlier mentioned characteristics are assumed to be enough to guarantee a ductile behaviour of the structure at the ultimate limit state (UTS). Besides being used as reinforcement, rebars are also used as the base material for the manufacturing of anchor bolts (see Table 3.1 of EN 1993-1-8 [2]). Such bolts are typically manufactured by peeling off the ribbed perimeter of the bar and cutting or rolling a thread on the bar. They are used to anchor concrete or steel connection for concrete structures (e.g., foundations, base columns, slabs, walls, and similar applications). Typically, the anchor bolts are either headed or straight. Headed bolts are used mainly in shallow structures for end anchoring, whereas the straight bolts are used for lap splices [3,4,5]. Each cast-in anchor bolt includes one nut and washer or two nuts and washers depending on the application, see Figure 1. One end is intended to be cast in concrete, while the opposite end is threaded and projects from the concrete. They are usually cast into reinforced concrete and transfer loads. In the absence of a European standard for anchor bolts, including the material recommendation, the structural performance of such bolts is assessed by destructive testing in accordance with the European Assessment Document (EAD) [6].
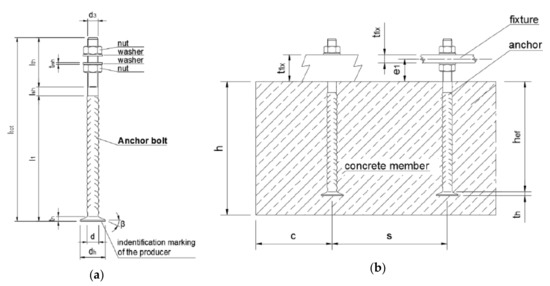
Figure 1.
Anchor system: (a) Anchor bolt and (b) use of anchor bolt.
The characteristic value of tensile resistance of anchor bolts under the static and quasi-static actions is determined in accordance with [6] as follows:
where As is the stress area of the thread and fuk refers to the characteristic tensile strength of the bolt.
2. Material Properties
The cast-in anchor bolts are mostly fabricated of ribbed bars with specifications according to Table 1. The majority of rebars available on the European market are manufactured by the Tempcore process. The Tempcore method was developed by the research centrum “Centre de Recherches Métallurgique” (CRM) in 1974 in Belgium [7]. This process increases the yield and ultimate tensile strength, ductility, and bendability of reinforcing bars. The process is divided into the three stages: (I) quenching of the surface layer, (II) self-tempering of the martensite, and (III) transformation of the core. The first stage consists of rapid cooling for a short time after the rebar leaving the last rolling stand. The surface layer of the bar is quenched into martensite and the core remains austenitic. The next stage is the tempering of the martensite layer, the heat releases from the core to the surface. The last stage is the transformation of the core from austenite into ferrite and perlite or into bainite, ferrite, and perlite. Therefore, three layers with different microstructural features (surface layer, transition layer, and core) can be observed in the cross section of the rebar. These three different layers have different mechanical properties. The ferrite is very ductile but soft and martensite is very hard but very brittle. Values of yield and ultimate strength in the outer layer are higher and they decrease gradually in the core [7,8,9]. The final microstructure depends on the chemical composition, bar diameter, rolling end temperature, and cooling intensity in the first stage [7,9,10,11]. The study [9] shows the changes in temperature within the reinforcing bar, which was cooled with the same water flow after reheating. According to this analysis, the temperature of 900 °C is recommended in the reheating process for the achievement of balanced mechanical properties. To obtain a homogenous Tempcore treatment, the intensity of cooling must be high enough to obtain a complete and regular martensite outer ring [12].

Table 1.
Specification for the cast-in anchor bolts [6].
The evaluation of mechanical properties of reinforcing bars is essential, especially in reinforced structures where inadequate design procedure may cause the risk of premature failure [13,14,15]. The non-standard bars manufactured with poor quality control have a yield strength often lower than minimum specific value [16,17]. The poor performance has serious aspects, especially for seismic applications. Research studies [18,19,20,21,22,23] have shown the effect of the strain rate on the tensile properties of the rebars with yield stresses ranging from 290 to 710 MPa. The ratio between ultimate tensile strength and yield stress decreases as the strain rate increases. The strain rate sensitivity decreases from the inner to the outer layers. The lower strength steel is more susceptible to strain rate effects compared to the higher strength steel.
3. Experimental Program
The European Assessment Document [6] for the cast-in anchor bolts does not exactly specify whether the characteristic yield strength (fyk > 500 MPa) should cover a nominal diameter of reinforcing bar or a thread diameter. Therefore, the experimental program has been focused on verification of mechanical properties depending on the shape of the reinforcing bars.
3.1. Experimental Procedure
In order to achieve a better understanding of mechanical properties of the individual layers, tensile tests and hardness tests were performed on the Tempcore rebars made of B500B. The experimental testing was divided into three steps:
Step 1: Tensile test of rebars produced by manufacturer A: ribbed steel bars (Tempcore bars) with three different diameters (25, 16, and 10 mm) were tested. The following series were tested for each diameter:
- Unmodified rebar
- Rebar with 1/6φ removed by peeling
- Rebar with 1/3φ removed by peeling
- Rebar with 2/3φ removed by peeling
Step 2: Tensile tests of 25 mm rebars produced by several manufacturers A, B, C, D, where mechanical properties of the supplementary layers of 1/24φ, 2/24φ, 3/24φ, 1/2φ, 3/4φ, and 4/5φ removed by peeling were verified.
Step 3: Vickers hardness tests of 25 mm rebars produced by several manufacturers A, B, C, D and rebars of a 16 mm (φ16A) and 10 mm (φ10A).
3.2. Tensile Test
Tensile tests were performed in accordance with standards EN ISO 6892-1 and EN ISO 15630-1 [24,25] using the tensile testing apparatus shown in Figure 2. Three identical samples of each specimen were tested. The original gauge length Lo of each sample followed the standard [24] was expressed as Lo = k , where k is a coefficient of proporcionality (k = 5.65). When the cross-sectional area of the test specimen is too small the higher value k = 11.3 is preferable. The original cross-sectional area So is the average cross-sectional area calculated from the measurements. The force was applied as axially as possible to minimize bending and did not exceed a value corresponding to 5% of the specified yield strength.
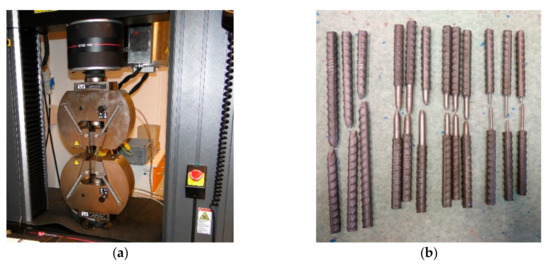
Figure 2.
Test procedure: (a) Testing machine and (b) rebars.
3.3. Hardness Test
The Vickers method of an identation hardness testing was chosen for determining the hardness of rebars and the assessment of correlation relationship between hardness and tensile strength. The hardness test was executed with an automatic machine Zwick/Roel ZHVμ-A according to EN ISO 6507-1 [26] on rebars in Figure 3. The measurements were performed in air at room temperature using the load of 500 gf for a holding time of 10 s. The largest and smallest values were discarded and then the average of the remaining values was obtained for evaluation.
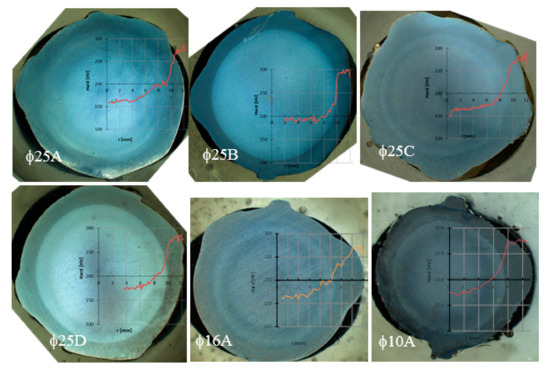
Figure 3.
Hardness measurements of different rebars.
4. Experimental Results and Discussion
4.1. Microstructures of Tested Rebars
The microstructure of the rebars was revealed for better understanding of the relationship between strength and hardness using a microscope Zeiss Axio Imager A1 (Jena, Germany). Each specimen was prepared using a standard metallographic procedure to minimize the damage in the microstructural preparation stage. The specimens were ground and polished with 1 µm diamond paste using Tegramin-30 (Struers) machine and etched with 2% Nital (2% HNO3 in ethanol). Figure 4 shows the microstructure of the cross section of rebar with a diameter of 25 mm. Near the surface, the microstructure consists of fine-grained tempered martensite. A mixture of ferrite and pearlite is in the core. The ferritic-pearlitic microstructure of the core is relatively coarse-grained and pearlite is present in both lamellar and partially decayed in globular form. Ferrite occurs also in the form of the Widmanstätten pattern resulting from the formation of a new phase along certain crystallographic planes of the parent solid solutions (austenite) in the orientation of the lattice in the parent phase. The Widmanstätten ferrite plates emanate from prior austenite grain boundaries into the remaining pearlitic-ferritic matrix.
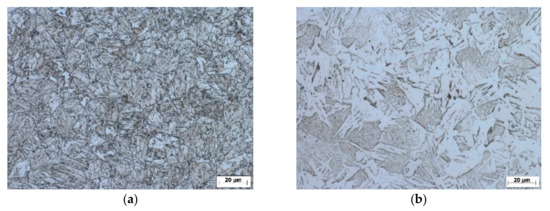
Figure 4.
Microstructure over the cross section of the Tempcore bar φ25 (a) surface and (b) core.
4.2. Assessment of Tensile Tests
The comparison of the mechanical properties over the cross section of the reinforcing bars with different diameters (φ25, φ16, φ10) is reported in Table 2. During the test, the yield strength fy and tensile strength ft were measured. The characteristic yield strength fyk (YS) and the tensile strength ftk (TS) were determined from three samples considering the 5%-fractile of the failure loads measured in the test. The fy,min is the minimum value of the YS in the test series. The ft,min is the minimum value of the TS in the test series.
Table 2.
Mechanical properties of tensile tests.
The cross section area of the unmodified rebar was expressed in two forms, the nominal cross section area (As) and the statically effective area (As,t). The nominal cross section area is the area of the reinforcing steel bar with taking the ribs into account. The statically effective area was applied only for the cross section of the steel bar without the ribs. The statically effective cross section area As,t was determined from the mass of the test piece, the length (one meter long), and from its density. Resulting in the calculation of the strength, the statically effective area may be used for better interpretation of the stress distribution.
The results from the tensile tests were used for determination of mechanical properties of individual layers (yield strength fy,i and tensile strength ft,i) shown in Table 2. The average mechanical properties of the reinforcement bars with diameter 25 mm (φ25A), through individual layers depending on the reinforcement radius are shown in Figure 5. The reinforcing steel achieves the YS in the core of 385 MPa and in the layer near the surface the YS ranges from 735 to 795 MPa. The TS measured in the core was approximately 524 MPa and in the layer near the surface the TS ranges from 794 to 809 MPa.
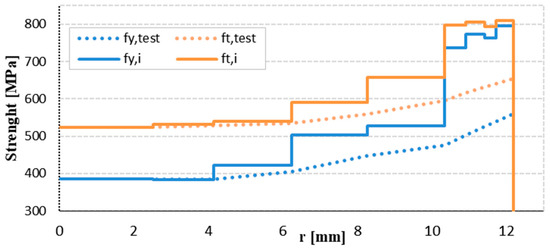
Figure 5.
The yield and tensile strength considering the layers (φ25A).
Figure 6 shows the measured values of YS and TS of the samples with basic diameter 25 mm (φ 25, producer A) depending on the modified diameter shape. The measured value of YS and TS has higher scatter in the core. The lowest values of YS and TS were observed at the core and the higher value at the surface layer. The bold numbers in Table 2 indicate the diameters of the core areas of threads M10, M16, and M24. The measurements show that with all the three diameters the TS at these diameters is higher than 550 MPa (value governing the tensile strength of the bolt in accordance with Equation (1)). The YS is lower than 500 MPa only in specimen φ25 A, Figure 7.
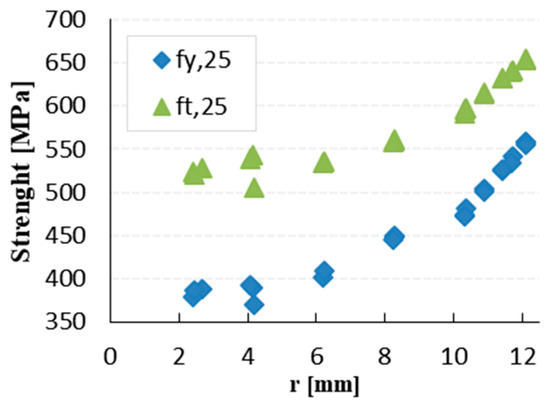
Figure 6.
The measured yield and tensile strength of the rebars φ25A.
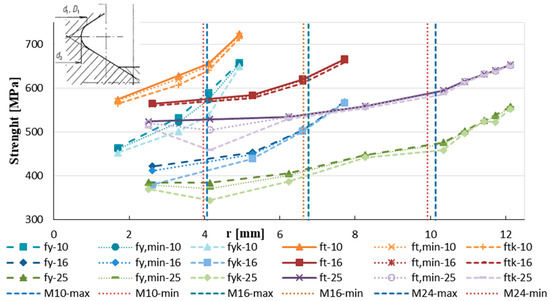
Figure 7.
The yield and tensile strengths of the steel bars φ25A, φ16A, φ10A.
Figure 8 illustrates the strain-hardening potential, the ratio of TS to YS (ft/fy). The ratio ranges between 1.1 (r/rt = 1.0) and 1.23 (r/rt = 0.35) for bars with diameter of 10 mm. The strain hardening for bars with diameter of 16 mm ranges from 1.17 (r/rt = 1.0) to 1.34 (r/rt = 0.34) and for bars with a diameter of 25 mm it ranges between 1.17 (r/rt = 1.0) and 1.36 (r/rt = 0.21). It is observed that strain hardening starts to increase in the modified shape of the rebar by peeling (high strain-hardening potential) compared to unmodified rebars. The strength is higher for specimens with a low value of TS/YS.
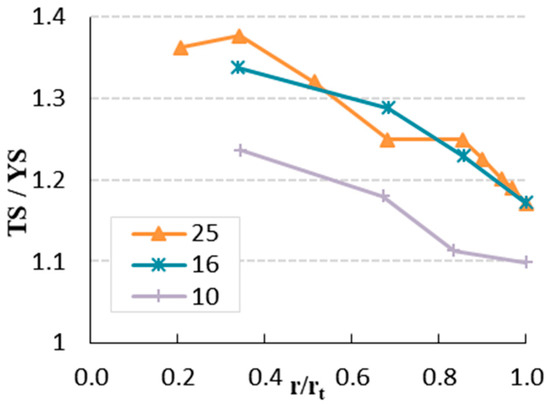
Figure 8.
Strain hardening of the rebars.
Similar conclusions can be made by evaluating the measurements done on samples B, C, D. Therefore, the next analysis was focused on the Tempcore bars with diameter of 25 mm intended to use for anchor bolts manufactured by several producer (A, B, C, D).
A nominal cross-sectional area (As) was considered in calculation of YS and TS of the whole ribbed rebars (fy, ft). The mechanical properties of the core were specified on the modified rebar with 1/3 of diameter (1/3d). The measured cross-sectional area was used by determination of the yield strength of the core fy,c and ultimate strength of the core ft,c. Table 3 shows the comparison of mechanical properties of the ribbed bars and the core of the bars.
Table 3.
Mechanical properties of the ribbed bars and the core.
The average YS of the core (fy,c) reaches about 72–80% of the average YS (fy) of the rebar with diameter 25 mm. The average TS in the core ranges between 81 and 91% of the average TS (ft). The ratio TS/YS, indicates the ductility capacity of the bar. The higher ratio is better for a structure to avoid failure. The actual TS/YS in the core (ft,c/fy,c) for rebars of 25 mm and 16 mm is more than recommended value of 1.25 [16]. It is observed that the TS of the core ft,c is very similar to YS of the nominal cross section of the rebars with diameters of 25 mm and 16 mm. Further, this assumption should be used for estimating strength of a core, or determination of YS of the reinforcing bar. For a conservative approach, it would be possible to consider ultimate tensile strength fuk equals to ft,c ≈ fyk according to the relation (1) of this work. More extensive research is needed to confirm this hypothesis.
4.3. Assessment of Hardness Test
Figure 9 shows the hardness profiles of specimens with diameter of 25 mm manufactured by several producers and typical hardness profiles of specimen of 25, 16, 10 mm (producer A). The hardness of rebars with diameters of 25 mm has a value of 155 HV in the core and maximum 301 HV in the surface layer. From the results observation and comparison, it is clear that the Tempcore rebar consists of three layers (soft core, transition layer, and hard surface layer). The surface layer is about 50% harder than the core of rebars with diameter of 25 mm.
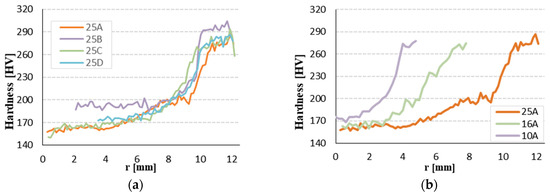
Figure 9.
Hardness measurements: (a) different producer φ25 mm and (b) φ10, 16, 25 mm rebar.
Several hardness conversion formulas had been published to estimate the yield strength fy [27,28,29,30,31,32,33]. Other authors supposed the proportional relationship between ultimate tensile strength fu and the Vickers hardness number HV for materials with approximately the same modulus of elasticity [29,30,31]. A reasonable prediction of UTS (fu) may be obtained using the relation:
where k is a proportional characteristic constant, and HV is hardness. The coefficient k is dependent on the type of metal [8]. For many types of steel, the coefficient k is about 3.0 [28,31].
fu = k HV
According to [30,32] the ratio of hardness to UTS is lower than 3 in the materials with good ductility. Generally, according to [28], Equation (3) can be used to determine the UTS for quenching steel and Equation (4) for annealed steels:
where HV is the Vickers Hardness number.
fu (I) = 3.2 × HV − 19.923
fu (II) = 3.6655 × HV – 42.527
Based on the tensile and yield strength considering the layers measured on specimens with 25 mm diameter and hardness test (Figure 9a), the formulas for yield and tensile strength were expressed by regression analysis. The least-squares linear regression gives the correlation for TS according the Equation (5), where the correlation coefficient attains the value R2 = 0.9927:
fu (III) = 2.4389 × HV + 131.75
A least-squares linear regression gives the correlation for yield strength of rebar (25 mm) according to Equation (6):
fy (IV) = 3.4803 × HV − 190.59
The correlation coefficient is R2 = 0.9816.
Figure 10 shows the relationship between TS and HV according to Equations (3) and (4) considering the measured value on rebars φ25. The curves (III) and (IV) represent a linear approximation between hardness and tensile strength (yield strength). The tempcore steel with 25 mm diameter achieves higher strength at a lower hardness level and lower strength value at higher hardness level compared to the conversation Equation (3).
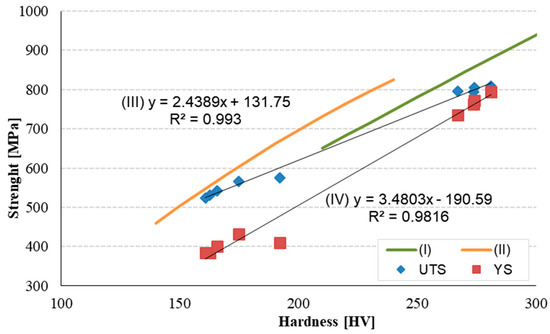
Figure 10.
Mechanical properties as a function of hardness (HV).
Figure 11 shows the TS and YS as a function of hardness according to Equations (3)–(6) from the core to the surface of the φ25 mm rebar. The fu,i represents the TS of the individual layers of the cross section and fy,i shows the YS of the individual layers from tensile test (Figure 5). It is noted that in the core the strength is practically constant.
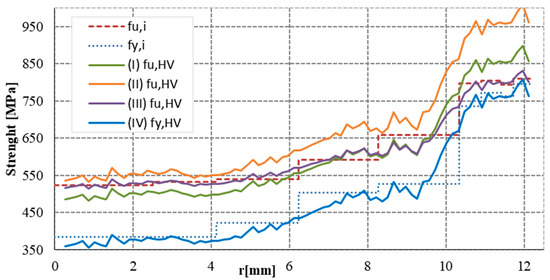
Figure 11.
Tensile and yield strength as a correlation from hardness test across the bar (φ25 mm).
Finally, Table 4 presents the comparison of YS and TS obtained from the tensile test and the anticipated values calculated from measured value of hardness fu(I–IV). The approximation curve of the n-th degree was applied at specific points of the obtained strength. The linear and polynomial functions were used to approximate the function for each series. The Equation (5) reflect the better dependence between the HV and TS using a polynomial function. On the other hand, a linear function has proved better compliance for YS defined according to Equation (6).
Table 4.
Comparison of mechanical properties as a function of hardness and tensile testing.
The average yield strength of the thread core was determined by integrating YS from hardness. The yield strength was calculated for the maximum (d3,max) and minimum (d3,min) diameters of the thread. Table 5 shows the comparison of YS between bars with diameters of 10 mm, 16 mm, and 25 mm and different producers (25 A, B, C, D). The yield strength values in thread cores of rebars with 25 mm diameter are lower than requirements in EAD [6].
Table 5.
The yield strength of thread core.
5. Conclusions
The paper presents a verification of mechanical properties of Tempcore rebars modified by peeling. The goal is to characterize the effect of the reduction of rebar diameter on the mechanical properties of cast-in anchor bolts. Based on the experimental results and data presented in the above sections, the following conclusions can be drawn:
- (1)
- The tensile strength of all tested rebars modified by peeling is higher than 550 MPa. It is thus appropriate to calculate the characteristic value of resistance of the thread using the characteristic value of tensile strength of the base material B500B (fuk = 550 MPa).
- (2)
- The yield strength of tested rebars with diameter 25 mm modified by peeling is slightly lower than 500 MPa. The reduction of strength after peeling is probably related to the microstructure of the rebar. Such reduction does not penalize the structural performance of the anchor bolt, as the tensile capacity of the thread is derived from the tensile strength and not the yield strength of the material of the thread.
- (3)
- The experiment shows that the Vickers hardness test is an appropriate method for the prediction of mechanical properties of reinforcement bars, but with less accuracy than the tensile tests. According to experiment, it is possible to derive an empirical relationship between HV and TS with an accuracy of ±12%.
- (4)
- In practice, Tempcore rebars are suitable for the manufacturing of cast-in anchor bolts. Of course, the mechanical properties of such anchor bolts have to be confirmed by a continuous quality control performed by the manufacturers.
Author Contributions
F.B. performed the experiments and analysed the data from the tensile testing; P.B. designed the experiments and wrote the paper; L.H. offered advice in analysing of hardness test; P.K. offered advice and supervision; F.N. performed the hardness testing and metallography analysis.
Funding
This research was supported by the Slovak Research and Development Agency under contract No. APVV-14-0772, and by Research Project No. 1/0413/18 and No. 1/0343/18 of the Slovak Grant Agency.
Conflicts of Interest
The authors declare no conflict of interest.
References
- EN 1992-1-1. Eurocode 2. Design of Concrete Structures—Part 1-1: General Rules and Rules for Building; CEN: Brussels, Belgium, 2015. [Google Scholar]
- EN 1993-1-8. Eurocode 3. Design of Steel Structures. Part 1-8: Design of Joints; CEN: Brussels, Belgium, 2007. [Google Scholar]
- Fib Bulletin no. 58. In Design of Anchorages in Concrete; fib CEB-FIB: Lausanne, Switzerland, 2011.
- HPM Rebar Anchor Bolts. Technical Manual; Peikko group: Lahti, Finland, 2015. [Google Scholar]
- Bujňák, J.; Farbák, M. Tests of Short Headed Bars with Anchor Reinforcement Used in Beam-to-Column Joints. Aci. Struct. J. 2018, 15, 203–210. [Google Scholar] [CrossRef]
- EAD 330924-00-0601. Cast-in Anchor Bolt of Ribbed Reinforcing Steel; EOTA: Brussels, Belgium, 2018. [Google Scholar]
- Simon, P.; Economopoulos, M.; Nilles, P. Tempcore a new process for the production of high-quality reinforcing bars. Iron. Steel Eng. 1984, 61, 53–57. [Google Scholar]
- Rehm, G.; Russwurm, D. Assessment of concrete reinforcing bars made by the Tempcore process of Concrete. CRM Revue. 1977, 51, 1–16. [Google Scholar]
- Nino, O.; Martinez, D.; Lizcano, C.; Guerrero-Mata, M.; Colás, R. Study of the Tempcore process for the Production of High Resistance Reinforcing Rods. Mater. Sci. Forum 2007, 537–538, 533–540. [Google Scholar] [CrossRef]
- Cadoni, E.; Dotta, M.; Forini, D.; Tesio, N.; Albertini, C. Mechanical behaviour of quenched and self-tempered reinforcing steel in tension under high strain rate. Mater. Des. 2013, 49, 657–666. [Google Scholar] [CrossRef]
- Nikolaou, J.; Papadimitriou, G.D. Microstructures and mechanical properties after heating of reinforcing 500 MPa class weldable steels produced by various processes. Construc. Build. Mater. 2004, 18, 243–254. [Google Scholar] [CrossRef]
- Noville, J.F. TEMPCORE, the most convenient process to produce low cost high strength rebars form 8 to 75 mm. In Proceedings of the METEC and 2nd ESTAT, Dusseldorf, Germany, 15–19 June 2015. [Google Scholar]
- Foraboschi, P. Versatility of steel in correcting construction deficiencies and in seismic retrofitting of RC buildings. J Build. Eng. 2016, 8, 107–122. [Google Scholar] [CrossRef]
- Foraboschi, P. Structural layout that takes full advantage of the capabilities and opportunities afforded by two-way RC floors, coupled with the selection of the best technique, to avoid serviceability failures. Eng. Fail. Anal. 2016, 70, 387–418. [Google Scholar] [CrossRef]
- Madias, J.; Wright, M.; Behr, G.O.; Valladares, V. Analysis of International Standards on Concrete-reinforcing Steel Bar. AIStech Proc. 2017, 2505–2515. [Google Scholar] [CrossRef]
- Beeby, A.W. Ductility in reinforced concrete: Why is it needed and how is it achieved? Struct. Eng. 1997, 75, 311–318. [Google Scholar]
- Ede, N.A.; Olofinnade, M.O.; Joshua, O. Experimental Investigation of Yield Strength of Steel Reinforcing Bar Used in Nigerian Concrete Structures. Int. J. Sci. Eng. Res. 2014, 5, 76–83. [Google Scholar]
- Economopoulos, M.; Respen, Y.; Lessel, G.; Steffes, G. Application of the tempcore Process to the fabrication of High Yield Strength Concrete—Reinforcing Bars. CRM 1975, 45, 3–19. [Google Scholar]
- Malvar, L.J. Review of static and dynamic properties of steel reinforcing bars. Aci. Mater. J. 1998, 95, 609–616. [Google Scholar]
- Zheng, H.; Abel, A.A. Fatigue properties of reinforcing steel produced by Tempcore process. J. Mater. Civ. Eng. 1999, 11, 158–165. [Google Scholar] [CrossRef]
- Lin, F.; Dong, Y.; Kuang, X.; Lu, L. Strain Rate Behavior in Tension of reinforcing Steels HPB235, HDB335, HRB400, and HRB500. Materials 2016, 9, 1013. [Google Scholar] [CrossRef] [PubMed]
- Mainstone, R.J. Properties of materials at high rates of straining or loading. Mater. Constr. 1975, 8, 102–116. [Google Scholar] [CrossRef]
- Santos, J.; Henriques, A.A. Strength and Ductility of Damaged Tempcore Rebars. Proc. Eng. 2015, 114, 800–807. [Google Scholar] [CrossRef][Green Version]
- EN ISO 6892-1. Metallic Materials—Tensile testing—Part 1: Method of Test at Room Temperature; CEN: Brussels, Belgium, 2016. [Google Scholar]
- EN ISO 15630-1. Steel for the Reinforcement and Prestressing of Concrete. Test Methods. Part 1: Reinforcing Bars, Wire Rod and Wire; CEN: Brussels, Belgium, 2012. [Google Scholar]
- EN ISO 6507-1. Metallic Materials—Vickers Hardness Test. Part 1: Test Method; IOS: Geneva, Switzerland, 2005. [Google Scholar]
- ASM Handbook Committee. Metals Handbook, 9th ed.; Mechanical Testing; American Society for Metals: Russell Township, OH, USA, 1985; Volume 8. [Google Scholar]
- EN ISO 18265. Metallic Materials—Conversion of Hardness Values; ISO: Geneva, Switzerland, 2014. [Google Scholar]
- Arbtin, E., Jr.; Murphy, G. Correlation of Vickers Hardness Number, Modulus of Elasticity, and the Yield Strength for Ductile Metals; Ames Laboratory ISC Technical Reports 50: Ames, IA, USA, 1953. [Google Scholar]
- Gaško, M.; Rosenberg, G. Correlation between hardness and tensile properties in ultra-high strength dual phase steels-short communication. Mater. Eng. 2011, 18, 155–159. [Google Scholar]
- Tekkaya, E.A. Improved relationship between Vickers hardness and yield stress for cold formed materials. Steel Res. 2001, 72, 283–321. [Google Scholar] [CrossRef]
- Zhang, P.; Li, Y.F.; Yhang, Y.F. General relationship between strength and hardness. Mater. Sci. Eng. A 2011, 529, 62–73. [Google Scholar] [CrossRef]
- Pavlina, E.J.; Van Type, C.J. Correlation of Yield Strength and Tensile Strength with Hardness for Steels. Mater. Eng. Perform 2008, 17, 888–893. [Google Scholar] [CrossRef]
© 2019 by the authors. Licensee MDPI, Basel, Switzerland. This article is an open access article distributed under the terms and conditions of the Creative Commons Attribution (CC BY) license (http://creativecommons.org/licenses/by/4.0/).