Single Step Process for Crystalline Ni-B Compounds


Abstract
1. Introduction
2. Materials and Methods
2.1. Boride Synthesis
2.2. Characterization
3. Results
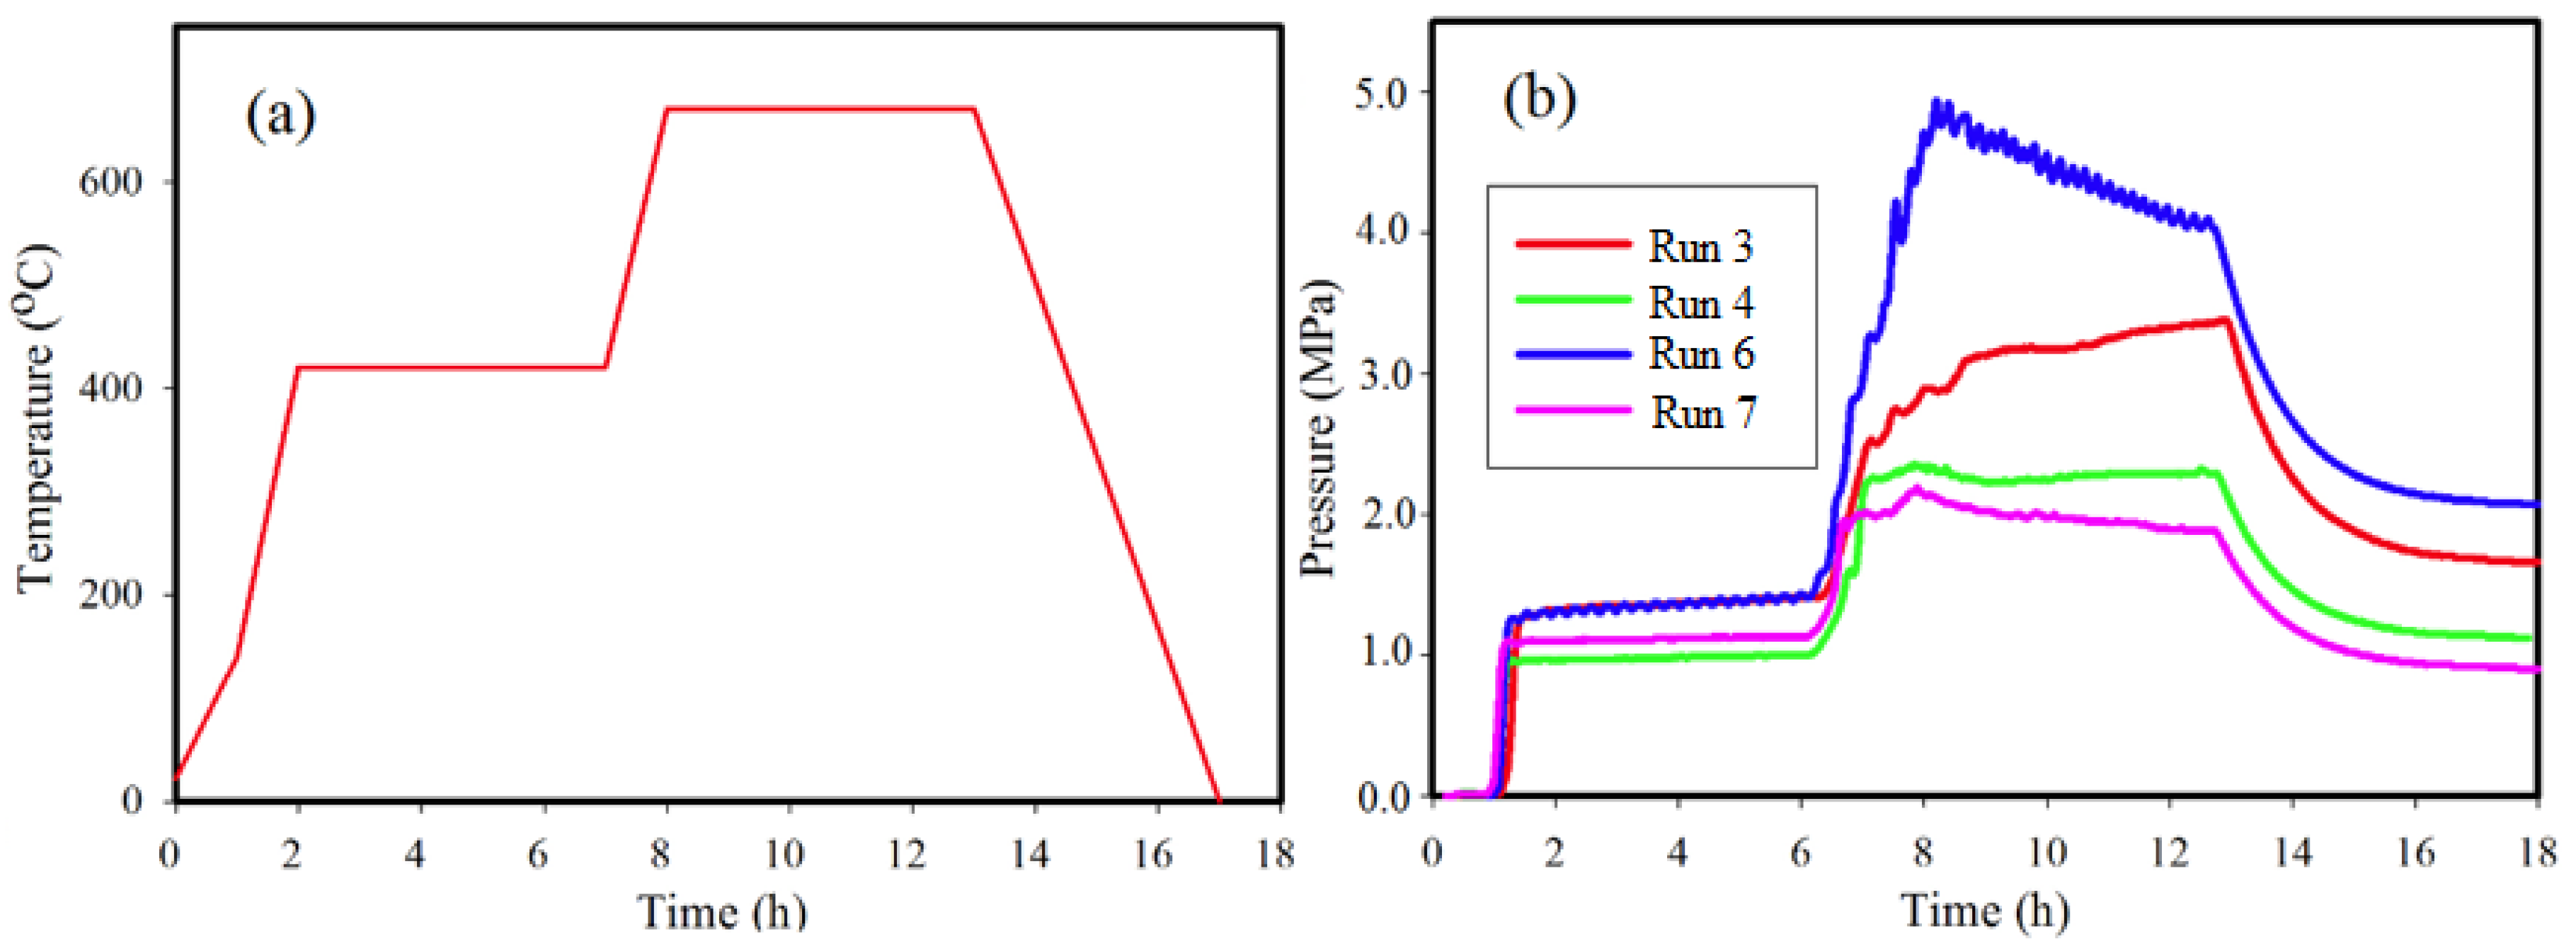
3.1. Synthesis
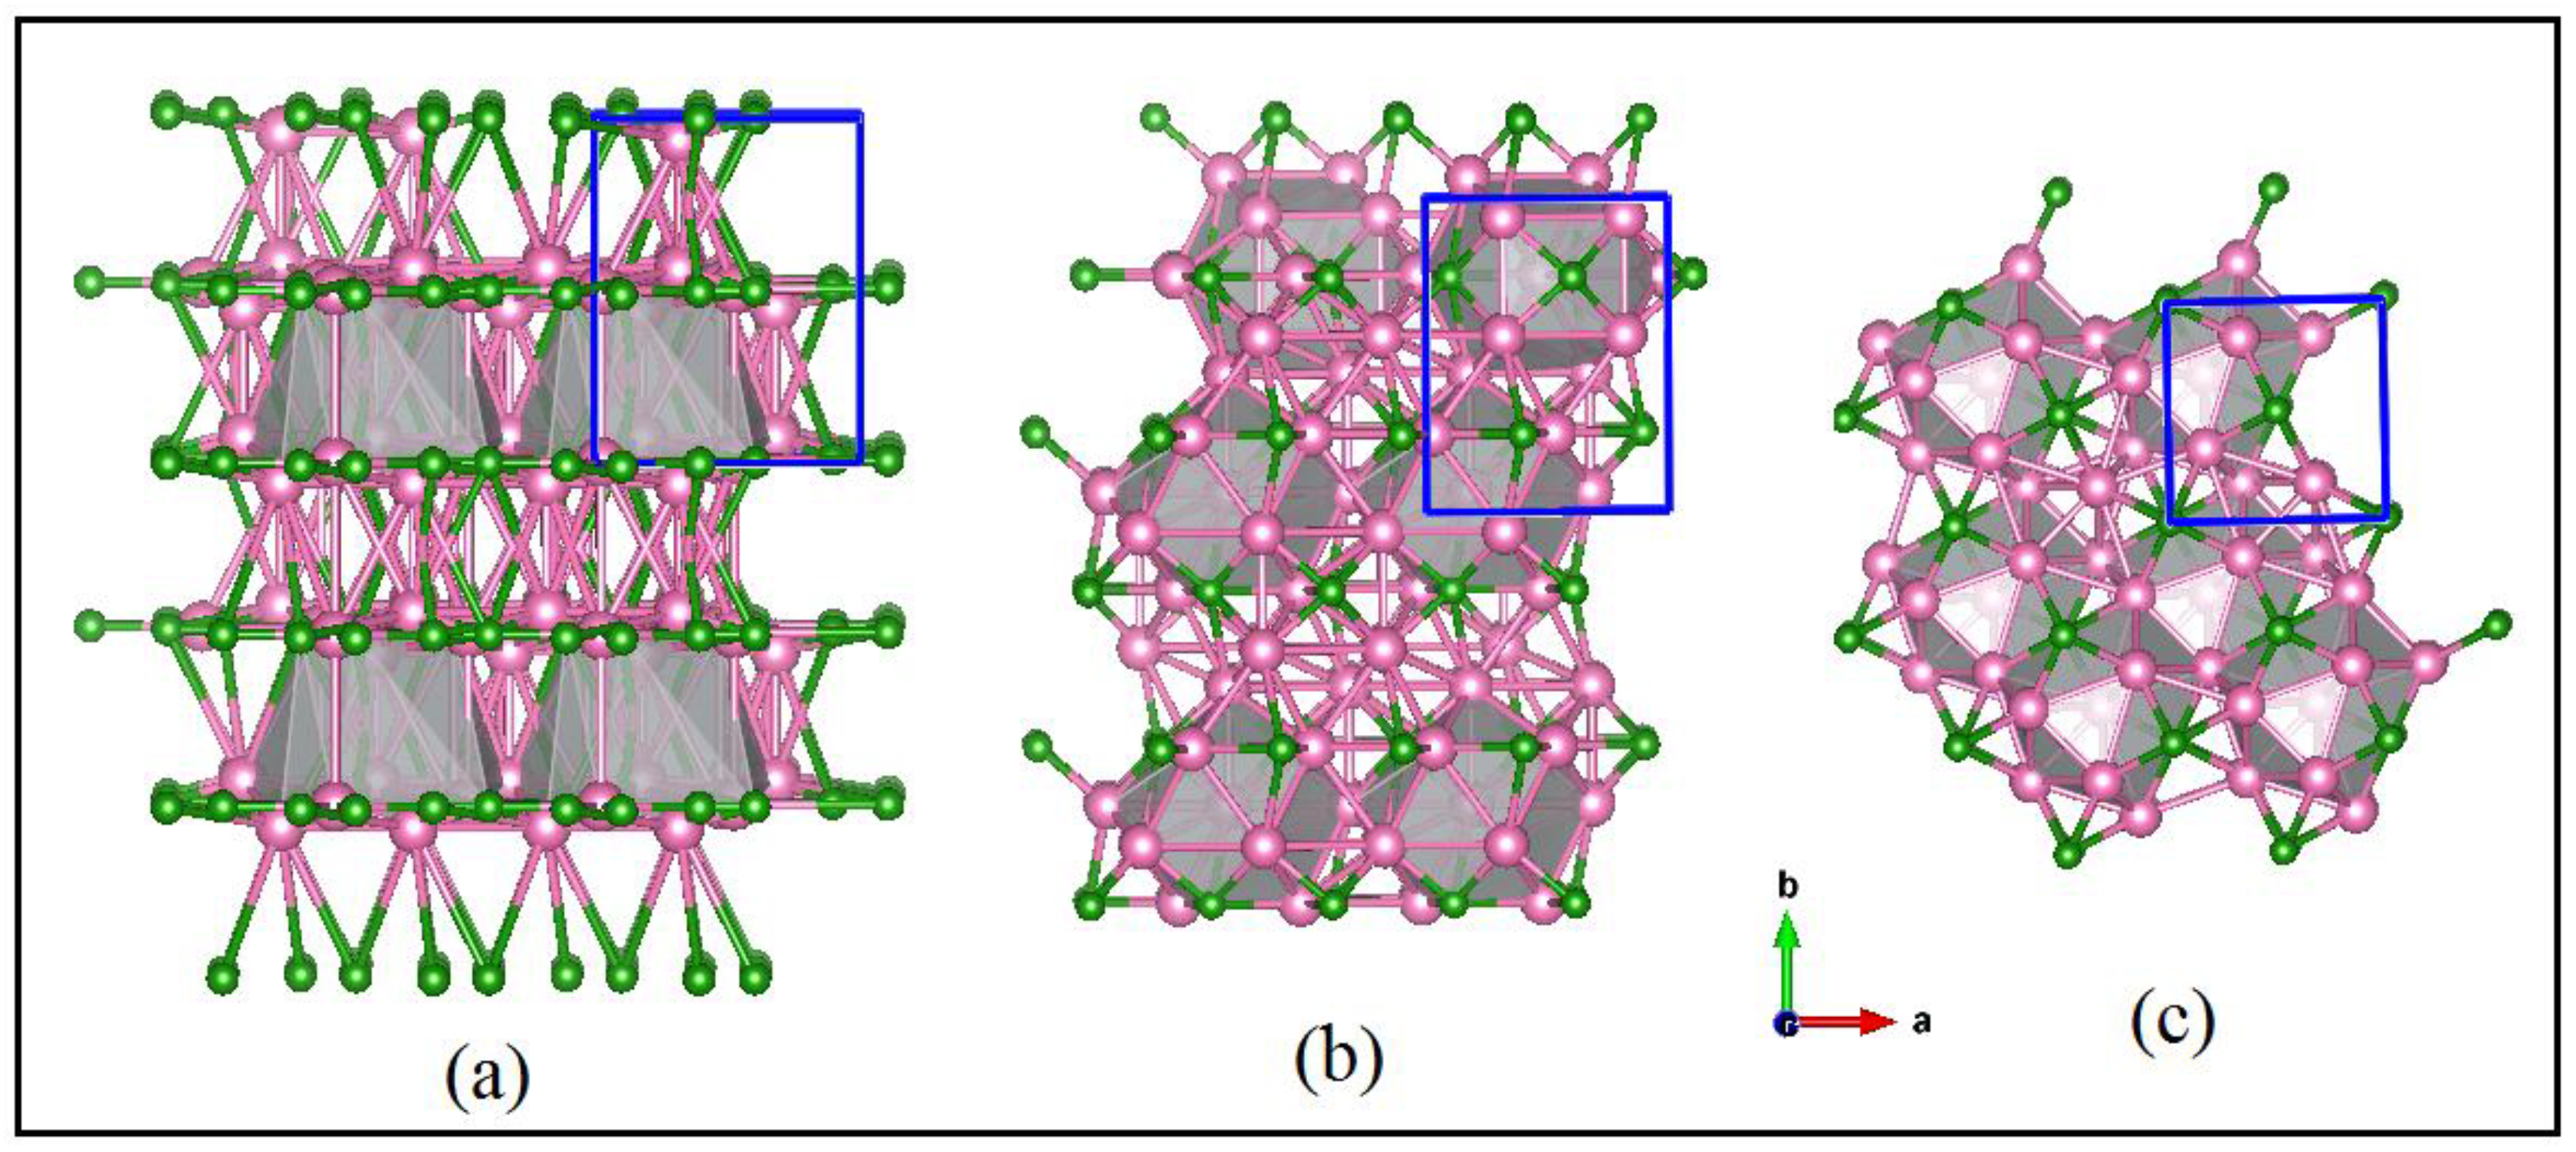
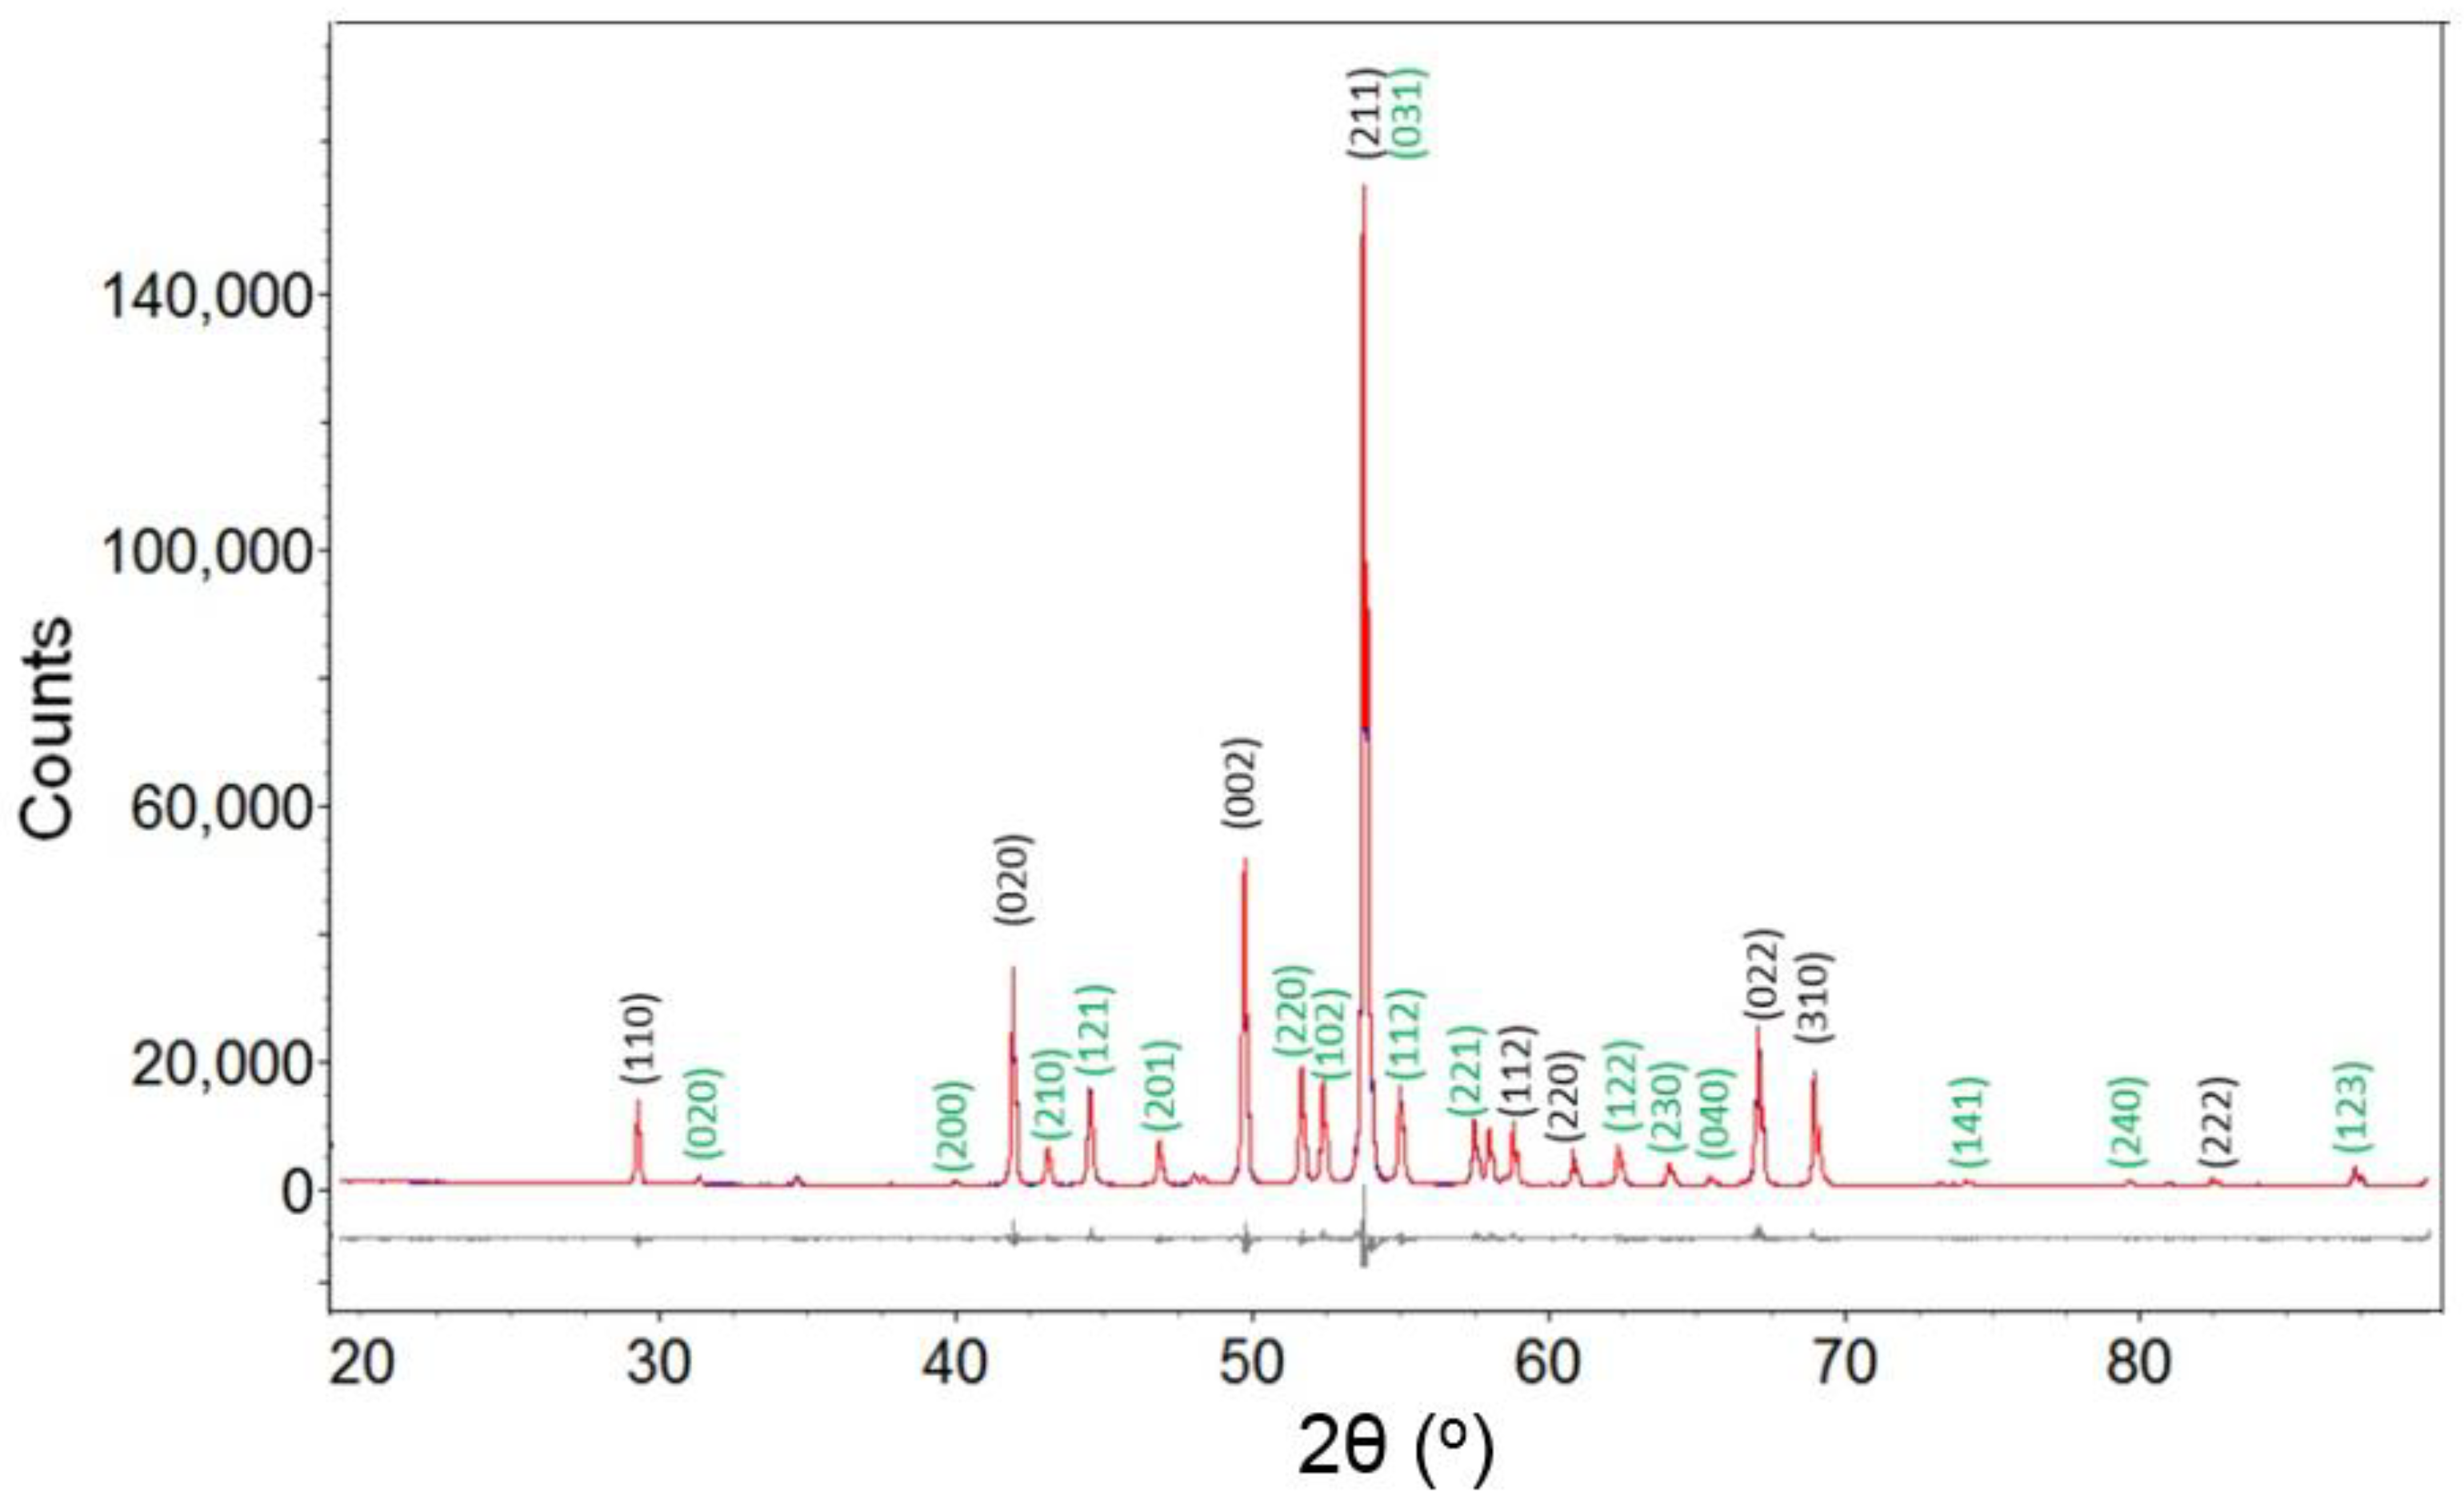
3.2. Structural Analysis
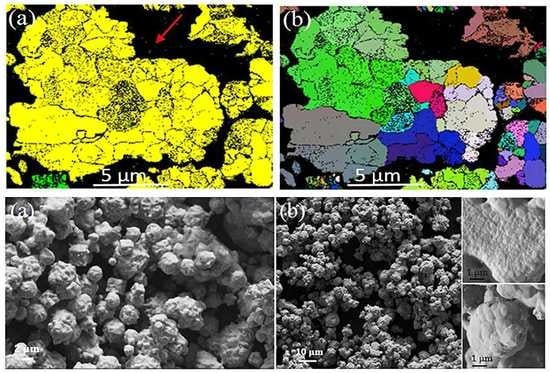
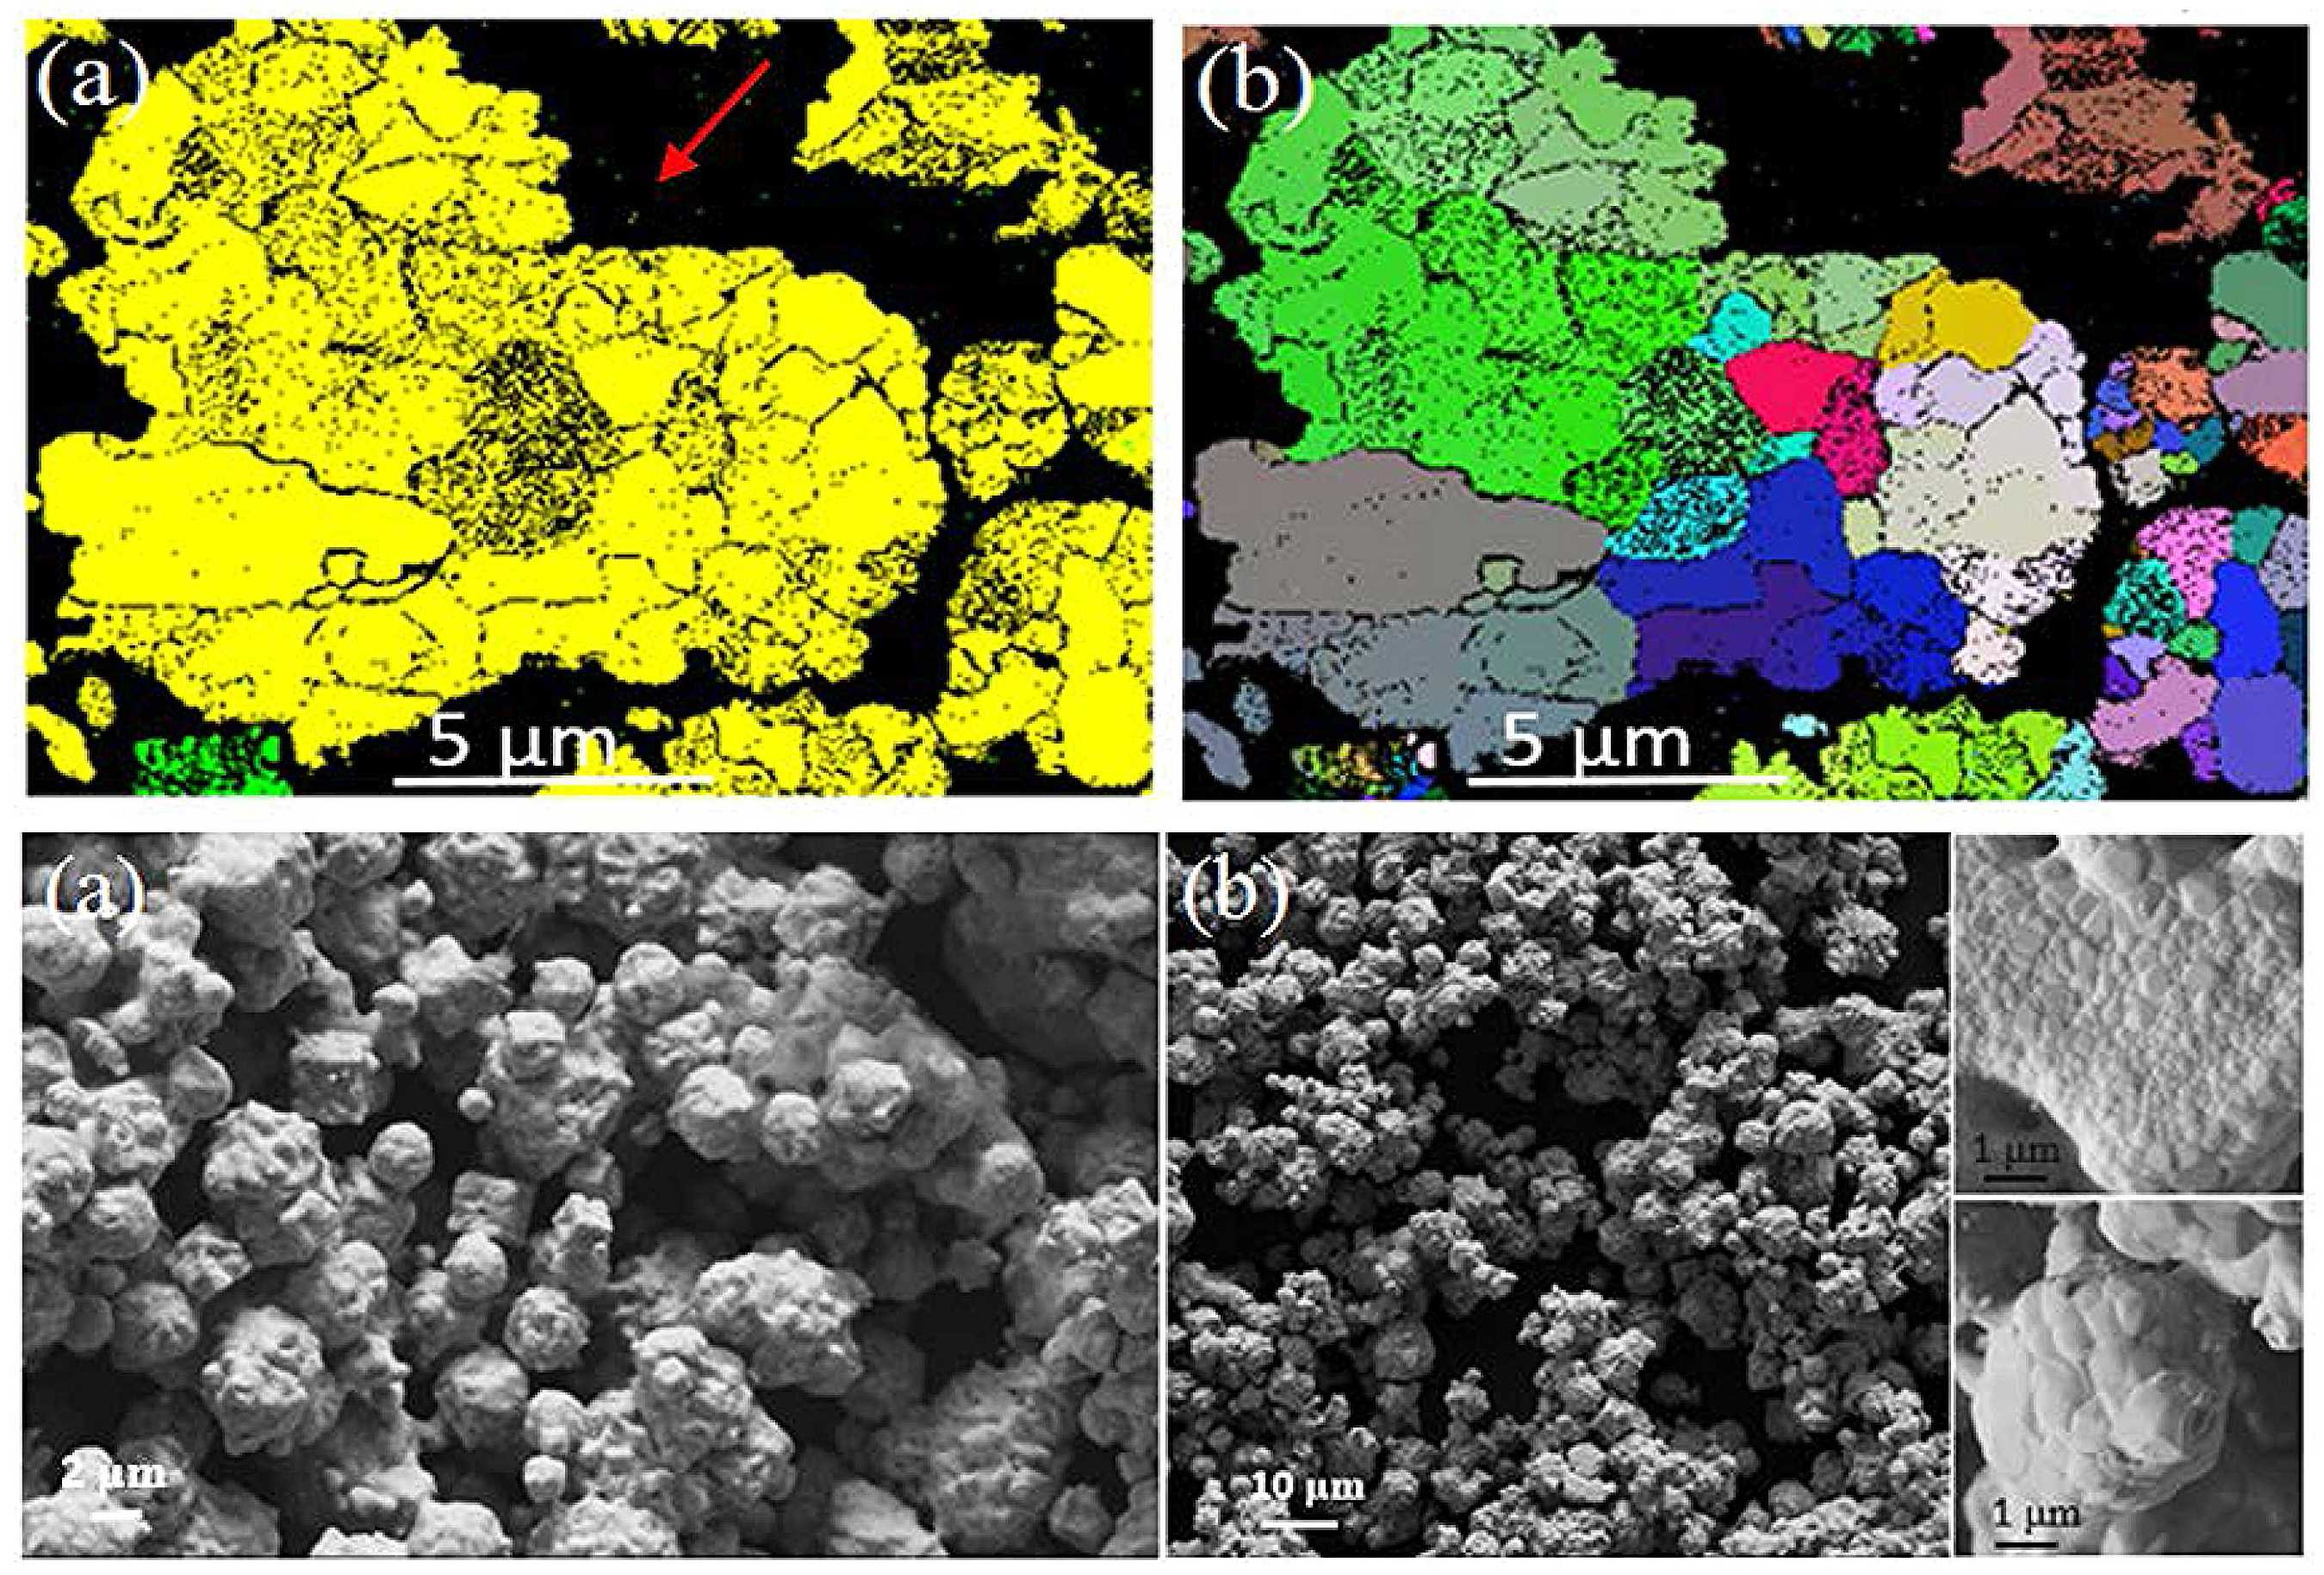
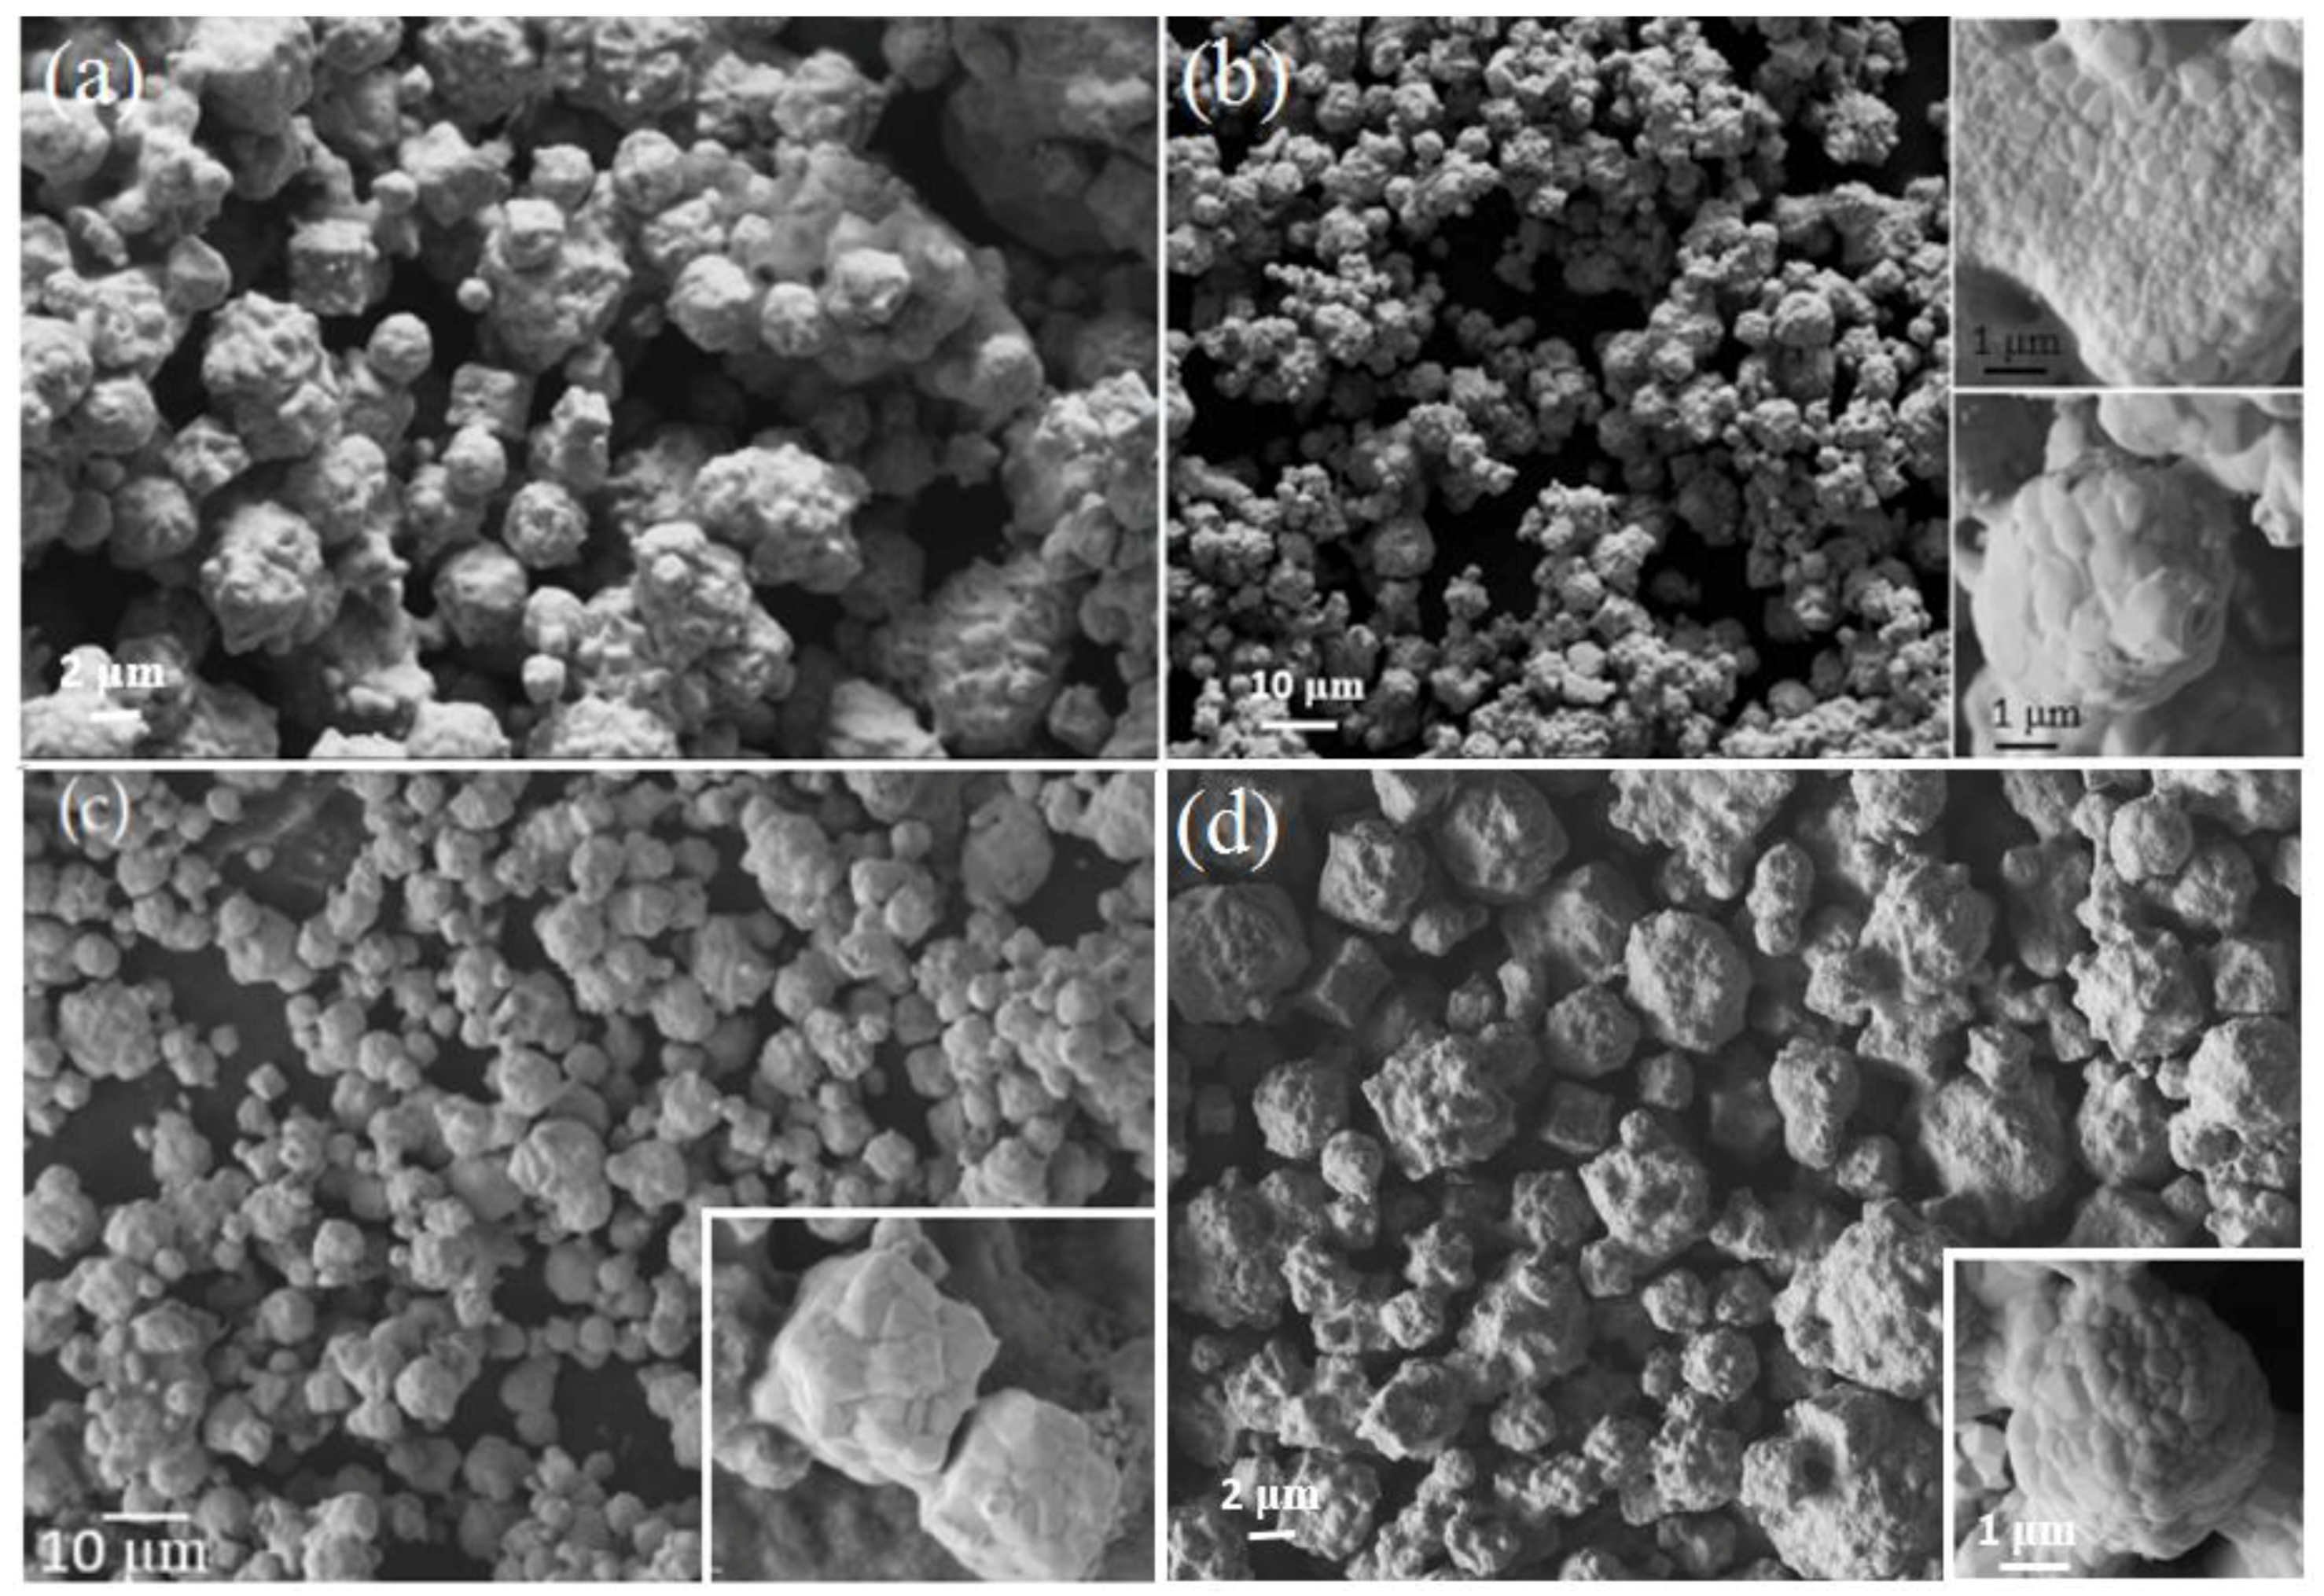
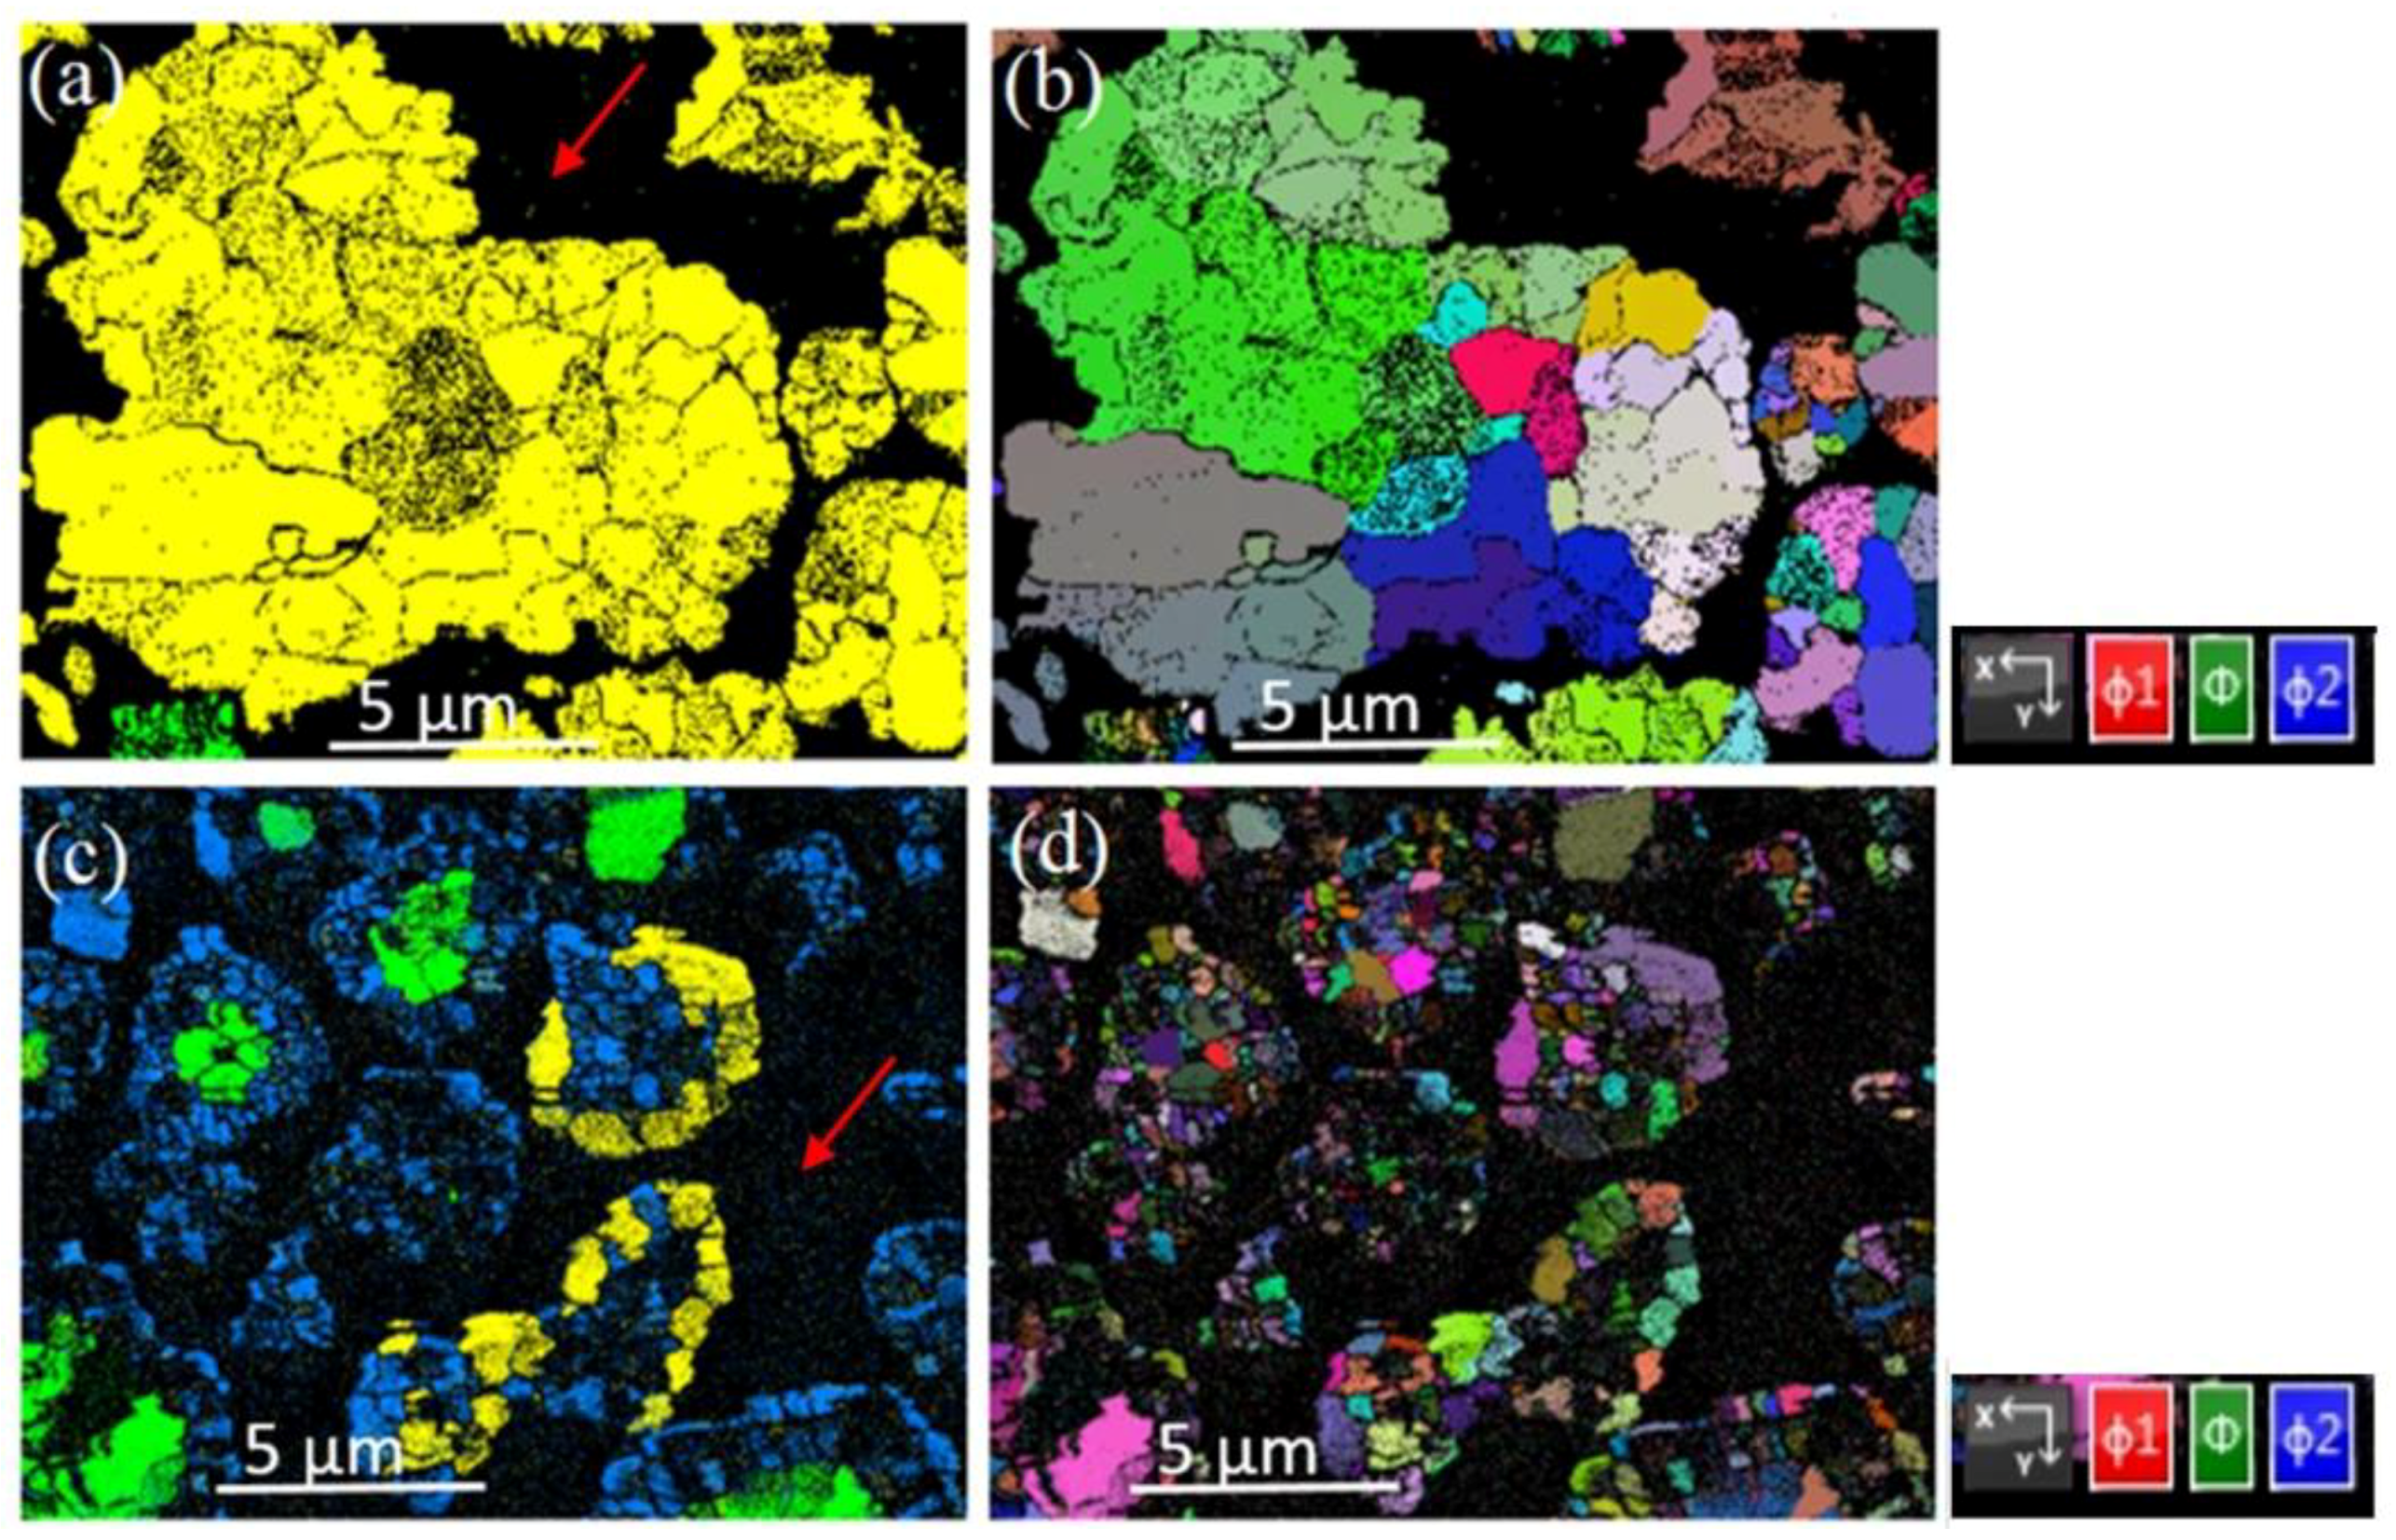
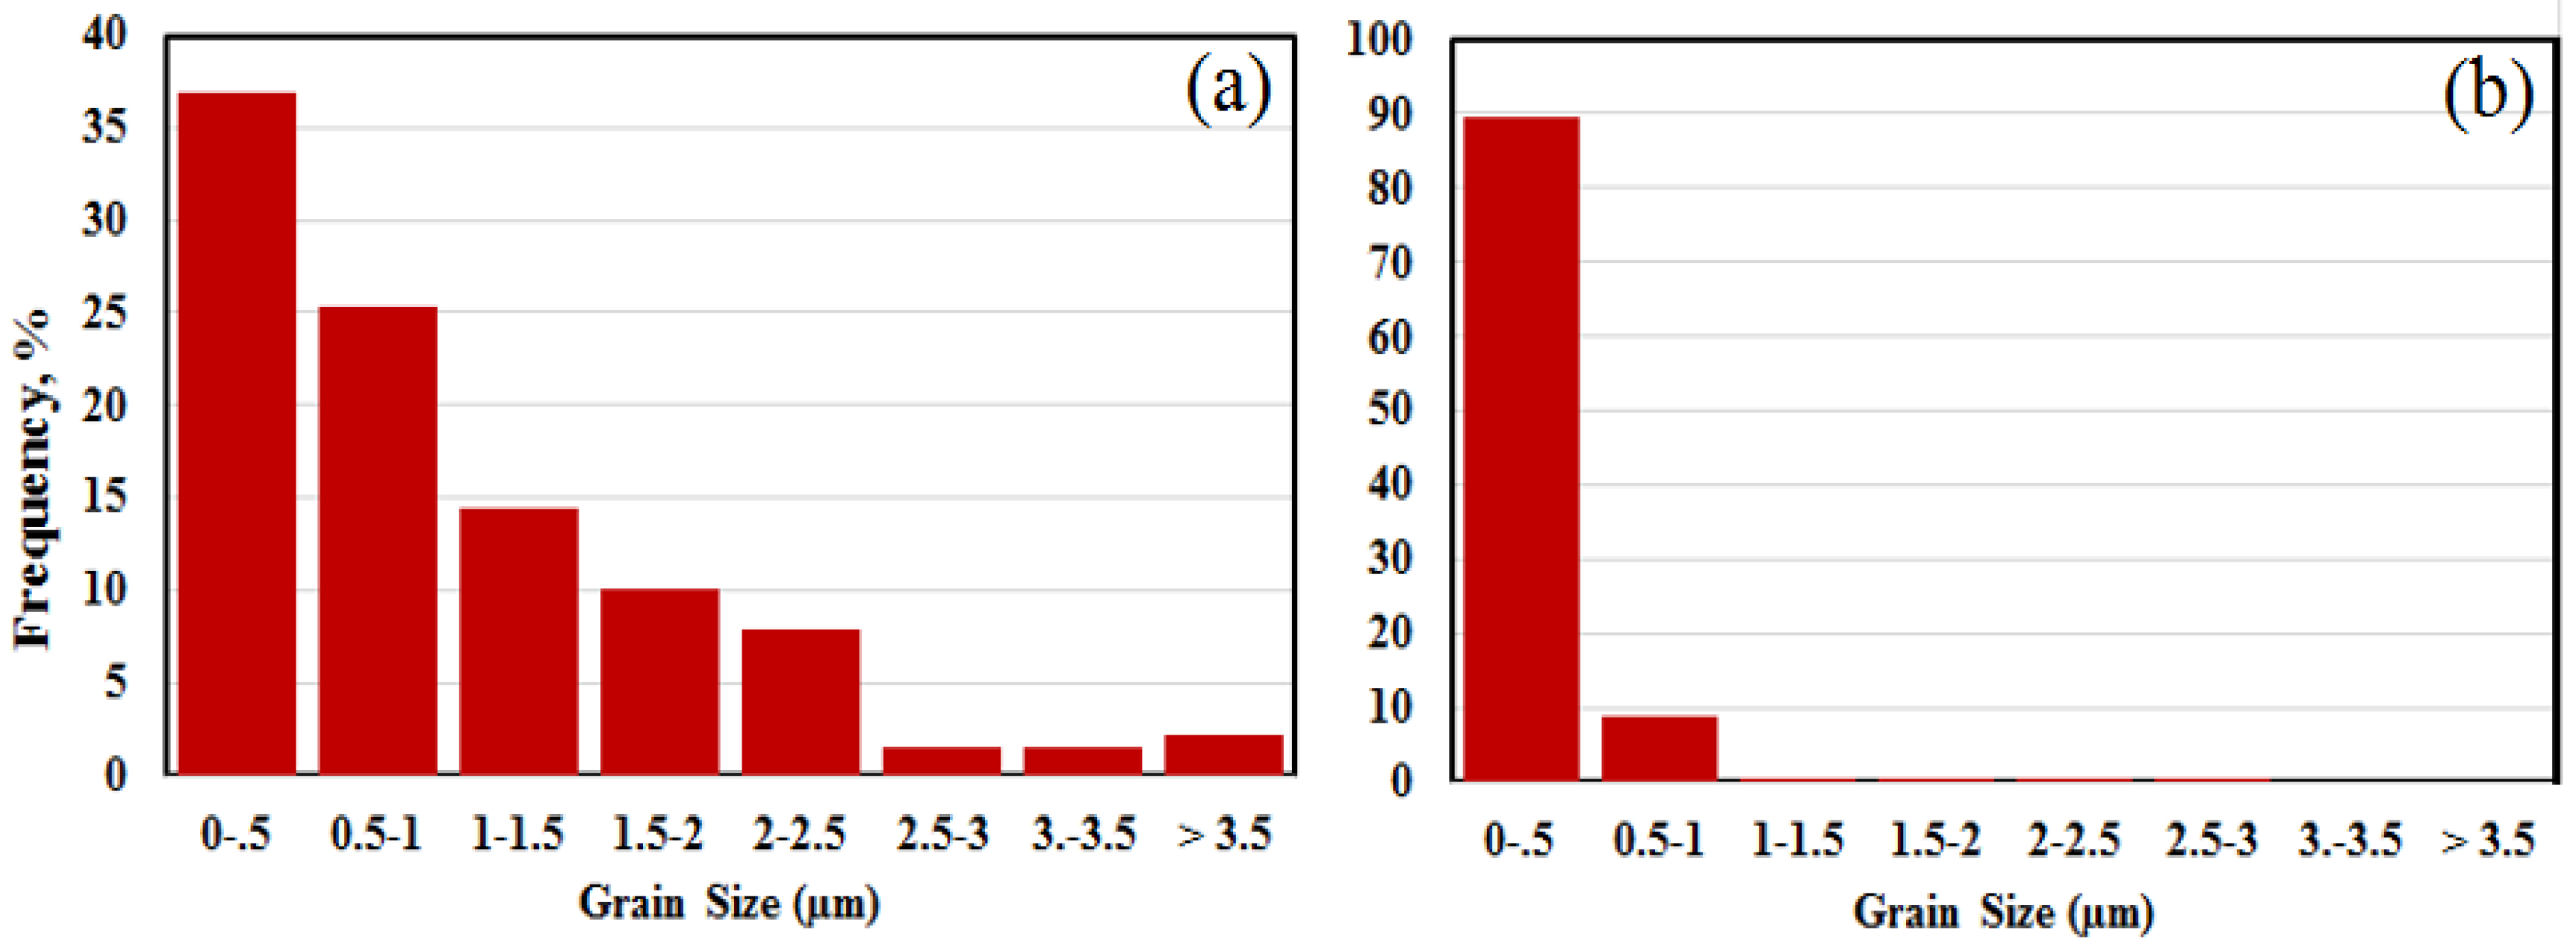
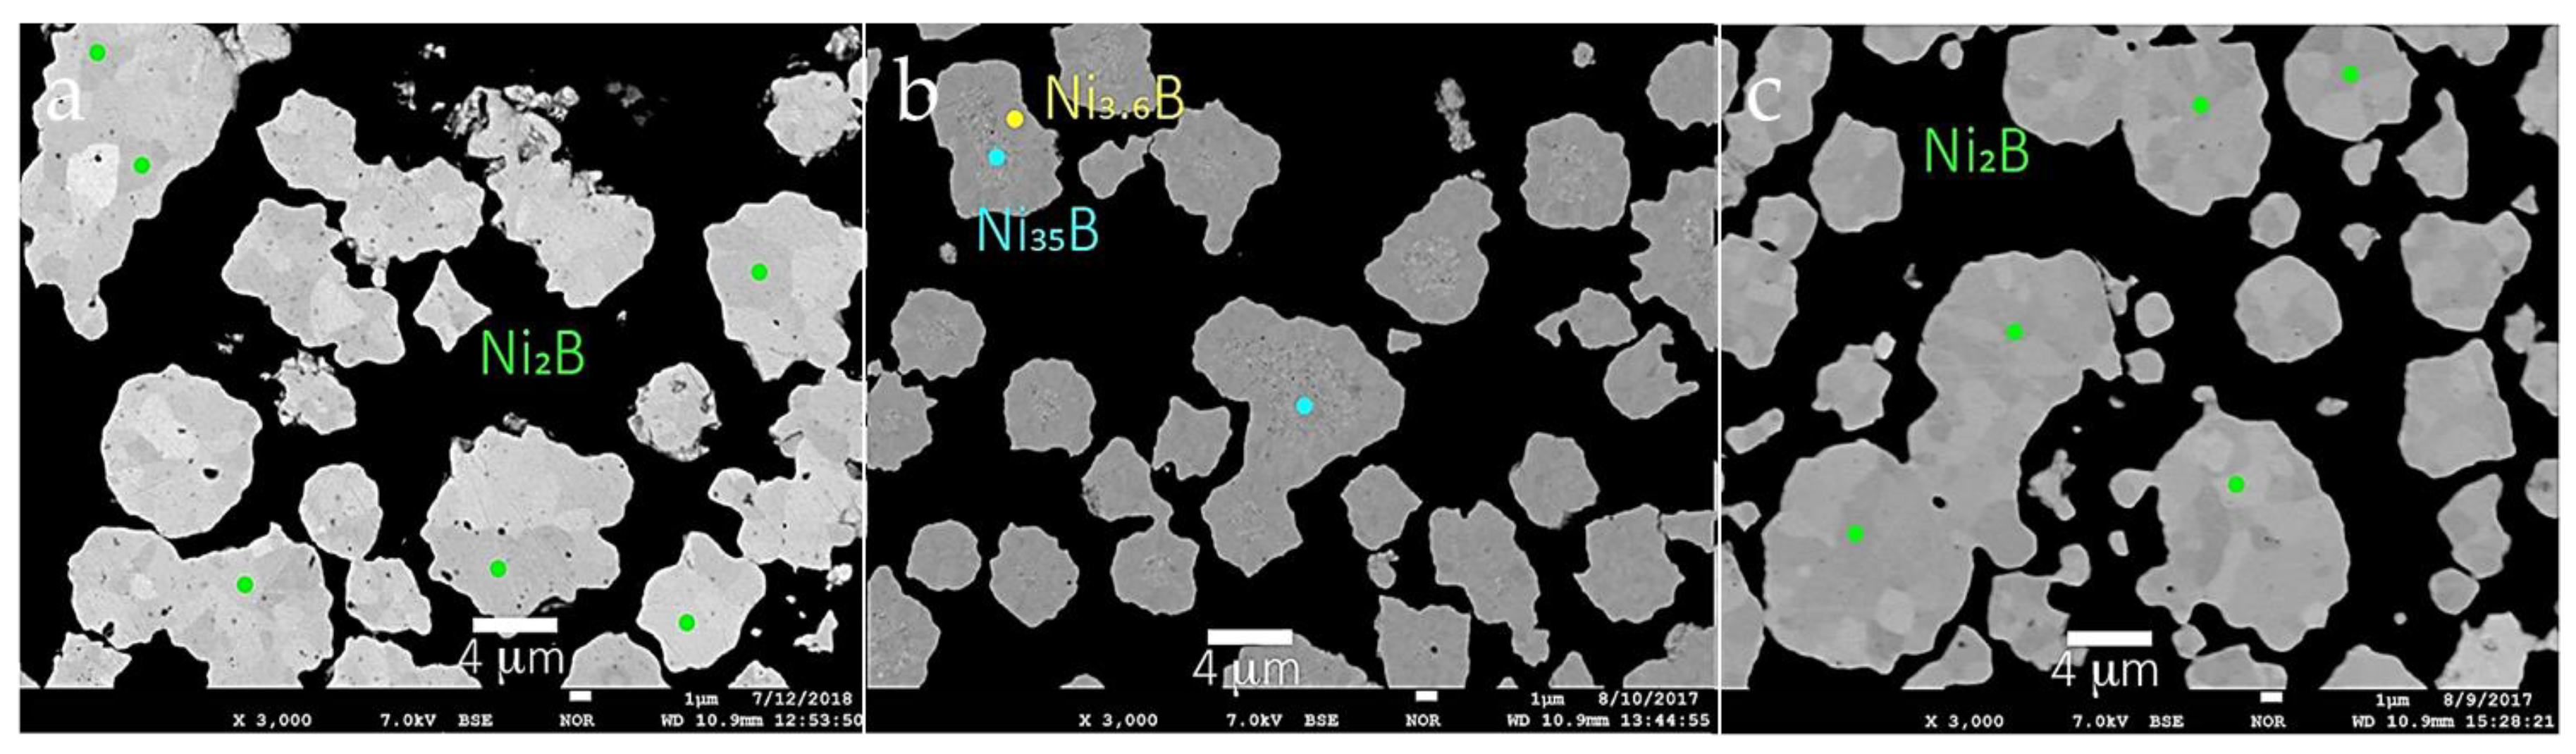
3.3. Morphology and Microstructure
3.4. Magnetic Properties
4. Discussion
4.1. Synthesis of Nickel Borides
4.2. Magnetic Properties
5. Conclusions
Author Contributions
Funding
Acknowledgments
Conflicts of Interest
References
- Fruchart, R.; Roger, A.; Senateur, J.P. Crystallographic and Magnetic Properties of Solid Solutions of the Phosphides M2P, M = Cr, Mn, Fe, Co, and Ni. J. Appl. Phys. 1969, 40, 1250–1257. [Google Scholar] [CrossRef]
- Gumeniuk, R.; Borrmann, H.; Leithe-Jasper, A. Refinement of the crystal structures of trinickel boron, Ni3B, and tripalladium boron, Pd3B. Z. Kristallogr. New Cryst. Struct. 2006, 221, 425–426. [Google Scholar] [CrossRef]
- Hofmann, K.; Kalyon, N.; Kapfenberger, C.; Lamontagne, L.; Zarrini, S.; Berger, R.; Seshadri, R.; Albert, B. Metastable Ni7B3: A New Paramagnetic Boride from Solution Chemistry, Its Crystal Structure and Magnetic Properties. Inorg. Chem. 2015, 54, 10873–10877. [Google Scholar] [CrossRef] [PubMed]
- Rundqvist, S. Crystal Structure of Ni3B and Co3B. Acta Chem. Scand. 1958, 12, 658–662. [Google Scholar] [CrossRef]
- Rundqvist, S. An X-ray Investigation of the Nickel-Boron System. The Crystal Structures of Orthorhombic and Monoclinic Ni4B3. Acta Chem. Scand. 1958, 12, 1193–1208. [Google Scholar] [CrossRef]
- Rundqvist, S.; Pramatus, S. Crystal Structure Refinements of Ni3B, o-Ni4B3, and m-Ni4B3. Acta Chem. Scand. 1967, 21, 191–194. [Google Scholar] [CrossRef]
- Bakonyi, I.; Babić, E.; Miljak, M.; Lück, R.; Bahle, J.; Hasegawa, R.; Kollár, J. Magnetic properties of amorphous, crystalline, and liquid Ni-B alloys. Phys. Rev. B 2002, 65, 104423. [Google Scholar] [CrossRef]
- Bakonyi, I.; Panissod, P.; Hasegawa, R. Magnetic properties of a glassy Ni81.5B18.5 alloy. J. Appl. Phys. 1982, 53, 7771–7773. [Google Scholar] [CrossRef]
- Rojo, J.M.; Hernando, A.; El Ghannami, M.; García-Escorial, A.; González, M.A.; García-Martínez, R.; Ricciarelli, L. Observation and Characterization of Ferromagnetic Amorphous Nickel. Phys. Rev. Lett. 1996, 76, 4833–4836. [Google Scholar] [CrossRef] [PubMed]
- Singh, V.; Banerjee, P.; Srinivas, V.; Babu, N.H.; Ghoshray, A.; Bandyopadhyay, B.; Mazumdar, C. Structural and Magnetic Properties of Ni Rich Amorphous Boride Nanoparticles. AIP Conf. Proc. 2011, 256–259. [Google Scholar] [CrossRef]
- Wade, R.C.; Holah, D.G.; Hughes, A.N.; Hui, B.C. Catalytically Active Borohydride-Reduced Nickel and Cobalt Systems. Catal. Rev. 1976, 14, 211–246. [Google Scholar] [CrossRef]
- Jiang, Z.; Yang, H.; Wei, Z.; Xie, Z.; Zhong, W.; Wei, S. Catalytic properties and structures of nano-amorphous Ni-B alloys affected by annealing temperatures. Appl. Catal. A 2005, 279, 165–171. [Google Scholar] [CrossRef]
- Wu, Z.; Mao, X.; Zi, Q.; Zhang, R.; Dou, T.; Yip, A.C.K. Mechanism and kinetics of sodium borohydride hydrolysis over crystalline nickel and nickel boride and amorphous nickel–boron nanoparticles. J. Power Sources 2014, 268, 596–603. [Google Scholar] [CrossRef]
- Kapfenberger, C.; Hofmann, K.; Albert, B. Room-temperature synthesis of metal borides. Solid State Sci. 2003, 5, 925–930. [Google Scholar] [CrossRef]
- Caputo, R.; Guzzetta, F.; Angerhofer, A. Room-temperature synthesis of nickel borides via decomposition of NaBH4 promoted by nickel bromide. Inorg. Chem. 2010, 49, 8756–8762. [Google Scholar] [CrossRef] [PubMed]
- Jiang, W.J.; Niu, S.; Tang, T.; Zhang, Q.H.; Liu, X.Z.; Zhang, Y.; Chen, Y.Y.; Li, J.H.; Gu, L.; Wan, L.J.; et al. Crystallinity-Modulated Electrocatalytic Activity of a Nickel(II) Borate Thin Layer on Ni3B for Efficient Water Oxidation. Angew. Chem. Int. Ed. Engl. 2017, 56, 6572–6577. [Google Scholar] [CrossRef] [PubMed]
- Kiessling, R. The Borides of Some Transition Elements. Acta Chem. Scand. 1950, 4, 209–227. [Google Scholar] [CrossRef]
- Corrias, A.; Ennas, G.; Marongiu, G.; Musinu, A.; Paschina, G.; Zedda, D. The synthesis of nanocrystalline nickel boride powders by ball milling of elemental components. Mater. Sci. Eng. A 1995, 204, 211–216. [Google Scholar] [CrossRef]
- Özbek, I.; Akbulut, H.; Zeytin, S.; Bindal, C.; Ucisik, A.H. The characterization of borided 99.5% purity nickel. Surf. Coat. Technol. 2000, 126, 166–170. [Google Scholar] [CrossRef]
- Feng, X.; Bai, Y.; Lü, B.; Zhao, Y.; Yang, J.; Chi, J. Synthesis of nanocrystalline Ni2B via a solvo-thermal route. Inorg. Chem. Commun. 2004, 7, 189–191. [Google Scholar] [CrossRef]
- Schlesinger, H.I.; Brown, H.C.; Finholt, A.E.; Gilbreath, J.R.; Hoekstra, H.R.; Hyde, E.K. Sodium Borohydride, Its Hydrolysis and its Use as a Reducing Agent and in the Generation of Hydrogen. J. Am. Chem. Soc. 1953, 75, 215–219. [Google Scholar] [CrossRef]
- Li, H.; Li, H.; Deng, J.-F. The crystallization process of ultrafine Ni-B amorphous alloy. Mater. Lett. 2001, 50, 41–46. [Google Scholar] [CrossRef]
- Schaefer, Z.L.; Ke, X.; Schiffer, P.; Schaak, R.E. Direct Solution Synthesis, Reaction Pathway Studies, and Structural Characterization of Crystalline Ni3B Nanoparticles. J. Phys. Chem. C 2008, 112, 19846–19851. [Google Scholar] [CrossRef]
- Molvinger, K.; Lopez, M.; Court, J. Asymmetric reduction and hydrogenation over heterogenous catalysts prepared by reacting nickel-boride with norephedrine. J. Mol. Catal. A Chem. 1999, 150, 267–273. [Google Scholar] [CrossRef]
- Shahbazi, M.; Cathey, H.; Mackinnon, I.D.R. Synthesis of Magnesium Nickel Boride Aggregates via Borohydride Autogenous Pressure. Materials 2018, 11, 480. [Google Scholar] [CrossRef] [PubMed]
- Mackinnon, I.D.R.; Winnett, A.; Alarco, J.; Talbot, P. Synthesis of MgB2 at Low Temperature and Autogenous Pressure. Materials 2014, 7, 3901–3918. [Google Scholar] [CrossRef] [PubMed]
- McCusker, L.B.; Von Dreele, R.B.; Cox, D.E.; Louër, D.; Scardi, P. Rietveld refinement guidelines. J. Appl. Crystallogr. 1999, 32, 36–50. [Google Scholar] [CrossRef]
- Momma, K.; Izumi, F. VESTA 3 for three-dimensional visualization of crystal, volumetric and morphology data. J. Appl. Cryst. 2011, 44, 1272–1276. [Google Scholar] [CrossRef]
- Mackinnon, I.D.R.; Shahbazi, M.; Alarco, J.A.; Talbot, P.C. Low temperature decomposition of metal borohydride drives autogenous synthesis of MgB2. Supercond. Sci. Technol. 2017, 30, 055004. [Google Scholar] [CrossRef]
- Kayser, G.F.; Kayser, F.X. Ni3B: Powder diffraction pattern and lattice parameters. J. Alloys Compd. 1996, 233, 74–79. [Google Scholar] [CrossRef]
- Havinga, E.E.; Damsma, H.; Hokkeling, P. Compounds and pseudo-binary alloys with the CuAl2(C16)-type structure I. Preparation and X-ray results. J. Less Common Met. 1972, 27, 169–186. [Google Scholar] [CrossRef]
- Villars, P.; Cenzual, K. Pearson’s Crystal Data CD-ROM; AMS International: Materials Park, OH, USA, 2011. [Google Scholar]
- Stahl, B.; Gajbhiye, N.S.; Wilde, G.; Kramer, D.; Ellrich, J.; Ghafari, M.; Hahn, H.; Gleiter, H.; Weiûmüller, J.; Würschum, R.; et al. Electronic and Magnetic Properties of Monodispersed FePt Nanoparticles. Adv. Mater. 2002, 14, 24–27. [Google Scholar] [CrossRef]
- Bragg, J.K.; McCarty, L.V.; Norton, F.J. Kinetics of Pyrolysis of Diborane1. J. Am. Chem. Soc. 1951, 73, 2134–2140. [Google Scholar] [CrossRef]
- Cakir, D.; de Wijs, G.A.; Brocks, G. Native Defects and the Dehydrogenation of NaBH4. J. Phys. Chem. C 2011, 115, 24429–24434. [Google Scholar] [CrossRef]
- Czujko, T.; Varin, R.A.; Wronski, Z.; Zaranski, Z.; Durejko, T. Synthesis and hydrogen desorption properties of nanocomposite magnesium hydride with sodium borohydride (MgH2 + NaBH4). J. Alloys Compd. 2007, 427, 291–299. [Google Scholar] [CrossRef]
- Orimo, S.; Nakamori, Y.; Eliseo, J.R.; Zuttel, A.; Jensen, C.M. Complex Hydrides for Hydrogen Storage. Chem. Rev. 2007, 107, 4111–4132. [Google Scholar] [CrossRef] [PubMed]
- Martelli, P.; Caputo, R.; Remhof, A.; Mauron, P.; Borgschulte, A.; Züttel, A. Stability and Decomposition of NaBH4. J. Phys. Chem. C 2010, 114, 7173–7177. [Google Scholar] [CrossRef]
- Varin, R.A.; Czujko, T.; Wronski, Z.S. Nanomaterials for Solid State Hydrogen Storage; Springer: New York, NY, USA, 2009. [Google Scholar]
- Haynes, W.M. CRC Handbook of Chemistry and Physics; CRC Press: Boca Raton, FL, USA, 2014. [Google Scholar]
- Nazarian-Samani, M.; Kamali, A.R.; Mobarra, R.; Nazarian-Samani, M. Phase transformations of Ni-15 wt.% B powders during mechanical alloying and annealing. Mater. Lett. 2010, 64, 309–312. [Google Scholar] [CrossRef]
- Chandra Shekar, N.V.; Sekar, M.; Sahu, P.C. Equation of state and compressibility of nickel semiboride. Phys. B Condens. Matter 2014, 443, 95–98. [Google Scholar] [CrossRef]
- Cheng, Y.; Tanaka, M.; Watanabe, T.; Choi, S.Y.; Shin, M.S.; Lee, K.H. Synthesis of Ni2B nanoparticles by RF thermal plasma for fuel cell catalyst. J. Phys. Conf. Ser. 2014, 518, 012026. [Google Scholar] [CrossRef]
- Singh, V.; Srinivas, V. Evolution of Ni:B2O3 core-shell structure and magnetic properties on devitrification of amorphous NiB particles in air. J. Appl. Phys. 2009, 106, 053910. [Google Scholar] [CrossRef]
- Gelatt, C.D.; Williams, A.R.; Moruzzi, V.L. Theory of bonding of transition metals to nontransition metals. Phys. Rev. B 1983, 27, 2005–2013. [Google Scholar] [CrossRef]
- Bratkovsky, A.M.; Rashkeev, S.N.; Wendin, G. Electronic structure, ferromagnetism, and EELS spectra of crystalline alloysFenB andNinB (n = 1, 2, 3): Aspects of universal behavior. Phys. Rev. B 1993, 48, 6260–6270. [Google Scholar] [CrossRef]


| Run No. | Weight | Reactant Ni:B Ratio | TMax (°C) | tTm (hours) | PMax (MPa) | Compounds in Product |
|---|---|---|---|---|---|---|
| 1 | Σ = 5.37 g | 1:2 | 725 | 5 | 1.9 | Ni4B3 (o; 88%) (Ni3B) |
| 2 | Σ = 5.37 g | 1:2 | 725 | 12 | 2.8 | Ni4B3 (o; 46%) Ni2B (54%) |
| 3 | Σ = 3.48 g | 4:3 | 670 | 5 | 3.4 | Ni2B (99%) |
| 4 | Σ = 3.10 g | 2:1 | 670 | 5 | 2.3 | Ni2B (98%) |
| 5 | Σ = 3.10 g | 2:1 | 670 | 40 | 2.5 | Ni2B (92%) Ni3B (8%) |
| 6 | Σ = 6.22 g | 2:1 | 670 | 5 | 4.9 | Ni2B (61%), Ni3B (39%) |
| 7 | Σ = 3.74 g | 3:1 | 670 | 5 | 2.2 | Ni3B (55%), Ni2B (39%) Ni (6%) |
| 8 | Σ = 3.74 g | 3:1 | 670 | 10 | 2.4 | Ni3B (72%), Ni2B (17%) Ni (10%) |
| 9 | Σ = 3.74 g | 3:1 | 670 | 15 | 2.3 | Ni3B (64%), Ni2B (26%) Ni (10%) |
| Formula | Ni3B (This Work) | Ni3B [6] | Ni2B (This Work) | Ni2B [32] |
|---|---|---|---|---|
| Crystal System | Orthorhombic (Pnma) | Tetragonal (I4/mcm) | ||
| a(Å) | 5.2273 (1) | 5.2195 (5) | 4.9768 (1) | 4.9910 (3) |
| b(Å) | 6.6131 (1) | 6.6164 (6) | 4.9768 (1) | 4.9910 (3) |
| c(Å) | 4.3900 (1) | 4.3912 (4) | 4.2348 (0) | 4.2470 (3) |
| Cell Vol. (Å3) | 151.756 (3) | 151.65 | 104.891 (2) | 105.79 |
| Rwp | 5.4 | 3.86 | ||
| Rp | 3.86 | 2.61 | ||
| GoF | 2.57 | 1.81 | ||
| Compound | n | Element wt % | Stoichiometry | ||||
|---|---|---|---|---|---|---|---|
| Run 3 | B | Ni | Totals | B | Ni | Totals | |
| Ni2B | 7 | 8.1 (0.3) | 92.4 (0.7) | 100.5 | 1 | 2.1 (0.1) | 3.1 (0.1) |
| Ni2.2B | 3 | 7.6 | 91.7 (0.3) | 99.3 (0.3) | 1 | 2.22 (0.02) | 3.2 (0.02) |
| Ni3B | 2 | 5.4 | 94.3 | 99.8 | 1 | 3.20 | 4.2 |
| Run 4 | |||||||
| Ni2B | 15 | 8.2 (0.2) | 91.9 (0.3) | 100.1 (0.4) | 1 | 2.07(0.06) | 3.1 (0.1) |
| Ni3B | 7 | 5.5 (0.3) | 94.3 (0.5) | 99.7 (0.3) | 1 | 3.19(0.21) | 4.2 (0.2) |
| Ni3.5B | 4 | 4.9 (0.1) | 94.6 (0.2) | 99.5 (0.2) | 1 | 3.53 (0.09) | 4.5 (0.1) |
| Run 5 | |||||||
| Ni2B | 12 | 8.3 (0.3) | 92.2 (0.3) | 100.5(0.5) | 1 | 2.04(0.07) | 3.0 (0.1) |
| Ni3B | 5 | 5.5 (0.1) | 94.6 (0.4) | 100.1 (0.4) | 1 | 3.14(0.09) | 4.1 (0.1) |
© 2018 by the authors. Licensee MDPI, Basel, Switzerland. This article is an open access article distributed under the terms and conditions of the Creative Commons Attribution (CC BY) license (http://creativecommons.org/licenses/by/4.0/).
Share and Cite
Shahbazi, M.; Cathey, H.; Danilova, N.; Mackinnon, I.D.R. Single Step Process for Crystalline Ni-B Compounds. Materials 2018, 11, 1259. https://doi.org/10.3390/ma11071259
Shahbazi M, Cathey H, Danilova N, Mackinnon IDR. Single Step Process for Crystalline Ni-B Compounds. Materials. 2018; 11(7):1259. https://doi.org/10.3390/ma11071259
Chicago/Turabian StyleShahbazi, Mahboobeh, Henrietta Cathey, Natalia Danilova, and Ian D.R. Mackinnon. 2018. "Single Step Process for Crystalline Ni-B Compounds" Materials 11, no. 7: 1259. https://doi.org/10.3390/ma11071259
APA StyleShahbazi, M., Cathey, H., Danilova, N., & Mackinnon, I. D. R. (2018). Single Step Process for Crystalline Ni-B Compounds. Materials, 11(7), 1259. https://doi.org/10.3390/ma11071259