Abstract
MoS2 is a promising material to replace Pt-based catalysts for the hydrogen evolution reaction (HER), due to its excellent stability and high activity. In this work, MoS2 nanoparticles supported on graphitic carbon (about 20 nm) with a preferential 002 facet orientation have been prepared by pyrolysis of alginic acid films on quartz containing adsorbed (NH4)2MoS4 at 900 °C under Ar atmosphere. Although some variation of the electrocatalytic activity has been observed from batch to batch, the MoS2 sample exhibited activity for HER (a potential onset between 0.2 and 0.3 V vs. SCE), depending on the concentrations of (NH4)2MoS4 precursor used in the preparation process. The loading and particle size of MoS2, which correlate with the amount of exposed active sites in the sample, are the main factors influencing the electrocatalytic activity.
1. Introduction
Molybdenum disulfide (MoS2) is among the most efficient non-noble metal electrocatalysts for water oxidation and reduction, and it has been proposed as an economically-viable alternative to the use of platinum in electrocatalysis for water splitting [,,]. MoS2 is a 2D layered material that upon exfoliation can be supported on graphene (G), and in this way, electrodes with high performance for hydrogen generation from water have been developed [,]. It has been found that the electrocatalytic activity for the hydrogen evolution reaction of MoS2 increases as the particles become thinner and with the presence of steps, edges and defects on the particles [,].
Recently, we have reported an innovative method for the preparation of hybrid MoS2/G materials as powders []. The method is based on the simultaneous formation of G and MoS2 by pyrolysis at temperatures above 900 °C of a mixture of alginate containing (NH4)2MoS4. It was previously known that the pyrolysis of certain natural polysaccharides such as alginate and chitosan gives rise to the formation of turbostratic graphitic carbon residues that can be easily exfoliated with high efficiency to form G suspensions []. Since these polysaccharides are good adsorbents, if the biopolymer contains metal ions or some other component, spontaneous phase segregation during the pyrolysis may lead to the formation of Gs having metal nanoparticles (NPs) or some other metal compound present on the G surface [,,]. This was the case of powders of alginate containing (NH4)2MoS4 that upon pyrolysis and subsequent exfoliation of the carbon residue led to the formation of MoS2 platelets deposited on G []. The simultaneous formation of MoS2 and G in the process was assessed by XRD and Raman spectroscopy of the powders, recording the characteristic signature of both materials and also by transmission electron microscopy (TEM) and atomic force microscope (AFM) images of the resulting particles in suspension upon sonication of the powders []. The MoS2/G material suspended in water was used as the catalyst for the visible light hydrogen generation using Eosin Y as the photosensitizer and methanol as the sacrificial electron donor [].
Besides as powders, some of these natural polysaccharides such as alginates and chitosan are able to form defectless films of nanometric thickness and subnanometric rugosity that upon pyrolysis are converted into films of G or few-layer G []. The ability of some of these natural biopolymers to form films of nanometric thickness is directly responsible for the generation of the corresponding single or few-layer G films upon graphitization. When the film of polysaccharide contains some adsorbed metal ion that does not form metal carbides, such as Au, Pt and Cu, their pyrolysis leads to the formation of G films having strongly anchored metal NPs exposing in several cases some preferential facet orientation [,,,]. Continuing with this line of research, it would be of interest to exploit further this innovative preparation procedure of films based on the pyrolysis of precursor polysaccharides for the one-step preparation of films of MoS2 supported on few-layer G that can be used directly as electrodes and measure their activity as electrocatalysts for hydrogen generation from water.
This type of electrocatalytic measurement is described in the present paper, by preparing large area films (2 × 2 cm2) of MoS2 supported on G by pyrolysis of films of ammonium alginate containing (NH4)2MoS4. It was found that as a consequence of the preparation procedure, the resulting MoS2 particles exhibit a preferential 002 facet orientation and present electrocatalytic activity for H2 evolution without the need for an additional conductive electrode.
2. Results and Discussion
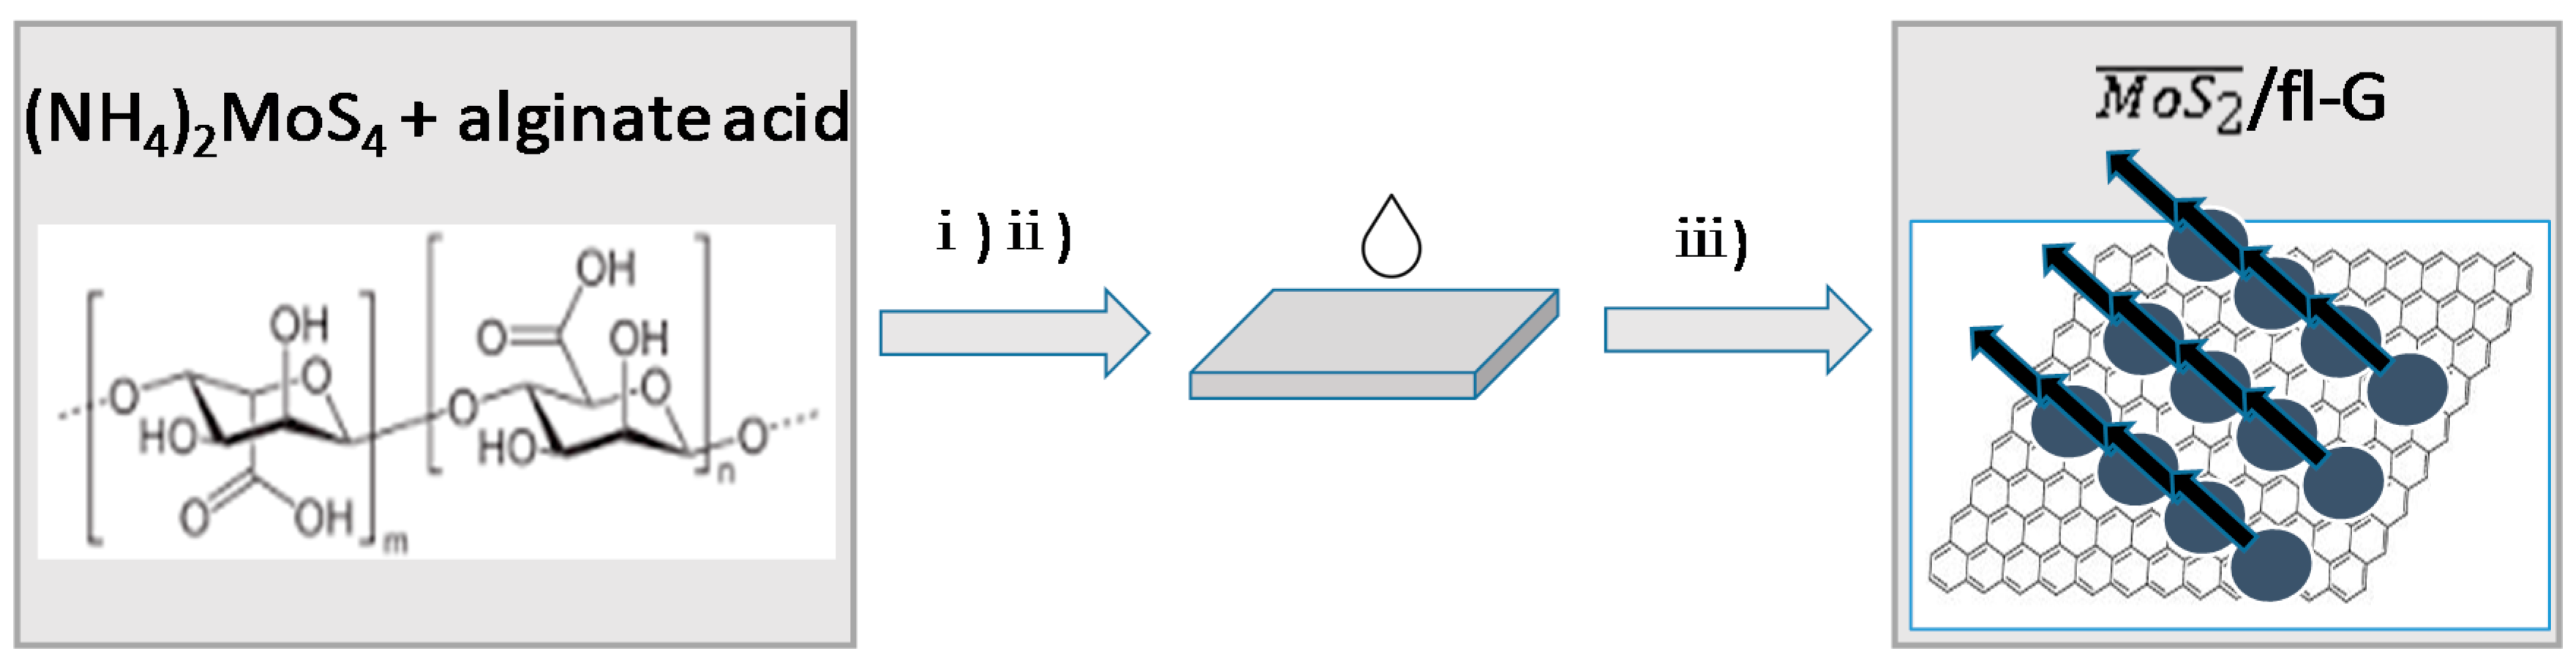
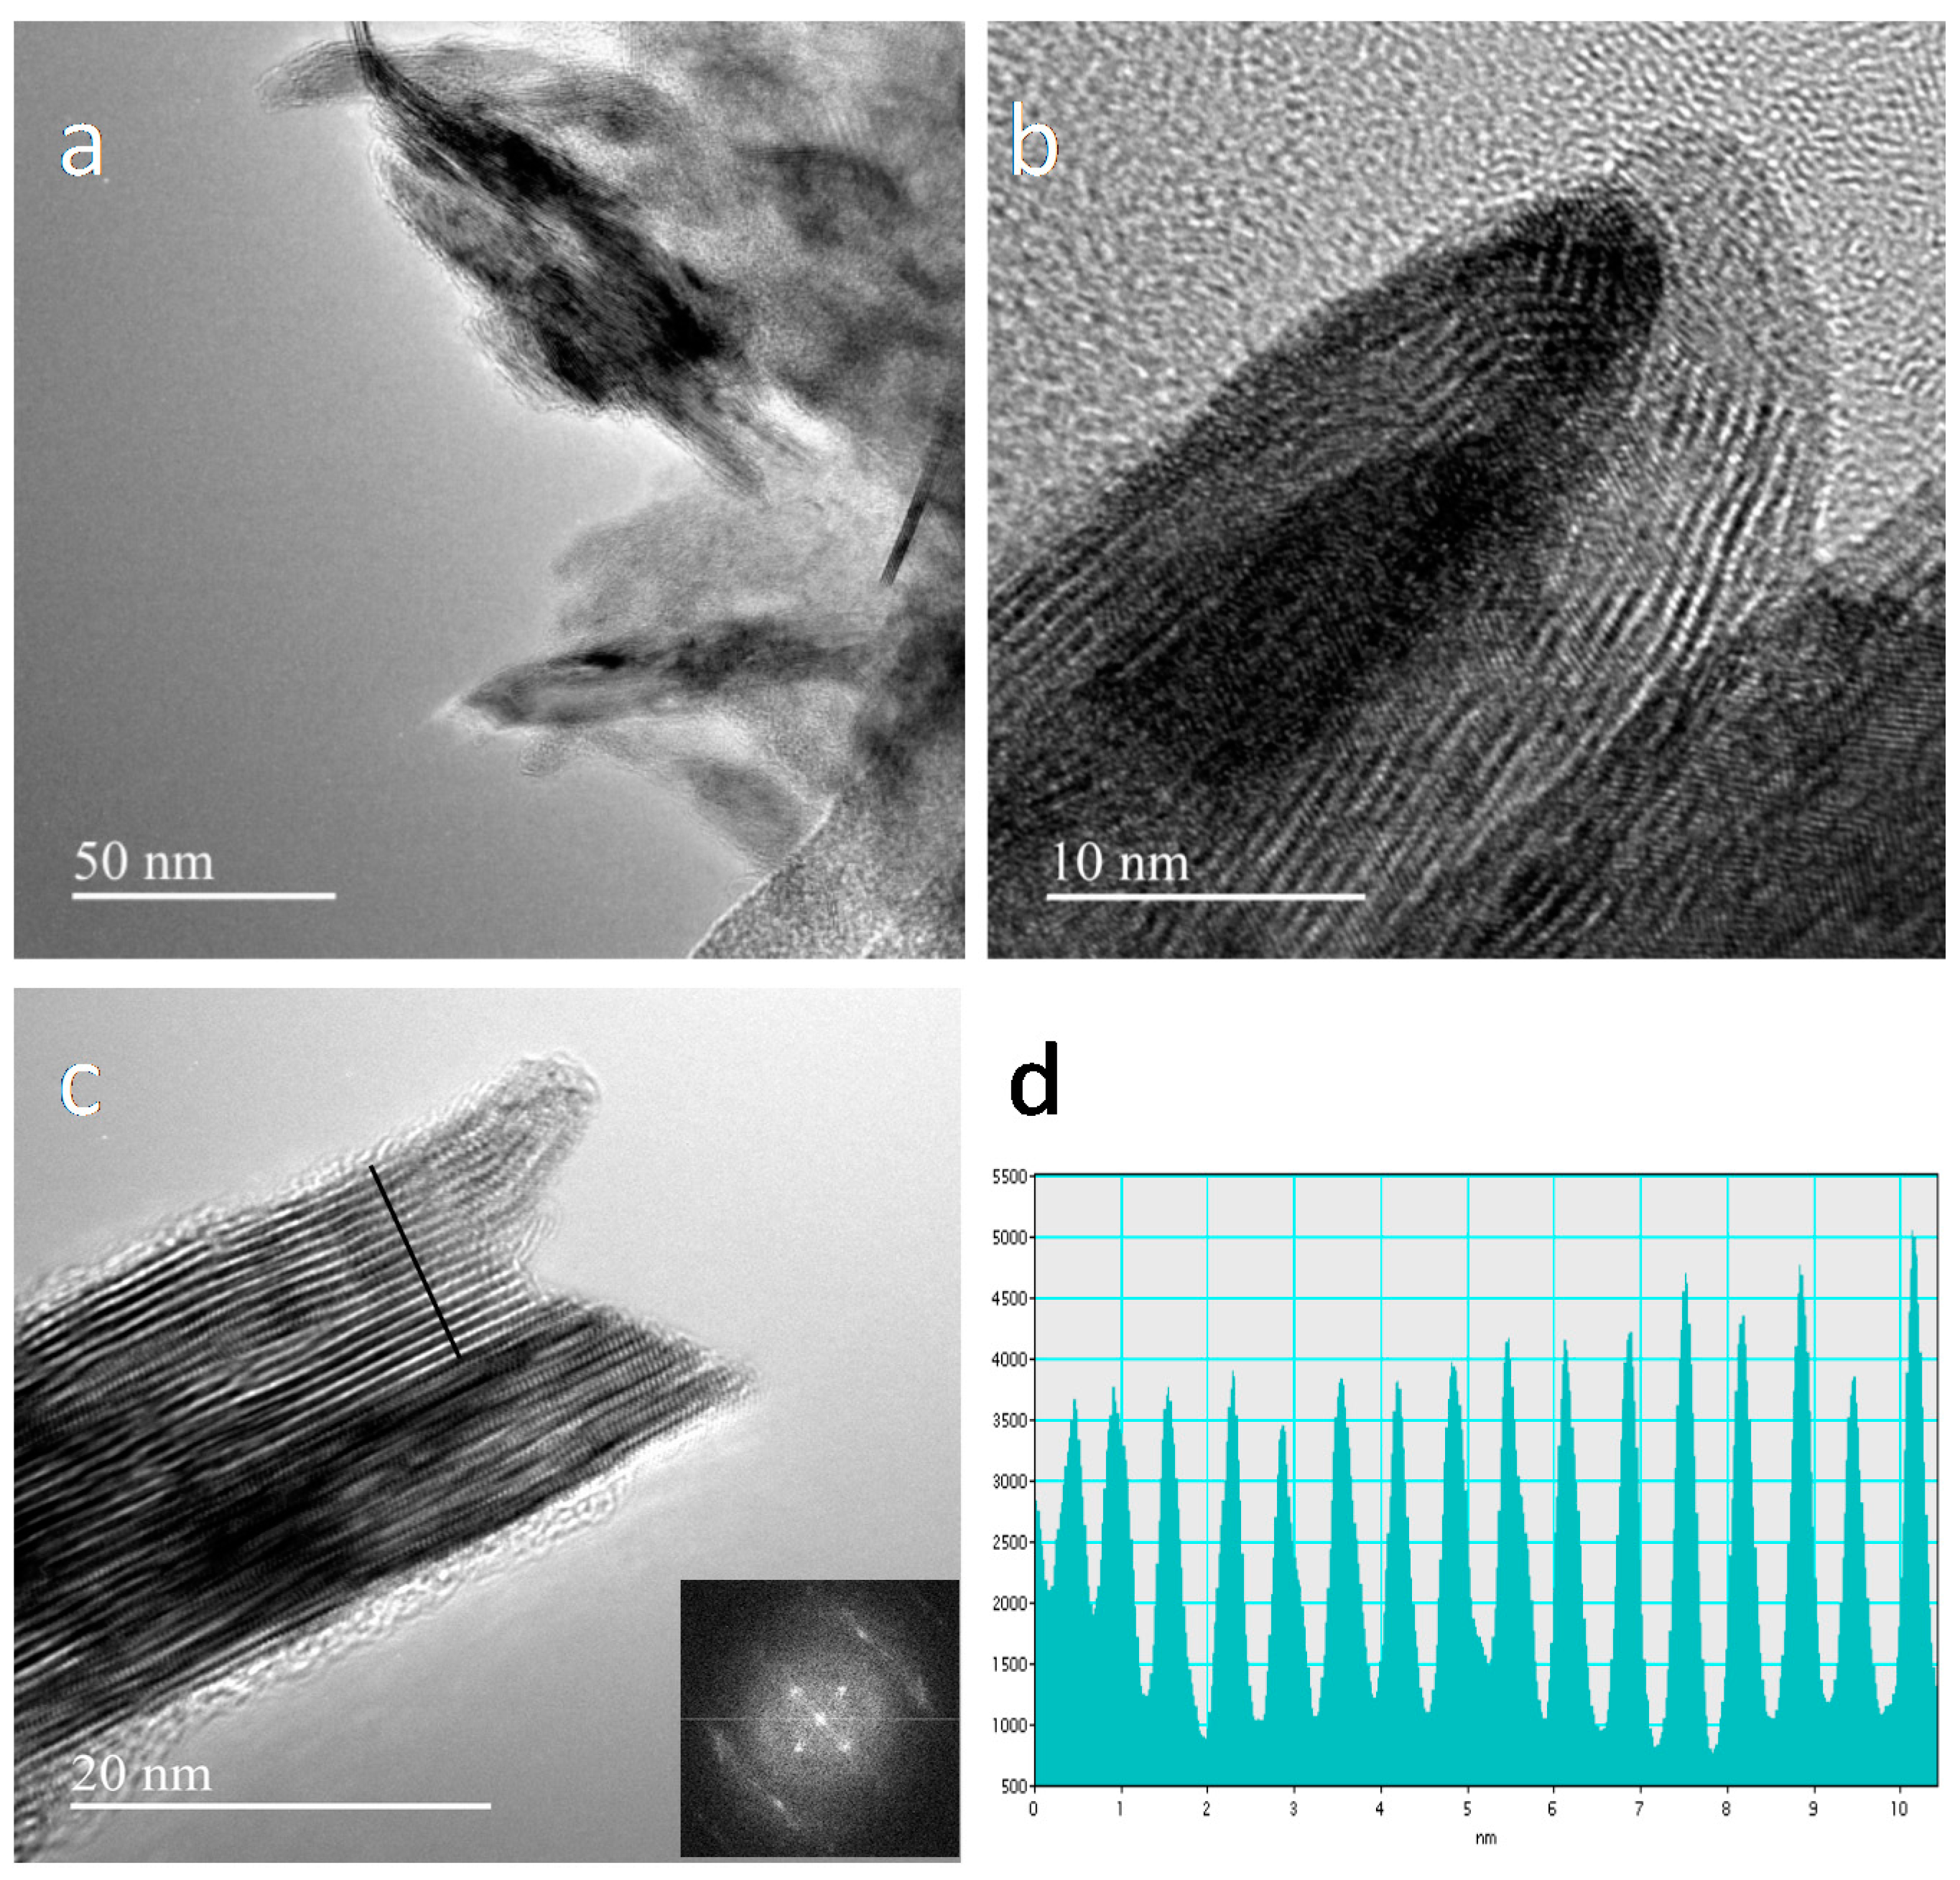
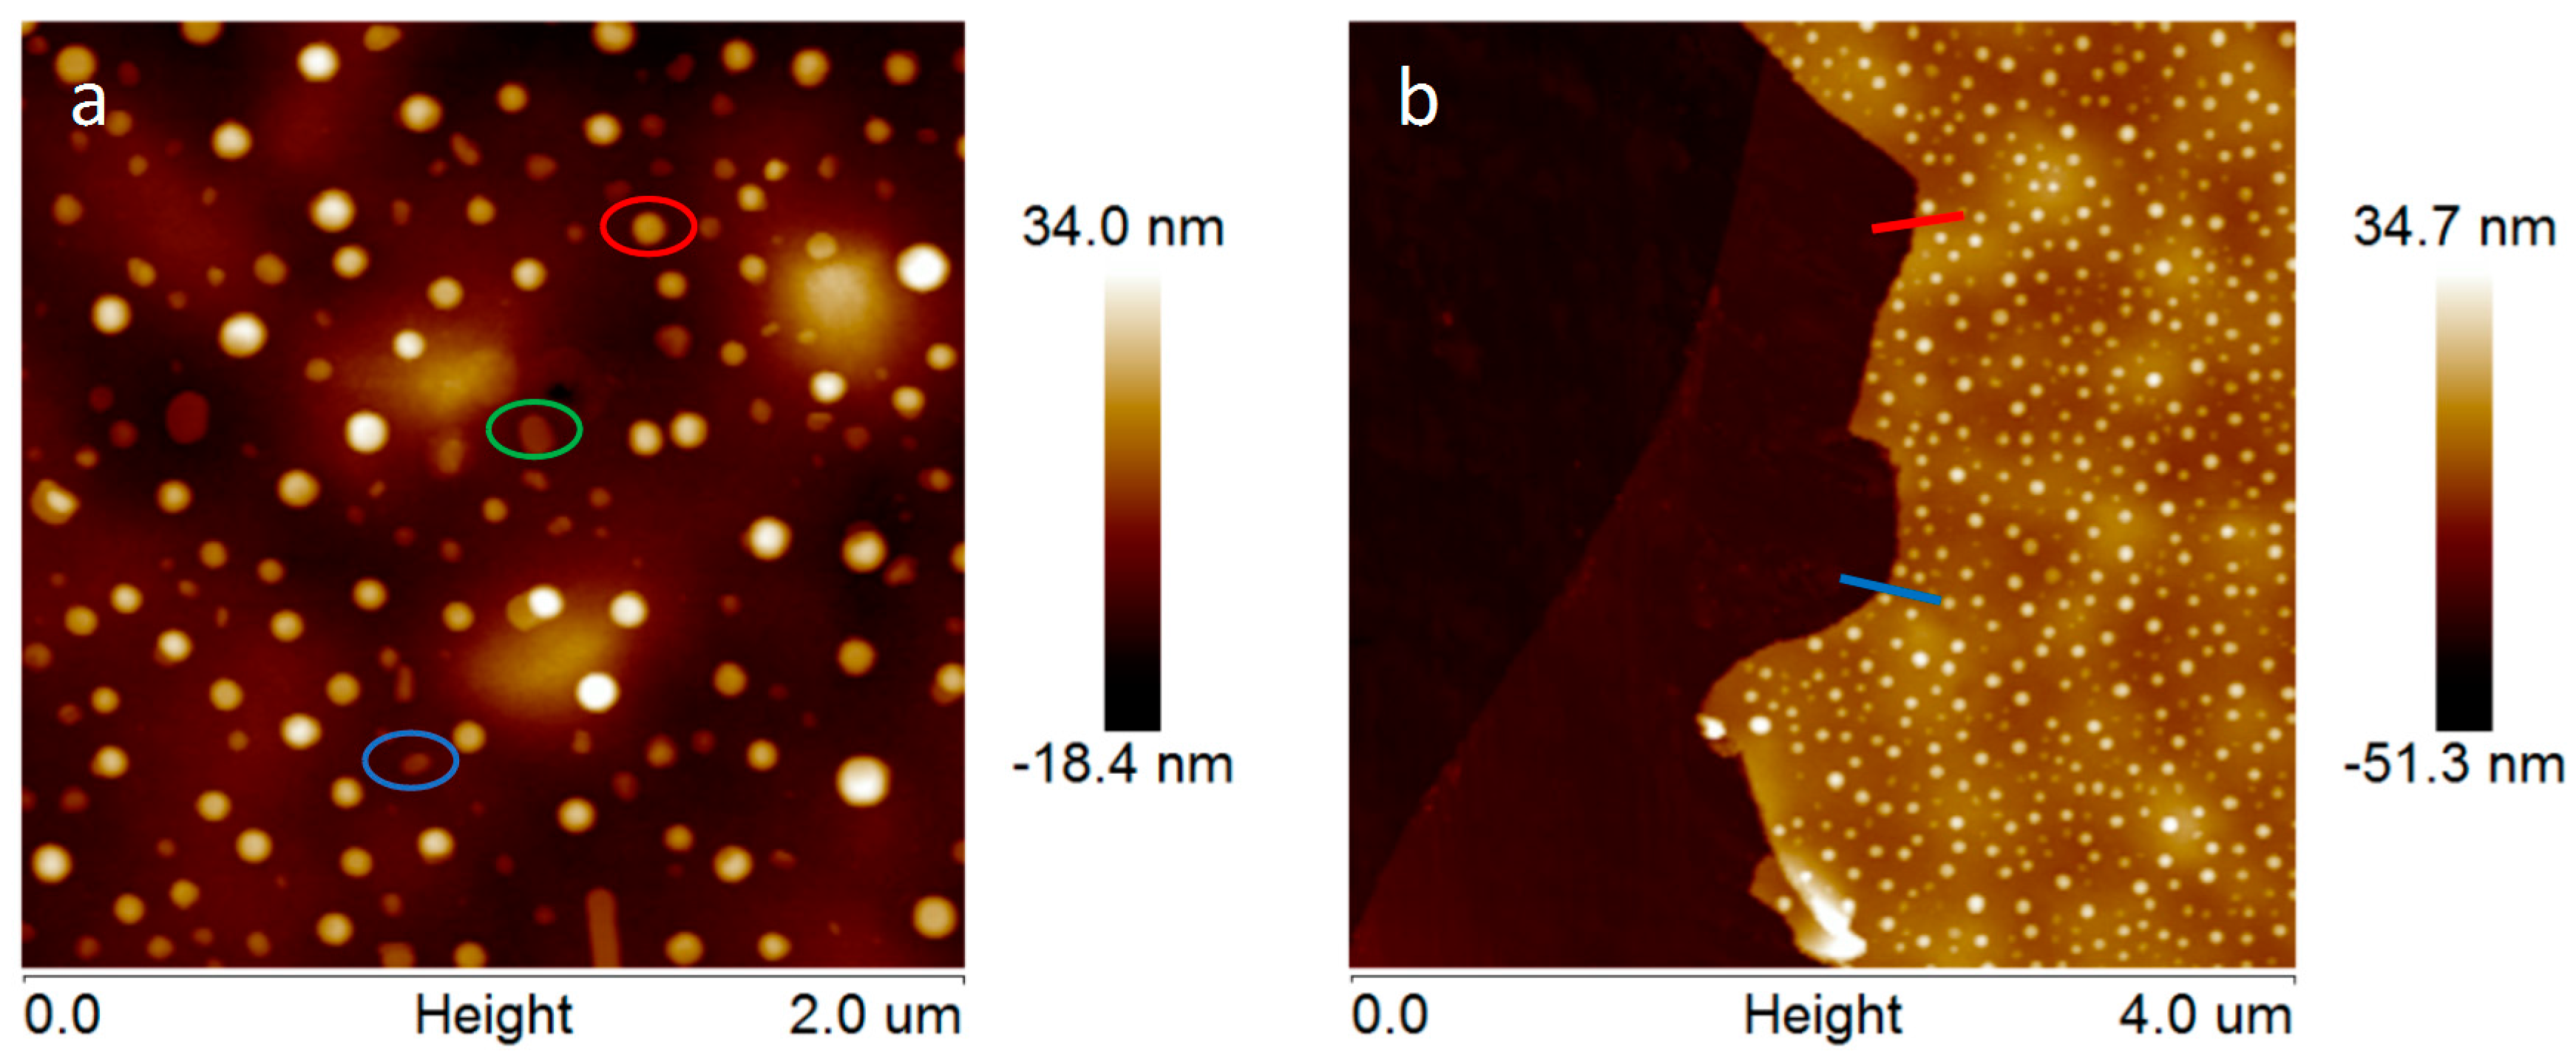
2.1. Sample Preparation and Characterization
Figure 1 illustrates the preparation procedure of /ml-G ( meaning oriented MoS2, ml meaning multilayer). The process starts by dissolving alginic acid in an aqueous solution with the aid of ammonia. To this alginate solution, the required amount of (NH4)2MoS4 was added. These solutions containing (NH4)2MoS4 and ammonium alginate were spin cast on clean glass substrate, and the resulting ammonium alginate film was pyrolyzed under Ar at 900 °C. Several films, where the loading of (NH4)2MoS4 was varied by using initial (NH4)2MoS4 concentrations from 1–60 mM, were used. This resulted in a set of /ml-G-χ, where the χ value denotes the initial (NH4)2MoS4 concentration used in the preparation of these films.
Figure 1.
Preparation procedure for ml-G (G, graphene; ml, multilayer) films supported on quartz: (i) filtration of the aqueous solution of ammonium alginate containing (NH4)2MoS4; (ii) spin coating of alginate solution on clean quartz; (iii) pyrolysis at 900 °C under Ar atmosphere.
The films resulting after the pyrolysis were initially characterized by XRD. As expected in view of related precedents, only the samples prepared with the highest (NH4)2MoS4 concentrations showed some XRD peaks characteristic of MoS2. Figure 2 shows the XRD pattern recorded for commercial MoS2 powder and for a sample prepared using (NH4)2MoS4 as the precursor with a concentration of 60 mM, where in addition to a broad band corresponding to graphitic carbon (multilayer G) of about 24°, a reflection at 14° corresponding to the 002 diffraction of MoS2 could also be recorded. No other diffraction peaks expected for MoS2 were present. The absence of the peaks corresponding to other diffraction planes indicates that MoS2 particles are formed exhibiting a preferential 002 facet orientation. Earlier precedents have shown that pyrolysis of thin films of alginate and chitosan containing Au, Pt, Ag and Cu among other metals can result in metal nanoplatelets supported on G exhibiting preferential 111 facet orientation [,,]. The present case will constitute an additional example of the formation of MoS2 with the preferential exposure of the 002 facet. In accordance with earlier proposal, the most likely reasons for this preferential particle growth are the template effect of graphene layer on the nascent MoS2 nanoparticle and/or the higher thermodynamic stability of the 002 surface against other crystal facets.
Figure 2.
XRD patterns of /ml-G-60 film (a) and the commercial MoS2 powder (b). Note that the broad band of about 27° in Plot a is due to ml-G.
The morphology of MoS2 nanoplatelets and their average particle size on the samples were determined by scanning electron microscopy (SEM). Figure 3 presents the images of the films prepared with initial (NH4)2MoS4 concentrations of 0.5 mM, 2 mM, 5 mM and 10 mM, showing that the /ml-G samples contain particles of MoS2 distributed all over the G film with a broad particle size distribution ranging approximately from 10–200 nm. Quantitative analysis of the particles observed in the SEM images by energy dispersive X-ray spectroscopy (EDS) confirmed that these particles are constituted by Mo and S in an approximate atomic 1:2 ratio, providing firm evidence of the composition of the particles seen in the images. The most important conclusion of this SEM study is that there was a clear relationship between the average MoS2 particle size and the concentration of (NH4)2MoS4 used in the preparation, the average particle size increasing along the concentration of (NH4)2MoS4. In this way, the /ml-G-x with the smallest average particle size of 15 nm corresponded to /ml-G-0.5, while the average particle size grows to 37, 78 and 105 nm for /ml-G-2, /ml-G-5 and /ml-G-10, respectively. It is known that an increase in particle size has a detrimental influence on the electrocatalytic performance that decreases as the particles become larger.
Figure 3.
Representative SEM images of /ml-G-0.5 (a), /ml-G-2 (b), /ml-G-5 (c), /ml-G-10 (d), as well as the different histograms of MoS2 particle size distribution and the EDS analysis result of the /ml-G-2 (e) confirming that the particles correspond to MoS2 supported on ml-G. Note that the presence of Zr and Si is due to the sample holder used for SEM and the quartz substrate, respectively.
Unfortunately, TEM images of the /ml-G films cannot be obtained without detaching them from the quartz substrate. Accordingly, TEM images of the /ml-G-2 could only be obtained after scratching debris of the /ml-G film from the quartz substrate. Figure 4 provides a set of images of pieces of the /ml-G film detached from the quartz substrate. Figure 4a shows a larger image of the /ml-G film showing the presence of particles (darker particles) surrounded by graphene characterized by lighter contrast. Figure 4b,c focuses on particles. In Panel c, the presence of graphene layers (lighter contrast) wrapping the MoS2 particle is clearly observed. High resolution TEM measurements of the interlayer distance of the particles give a value of 0.62 nm, which agrees with the value for the 002 interplanar distance in MoS2, thus providing an additional confirmation of the preferential 002 orientation of the MoS2 particles determined by XRD for those samples with high MoS2 loading []. Fast Fourier transform (FFT) showed that the MoS2 particles were highly crystalline. Figure 4 shows three selected TEM images at different magnifications, as well as the measurement of the interplanar distance and the FFT taken from the image.
Figure 4.
TEM images at different magnifications of /ml-G-2 after scratching the film from the quartz substrate (a–c). Image a shows a general view where the presence of MoS2 as darker particles can be seen embedded within the multilayer graphene film in lighter contrast. The inset of Panel c shows the FFT, and (d) shows the measurement of the distance between different planes.
By using the AFM technique with subnanometric vertical resolution, the thickness of the /ml-G-2 film and the nanoplatelet morphology of MoS2 particles grafted on G were confirmed. Figure 5 presents the measurement of the heights of three representative large MoS2 nanoplatelets with a lateral area of about 80 nm, showing that these particles are flat and thin, with heights between 5 and 15 nm. The thickness of the graphene film could also be measured at the edge of the scratch. It was determined that the average thickness of /ml-G-2 film was about 20 nm (Figure 5d).

Figure 5.
Top views of the AFM images at the central (a) and border (b) part of the /ml-G-2 sample. (c) Shows the height and lateral dimensions of three representative MoS2 nanoparticles marked in the image with the corresponding red, green and blue color. (d) shows the section profile at two points of the edge of the film (red and blue) from which it can be determined that the thickness of the ml-G film is about 20 nm.
Raman spectra of /ml-G samples show the characteristic 2D, G and D peaks appearing at 2912, 1602 and 1367 cm−1, respectively, expected for defective G. As an example, Figure 6 shows the Raman spectra for /ml-G-2 film. The intensity of the G vs. the D band (IG/ID) gives a quantitative indication of the density of defects of the G layers. In the present case, the IG/ID value was about 1.26, which is higher than those IG/ID values typically reported for reduced graphene oxide (rGO) samples, which are generally about 0.9 []. This indicates that G in the /ml-G samples should have somewhat lower defect density than conventional rGO samples. No peaks due to the presence of MoS2 could be observed. MoS2 exhibits in Raman spectroscopy two characteristic A1g and E1g vibration modes at about 400 and 380 cm−1 [] that could not be recorded in the present /ml-G films. The low MoS2 loading together with the low intensity of their Raman bands is the most probable reason for the lack of MoS2 detection, as was already discussed when commenting on the XRD patterns.
Figure 6.
Raman spectra of the /ml-G-2 sample.
The chemical states of Mo, S and C in the /ml-G sample were investigated by carrying out the X-ray photoelectron spectroscopy (XPS) measurements (Figure 7). The survey XPS spectrum of /ml-G film shows the presence of the expected C, O, Mo and S elements, the latter two with very low intensity. In addition to the lower response factor of these two elements with respect to C and O, the low intensity of Mo and S peaks could indicate that particles are not well exposed to the external surface and that they are wrapped by G layers. The high resolution XPS spectra show that the C 1s peak can be resolved into three peaks centered at 284.5 (68.1%), 285.9 (10.2%) and 288.4 eV (21.7%), which could correspond to graphitic carbons, C–O/C–N and C=O, respectively. The Mo 3d spectrum spectra shows the existence of the Mo (4+) oxidation state (73.4%), as well as the Mo (6+) oxidation state (26.6%), the latter probably due to the formation of some MoO3 (about 20%) on the surface of the nanoparticles upon exposure to air []. It should be noted that the presence of some MoO3 only corresponds to the outermost surface of the sample probed by XPS and that elemental analysis by SEM confirms the MoS2 stoichiometry. The presence of a high proportion of MoS2 on the surface of the material is also confirmed by the observation of the corresponding S 2s peak at 226.5 eV binding energy near the Mo peak (Figure 7c) corresponding to about 80% of all the S atoms. The presence of some S–O band (18%) and a small amount of bridging S22− (4%) were also detected in a different binding energy value region by the corresponding S 2p at 164.0 and 163.2 eV (Figure 7d) [].
Figure 7.
High-resolution XPS spectra of the /ml-G-2 material. (a) Survey spectrum; (b) C 1s spectrum; (c) Mo 3d spectrum and S 2p; (d) other region of the S 2p spectrum. Note that Mo and the main S peaks appear in (c), where some components corresponding to Mo (6+) have been marked.
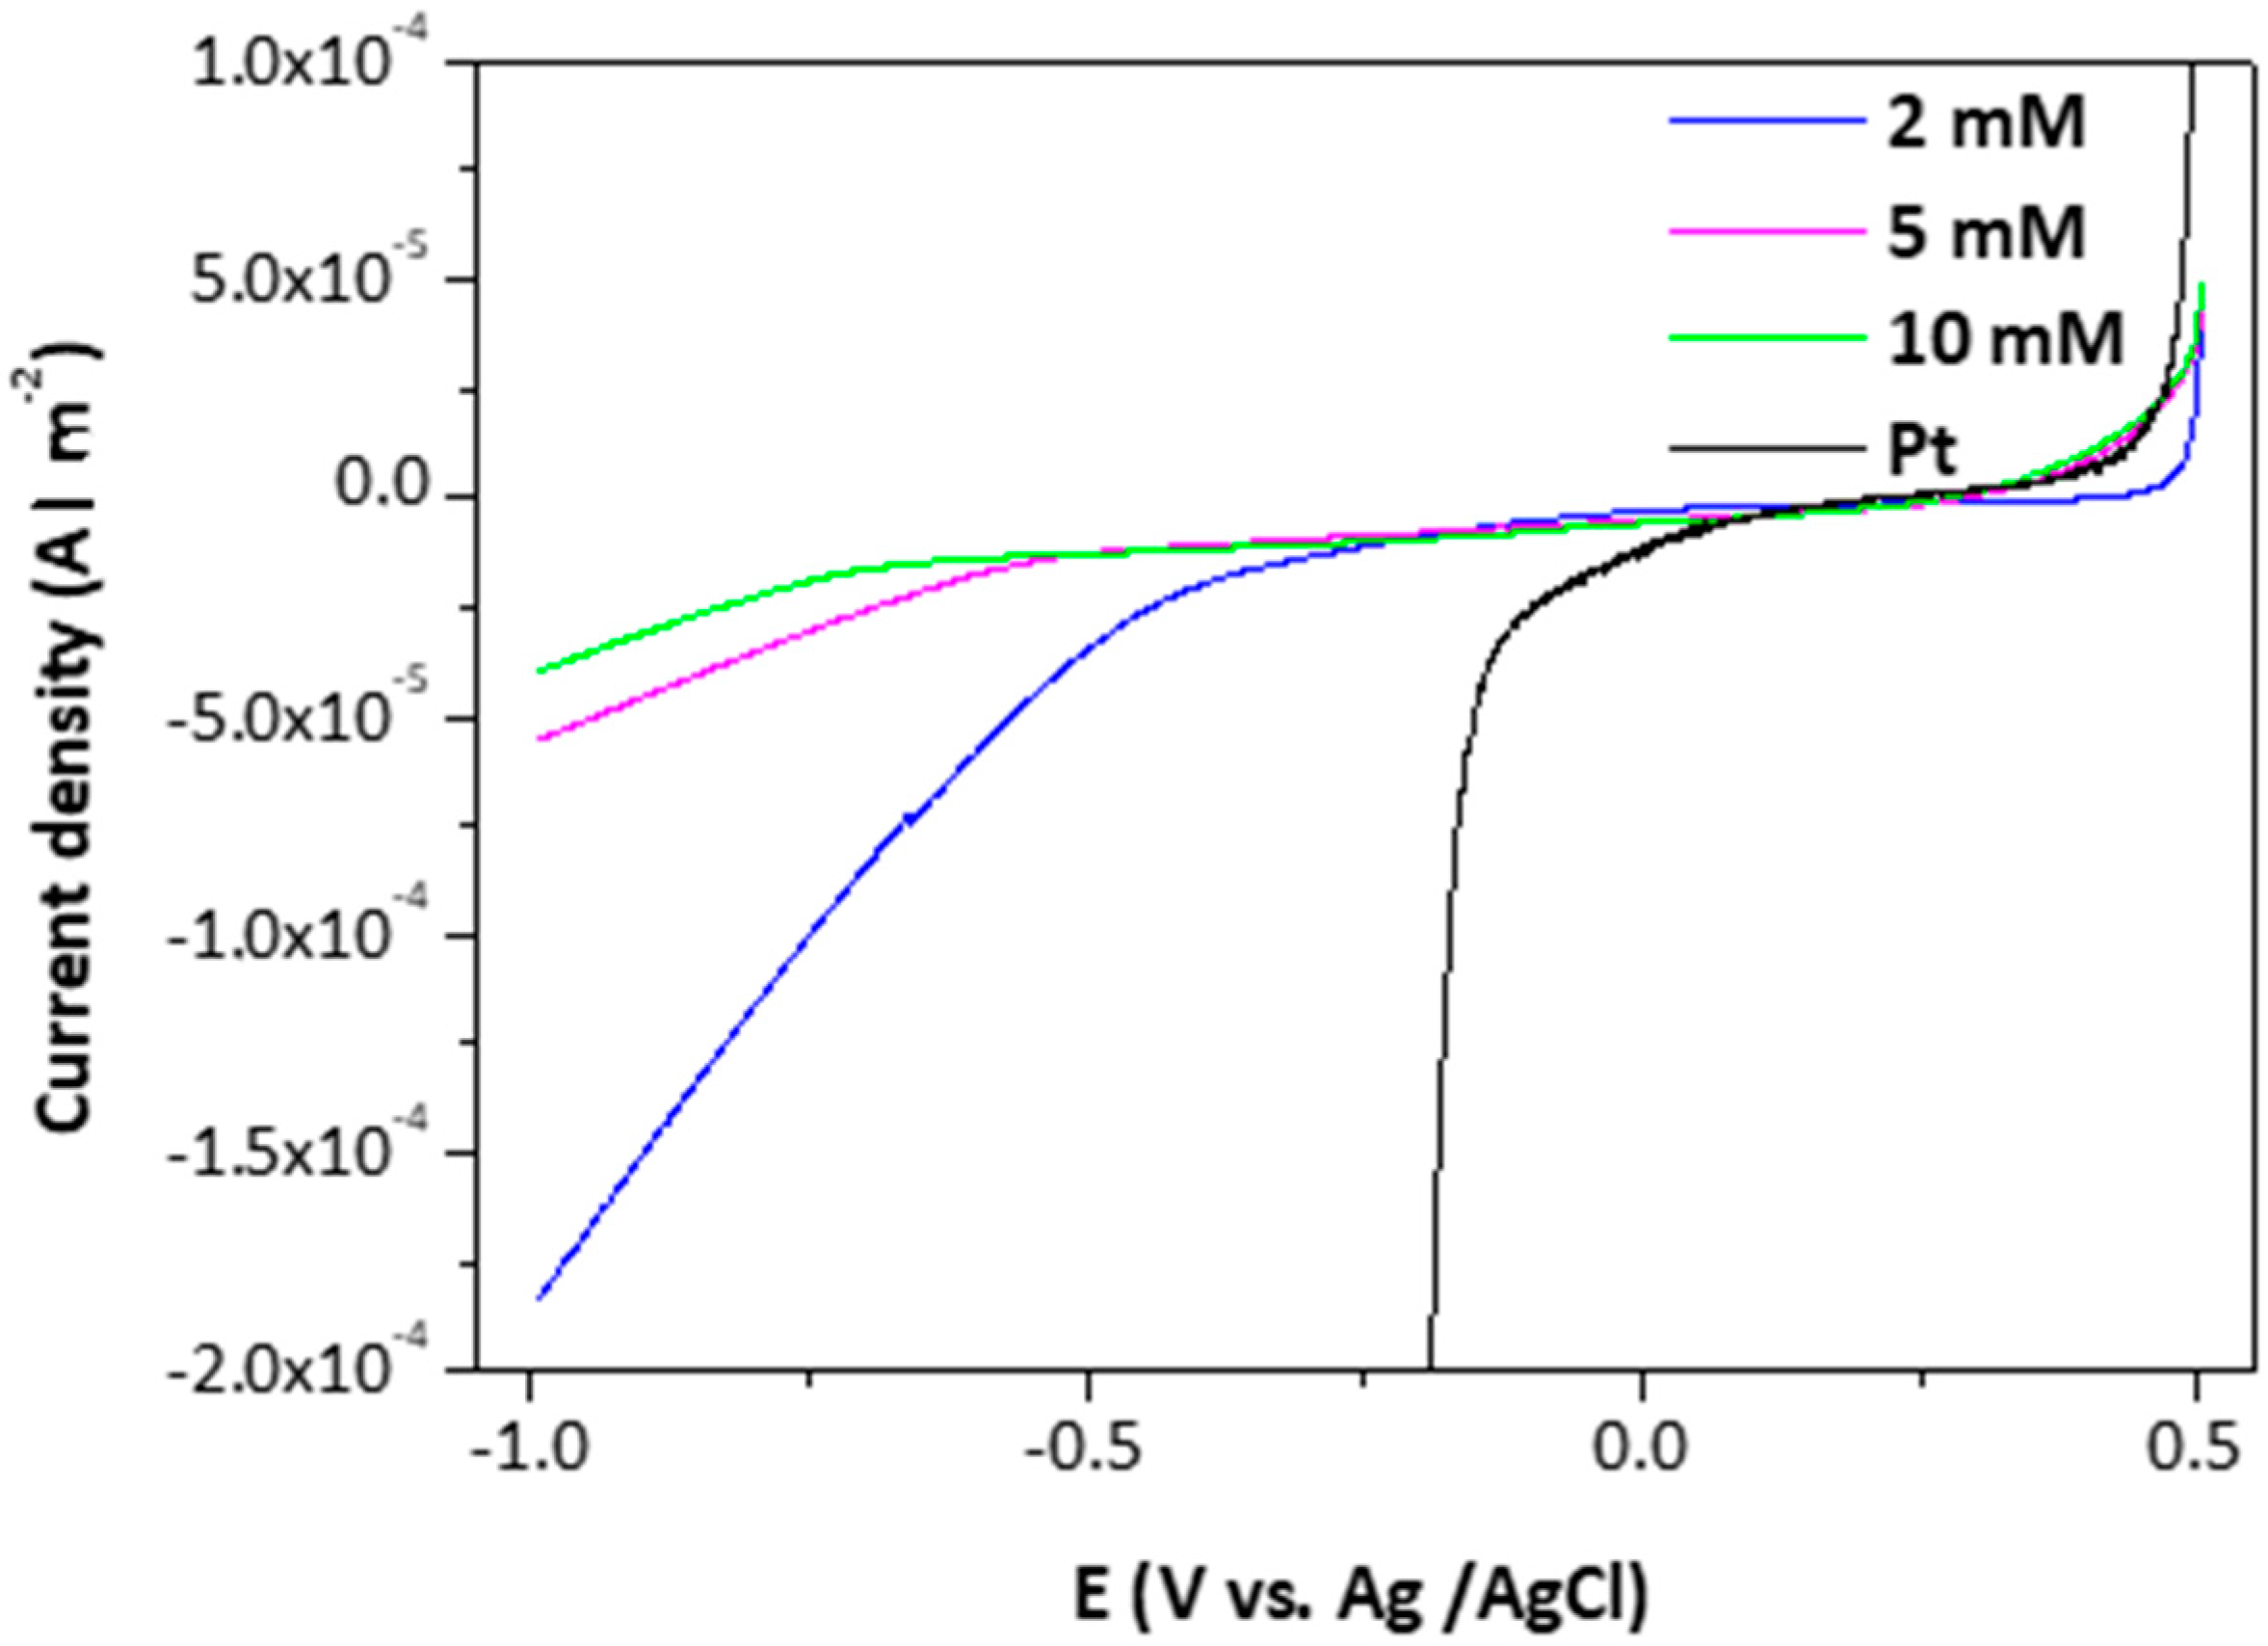
2.2. Electrocatalytic Measurements
Square /ml-G films supported on quartz of a surface of 2 × 2 cm2 resulting from the pyrolysis of alginate precursors were directly used as electrodes for H2 generation. Note that /ml-G films are not coating the glassy carbon electrode or any other conductive substrate and that the electrical conductivity in /ml-G derives from the intrinsic properties of the graphitic carbon forming the film. Previous reports in the literature have established that films’ defective Gs obtained by pyrolysis of natural polysaccharide on quartz substrates exhibit notable electrical conductivity, with surface resistivity values in the range of kΩ × □ [,]. The fact that no conductive electrode is needed in the case of /ml-G is one important advantage derived from the preparation procedure and from the composition of the samples.
Representative measurements of the electrocatalytic behavior of the /ml-G films for H2 generation are presented in Figure 8, where the performance of /ml-G films is compared to that of Pt nanoparticles deposited on glassy carbon. As can be seen there, differences in the onset for H2 generation and in the current density of the /ml-G electrodes as a function of the concentration of (NH4)2MoS4 used in the preparation of the electrodes were observed, there being an optimal loading corresponding to (NH4)2MoS4 close to 2 mM. The observation of an optimal loading typically occurs when there are two opposite factors related to the amount of MoS2 influencing the electrocatalytic activity. We propose that these two factors are the catalytic activity of MoS2 for H2 evolution that should increase as the loading of MoS2 increases and the increase in the particle size of MoS2 with lesser density of defects that should disfavor the catalytic activity as MoS2 loading increases. It is known that the electrocatalytic activity of MoS2 derives from steps and defects on the nanoparticles [,], and these defects should be more abundant when the particle size is smaller, a fact that should occur at low MoS2 loadings. As mentioned earlier, SEM images clearly indicate that the particle size grows from 15–105 nm upon increasing (NH4)2MoS4 concentration. On the other hand, for low MoS2 loadings, the density of active sites in 2 × 2 cm2 should be low, resulting in low activity, as was the case of the /ml-G film prepared using the 0.5 M (NH4)2MoS4 concentration. As a result, a compromise should be reached at an optimal MoS2 loading close to a 2 mM (NH4)2MoS4 concentration during the preparation of the /ml-G films.
Figure 8.
Polarization curves of the /ml-G films and Pt nanoparticles for hydrogen evolution reaction (HER) activity.
By performing a series of independent electrode preparations, it was observed that the electrocatalytic response of the /ml-G films was not exactly reproducible from one batch to the other, there being a dispersion on the potential onset of H2 generation and the current density achieved at different potentials for the /ml-G films as a function of the (NH4)2MoS4 concentration. Figure 9 presents data of three independent sets of /ml-G film preparation showing the variation in the response of the electrodes. We suggest that this lack of complete reproducibility derives in a large extent from the difficulty to make electrical contacts on films of nanometric thickness and on the random growth of MoS2 particles during the pyrolysis, particularly in the low concentration range. In any case, whatever the reason, independent preparation of several series of /ml-G films showed that the optimal values of the concentration were in the range between 1 and 2 mM (see Figure 9), for which an onset potential of −0.2/−0.3 V is consistently measured, with Tafel slopes of 180 mV/decade. Thus, the dispersion in the behavior of the electrodes, although existing, allows a degree of confidence on the performance of /ml-G films. In the literature, an onset potential for MoS2 supported on reduced graphene oxide deposited on a conductive glassy carbon electrode of 100 mV with a rise of 41 mV/decade was reported on a 0.5 M H2SO4 aqueous solution []. Note, however, that although the electrolyte solutions in the reported data and the present study are the same, other conditions and, particularly, the absence of a conductive electrode and the use of flat quartz substrate as the electrode are remarkably different from those used in the literature [].
Figure 9.
The electrocatalytic performance characterized by the onset potential for H2 evolution of three independent batches of samples (in different colors) as a function of the concentration of (NH4)2MoS4 precursor.
Regarding stability, it was observed that /ml-G films undergo easy peeling off from the quartz substrate upon a few electrocatalytic measurements. This reflects poor adherence of /ml-G films to the quartz substrate.
3. Conclusions
In the present manuscript, it is reported that large surface area of films of /ml-G on arbitrary, non-conductive substrates can be prepared in one step by pyrolysis at 900 °C under Ar of ammonium alginate films containing (NH4)2MoS4. During the pyrolytic process, two separate phases corresponding to graphitic carbon (multilayer graphene) and MoS2 develop spontaneously. MoS2 platelets exhibit a preferential 002 facet orientation, and they have affinity for graphene as deduced from the relative lateral surface area to height ratio, which is large. The /ml-G films act as electrocatalysts for H2 generation without the need for any conductive electrode, exhibiting a potential onset between −0.2 and −0.3 V depending on the concentration of (NH4)2MoS4 used in the preparation, with certain variation of the electrocatalytic performance from batch to batch. Considering the simplicity of the one-step preparation procedure and the precursors, the present protocol is advantageous for the preparation of /ml-G films as electrocatalysts in an easily scalable way.
4. Experimental Section
4.1. Synthesis of the Oriented /ml-G Films
Alginic acid (1200 mg) from Aldrich (St. Louis, MO, USA) was suspended in aqueous solutions containing different concentrations of (NH4)2MoS4 (0.5, 1, 2, 3, 5, 10 or 60 mM). Two milliliters of NH4OH solution (28–30% NH3 in water) were added to dissolve alginate acid completely. After 2 h under magnetic stirring at room temperature, the solutions were filtered through a syringe of a 0.45 µm pore size to remove insoluble impurities present in the commercial alginic acid. The films were cast on a previously cleaned quartz plate (2 × 2 cm2) by spin coating 500 µL of filtered ammonium alginate solution at 4000 rpm for 45 s. Once dried on a hot plate, the films were pyrolyzed under Ar flow (200 mL·min−1), increasing the temperature at a rate of 5 °C·min−1 up to 900 °C and a holding time of 1 h. After this time, the films were cooled down at room temperature also under Ar flow.
4.2. Characterization Techniques
XRD patterns were obtained by using a Philips X’Pert diffractometer (Philips, Amsterdam, The Netherlands) and copper radiation (CuKa = 1.541178 Å). Raman spectra were recorded at ambient temperature with 514 nm laser excitation on a Renishaw In Via (New Mills, UK) Raman spectrometer equipped with a CCD detector. TEM images were recorded by using a Philips CM 300 FEG system with an operating voltage of 100 kV after scratching /ml-G films with a cutter. AFM images were made with Multimode Nanoscope 3A equipment (Bruker, Billerica, MA, USA) working in tapping mode, using mica as the substrate. Field emission scanning electron microscopy (FESEM) images were taken with an ULTRA 55 ZEISS Oxford instrument (Pleasanton, CA, USA) and high-resolution transmission electron microscopy (HRTEM) images with a JEM 2100F JEOL 200-kV electronic microscope (JEOL, Akishima, Japan) employed to collect the morphology of the solid samples and element mapping of selected areas. XPS analyses were measured using a SPECS spectrometer with a MCD-9 detector exciting with a monochromatic Al (K = 1486.6 eV) X-ray source (SPECS, Berlin, Germany). Peak deconvolution fittings were performed using the CASA software (Version 2.3.14 dev3, RBD, Bend, OA, USA) using the C 1s peak at 284.4 eV as the binding energy reference.
4.3. Electrochemical Characterization
Electrocatalytic measurements of /ml-G electrodes were carried out using a potentiostat/galvanostat (VersaSTAT 3, Princeton Applied Research, Oak Ridge, TN, USA) with a standard three-electrode cell configuration. /ml-G films were used as the working electrode. Ag/AgCl/KCl (3 M) and Pt wire were used as the reference and counter electrode, respectively. An aqueous solution of 0.5 M of H2SO4 was used as the electrolyte and was degassed using argon. Onset potentials were measured by extrapolating to zero current density the initial linear part of the V-J plot. The standard error of the measurement, based on three independent batches, was estimated to be 20%.
Acknowledgments
Financial support by the Spanish Ministry of Economy and Competitiveness (Severo Ochoa and CTQ2015-69513-CO2-R1) and Generalidad Valenciana (Prometeo 2013/014) is gratefully acknowledged. Jinbao He thanks the Chinese Scholarship Council for supporting his PhD studies.
Author Contributions
Ana Primo and Hermenegildo Garcia conceived and designed the experiments; Jinbao He and Cristina Fernandez performed the experiments; Ana Primo and Hermenegildo Garcia analyzed the data; Hermenegildo Garcia wrote the paper.
Conflicts of Interest
The authors declare no conflict of interest.
Data Availability
Datasets are available from the authors upon request.
References
- Chhowalla, M.; Shin, H.S.; Eda, G.; Li, L.-J.; Loh, K.P.; Zhang, H. The chemistry of two-dimensional layered transition metal dichalcogenide nanosheets. Nat. Chem. 2013, 5, 263–275. [Google Scholar] [CrossRef] [PubMed]
- Lukowski, M.A.; Daniel, A.S.; Meng, F.; Forticaux, A.; Li, L.; Jin, S. Enhanced hydrogen evolution catalysis from chemically exfoliated metallic MoS2 nanosheets. J. Am. Chem. Soc. 2013, 135, 10274–10277. [Google Scholar] [CrossRef] [PubMed]
- Voiry, D.; Yamaguchi, H.; Li, J.; Silva, R.; Alves, D.C.B.; Fujita, T.; Chen, M.; Asefa, T.; Shenoy, V.B.; Eda, G.; et al. Enhanced catalytic activity in strained chemically exfoliated WS2 nanosheets for hydrogen evolution. Nat. Mater. 2013, 12, 850–855. [Google Scholar] [CrossRef] [PubMed]
- Li, Y.; Wang, H.; Xie, L.; Liang, Y.; Hong, G.; Dai, H. MoS2 nanoparticles grown on graphene: An advanced catalyst for the hydrogen evolution reaction. J. Am. Chem. Soc. 2011, 133, 7296–7299. [Google Scholar] [CrossRef] [PubMed]
- Liao, L.; Zhu, J.; Bian, X.; Zhu, L.; Scanlon, M.D.; Girault, H.H.; Liu, B. MoS2 formed on mesoporous graphene as a highly active catalyst for hydrogen evolution. Adv. Funct. Mater. 2013, 23, 5326–5333. [Google Scholar] [CrossRef]
- Latorre-Sanchez, M.; Esteve-Adell, I.; Primo, A.; Garcia, H. Innovative preparation of MoS2-graphene heterostructures based on alginate containing (NH4)2MoS4 and their photocatalytic activity for h-2 generation. Carbon 2015, 81, 587–596. [Google Scholar] [CrossRef]
- Primo, A.; Sanchez, E.; Delgado, J.M.; Garcia, H. High-yield production of n-doped graphitic platelets by aqueous exfoliation of pyrolyzed chitosan. Carbon 2014, 68, 777–783. [Google Scholar] [CrossRef]
- Mateo, D.; Esteve-Adell, I.; Albero, J.; Sanchez Royo, J.F.; Primo, A.; Garcia, H. 111 oriented gold nanoplatelets on multilayer graphene as visible light photocatalyst for overall water splitting. Nat. Commun. 2016, 7, 11819. [Google Scholar] [CrossRef] [PubMed]
- Primo, A.; Esteve-Adell, I.; Blandez, J.F.; Dhakshinamoorthy, A.; Alvaro, M.; Candu, N.; Coman, S.M.; Parvulescu, V.I.; Garcia, H. High catalytic activity of oriented 2.0.0 copper(I) oxide grown on graphene film. Nat. Commun. 2015, 6, 8561. [Google Scholar] [CrossRef] [PubMed]
- Primo, A.; Esteve-Adell, I.; Coman, S.N.; Candu, N.; Parvulescu, V.I.; Garcia, H. One-step pyrolysis preparation of 1.1.1 oriented gold nanoplatelets supported on graphene and six orders of magnitude enhancement of the resulting catalytic activity. Angew. Chem. Int. Ed. 2016, 55, 607–612. [Google Scholar] [CrossRef] [PubMed]
- Primo, A.; Atienzar, P.; Sanchez, E.; Maria Delgado, J.; Garcia, H. From biomass wastes to large-area, high-quality, n-doped graphene: Catalyst-free carbonization of chitosan coatings on arbitrary substrates. Chem. Commun. 2012, 48, 9254–9256. [Google Scholar] [CrossRef] [PubMed]
- Esteve-Adell, I.; Bakker, N.; Primo, A.; Hensen, E.; García, H. Oriented pt nanoparticles supported on few-layers graphene as highly active catalyst for aqueous-phase reforming of ethylene glycol. ACS Appl. Mater. Interface 2016, 8, 33690–33696. [Google Scholar] [CrossRef] [PubMed]
- Pedraza, F.; Cruz-Reyes, J.; Acosta, D.; Yanez, M.J.; Avalos-Borja, M.; Fuentes, S. The structure characterization of MoS2 and WS2 catalysts by hrem. J. Phys. Condens. Matter 1993, 5, A219. [Google Scholar] [CrossRef]
- Jorio, A.; Saito, R.; Dresselhaus, G.; Dresselhaus, M.S. Disorder effects in the raman spectra of sp2 carbons. In Raman Spectroscopy in Graphene Related Systems; Wiley-VCH Verlag GmbH & Co. KGaA: Weinheim, Germany, 2011; pp. 299–325. [Google Scholar]
- Li, H.; Zhang, Q.; Yap, C.C.R.; Tay, B.K.; Edwin, T.H.T.; Olivier, A.; Baillargeat, D. From bulk to monolayer MoS2: Evolution of raman scattering. Adv. Funct. Mater. 2012, 22, 1385–1390. [Google Scholar] [CrossRef]
- Yan, Y.; Ge, X.; Liu, Z.; Wang, J.-Y.; Lee, J.-M.; Wang, X. Facile synthesis of low crystalline MoS2 nanosheet-coated cnts for enhanced hydrogen evolution reaction. Nanoscale 2013, 5, 7768–7771. [Google Scholar] [CrossRef] [PubMed]
- Vrubel, H.; Merki, D.; Hu, X. Hydrogen evolution catalyzed by MoS3 and MoS2 particles. Energy Environ. Sci. 2012, 5, 6136–6144. [Google Scholar] [CrossRef]
- Li, H.; Tsai, C.; Koh, A.L.; Cai, L.L.; Contryman, A.W.; Fragapane, A.H.; Zhao, J.H.; Han, H.S.; Manoharan, H.C.; Abild-Pedersen, F.; et al. Activating and optimizing MoS2 basal planes for hydrogen evolution through the formation of strained sulphur vacancies. Nat. Mater. 2016, 15, 48–53. [Google Scholar] [CrossRef] [PubMed]
- Tsai, C.; Chan, K.R.; Norskov, J.K.; Abild-Pedersen, F. Theoretical insights into the hydrogen evolution activity of layered transition metal dichalcogenides. Surf. Sci. 2015, 640, 133–140. [Google Scholar] [CrossRef]
© 2018 by the authors. Licensee MDPI, Basel, Switzerland. This article is an open access article distributed under the terms and conditions of the Creative Commons Attribution (CC BY) license (http://creativecommons.org/licenses/by/4.0/).