Abstract
Effects of oxygen content of fuels on combustion characteristics and emissions were investigated on both an optical single cylinder direct injection (DI) diesel engine and a multi-cylinder engine. Three fuels were derived from conventional diesel fuel (Finnish City diesel summer grade) by blending Rapeseed Methyl Ester (RME) or Diglyme and Butyl-Diglyme of different quantities to make their oxygen content 3%, 3% and 9%, respectively. The experimental results with three tested fuels show that the fuel spray development was not affected apparently by the oxygenating. Compared with the base fuel, the ignition delay to pilot injection was shortened by 0%, 11% and 19% for three oxygenated fuels, respectively. The ignition delay to main injection was shortened by 10%, 19% and 38%, respectively. With regard to emissions, the smoke level was reduced by 24% to 90%, depending on fuel properties and engine running conditions. The penalties of increased NOx emissions and fuel consumption were up to 19% and 24%, respectively.
1. Introduction
Adding oxygen-containing chemicals to diesel fuel has been considered to be an effective means to reduce the particulate emission with small penalties on NOx and fuel consumption. This method might be one of the simplest and thus well recognized solutions for improving existing diesel engines to meet increasingly stringent emission regulations. Tens of oxygen-containing hydrocarbons have been evaluated in relation to compression ignition engine applications [1,2]. The additives can be divided into two types—biomass products and synthetic products.
Initially motivated by the first oil crises in the 1970s, investigations of the biomass fuels were aimed at replacing conventional petroleum supplies. Later on, more attention has been focused on CO2 and PM (Particulate Matter) emissions using renewable, oxygen-containing biomass fuels from vegetable oils [3,4].
Pure vegetable oils are not suitable for internal combustion engines directly because of their high viscosity, poor volatility, and low cetane number, which result from the large molecular mass and chemical structure and cause incomplete combustion and heavy smoke [5]. Therefore, in current practice, methyl ester is commonly made by combining the vegetable oil with methanol and blended with normal petroleum fuels. In Europe, RME (Rapeseed Methyl Ester) is already commercially available for use in vehicles [6]. Currently, most engine manufacturers accept up to 5% RME additive in normal fossil fuel, without need of basic modification to the engine design. As a re-generable fuel, RME is more CO2 friendly than conventional diesel fuel [7]. In addition, RME contains no aromatics, which are contributors to engine particulate emission [8,9]. Because of its approximately 10% [10,11] oxygen content, low sulfur content, zero aromatics content, and higher cetane number, RME has been found to be able to lower PM (Particulate Matter) emission, although with possible penalty of higher NOx emission [12].
With regard to synthetic additives, one potential candidate is diglyme (C6H14O3), which has 35.8% oxygen content by weight, a density of 943 kg/m3, cetane number about 112, and heat value of 32.17 MJ/kg [13]. Another synthetic product, Butyl-Diglyme (C12H26O3), has higher boiling point than diglyme. Similar to RME, when synthetic product is added to normal diesel fuel, the presence of oxygen in the molecule gives them possible improvement on ignition or reduced ignition delay compared to normal diesel.
The advantage of oxygenates for reducing engine PM emissions is well known. However, fuel oxygenation could lead to higher NOx emission, as NOx normally increases with oxygen concentration and combustion temperature in the cylinder [14]. If having adequate optimization on engine combustion system and on combustion control strategy, blending normal diesel fuel with oxygenates could produce benefit for improving trade-off between NOx and PM [15,16]. Modern diesel engines equipped with an electronically controlled injection system, especially common rail injection system, and EGR (Exhaust Gas Recirculation) system, can provide great flexibility to the optimization in order to make full use of the advantage of the oxygenated fuels.
While various bio-fuels and synthetic additives are added and will be added into commercial diesel fuel, it is necessary to understand their influences on air-fuel mixing, engine combustion processes and consequently on exhaust emissions. The objectives of presented research are to investigate effects of oxygenated diesel fuel on fuel injection characteristics, engine combustion and emissions, while different additives also provide different changes to fuel properties, such as cetane number, etc. The experimental investigations were carried out on an optical test engine and a four-cylinder production engine, respectively.
2. Experimental Description
2.1. Test Fuels
The reference diesel fuel used in this study was Finnish City diesel (summer grade), named as the base fuel. Three derivatives that contain different oxygen contents and reached by different mixture compositions were derived from the base diesel fuel by blending Rapeseed Methyl Ester (RME) or Diglyme and Butyl-Diglyme with different quantities to make their oxygen content to be 3%, 3% and 9%, respectively. The properties of the four fuels and two oxygenated additives are shown in Table 1 and Table 2, respectively.
2.2. Optical Test Apparatus and Conditions
An optical single cylinder test engine equipped with common rail fuel injection system was employed for the present investigation. The Schematic of the test rig can be seen in Figure 1. The specially made cylinder was installed in a single cylinder 4-stroke naturally aspirated diesel engine, which had an extended barrel and an upper piston arrangement to provide optical access into the piston bowl. The optical path is via an adjustable mirror positioned under the upper piston and a removable fused-silica window in the piston crown. The engine used a Bosch common rail injection system, of which the ECU (Engine Control Unit) control program could be accessed via a computer. Figure 2 shows the picture of the engine and Table 3 lists the main specifications of the optical engine and its injection system.

Table 1.
Properties of tested fuels.
| Fuel Type | Base Fuel | Oxy1 | Oxy2 | Oxy3 |
|---|---|---|---|---|
| Mixture Composition | Finnish City diesel summer grade | Base + RME 3% oxygen 70.0% Base 30.0% RME | Base + Glymes 3% oxygen 90.7% Base 5.0% Digly 4.3% B-digly | Base + Glymes 9% oxygen 71.4% Base 15.0% Digly 13.6% B-digly |
| Density 15 °C (kg/m3) | 833.7 | 848.2 | 840.5 | 854.9 |
| Cetane number | 53.3 | 54.2 | 59.5 | 72.7 |
| Viscosity 40 °C (mm2/s) | 2.94 | 3.27 | 2.54 | 1.99 |
| Surface tension 20 °C (mN/m) | 28 | 29.6 | 28.7 | 28.6 |
| Compressibility 490 bar (10−5/bar) | 6.22 | 6.01 | - | 6.39 |
| Compressibility 60 bar, 20 °C (10−5/bar) | 6.81 | 6.56 | 6.87 | 6.98 |
| Carbon (%) | 86.1 | 83 | 83.2 | 78 |
| Hydrogen (%) | 14 | 13.3 | 13.6 | 5.9 |
| C/H ratio | 6.1 | 6.2 | 6.1 | 5.9 |
| Lower calorific value (MJ/kg) | 42.95 | 41.10 | 41.53 | 38.74 |
Table 2.
Properties of two oxygenated additives.
| Compound | Diglyme | Butyl-Diglyme |
|---|---|---|
| Chemical formula | C6H14O3 | C12H26O3 |
| Molar mass (g/mol) | 134.18 | 218.33 |
| Molecular structure | 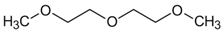 | 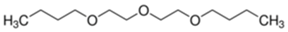 |
The fuel injection and combustion processes in the engine cylinder were recorded with a high-speed MEMRECAMfx K3 color video camera (North American Corporate, Glenview, IL, USA) at a framing rate of 10,000 frames per second. To illuminate the fuel spray, a CU15 type copper vapor laser (Oxford Lasers Ltd., Didcot, UK) supplied by Oxford Laser was used. In-cylinder pressure was sampled at 0.2 °CA resolution for heat release analysis by averaging 100 continuous working cycles. The visible fuel spray development process, the ignition, and flame development processes were recorded with the high-speed camera and stored in the computer. The spray penetration development, the visible ignition, and visible flame development processes were afterwards analyzed with the computer software named ImageProPlus4.1 (Media Cybernetics Inc., Rockville, MD, USA).
In Table 4, the test conditions are summarized. In order to make the tests comparable for the different fuels, test condition settings were kept as identical as possible for all four fuels. The nominal engine speed was set at 1600 rpm. In practice, the actual speed had variances up to 50 rpm, because, in order to get a stabilized precise speed of 1600 rpm, it would have taken some time and this would have resulted in undesirable accumulation of soot on the optical windows through which the spray and combustion were being photographed.
In all tests, the engine speed varied within the range of 1600 to 1650 rpm. The pressure in the common rail of the injection system was set at 1000 bar. In all tests, the electronic command for the pilot injection start was set at 30 °CA BTDC (Before Top Dead Centre), with pilot injection quantity of 5 mm3 per cycle, which was equivalent to between 4.2 and 4.3 mg per cycle, depending on the fuel density. Because of the different densities and heat values, the energy contained in the 5 mm3 pilot delivery for Oxy1, Oxy2 and Oxy3 were 2.5%, 2.8% and 7.7% lower than that of the base fuel, respectively. The main injection was set to start at 10 °CA BTDC, though visible main injection from the images was seen to start at around 6.8 °CA BTDC. The main injection fuel quantity was adjusted so that the air/fuel ratio was kept at 20:1 for all the fuels. Due to the optical access modifications of the Ricardo Hydra engine, the compression ratio was reduced to 15.88. Thus, the intake air was heated to 100 °C to ensure smooth ignition and combustion. The differences in the fuel viscosities and other features can be neglected in regard to the injection rate, i.e., the same injection map was used in determining the injection durations.

Figure 1.
Schematics of test engine with optical access to the combustion chamber.
Figure 1.
Schematics of test engine with optical access to the combustion chamber.
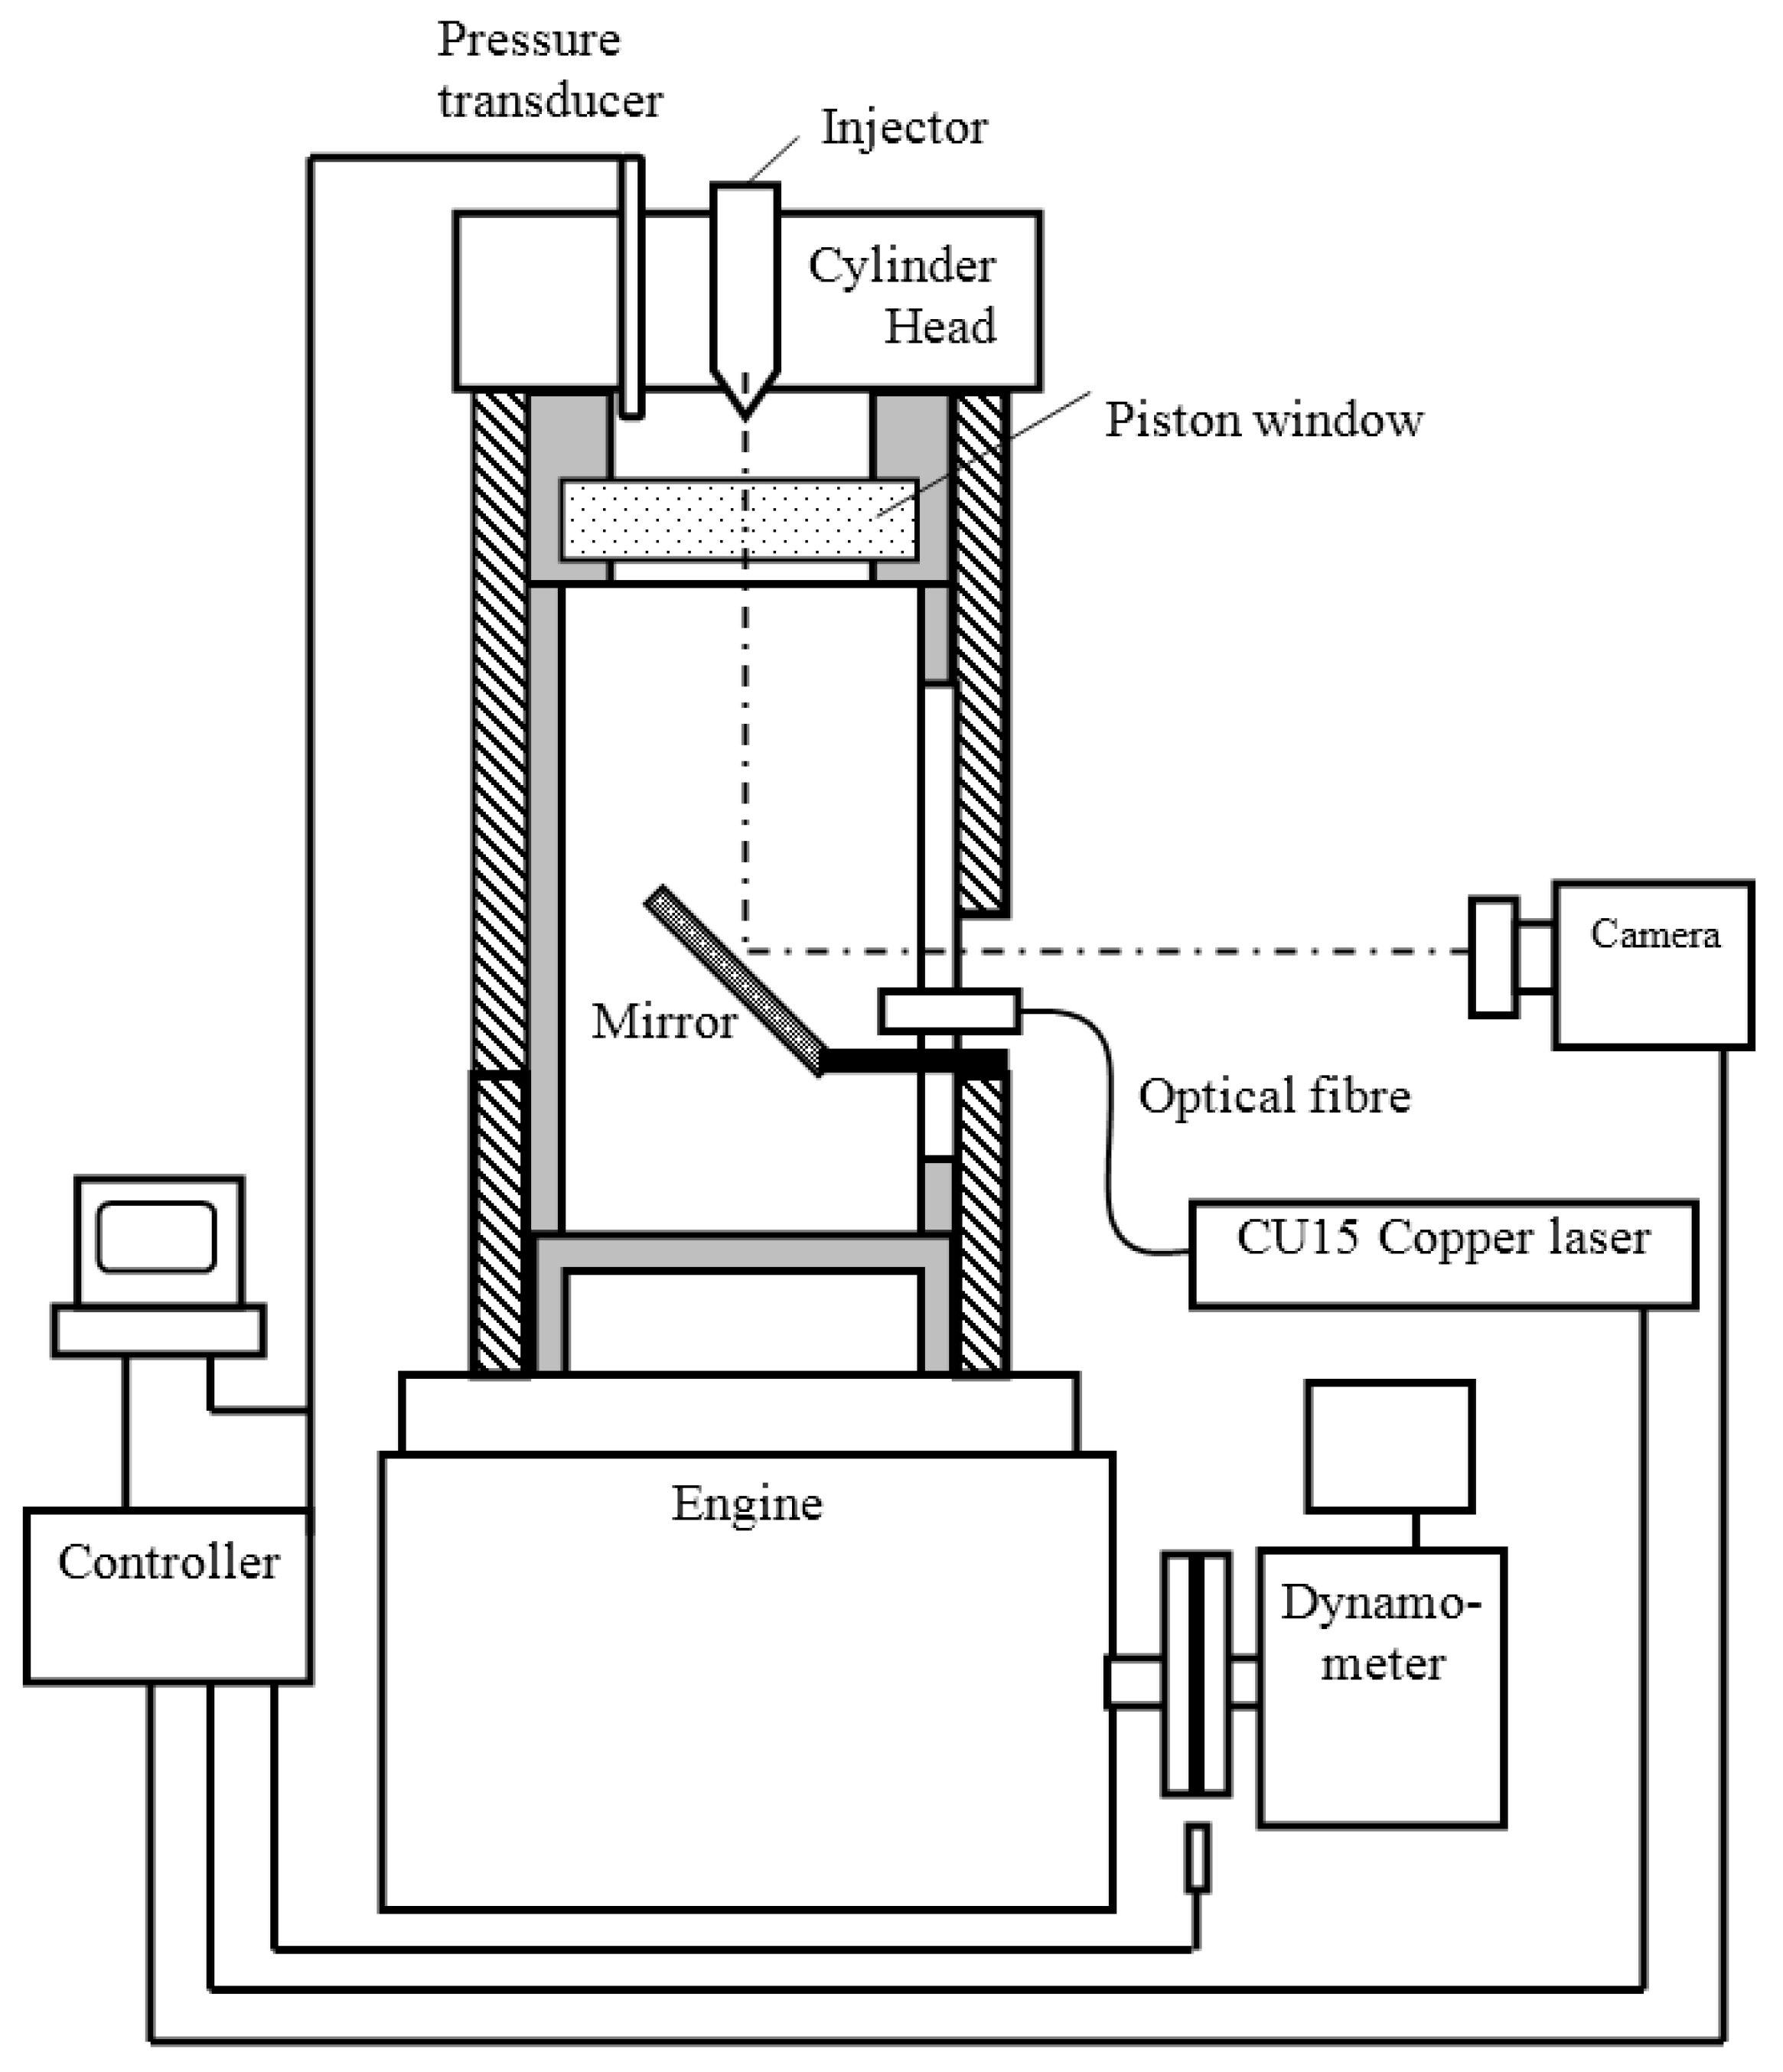

Figure 2.
Test engine with optical window, etc.
Figure 2.
Test engine with optical window, etc.
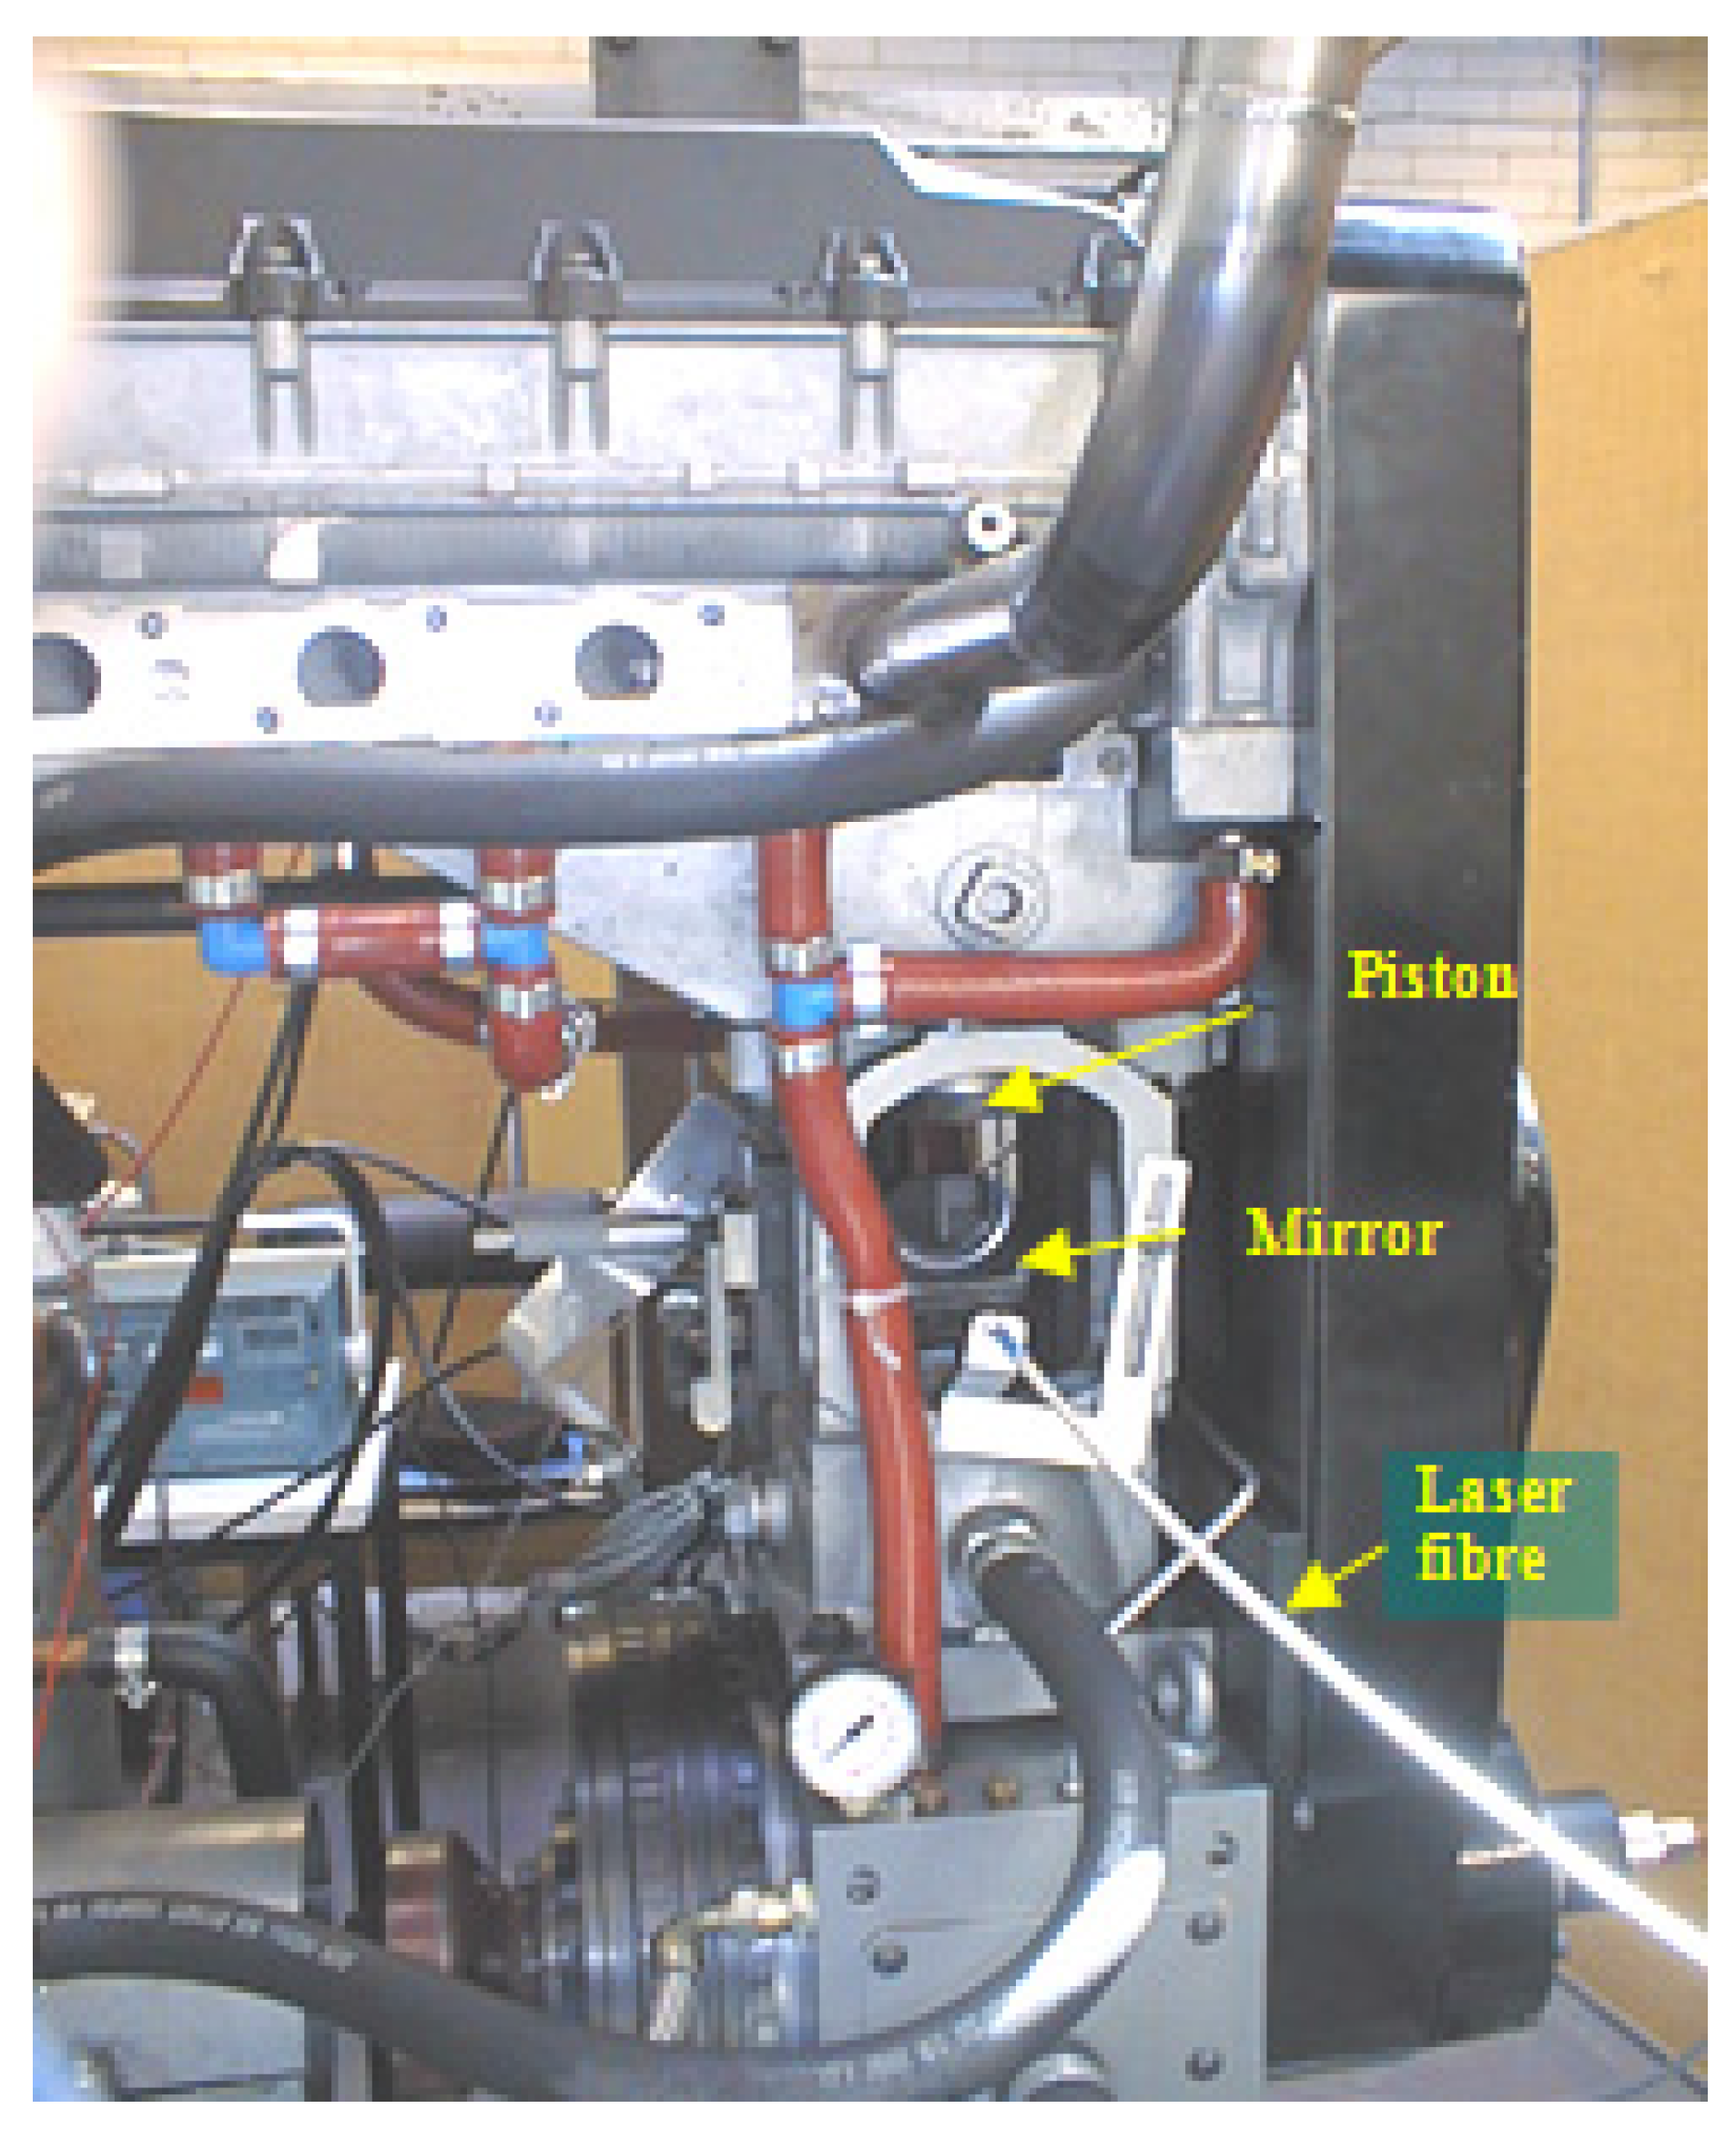
Table 3.
Specifications of optical test engine.
| Engine Type | RICARDO Hydra Single Cylinder 4-Stroke Naturally Aspirated Diesel Engine with Modified Ford Puma Cylinder Head |
|---|---|
| Bore | 86 mm |
| Stroke | 86 mm |
| Connecting rod length | 154 mm |
| Compression ratio | 15.88 |
| Diameter/depth of piston bowl | 43.4/11.6 mm |
| Number of valves | 4 |
| Injection system type | Bosch common-rail, Direct injection, single central injector |
| High pressure fuel pump | Bosch common rail pump |
| Number of nozzle orifices | 6 |
| Nozzle orifice diameter/length | 0.149/1.0 mm |
| Nozzle orifice cone angle | 170° |
| Injection control unit model | ETK 3.1 |
Table 4.
Operation conditions of the optical test engine.
| Test No. | 031115 | 030115 | 021128 | 020708 |
| Fuel | Base | Oxy1 | Oxy2 | Oxy3 |
| Ambient Pressure (mmHg) | 740.3 | 763.5 | 751.55 | 754.55 |
| Ambient Temperature (°C) | 20 | 20 | 20 | 21 |
| Engine Intake Temperature (°C) | 100 | 100 | 100 | 100 |
| Engine Speed (rpm) | 1608 | 1617 | 1623 | 1646 |
| Injection Pressure (bar) | 1000 | 1000 | 1000 | 1000 |
| Injection Quantity (mm3·(mg)/cycle) | 5 (4.2) | 5 (4.2) | 5 (4.2) | 5 (4.3) |
| Pilot, Main Injection Timings (°CA BTDC) | 30, 10 | 30, 10 | 30, 10 | 30, 10 |
| Air/Fuel Ratio by Mass | 20.2 | 20.5 | 20.4 | 19.9 |
2.3. Emissions Test Apparatus and Conditions
Emissions tests were conducted on a Ford Puma 4-cylinder, 16-valve turbocharged diesel engine (Ford Motor Company, Basildon, UK) equipped with 1600 bar common rail injection system. The engine has 1998.23 cc swept volume with both bore and stroke of 86 mm. The compression ratio is 18.2. Test conditions of emissions test are listed in Table 5. All three tests were operated without EGR, though the engine has an intercooled EGR system. The exhaust emissions, such as hydrocarbons, nitrogen oxides, and carbon oxides, were measured with Horiba gas analyzers (MEXA-9100D) (Horiba UK Ltd., Northampton, UK). Smoke was detected by an AVL smoke meter based on the filter paper method.
Table 5.
Emissions test conditions.
| Test No. | Engine Speed (rpm) | Torque (Nm) | Pilot Injection Timing (°CA BTDC) | Start of Main Injection (°CA BTDC) |
|---|---|---|---|---|
| 1 | 2000 | 148 | 30 | 1.69 |
| 2 | 2000 | 236 | No pilot injection | 3.00 |
| 3 | 4000 | 170 | No pilot injection | 10.75 |
3. Results and Discussion
3.1. Fuel Spray Characteristics
Figure 3 shows the pictures selected from the series of videos taken with the high-speed camera. From the pictures, it can be seen that, generally, the visible start of combustion for the oxygenated fuels took place earlier than that for the base fuel. All combustion starts around cylinder wall where there is most appropriate air-fuel ratio for auto-ignition at the beginning. Afterward, at TDC (Top Dead Centre), the flames for the oxygenated fuels had dispersed more uniformly. Few differences can be distinguished by eye in the processes of fuel spray and combustion.
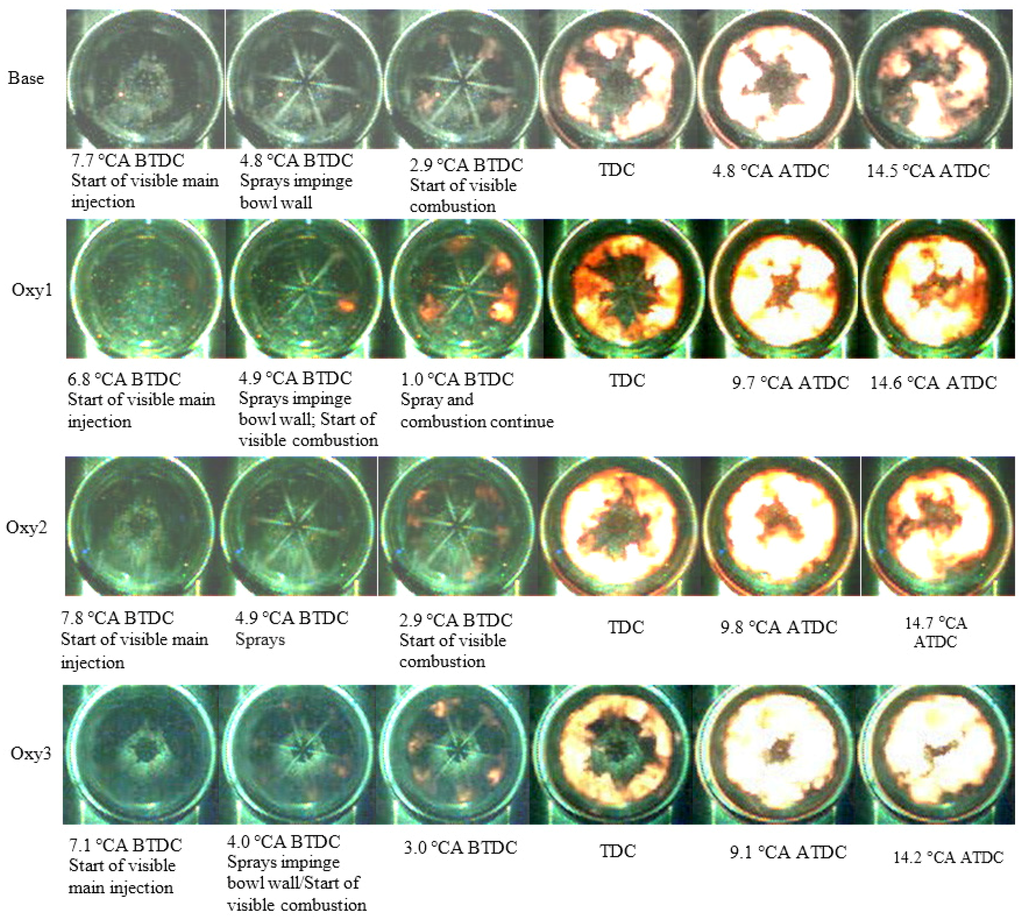
Figure 3.
Visible fuel spray and combustion processes for different fuels.
Figure 3.
Visible fuel spray and combustion processes for different fuels.
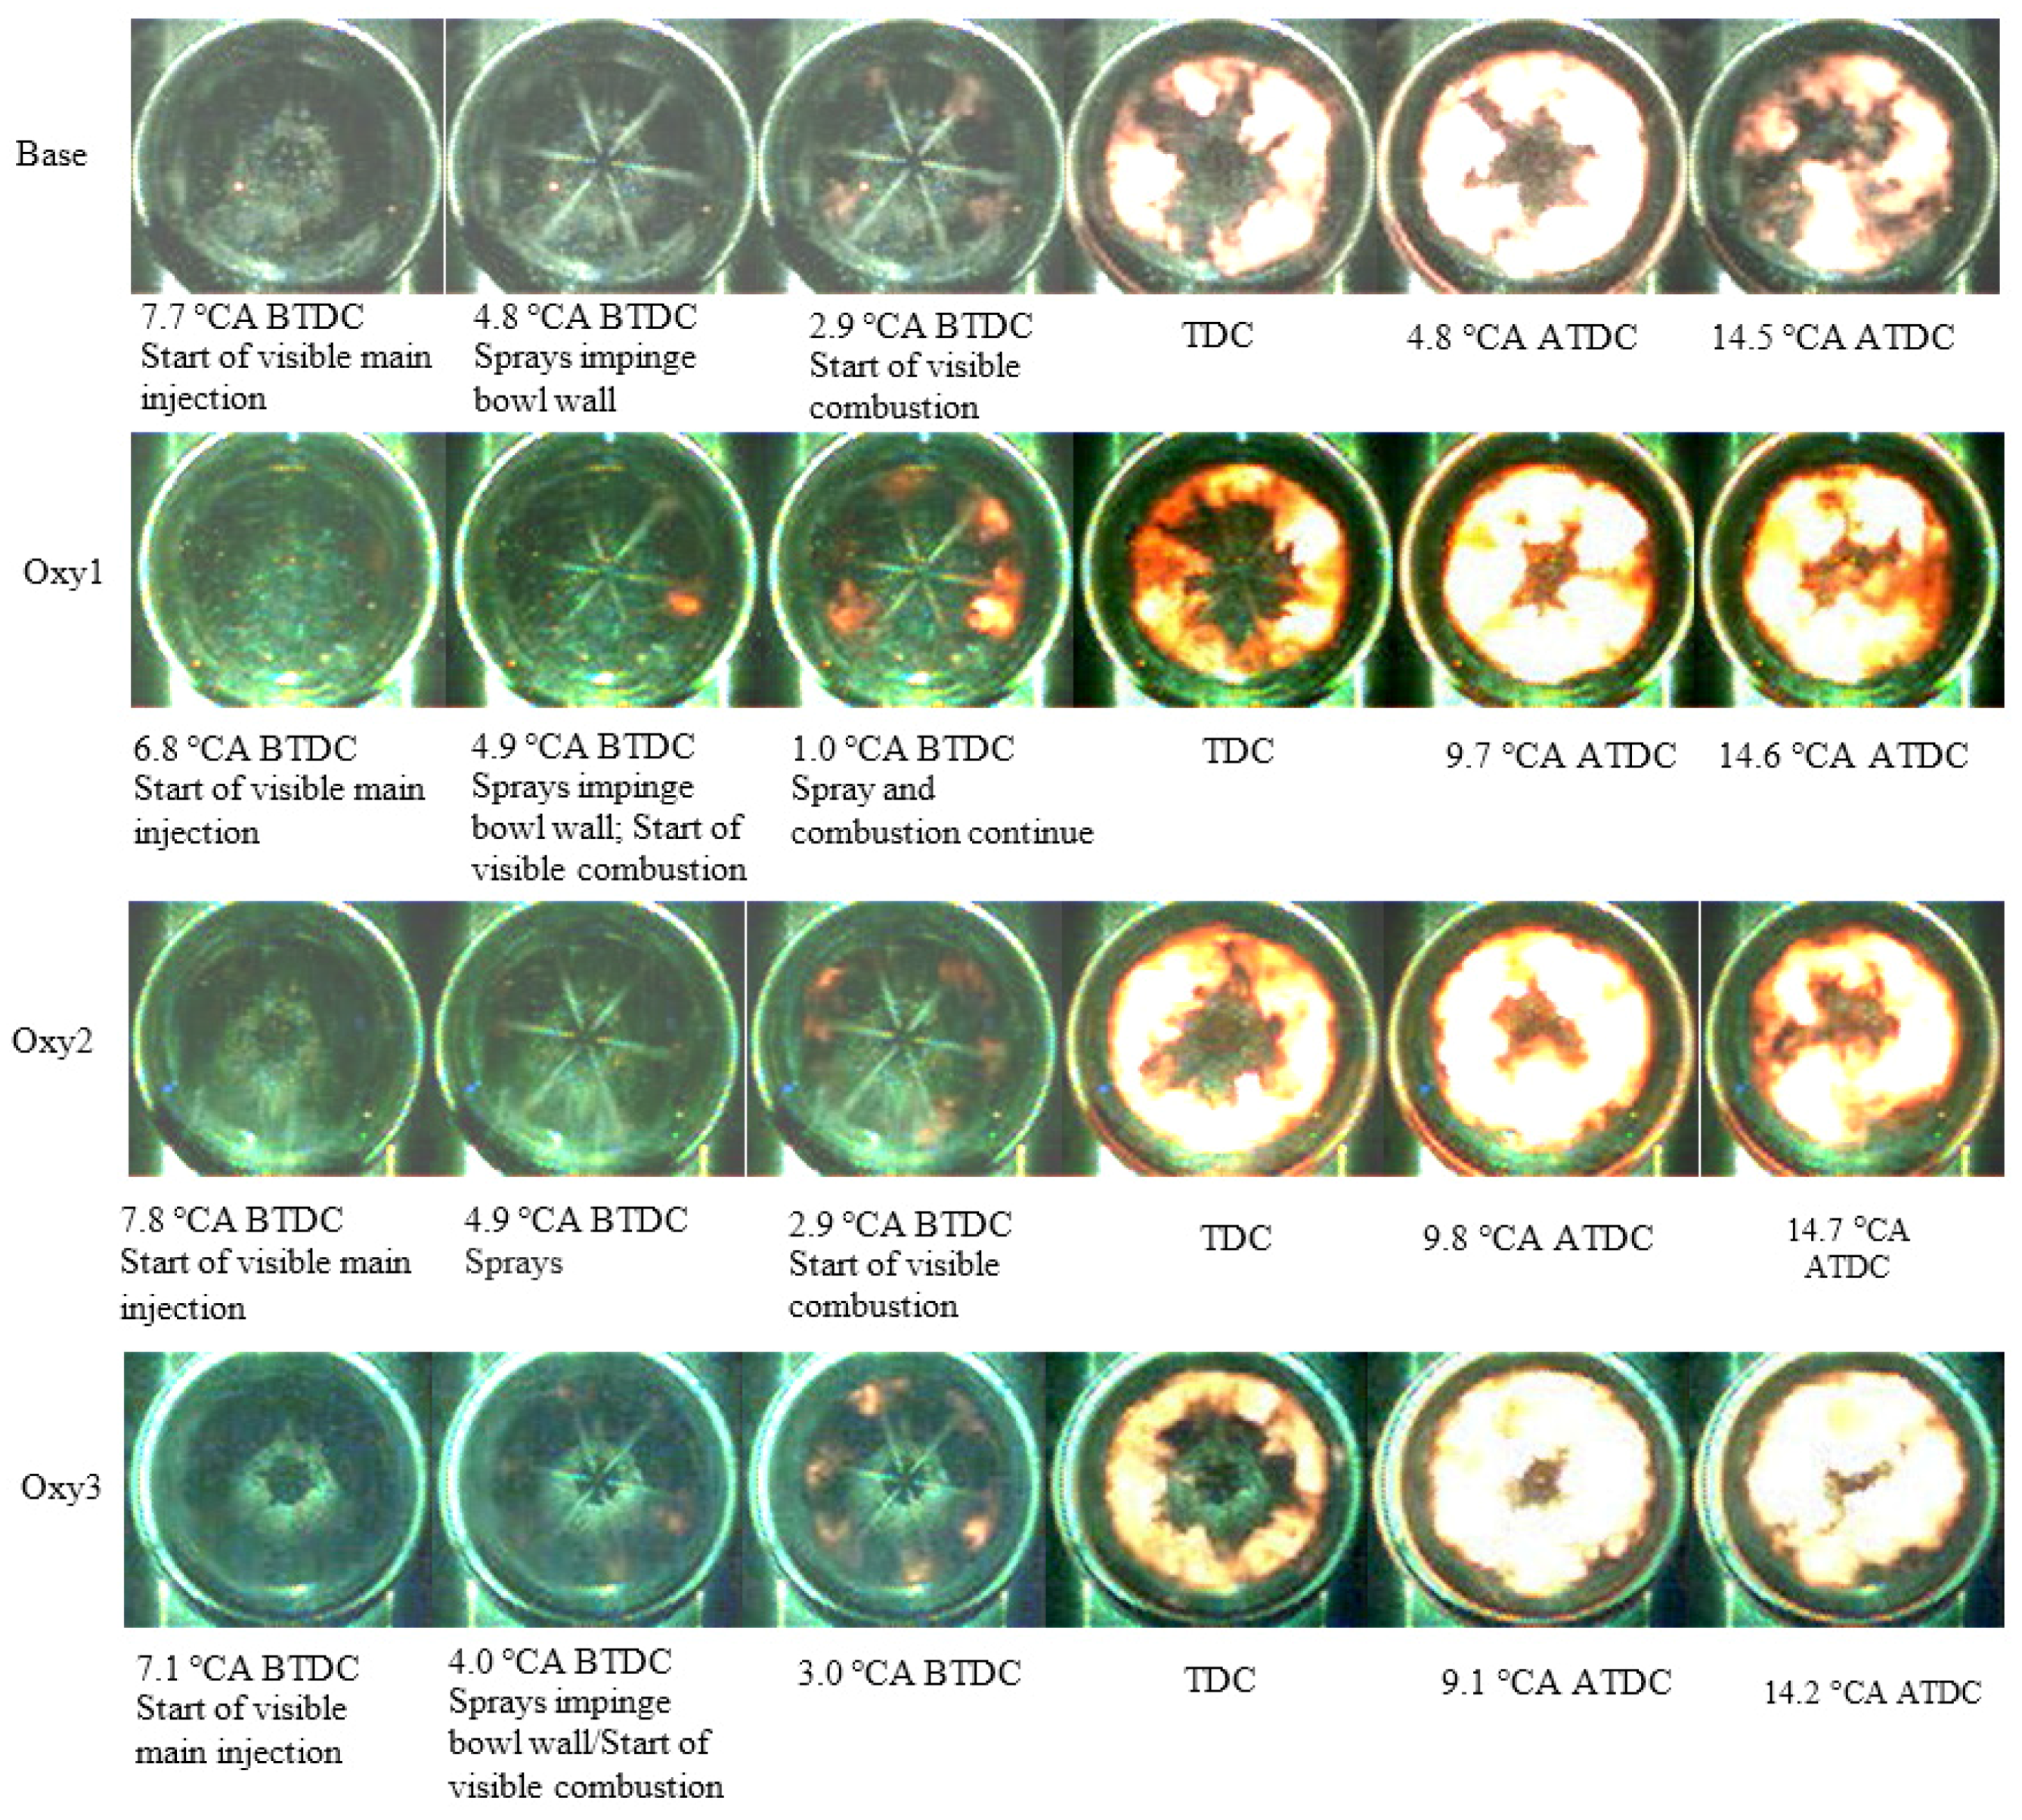
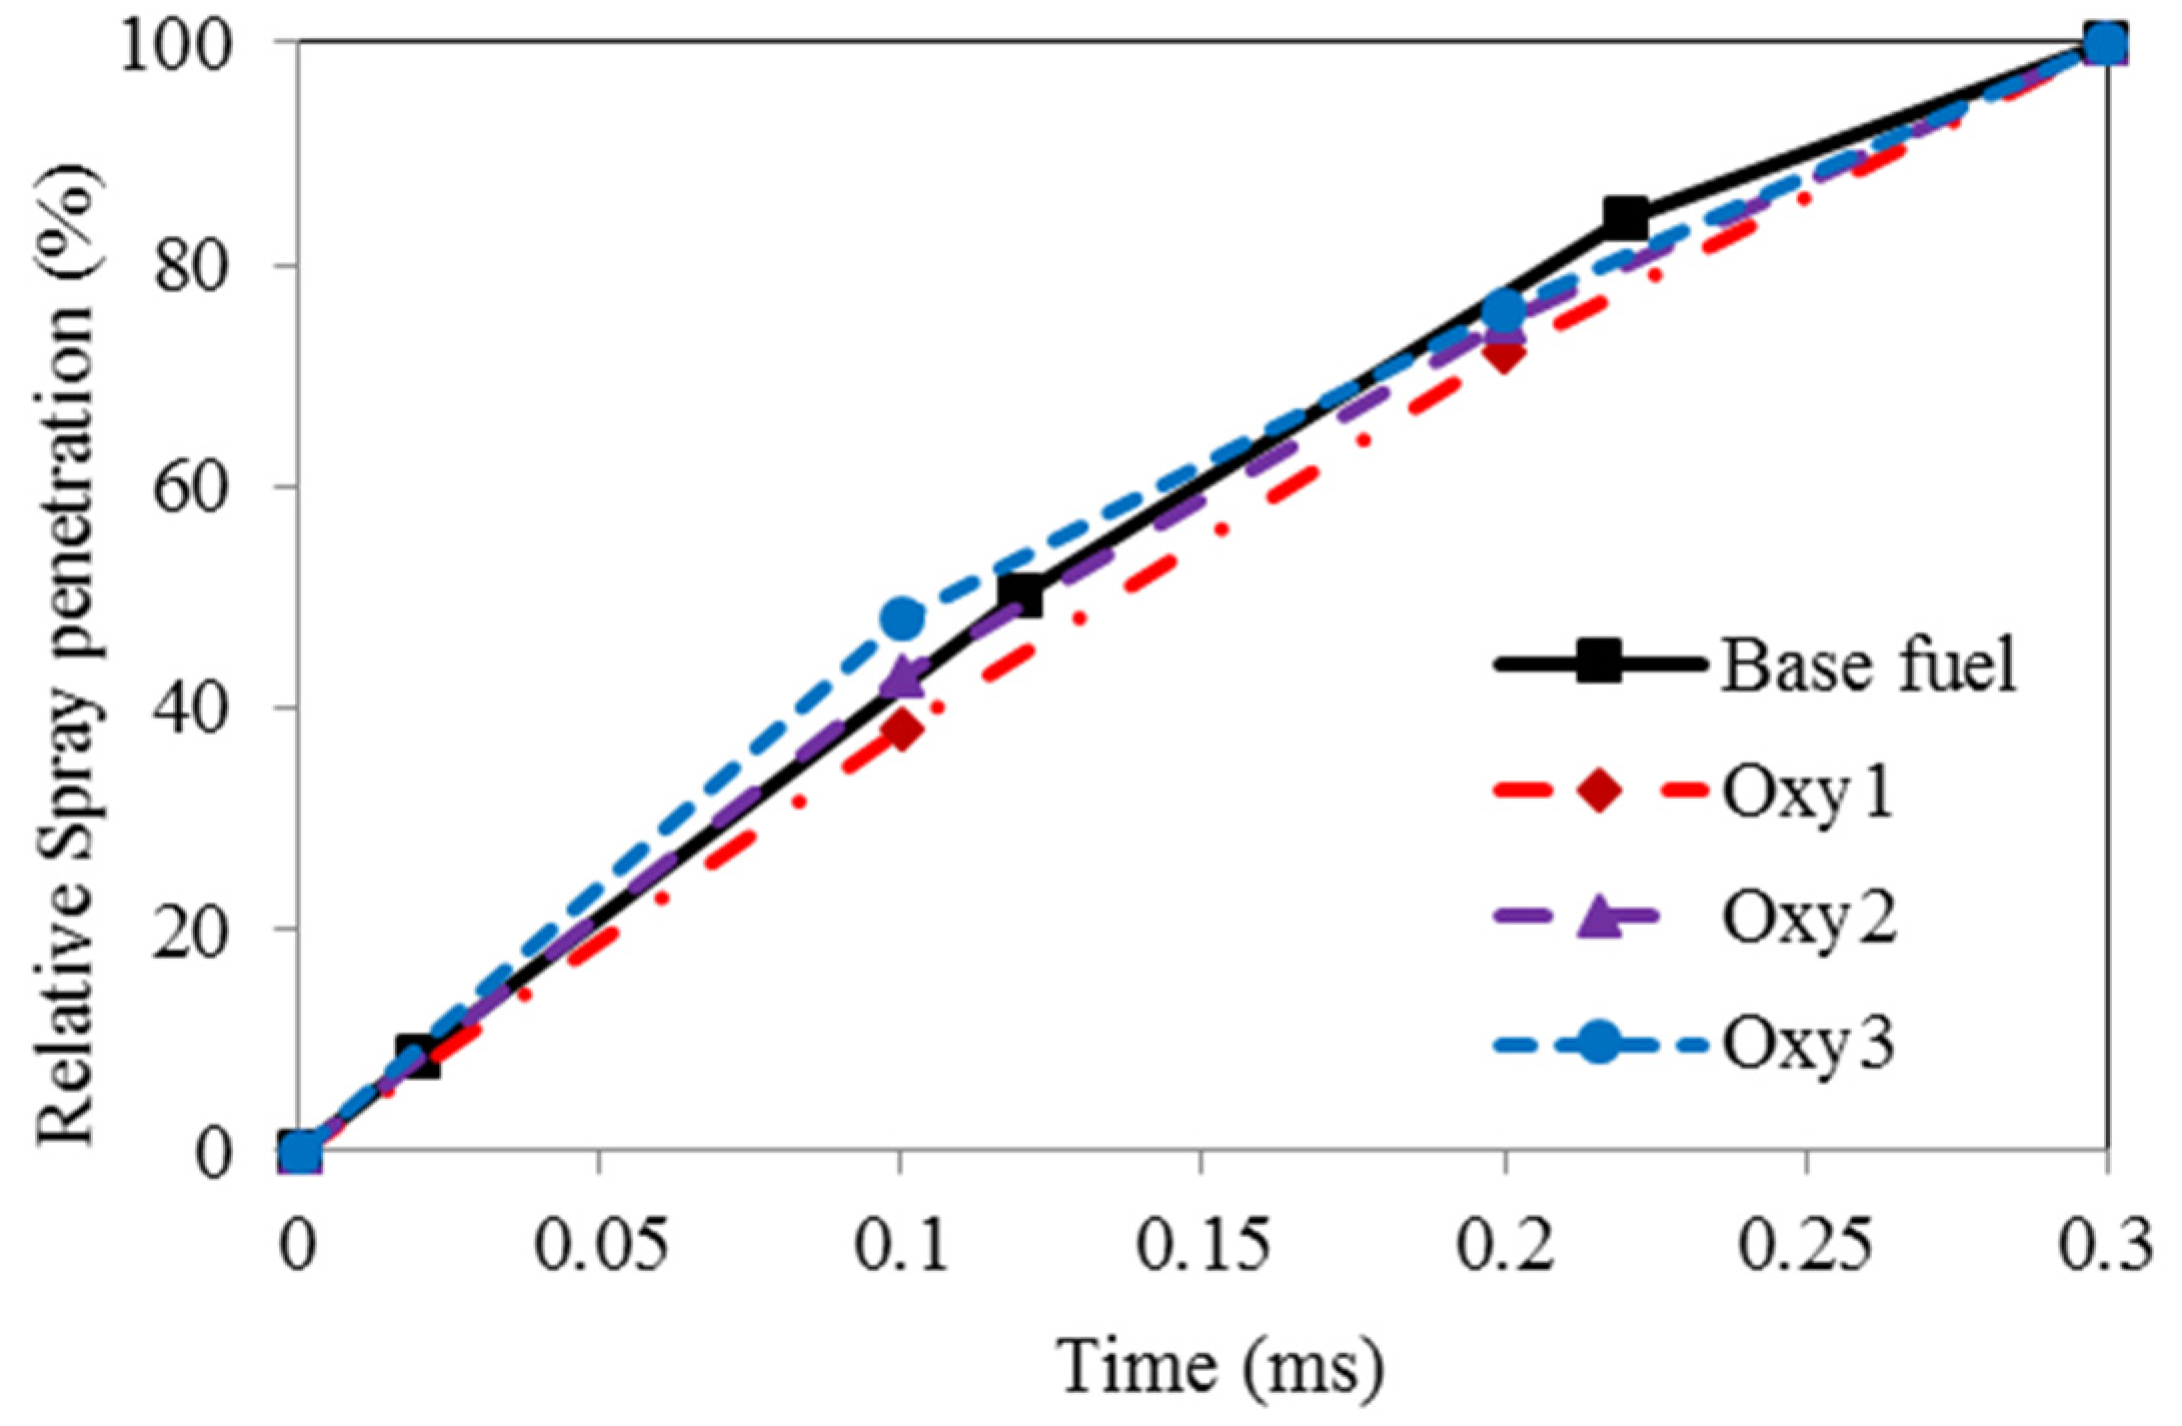
Figure 4 shows the measured fuel spray tip penetration development for various fuels on time basis. The values illustrated in the plots are the ratio of the spray length to the full distance between the nozzle orifice and the combustion chamber wall. It seems that the spray of the Oxy1 fuel, which has the highest viscosity, developed the slowest, whereas the Oxy3 fuel spray, due to its lowest viscosity, developed the quickest. No obvious difference between the spray development speeds for the base and the Oxy2 fuels is observed.

Figure 4.
Fuel spray developments.
Figure 4.
Fuel spray developments.
3.2. Ignition and Flame Development
Due to the low level of incandescence, the flame can hardly be seen on the video pictures before the ignition after the main injection, although heat release analysis confirms that combustion did occur before the main injection started. From the video pictures in Figure 3, it can be seen that the fuel sprays of the main injection impinged the wall of the combustion chamber, vaporized, and mixed with air. After that, ignition occurred within the mixture near the combustion chamber wall around the fuel spray jet while injection was still continuing. The flame fragments formed at the early combustion stage spread and, simultaneously, forced by the swirl movement of the air charge, moved circumferentially along the combustion chamber wall, encountered the adjacent ones and merged with each other. In addition, the flames appeared to spread upstream along the sprays towards the injector. In this manner, the flame increased its occupation volume until reaching maxima in the combustion chamber space before combustion started to deplete.
The area of the combustion chamber covered by the flames during the combustion period was measured on the pictures taken with the high-speed camera using the computer software ImageProPlus4.1. These areas covered by flames are shown, for the different fuels, in Figure 5. The Oxy3 fuel seems to be starting to combust earlier than the other fuels and to have burned longer with bigger flame area. It should be noted that the measurement of the flame silhouette area shows more qualitatively rather than quantitatively the trends of the combustion development process. This is because the silhouette is two-dimensional and cannot, therefore, represent the depth of the flame and, thus, the three-dimensional volume of the flame in the bowl. Furthermore, the area measurement does not include flame density or brightness information, which is also an important indicator for combustion. In addition, some inevitable soot contamination on the optical window surface tends to affect the accuracy of the measurement of the flame occupation area.
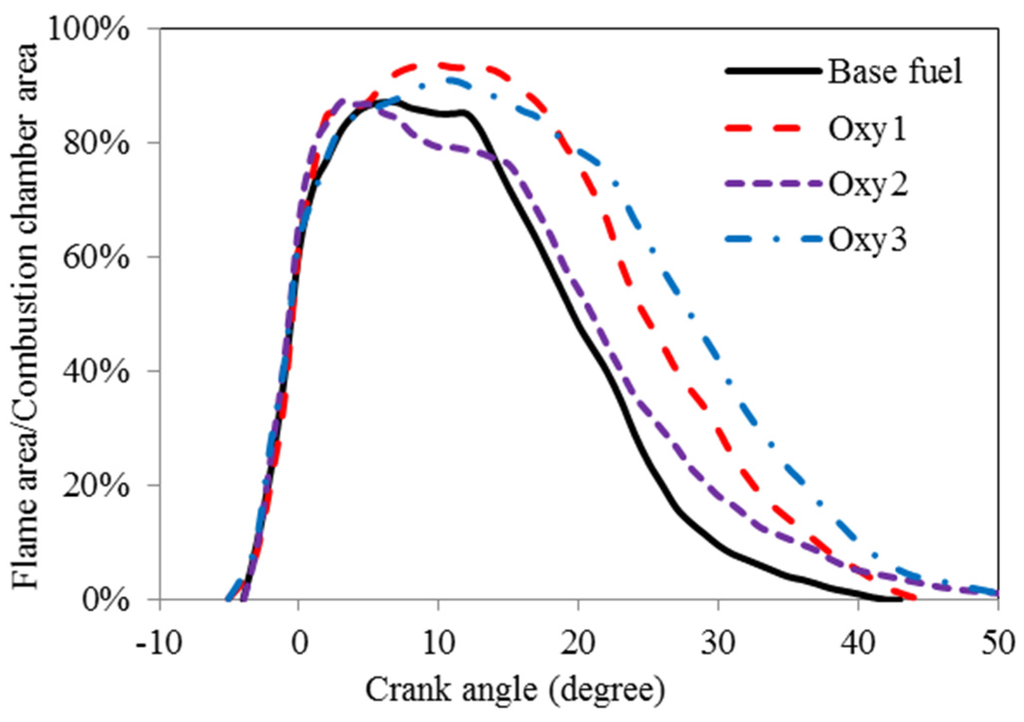
Figure 5.
Flame developments.
Figure 5.
Flame developments.

3.3. Ignition Delay
Ignition delay discussed in this paper is defined as the period from the start of the electronic command of injection to the forthcoming valley on the heat release (net) rate curve (dQ/dθ)min, which was taken as the start of combustion). The heat release rate curves, which were calculated from in-cylinder pressure curves, are plotted in Figure 6. The pilot and main injection ignition delays, defined as above, are shown in Figure 7 and Figure 8, respectively. From Figure 7 and Figure 8, it can be seen that the Oxy1 fuel had similar pilot ignition delay to the base fuel, before the cylinder temperature building up. However, although with the same 3% oxygen content, the Oxy2 shortened the pilot ignition delay by 11% on time basis, proving its higher cetane number. This might be due to the fact that the RME additive in the Oxy1 fuel has higher specific heat and higher density, which slows the evaporation of the fuel droplets and thus suppress the increase of the fuel cetane number. The oxygenate additives have, through the increases of the cetane number, affected ignition delay period remarkably.

Figure 6.
In-cylinder trace and net heat release rates.
Figure 6.
In-cylinder trace and net heat release rates.
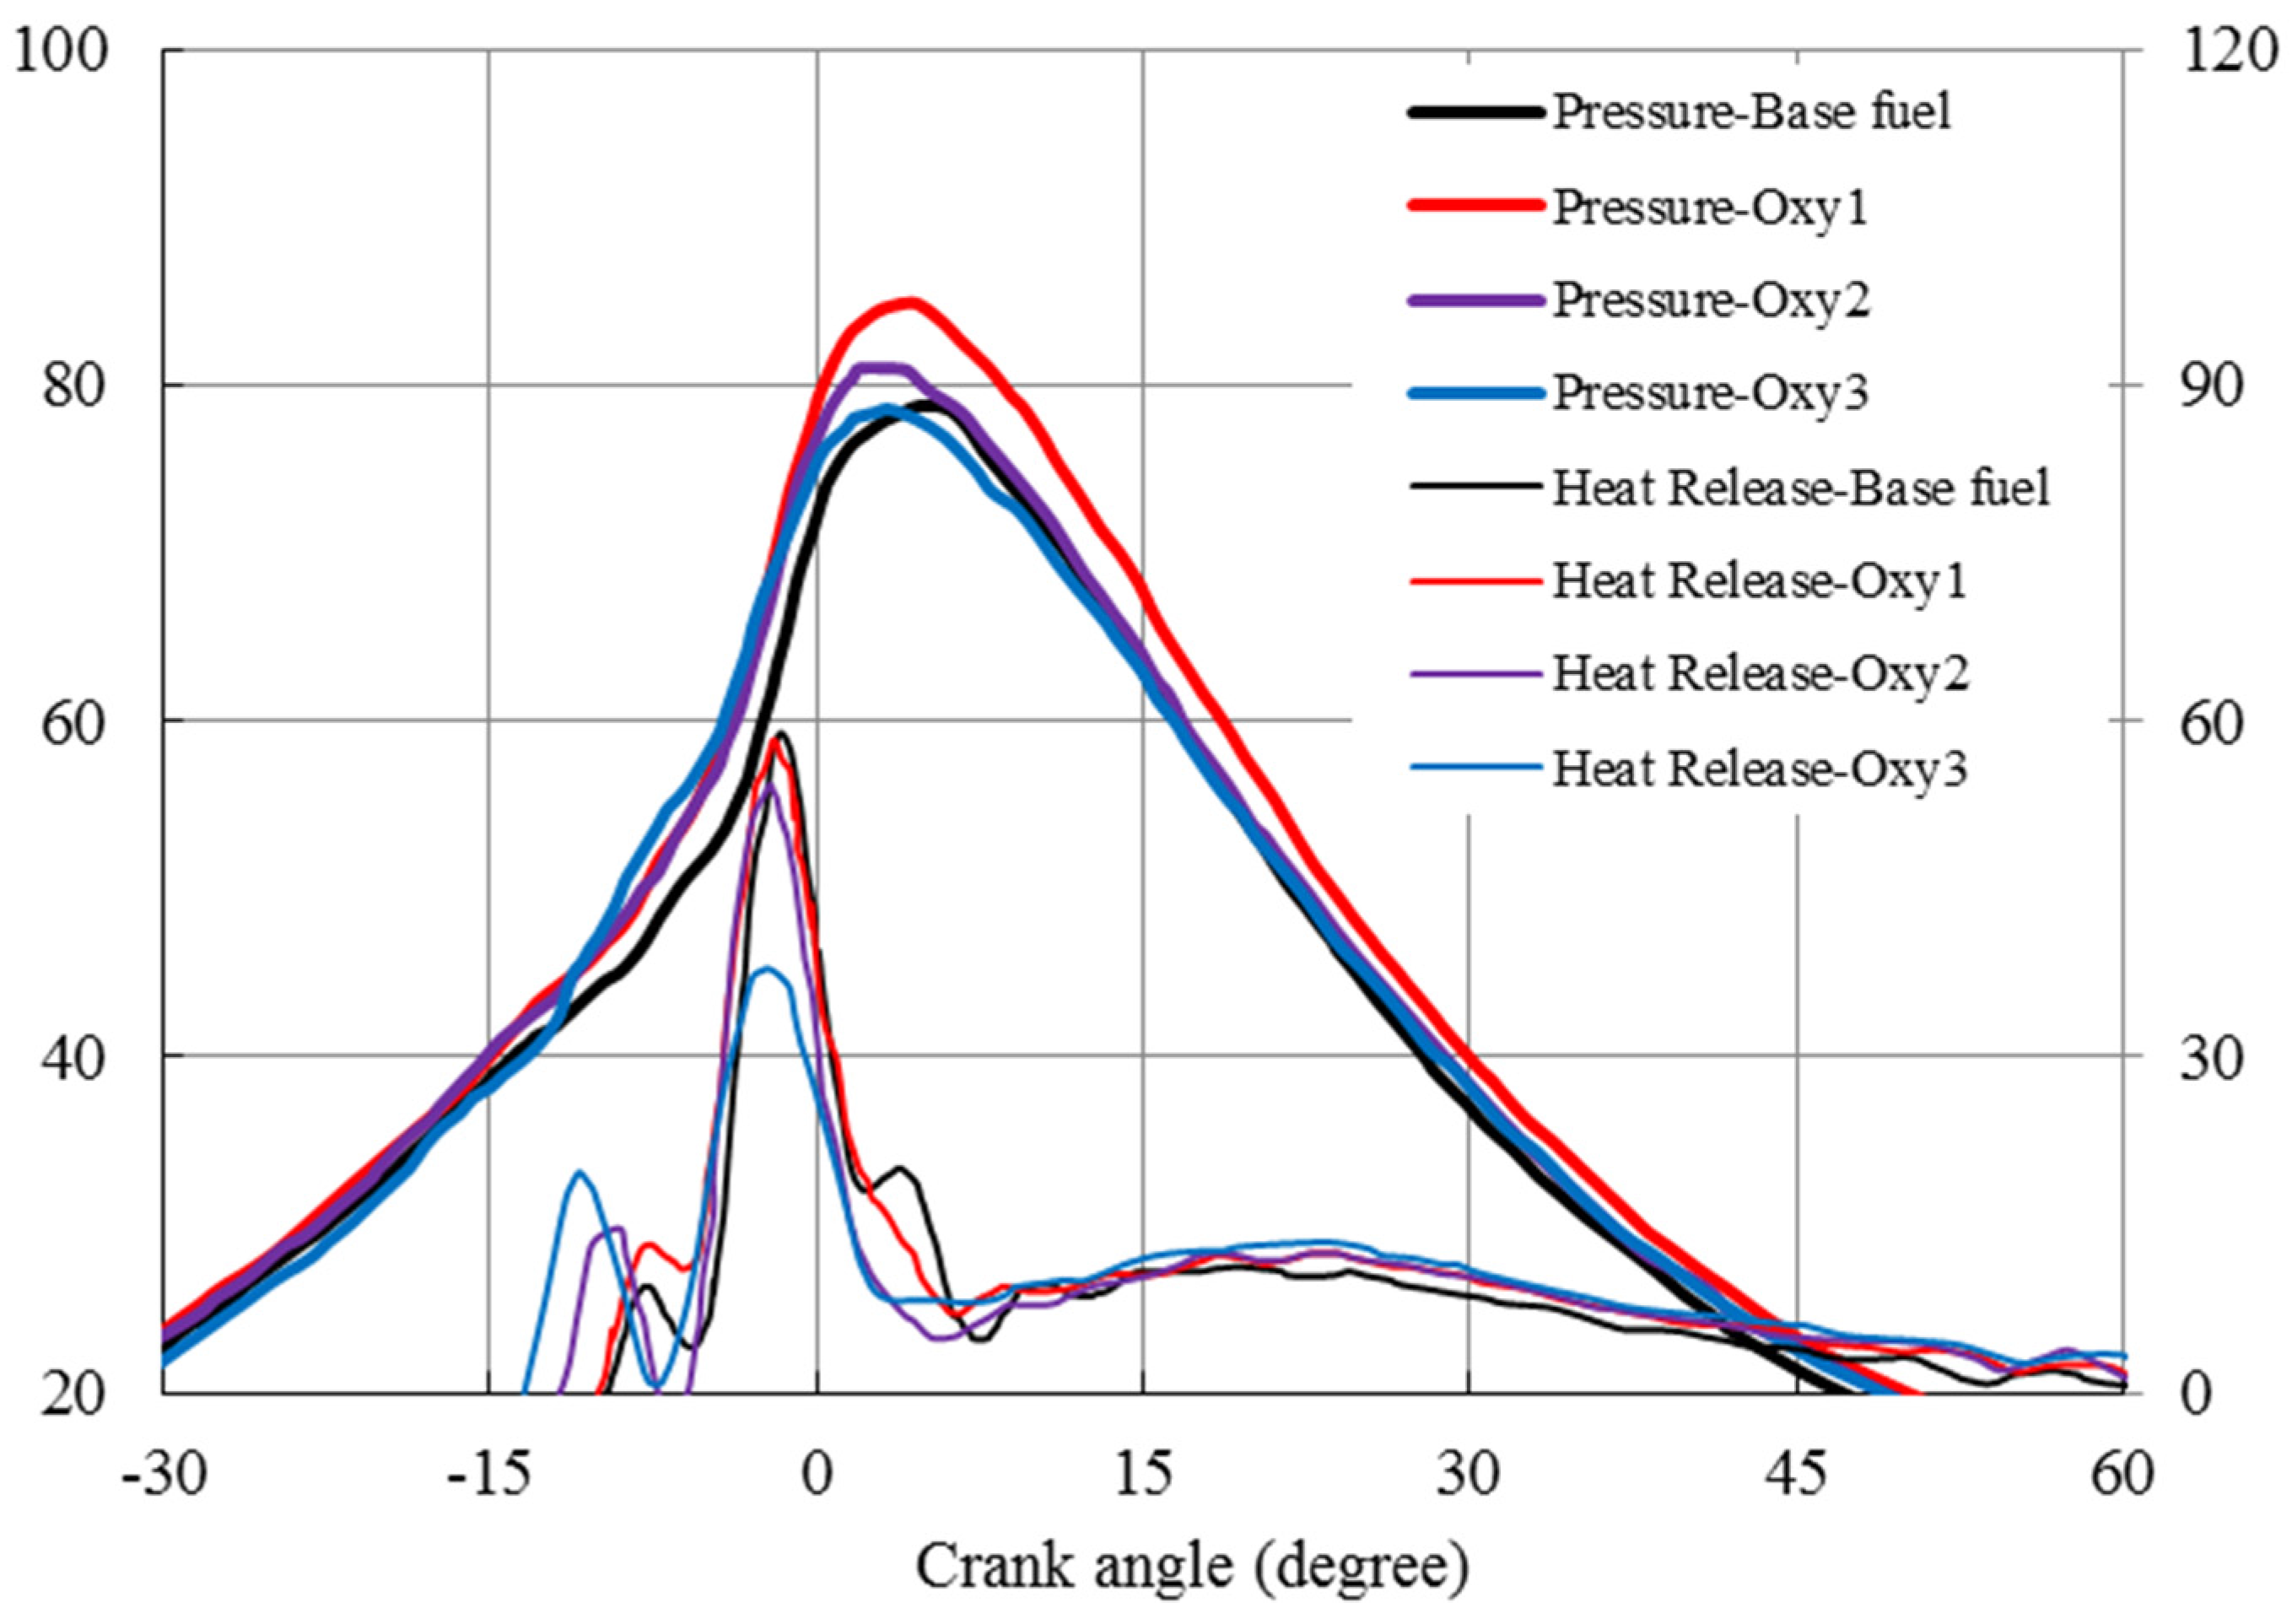

Figure 7.
Ignition delays to pilot injection.
Figure 7.
Ignition delays to pilot injection.
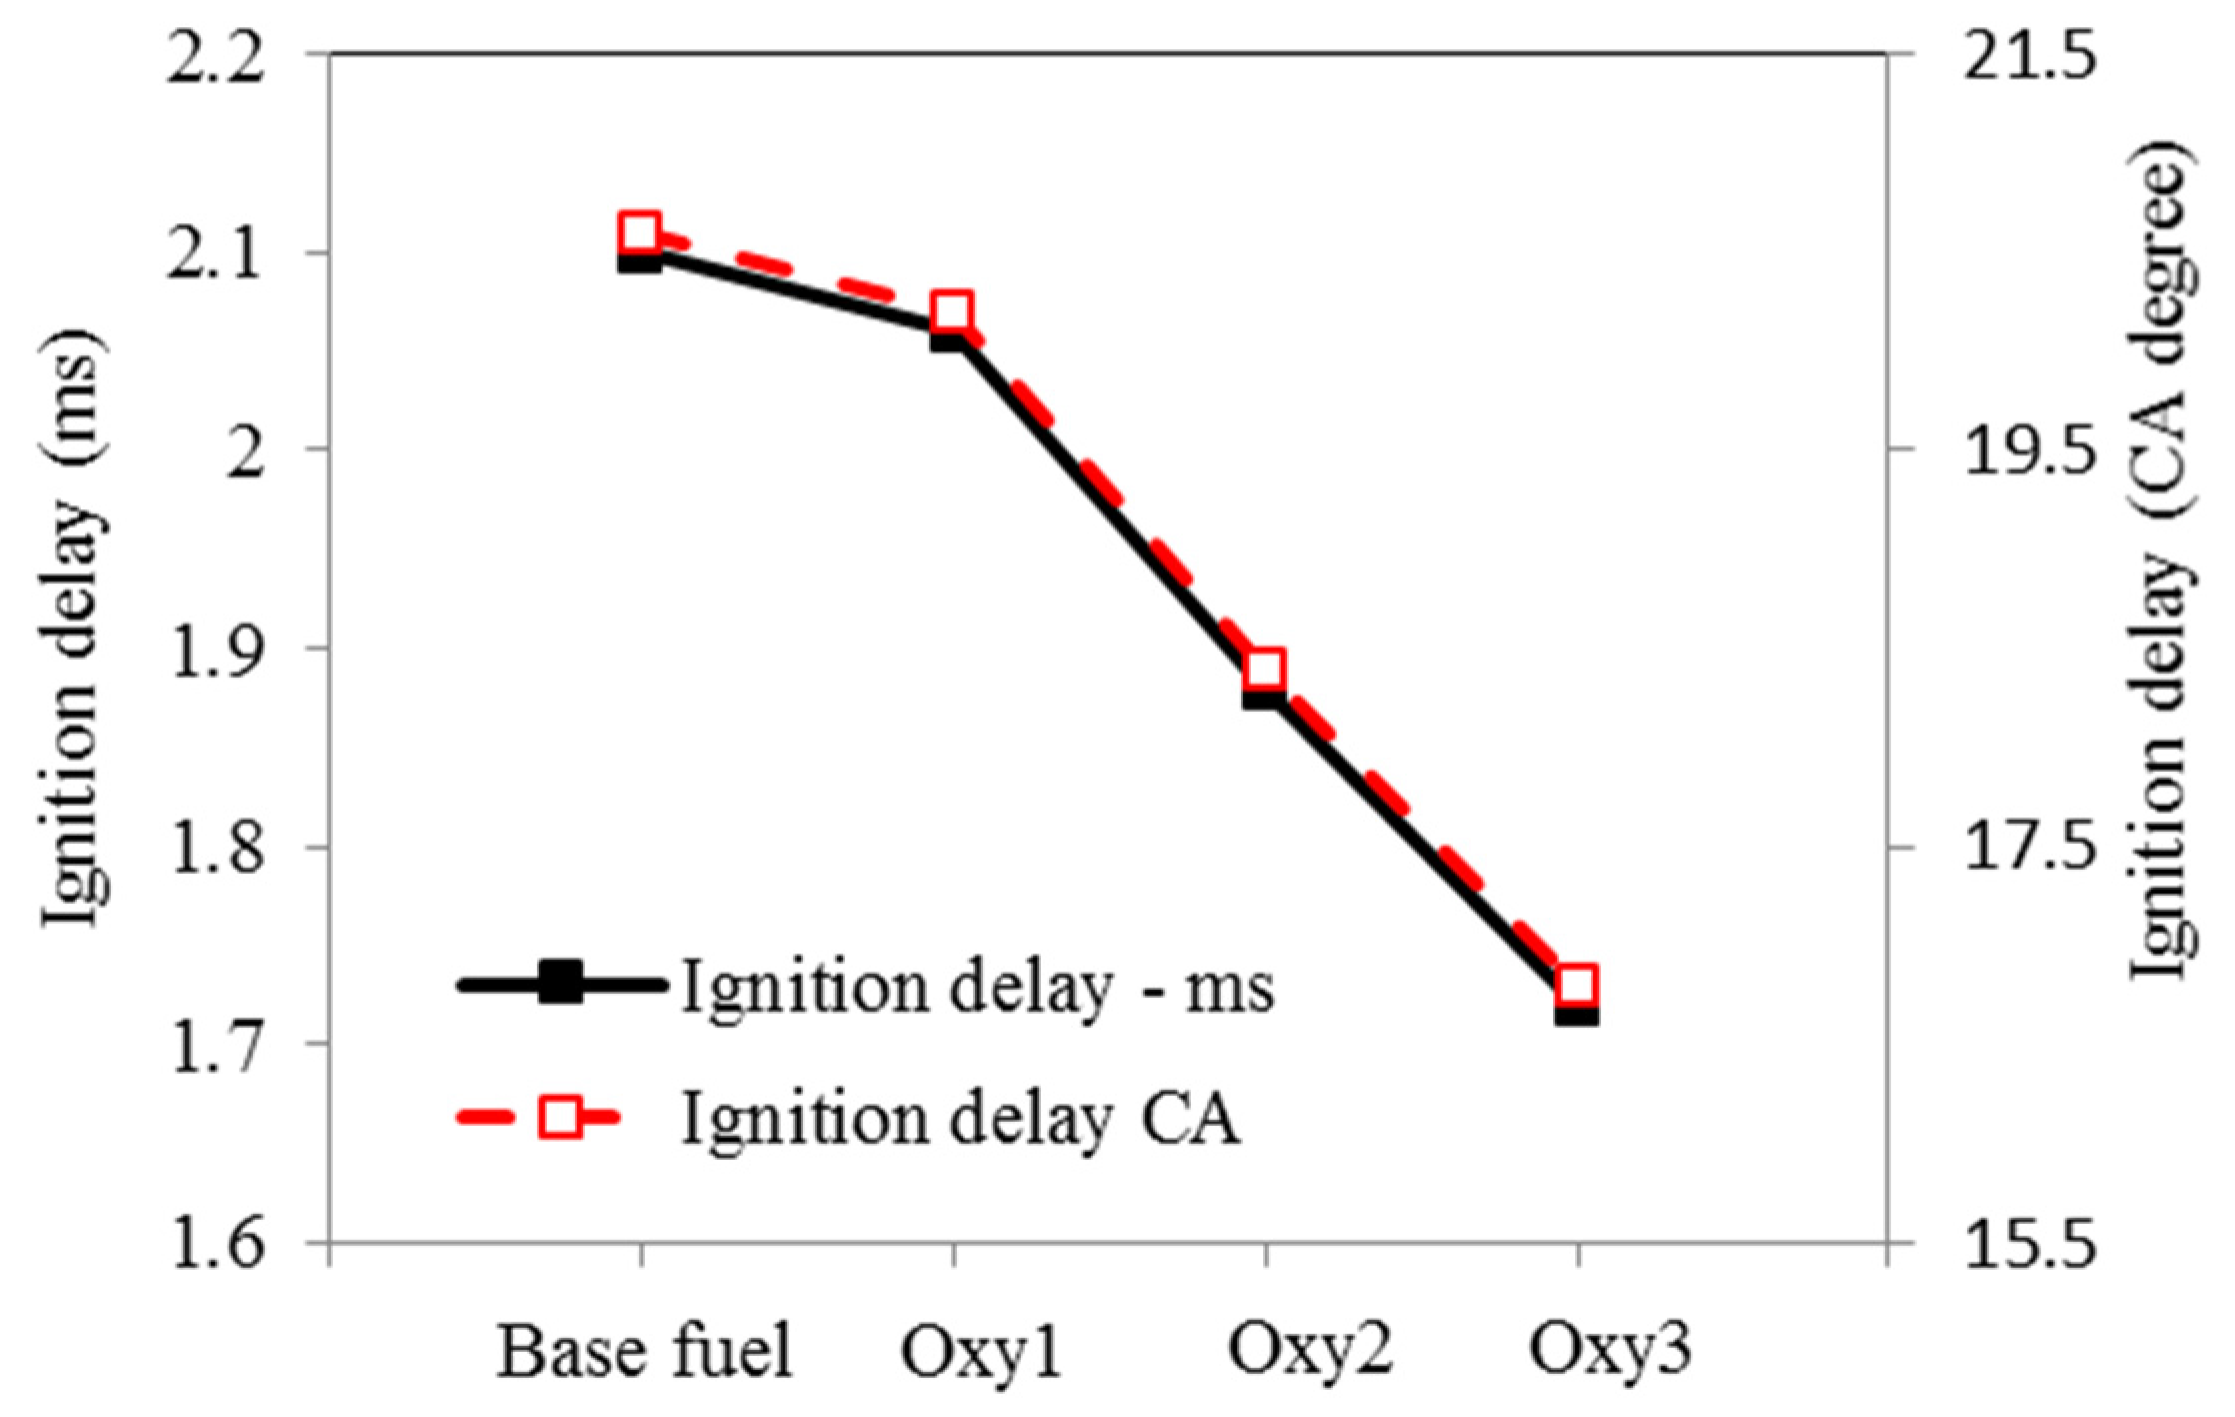
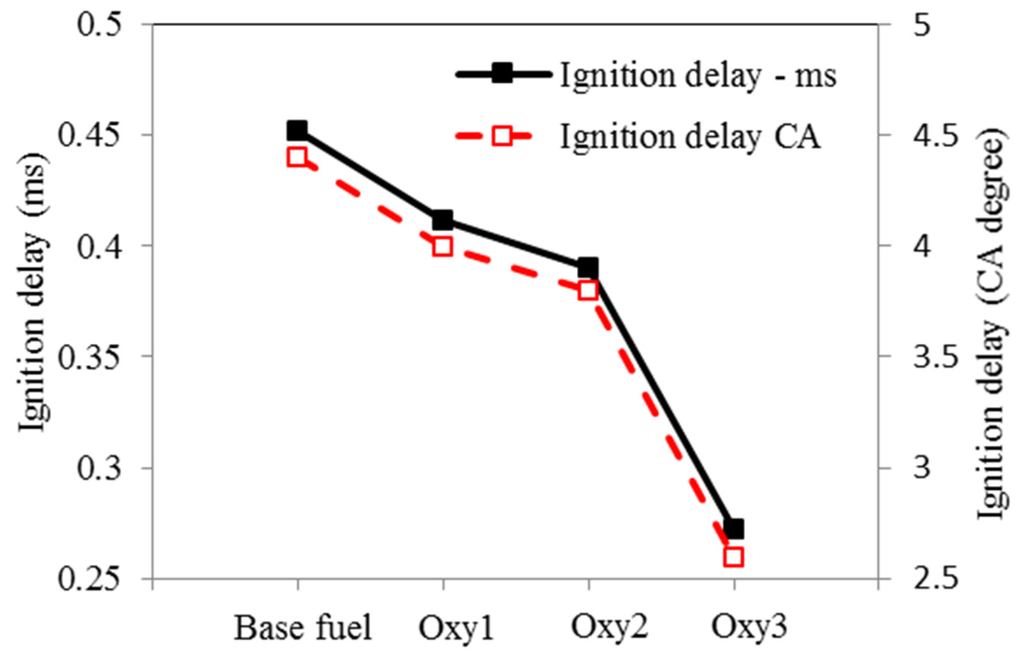
Figure 8.
Ignition delays to main injection.
Figure 8.
Ignition delays to main injection.

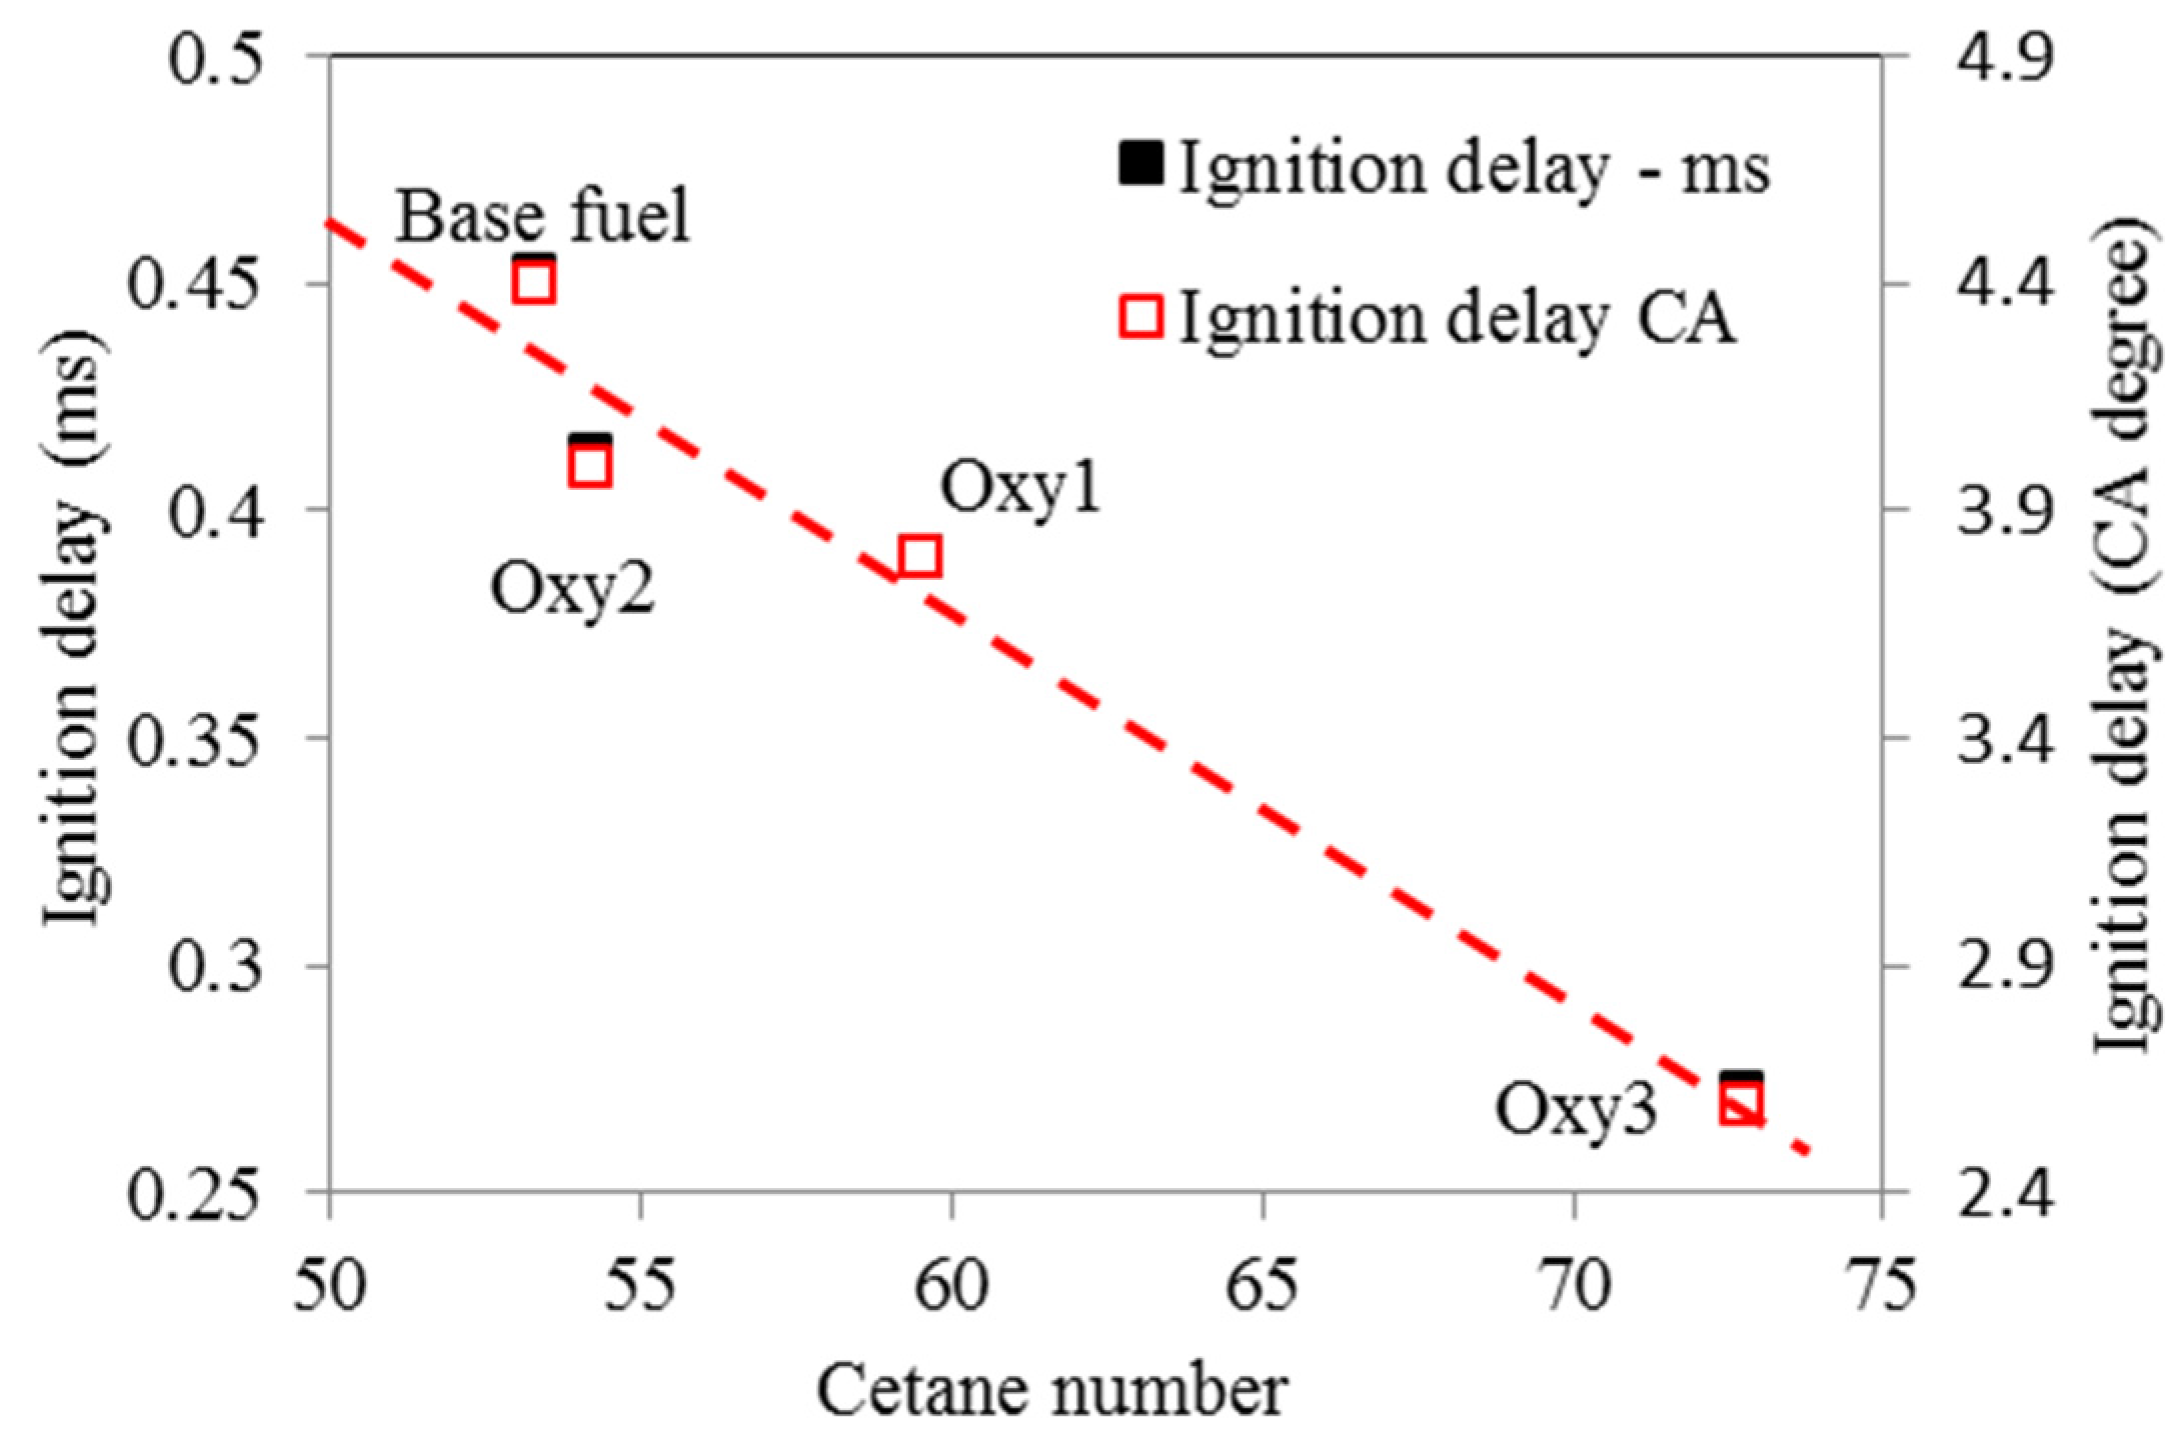
Compared with the base fuel, the main injection ignition delay under the test conditions was shortened by 7%, 14% and 41%, on time basis, for the fuels Oxy1, Oxy2 and Oxy3, respectively. Although Oxy1 and Oxy2 fuels have the same oxygen content, the latter has higher cetane number owing to its different mixture composition. In other words, the diglyme and butyl-diglyme additives in Oxy2 increase the ignitability of the fuel more than the RME additive because diglyme and butyl-diglyme have only single bonds between their C-atoms and O-atoms. In a study by Westbrook et al. [17], it was concluded that oxygenated additives containing single bonds between C-atoms and O-atoms are more effective on reducing soot emissions than compounds containing double bonds between C-atoms and O-atoms such as RME. In addition, larger amount of diglyme and butyl-diglyme additives make Oxy3 fuel even more ignitable. Figure 9 and Figure 10 show the ignition delays vs. fuel oxygen content and cetane number, respectively. The ignition delay has a roughly linear relationship with the cetane number.
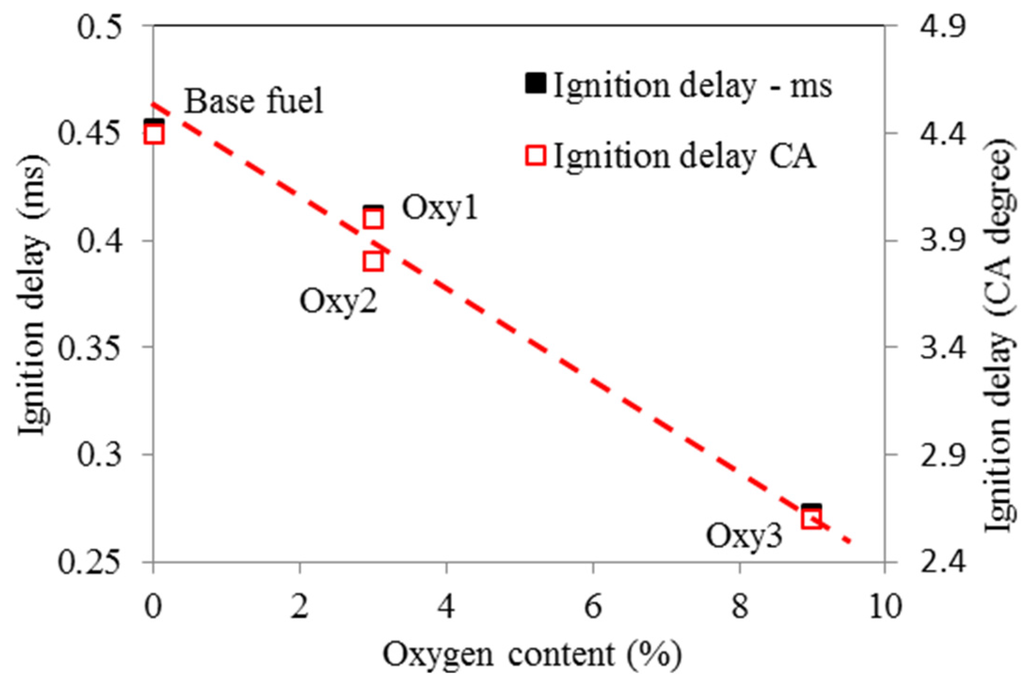
Figure 9.
Ignition delays (to main injection) as function of fuel oxygen content.
Figure 9.
Ignition delays (to main injection) as function of fuel oxygen content.

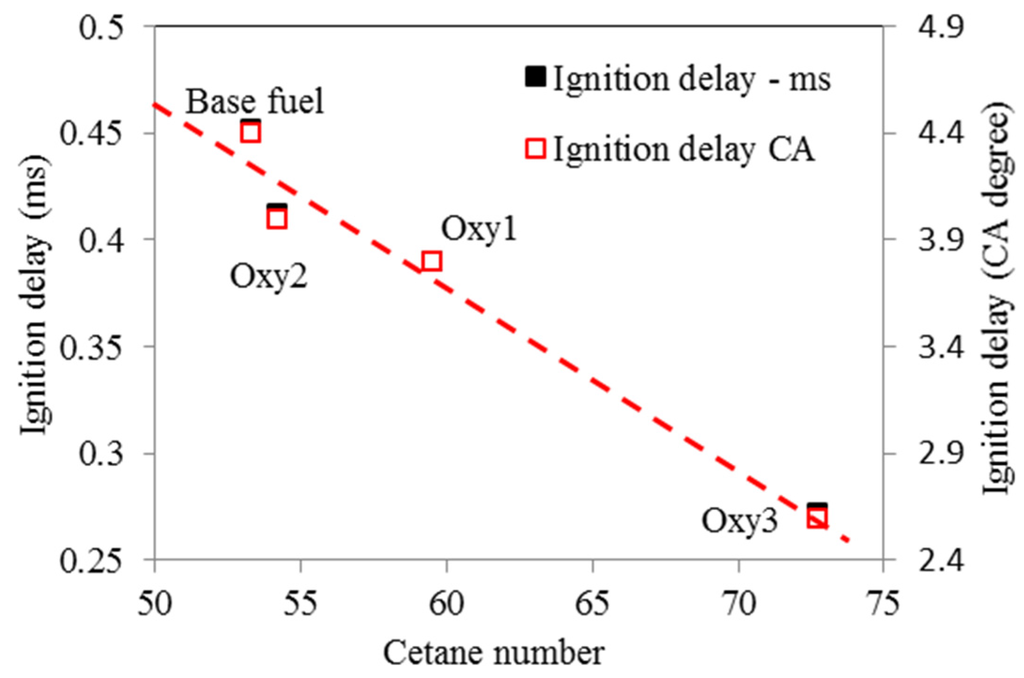
Figure 10.
Ignition delays (to main injection) as function of fuel cetane number.
Figure 10.
Ignition delays (to main injection) as function of fuel cetane number.
3.4. Emissions TEST
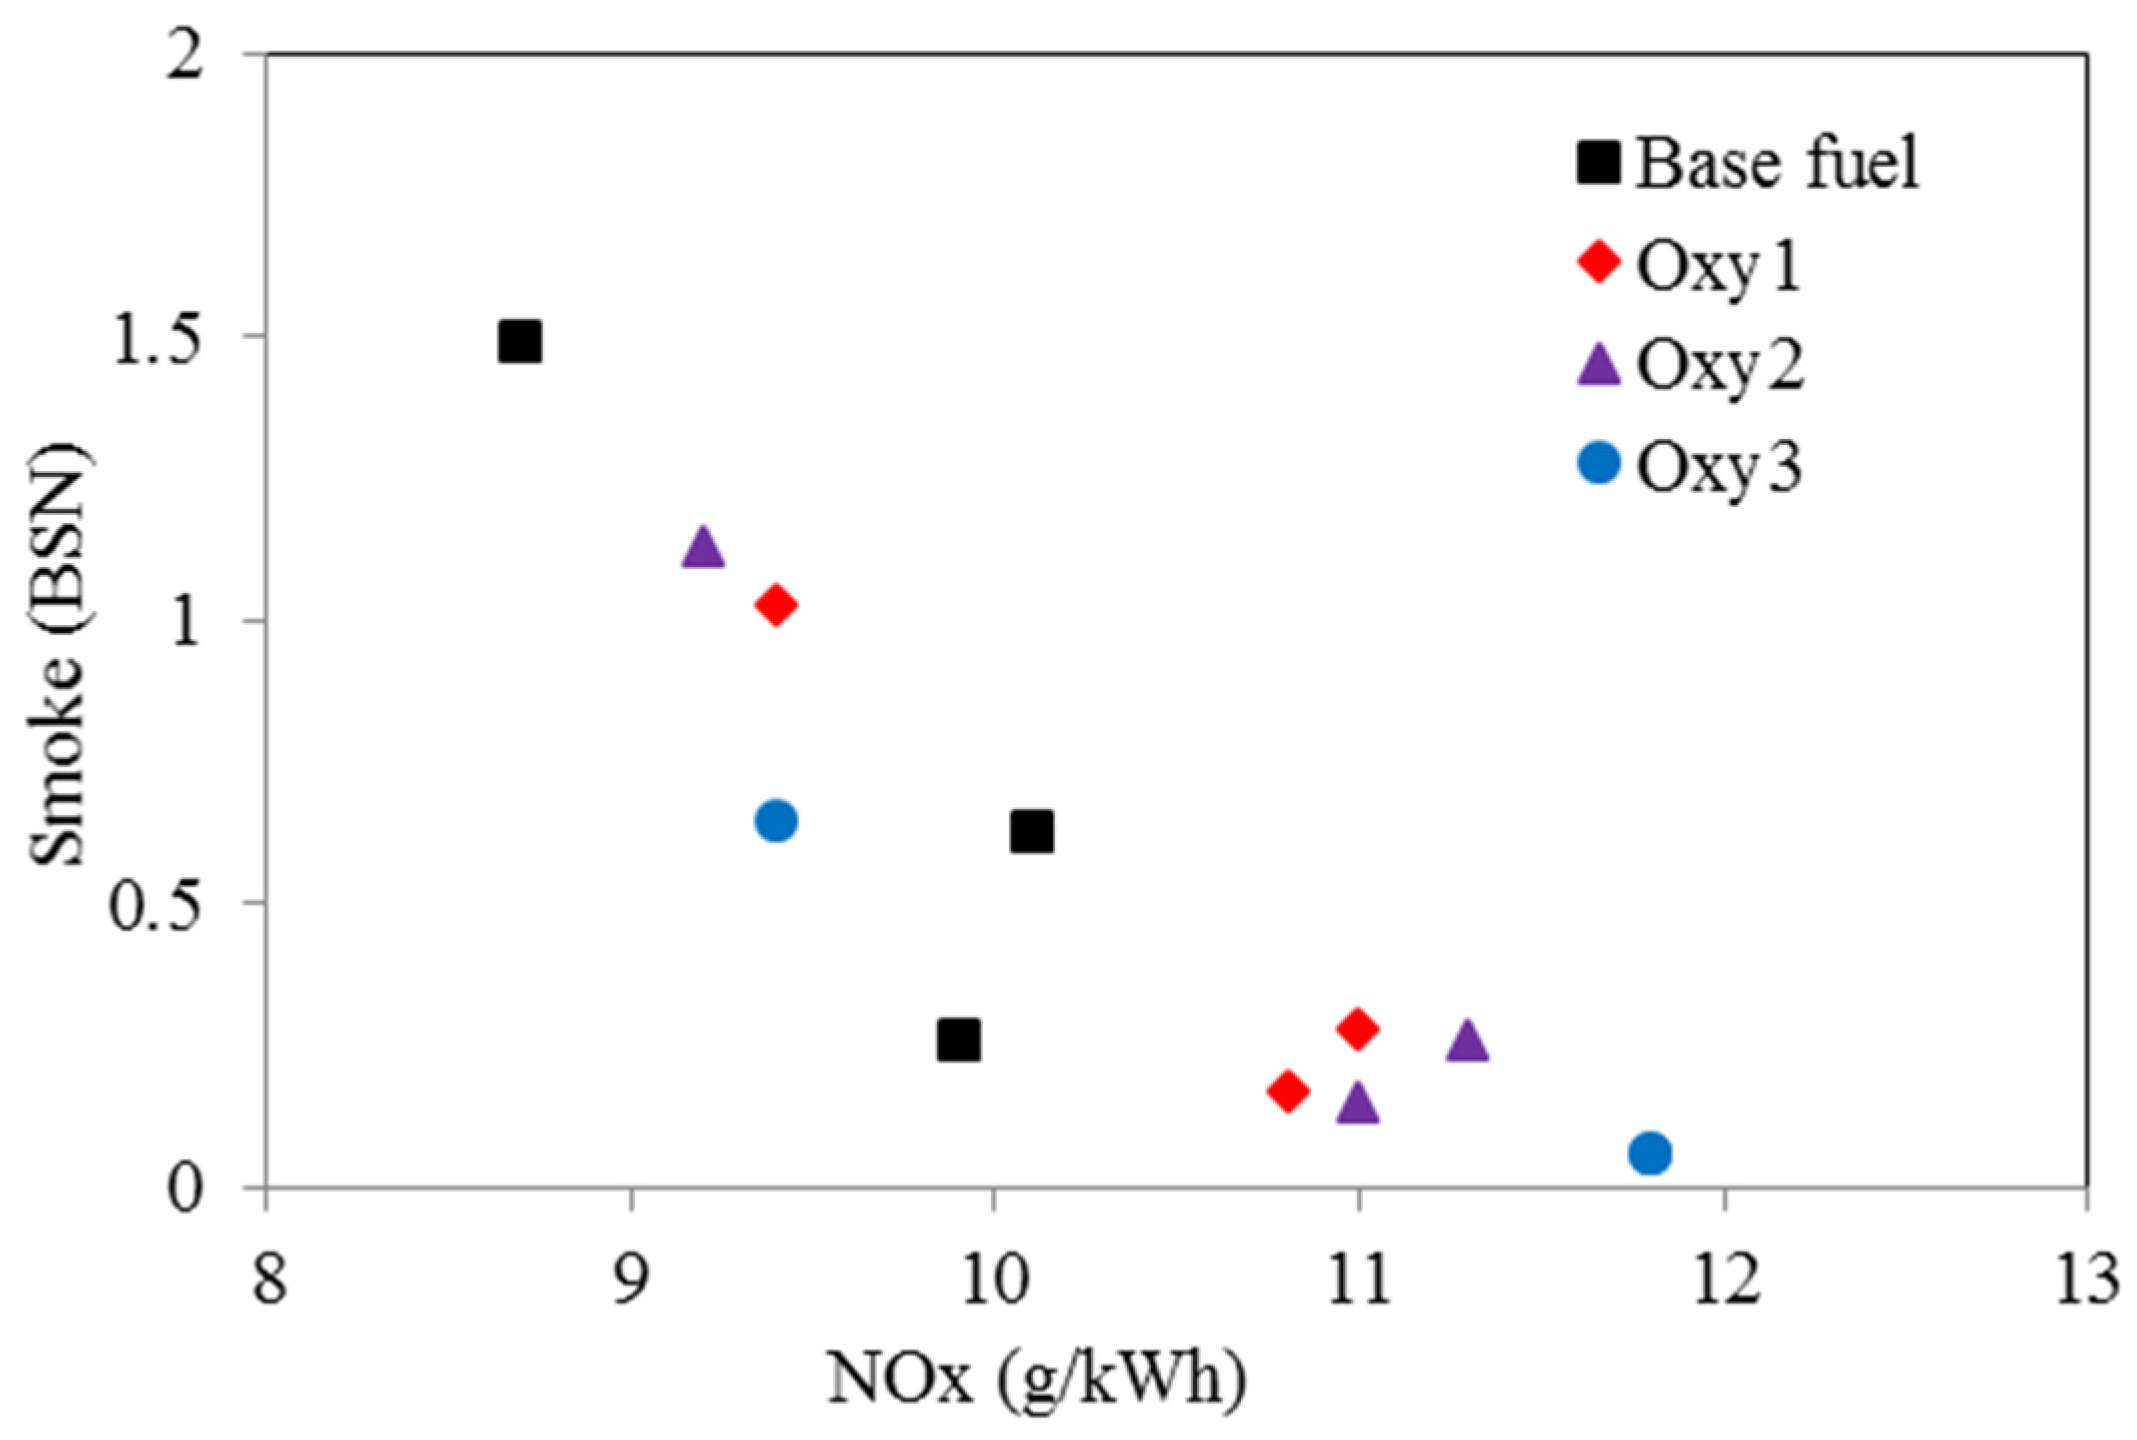
Figure 11 illustrate positive effect of the oxygenated fuels on the reduction of smoke level of the engine running under the three conditions, compared with the Base fuel. It can be seen that in Test 1, which operated at 2000 rpm and 148 Nm of load, the engine smoke level was reduced remarkably by from 56% (Oxy1) to 91% (Oxy3); at high speed and high load Test 3 (4000 rpm and 170 Nm), the effects became smaller, to the range of 24% (Oxy2) to 56% (Oxy3). Corresponding to the reduction of the smoke level, the NOx increases by using the oxygenated fuels in Test 3 were under 8%, in Test 1 and Test 2 (2000 rpm and 236 Nm) increased by 9% (Oxy1) to 19% (Oxy3). In Figure 12, it shows the trade-off between NOx emissions and smoke. Apart from the base fuel, Oxy3 has the best performance for overcoming the trade-off, compared to Oxy1 and Oxy2.
Owing to its higher oxygen content, the Oxy3 fuel had lower smoke level but higher NOx emission than the other two oxygenated fuels in Test 1 and Test 2, whereas its NOx emission was similar to those for the other two fuels in Test 3. The reason why the NOx emission for the Oxy3 fuel in Test 3 was not higher than those for the Oxy1 and Oxy2 fuels might be that its lower heat value was more dominant and thus lowered the maximum combustion temperature at the high engine speed and load, and the corresponding relatively advanced injection timing. In addition, in Test 3, the Oxy3 fuel has substantially lower smoke levels than the other fuels, while its NOx emission is similar to those for the Oxy1 and Oxy2 fuels, indicating that Oxy3 would have the best NOx-moke trade-off by changing some operating parameter, such as EGR rate or/and injection timing selections.

Figure 11.
Effects of oxygen content on NOx emission and smoke based on four tested fuels (Test 1—2000 rpm and 148 Nm; Test 2—2000 rpm and 236 Nm; Test 3—4000 rpm and 170 Nm).
Figure 11.
Effects of oxygen content on NOx emission and smoke based on four tested fuels (Test 1—2000 rpm and 148 Nm; Test 2—2000 rpm and 236 Nm; Test 3—4000 rpm and 170 Nm).
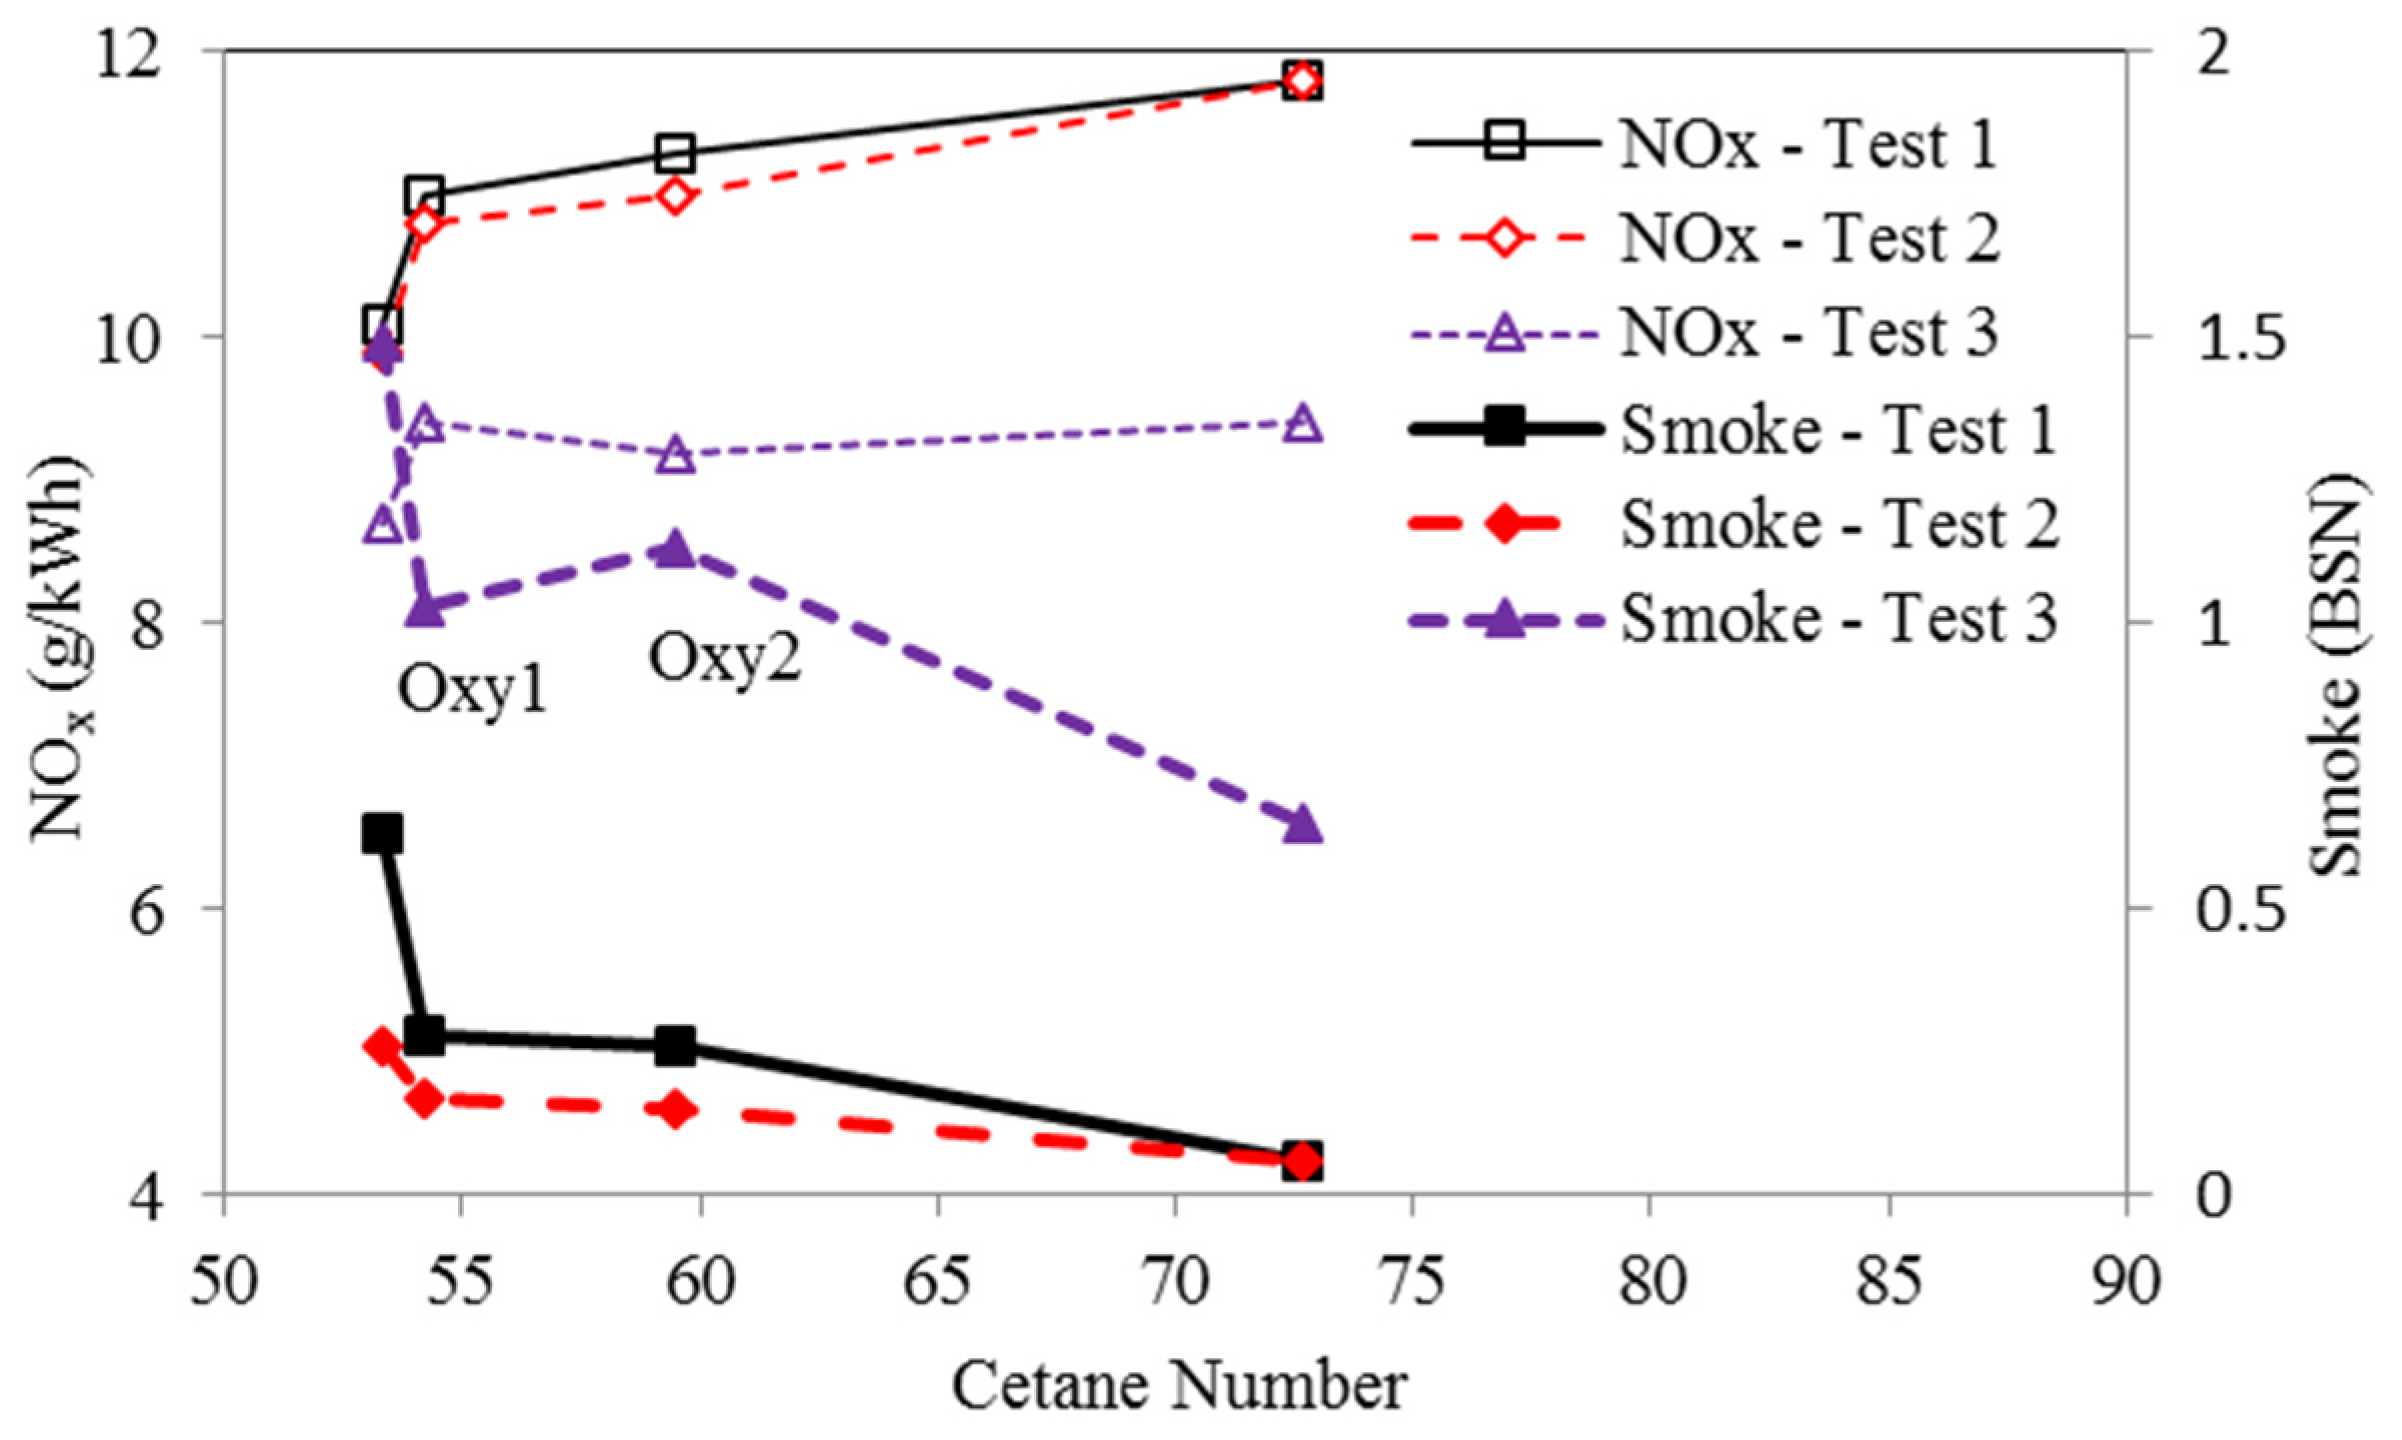

Figure 12.
Smoke as function of NOx emissions based on four tested fuels (Test 1—2000 rpm and 148 Nm; Test 2—2000 rpm and 236 Nm; Test 3—4000 rpm and 170 Nm).
Figure 12.
Smoke as function of NOx emissions based on four tested fuels (Test 1—2000 rpm and 148 Nm; Test 2—2000 rpm and 236 Nm; Test 3—4000 rpm and 170 Nm).
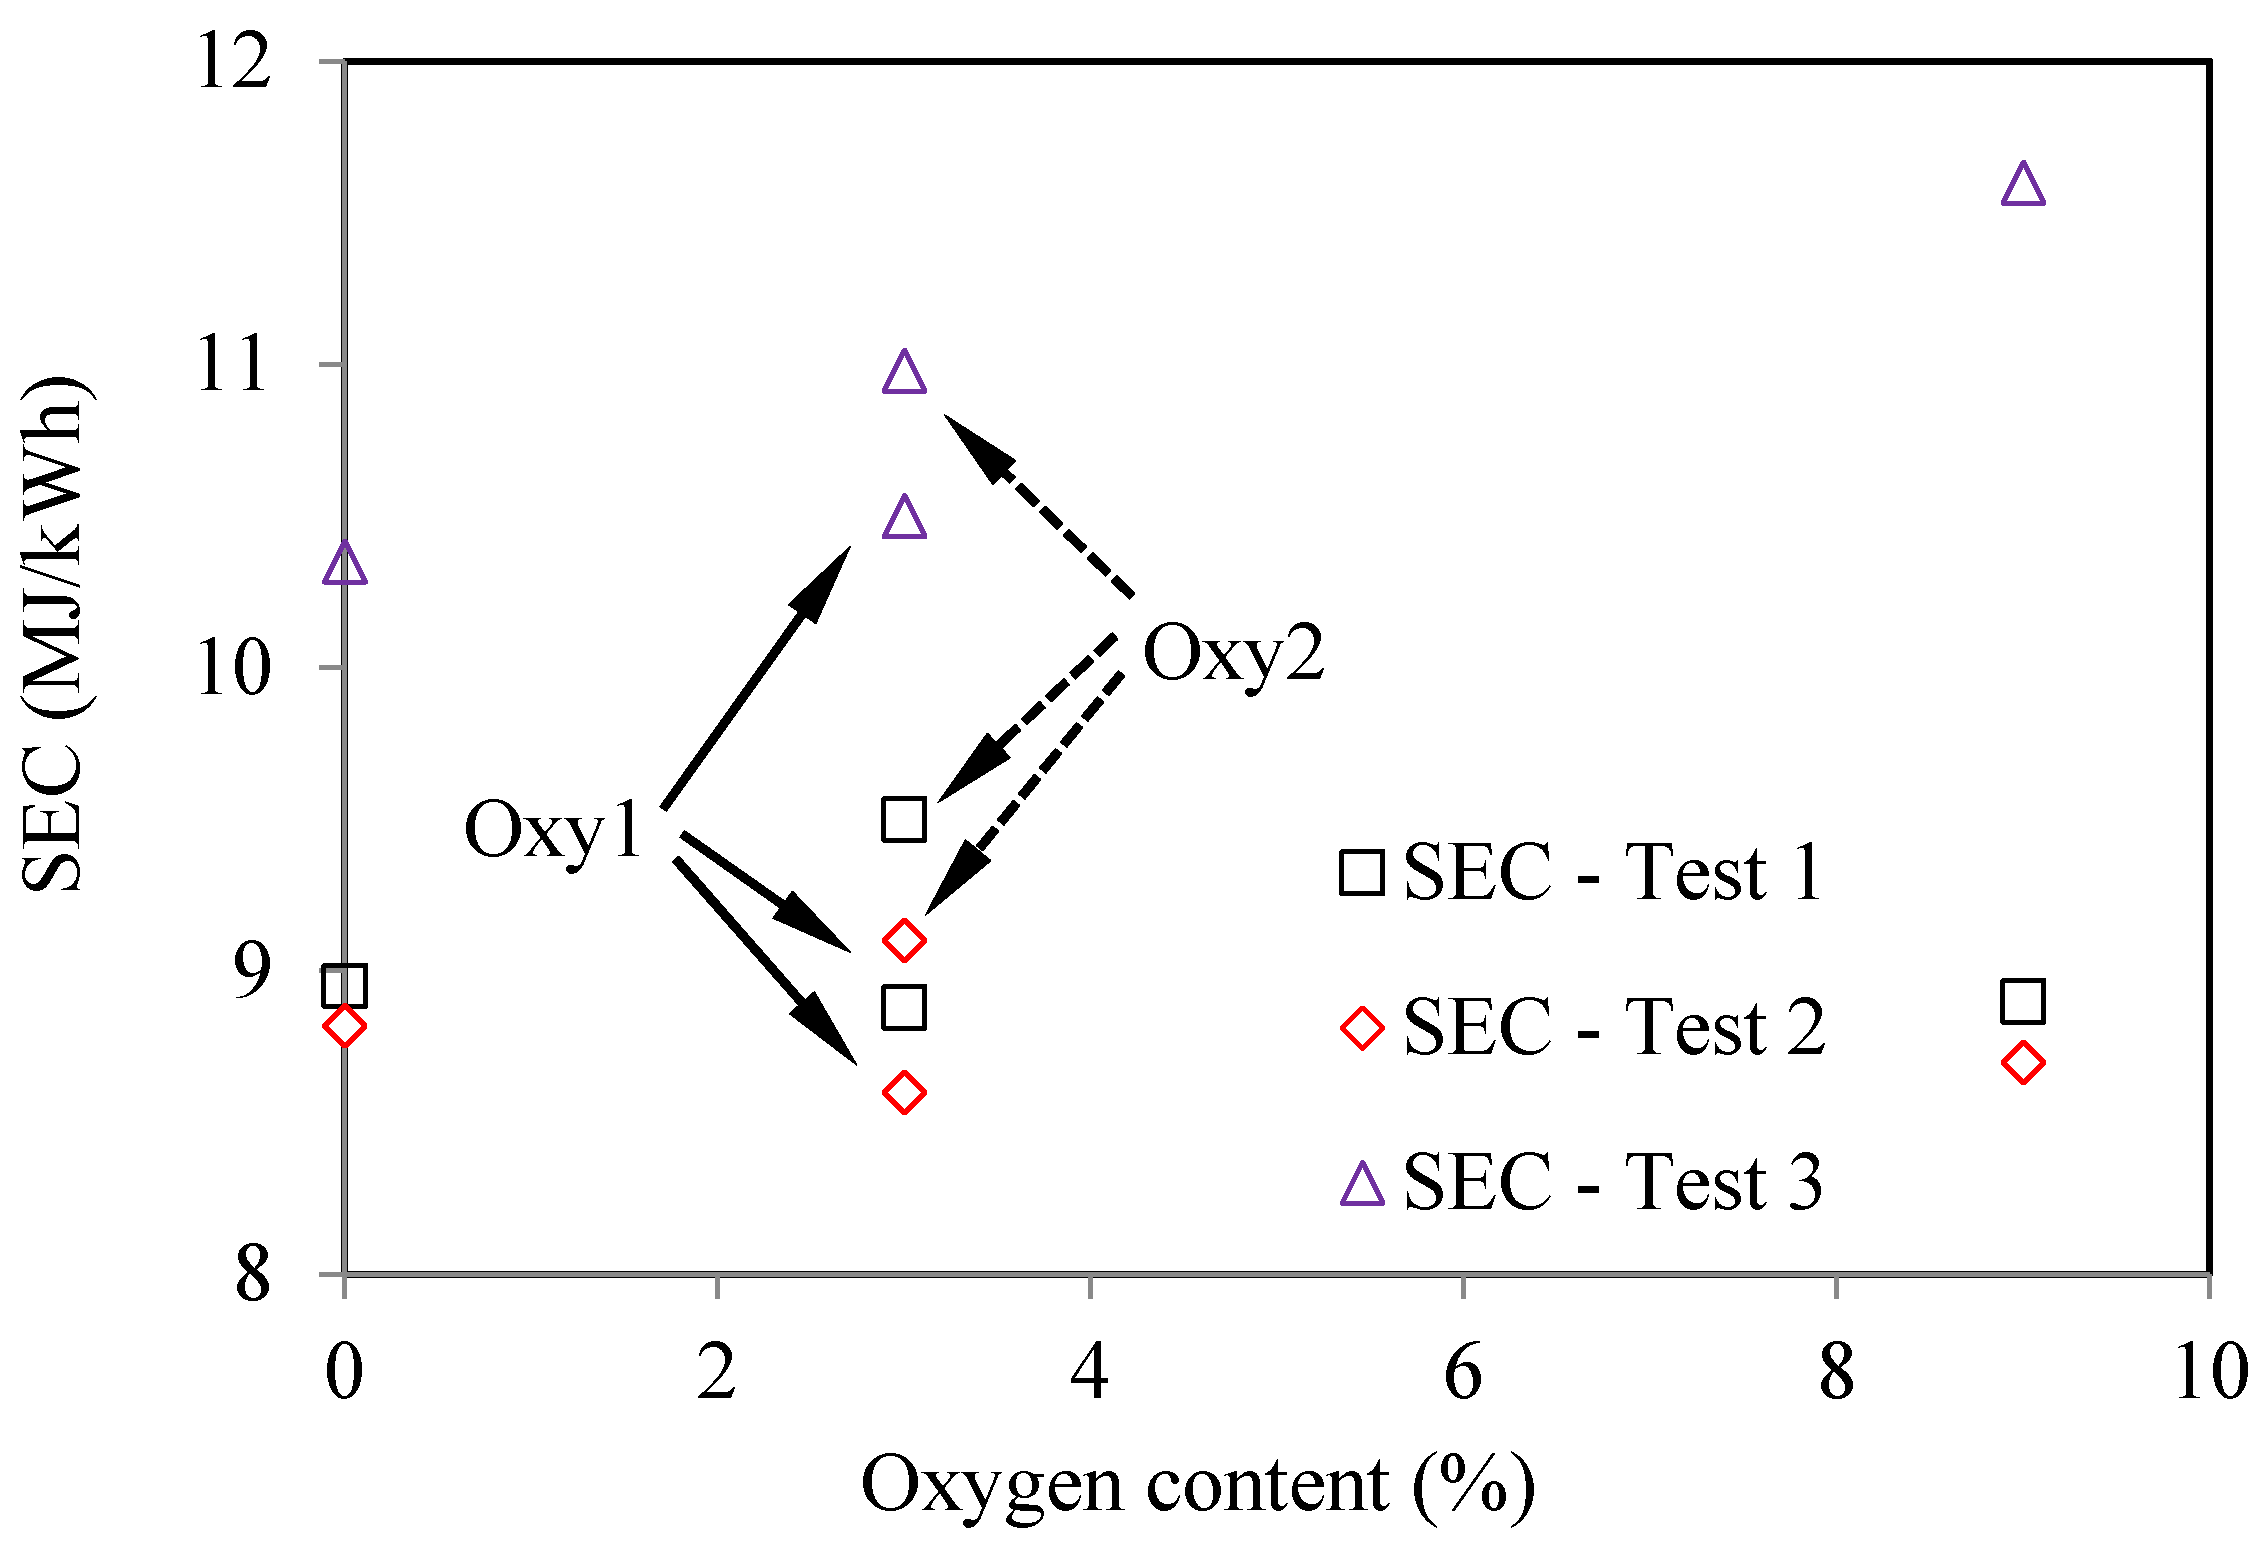
As seen in Figure 13, in all three tests, the oxygenated fuels had higher SFC (Specific Fuel Consumption) than the corresponding values for the base fuel. This trend is the most significant in Test 3. Considering the differences in the heat values of the fuels, Figure 14 compares the specific energy consumptions for the various fuels. It can be seen that, in Test 1 and Test 2, SEC (Specific Energy Consumption) for the oxygenated fuels does not change much compared with those for the base fuel. However, in Test 3, the oxygenated fuels still have higher SEC than the base fuel, especially for the Oxy3 fuel. This might be because that at the fixed injection timing, the injection period and combustion period for the oxygenated fuels were prolonged due to their lower heat values, and thus lowered the combustion efficiency. The injection parameters and EGR ratio should be optimized according to the properties of the oxygenated fuels.

Figure 13.
Effects of oxygen content on fuel consumption, based on four tested fuels (Test 1—2000 rpm and 148 Nm; Test 2—2000 rpm and 236 Nm; Test 3—4000 rpm and 170 Nm)
Figure 13.
Effects of oxygen content on fuel consumption, based on four tested fuels (Test 1—2000 rpm and 148 Nm; Test 2—2000 rpm and 236 Nm; Test 3—4000 rpm and 170 Nm)
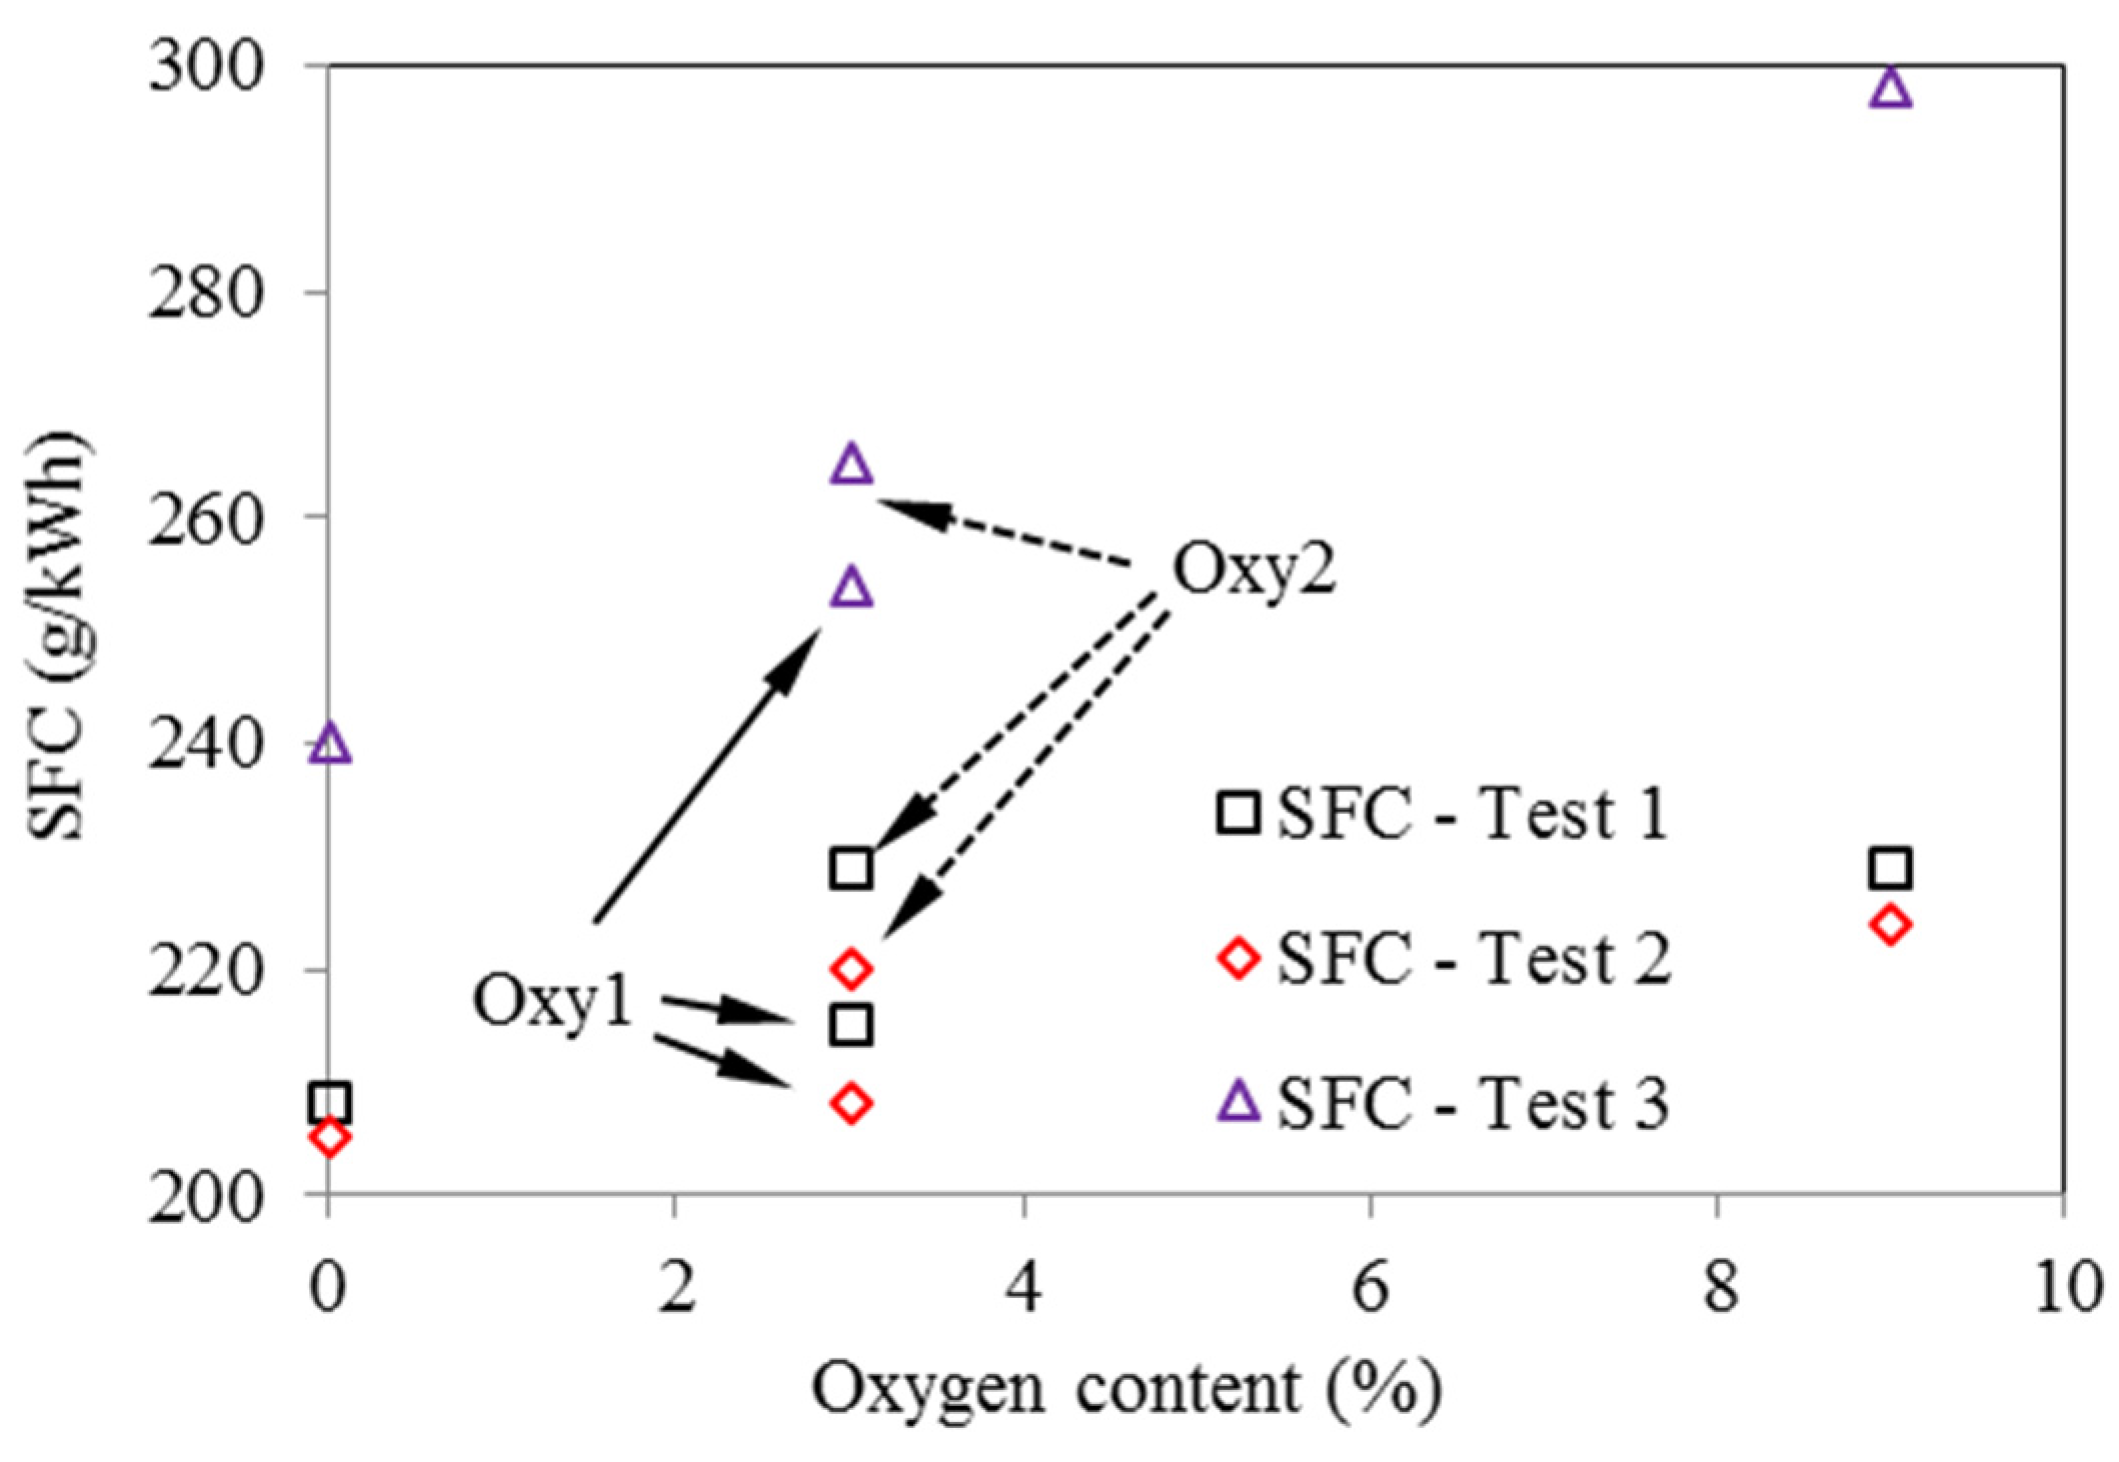

Figure 14.
Effects of oxygen content on energy consumption, based on four tested fuels (Test 1—2000 rpm and 148 Nm; Test 2—2000 rpm and 236 Nm; Test 3—4000 rpm and 170 Nm).
Figure 14.
Effects of oxygen content on energy consumption, based on four tested fuels (Test 1—2000 rpm and 148 Nm; Test 2—2000 rpm and 236 Nm; Test 3—4000 rpm and 170 Nm).
4. Conclusions
- The oxygenating additives had no significant influence on the fuel spray development rate.
- Under the engine settings listed in Table 4, the Oxy1, Oxy2 and Oxy3 fuels shortened the pilot ignition delay by 0%, 11% and 19%, respectively, and the main ignition delay was shortened by 8%, 19% and 38%, respectively. Although the Oxy1 fuel and the Oxy2 fuel have the same oxygen content, they still have slight differences in ignition delay due to different bonds between C-atoms and O-atoms in molecular structures, which have resulted in their different cetane numbers.
- With pilot injection, the Oxy3 fuel seemed to have longer big-flame-area combustion period and lower peak cylinder pressure, probably due to smaller fuel accumulation during the shortened ignition delay.
- In general, the oxygen content in the three oxygenated fuels lowered the smoke, with NOx and fuel consumption penalties. By optimizing other operating parameters for reducing peak combustion temperature, such as reducing injection pressure, retarding injection timings, and increasing EGR ratio, these penalties are expected to be minimized.
- Oxy3 fuel, which has obviously higher oxygen content than the other test fuels, seems to have the best potential for balancing NOx-PM emission trade-off. As it can reduce smoke but increase NOx emissions, higher EGR rate or lower injection pressure will be helpful to achieve acceptable smoke and NOx emissions.
Author Contributions
The experimental work and data analysis were mainly completed by Haiwen Song, Kelly Sison Quinton, and Zhijun Peng, with supervisions from Hua Zhao and Nicos Ladommatos.
Conflicts of Interest
The authors declare no conflict of interest.
References
- Nakano, M.; Okawa, K. Study of oxygen-containing hydrocarbons in exhaust emission from a spark ignition combustion engine. Int. J. Engine Res. 2014, 15, 572–580. [Google Scholar] [CrossRef]
- Bertola, A.; Boulouchos, K. Oxygenated Fuels for Particulate Emissions Reduction in Heavy-Duty DI-Diesel Engines with Common-Rail Fuel Injection; SAE paper 2000-01-2885; SAE International: Warrendale, PA, USA, 2000. [Google Scholar]
- Tsolakis, A.; Megaritis, A.; Wyszynski, M.L.; Theinnoi, K. Engine performance and emissions of a diesel engine operating on diesel-RME (rapeseed methyl ester) blends with EGR (exhaust gas recirculation). Energy 2007, 32, 2072–2080. [Google Scholar] [CrossRef]
- Yilmaz, N.; Vigil, F.M.; Benalil, K.; Davis, S.M.; Calva, A. Effect of biodiesel—Butanol fuel blends on emissions and performance of a diesel engine. Fuel 2014, 135, 46–50. [Google Scholar] [CrossRef]
- Menkiel, B.; Donkerbroek, A.; Uitz, R.; Cracknell, R.; Ganippa, L. Combustion and soot processes of diesel and rapeseed methyl ester in an optical diesel engine. Fuel 2014, 118, 406–415. [Google Scholar] [CrossRef]
- Van Duren, I.; Voinov, A.; Arodudu, O.; Firrisa, M.T. Where to produce rapeseed biodiesel and why? Mapping European rapeseed energy efficiency. Renew. Energy 2015, 74, 49–59. [Google Scholar] [CrossRef]
- Hassaneen, A.; Munack, A.; Ruschel, Y.; Schroeder, O.; Krahl, J. Fuel economy and emission characteristics of Gas-to-Liquid (GTL) and Rapeseed Methyl Ester (RME) as alternative fuels for diesel engines. Fuel 2012, 97, 125–130. [Google Scholar] [CrossRef]
- Ladommatos, N.; Rubenstein, P.; Bennett, P. Some effects of molecular structure of single hydrocarbons on sooting tendency. Fuel 1996, 75, 114–124. [Google Scholar] [CrossRef]
- Di Iorio, S.; Magno, A.; Mancaruso, E.; Vaglieco, B.M. Effect of Diesel/RME Blend on Particle Emissions from a Diesel Engine for Quadricycle Vehicle; SAE Paper 2014-01-1602; SAE International: Warrendale, PA, USA, 2014. [Google Scholar]
- Senatore, A.; Cardone, M.; Rocco, V.; Prati, M.V. A Comparative Analysis of Combustion Process in D.I. Diesel Engine Fueled with Biodiesel and Diesel Fuel; SAE 2000-01-0691; SAE International: Warrendale, PA, USA, 2000. [Google Scholar]
- Beatrice, C.; Napolitano, P.; Guido, C. Injection parameter optimization by DoE of a light-duty diesel engine fed by Bio-ethanol/RME/diesel blend. Appl. Energy 2014, 113, 373–384. [Google Scholar] [CrossRef]
- Palash, S.M.; Kalam, M.A.; Masjuki, H.H.; Masum, B.M.; Rizwanul Fattah, I.M.; Mofijur, M. Impacts of biodiesel combustion on NOx emissions and their reduction approaches. Renew. Sustain. Energy Rev. 2013, 23, 473–490. [Google Scholar] [CrossRef]
- Beatrice, C.; Bertoli, C.; del Giacomo, N.; Migliaccio, M. Potentiality of Oxygenated Synthetic Fuel and Reformulated Fuel on Emissions from a Modern DI Diesel Engine; SAE 1999-01-3595; SAE International: Warrendale, PA, USA, 1999. [Google Scholar]
- Lapuerta, M.; Hernandez, J.J.; Gimenez, F. Evaluation of exhaust gas recirculation as a technique for reducing diesel engine NOx emissions. Proc. Inst. Mech. Eng. Part D J. Automob. Eng. 2000, 214, 85–93. [Google Scholar] [CrossRef]
- Imran, S.; Emberson, D.R.; Diez, A.; Wen, D.S.; Crookes, R.J.; Korakianitis, T. Natural gas fueled compression ignition engine performance and emissions maps with diesel and RME pilot fuels. Appl. Energy 2014, 124, 354–365. [Google Scholar] [CrossRef]
- Cheng, A.S.; Dibble, R.W.; Buchholz, B.A. The Effect of Oxygenates on Diesel Engine Particulate Matter; SAE Paper 2002-01-1705; SAE International: Warrendale, PA, USA, 2002. [Google Scholar]
- Westbrook, C.K.; Pitz, W.J.; Curran, H.J. Chemical kinetic modeling study of the effects of oxygenated hydrocarbons on Soot Emissions from Diesel Engines. J. Phys. Chem. A 2006, 110, 6912–6922. [Google Scholar] [CrossRef] [PubMed]
© 2016 by the authors; licensee MDPI, Basel, Switzerland. This article is an open access article distributed under the terms and conditions of the Creative Commons by Attribution (CC-BY) license (http://creativecommons.org/licenses/by/4.0/).