Abstract
Malaysia is a rapidly developing country in Southeast Asia that aims to achieve high-income country status by 2020; its economic growth is highly dependent on its abundant energy resources, especially natural gas and crude oil. In this paper, a complete picture of Malaysia’s energy use from primary source to end use is presented by mapping a Sankey diagram of Malaysia’s energy flows, together with ongoing trends analysis of the main factors influencing the energy flows. The results indicate that Malaysia’s energy use depends heavily on fossil fuels, including oil, gas and coal. In the past 30 years, Malaysia has successfully diversified its energy structure by introducing more natural gas and coal into its power generation. To sustainably feed the rapidly growing energy demand in end-use sectors with the challenge of global climate change, Malaysia must pay more attention to the development of renewable energy, green technology and energy conservation in the future.
1. Introduction
Malaysia is a small developing country located in Southeast Asia near the Equatorial region. It has a total landmass of 330,290 square kilometers and had a population of 29.72 million in 2013 [1]. The gross domestic product (GDP) per capita of Malaysia in 2013 was 10,538 US dollars (current price) [2]. In 1991, Malaysia’s government announced a plan to achieve high-income country status by 2020 [3], and in 2011, it launched an Economic Transformation Program (ETP) to meet this target [4]. A comprehensive study of Malaysia’s energy use can provide a typical case for understanding the energy development in small developing countries and in Southeast Asia.
Previous studies have investigated various aspects of Malaysia’s energy issues. For example, Ong, Mahlia and Masjuki reviewed Malaysia’s energy scenarios and sustainable energy use [5]. Rahim and Liwan reported the oil and gas trends and their implications [6]. Gan, Komiyama and Zhidong provided a low carbon society outlook up to 2035 [7]. Ali and Shekarchian summarized the existing and future energy sources for electrical power generation [8,9]. Saidur and his team performed several studies involving energy and exergy analysis in various end-use sectors [10,11,12,13,14]. In addition, Chua and Oh provided a review of Malaysia’s national energy development by introducing key policies, agencies, programs and international relationships [15,16]. However, because of the lack of systematic links among the various parts and aspects of Malaysia’s energy system and the missing technical details of special stages or sectors along the energy flows in these studies, there is a need for further studies to provide a more comprehensive and deeper understanding of Malaysia’s energy use.
This study attempts to present a complete picture of the current status and ongoing trends of Malaysia’s energy use by mapping Malaysia’s energy flows into the form of a Sankey diagram and discussing the ongoing trends of the energy flows by analyzing its influencing factors including demand, resources availability, technology choice, and policy adjustment.
The content of this paper is organized as follows:
- (1)
- An introduction of the system approach for analyzing the use of energy in Malaysia and the methodology and data input for mapping the Sankey diagram of energy flows in Section 2;
- (2)
- A discussion of current status of the Malaysian energy supply and energy end-use based on the mapping results in Section 3;
- (3)
- A discussion of ongoing trends of Malaysia’s energy flows by analyzing the influencing factors in Section 4;
- (4)
- Conclusions and suggestions for future work in Section 5.
2. Methodology
2.1. System Approach
The framework of the system approach used in this study is illustrated in Figure 1, the physical flow of energy is the key part of the analysis as involving with various stages, energy types and energy technologies of energy use in Malaysia. To observe the energy use of Malaysia, we mapped the whole physical flow of energy onto a Sankey diagram with details of the production, import and export, transformation and final consumption of various energy, as introduced in Section 2.2.
Referring to the literatures mentioned in Section 1 and the methodology used in a previous study by the authors [17], we concluded that the development of Malaysia’s energy flows is mainly influenced by four key factors as follows:
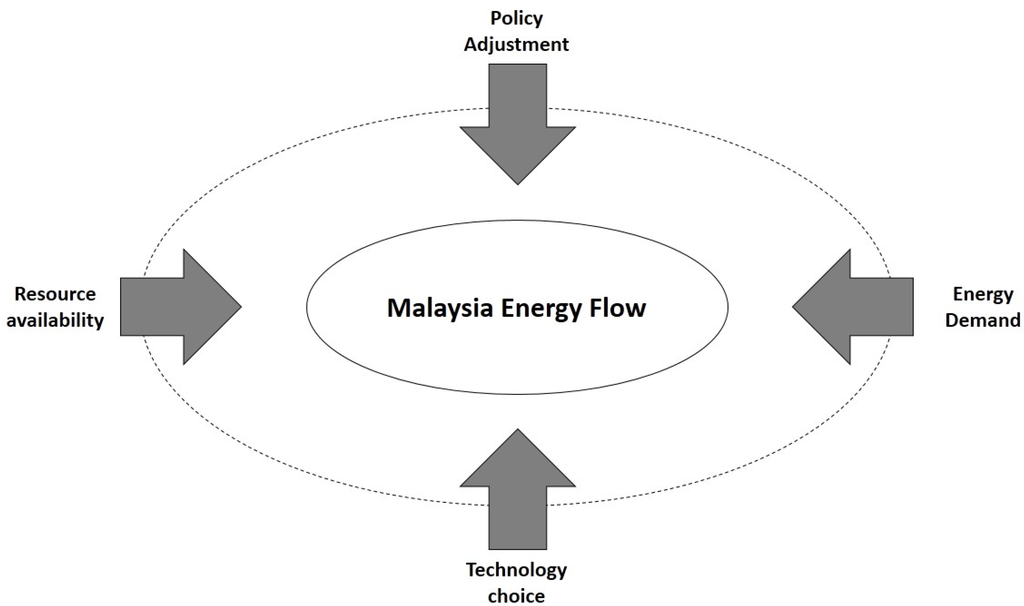
Figure 1.
The framework of the system approach.
- (1)
- Energy demand: In the end-use sector, energy is consumed to provide energy services, like passenger transport, cooling comfort and illumination. The variation of energy demand will influence energy supply. Currently, the manufacturing sector, transportation sector and domestic sector (residential, commercial and agriculture) are the major energy consumers in Malaysia.
- (2)
- Energy resource availability: The energy supply structure of a region is dependent on its energy resource availability, including domestic production and imports. The lack of energy resource availability will require restricting energy demand. Though Malaysia has abundant energy resources, to ensure more reliable energy supply and strategy purpose, some energy resources are imported.
- (3)
- Technology choice: Adoption of different technologies will not only influence the energy supply structure, but also the environmental emissions. The major uncertainty of technology choices in Malaysia is the future development of the electricity generation technologies, which will mainly be decided by the availability and the cost of energy resources. Besides, biodiesel may be an important alternative energy for vehicle fuels in Malaysia.
- (4)
- Policy adjustment: Policymakers can implement policies and enact acts to regulate or intervene in energy supply and energy consumption for strategic purposes. The main aim of the Malaysian energy policy is to ensure energy security. The previous policy adjustments have successfully optimized Malaysia’s energy structure. Along with the climate change issue, the development of renewable energy and nuclear power are hot topics.
2.2. Tools and Data Input for Mapping Energy Flows
The Sankey diagram has become an important graphical tool for mapping energy flows. In an energy Sankey diagram, various types of energy flows are illustrated in different colors with the width indicating energy quantities. Schmidt has provided a comprehensive review of Sankey diagrams in energy and material flow management [18].
The method used to map energy flows into a Sankey diagram in this study was mainly based on previous studies on global energy flows [19] and China’s energy flows [20,21], but adjusted to take into account the specifics of Malaysia’s energy system and also the data availability.
Using this method, the whole energy system of Malaysia was divided into three stages: (1) Primary supply; (2) Secondary supply; and (3) End-use. In addition, Non-Energy Use was excluded from the energy flowing to End-use in the Primary supply and Secondary supply. The energy flows and energy types involved in each stage are shown in Table 1, and the energy types involved are listed in Table 2.

Table 1.
Main sections considered in the mapping.
| Stage | Energy flows | Description [22] |
|---|---|---|
| Primary Supply | Primary Production | Refers to the amount of primary energy resources extracted. Data for natural gas excludes the amount of re-injected and flared gas. Gross production of hydropower is calculated by primary energy equivalent quantity. |
| Gas Flaring and Reinjection Use | Refers to the amount of gas flared, re-injected into the gas fields and use for production purposes. | |
| Imports and Exports | Refers to the amount of primary and secondary energy obtained from or supplied to other countries. | |
| Bunkers | Refers to the amount of fuels delivered to ocean-going ships of all flags engaged in international traffic. | |
| Stock Changes | Refers to the difference between the amount of fuels in stocks at the beginning and end of the year and should ideally cover producers, importers, and industrial consumers. At this stage, however, only oil companies stocks are taken into account. | |
| Secondary Supply | Gas Plants | Refers to the input of natural gas into LNG, MDS and GPP-LPG plants and their respective outputs. |
| Refineries | Refers to the input of energy resources into refineries and their respective outputs. | |
| Power Plants | Refers to the input of energy resources into power plants and electricity outputs. | |
| End-use | Residential | Refers to energy used within households. |
| Commercial | Refers to energy used within commercial departments, including public buildings. | |
| Industrial | Industrial is a very broad-based sector, ranging from manufacturing to mining and construction. Diesel sales through distributors are assumed to be industrial consumers. | |
| Transportation | Refers to all sales of motor gasoline and diesel from gas stations and sales of aviation fuel. It also includes diesel and motor gasoline sold directly to the government and military. | |
| Agriculture | Covers agricultural, forestry and fishing. | |
| Non-energy Use | Refers to products resulting from the transform processes for non-energy purpose (bitumen/lubricants, asphalt/greases) and use of energy products (such as natural gas) as industrial feed stocks. | |
Table 2.
Main energy types considered in the mapping.
| Energy type | Definition [22] | |
|---|---|---|
| Primary energy | Crude oil | A natural product that is extracted from mineral deposits and that consists essentially of many different non-aromatic hydrocarbons. |
| Natural gas | A mixture of gaseous hydrocarbons (mainly methane), which occur in either gas fields or in association with crude oil fields. | |
| Coal and coke | Coal in the energy balance is mainly bituminous with some anthracite. Coke is obtained from coal by heating at high temperature. | |
| Hydropower | The inferred primary energy available for electricity. | |
| Secondary energy | Aviation gasoline (AV) | Aviation fuel. A special blended grade of gasoline for use in aircraft engine of the piston type. The distillation range is 30 °C to 250 °C. |
| Aviation turbine fuel (ATF) | Aviation Fuel. Fuel for use in aviation gas turbines mainly refined from kerosene. The distillation range is between 150 and 250 °C. | |
| Diesel | Distillation falls within 200 °C and 340 °C. Diesel fuel for high-speed diesel engines is more critical of fuel quality than diesel for stationary and marine diesel engines. Marine oil usually consists of a blend of diesel oil and some residual (asphaltic) materials. | |
| Electricity | Electricity generated. | |
| Fuel oil | Heavy distillates, residues or blends of these, used as fuel for production heat and power. Fuel oil production at the refinery is essentially a matter of selective blending of available components rather than of special processing. Fuel oil viscosities vary widely depending on the blend of distillates and residues. | |
| Kerosene | A straight-run fraction from crude oil, with a boiling range from 150 to 250 °C. Its main uses are for domestic lighting and cooking. | |
| Liquefied natural gas (LNG) | Natural gas that is liquefied for ocean transportation and export. | |
| Liquefied petroleum gas (LPG) | A mixture of propane and butane gases that are held in the liquid state by pressure or refrigeration. | |
| Motor gasoline (Petrol) | Petroleum distillate used as fuel in spark-ignition internal combustion engines. The distillation range is within 30 °C and 250 °C. | |
| Refinery gas | The gas released during the distillation of crude oil and contains methane, ethane, propane and butane. Most refinery gas is retained in the refinery and used as fuel in plant operations. | |
| Non-energy use | Non-energy products | Naphtha, bitumen and lubricants, which are obtained by the refinery process from petroleum but used for non-energy purposes. Naphtha is a refined or partly refined light distillate, which is further blended into motor gasoline or used as feedstock in the chemical industry. Bitumen is a viscous liquid or solid, non-volatile and possesses waterproofing and adhesive properties. Lubricating oil is used for lubricating purposes and has a distillation range from 380 to 500 °C. |
2.3. Data Input for Mapping Energy Flows
The original data were mainly based on the Malaysia Energy Balance 2011 table and other studies. To establish an energy balance for mapping, some of the input data should first be treated.
2.3.1. Malaysia National Energy Balance 2011 and the Data Treatment
The Malaysia National Energy Balance 2011 (Table 3) was published by the Malaysia Energy Commission in 2013 [22]. The energy data in this table are classified in three stages, including Primary Supply, Transformation and Secondary Supply and End Use, in addition to being classified into various energy types. Losses and Own Use and Statistical Discrepancy are also presented in Table 3.
Table 3.
Malaysia National Energy Balance 2011.
| Energy source | Natural gas | LNG | Crude oil 1 | Petroleum products | Coal | Hydropower | Biodiesel | Electricity | |||||||
|---|---|---|---|---|---|---|---|---|---|---|---|---|---|---|---|
| Petrol | Diesel | Fuel oil | LPG | Kerosene | ATF AV | Non-Fuel | Refinery gas | ||||||||
| Primary supply, input (+) and output (−) | |||||||||||||||
| 1. Primary Production | 69.8 | 0.0 | 28.3 | 0.0 | 0.0 | 0.0 | 0.0 | 0.0 | 0.0 | 0.0 | 0.0 | 1.8 | 1.9 | 0.2 | 0.0 |
| 2. Gas Flaring | −13.1 | 0.0 | 0.0 | 0.0 | 0.0 | 0.0 | 0.0 | 0.0 | 0.0 | 0.0 | 0.0 | 0.0 | 0.0 | 0.0 | 0.0 |
| 3. Imports | 7.0 | 0.0 | 9.3 | 4.2 | 3.8 | 1.5 | 0.5 | 0.1 | 0.5 | 1.0 | 0.0 | 13.3 | 0.0 | 0.0 | 0.0 |
| 4. Exports | −1.1 | −26.9 | −11.5 | 0.0 | −4.5 | −0.3 | −1.0 | −0.7 | −0.7 | −2.3 | 0.0 | −0.1 | 0.0 | −0.1 | 0.0 |
| 5. Bunkers | 0.0 | 0.0 | 0.0 | 0.0 | 0.0 | −0.2 | 0.0 | 0.0 | 0.0 | 0.0 | 0.0 | 0.0 | 0.0 | 0.0 | 0.0 |
| 6. Stock Change | 0.0 | 0.0 | −1.7 | 0.0 | 1.5 | 0.0 | 0.0 | 0.0 | −0.8 | −0.6 | 0.0 | −0.4 | 0.0 | −0.1 | 0.0 |
| 7. Statistical | 0.0 | 0.0 | 0.3 | 0.0 | 0.0 | 0.0 | 0.0 | 0.0 | 0.0 | 0.0 | 0.0 | 0.1 | 0.0 | 0.0 | 0.0 |
| 8. Total Primary Supply | 62.6 | −26.9 | 24.8 | 4.2 | 0.8 | 0.9 | −0.5 | −0.5 | −1.0 | −1.9 | 0.0 | 14.8 | 1.9 | 0.0 | 0.0 |
| Transformation and secondary supply, input (+) and output (−) | |||||||||||||||
| 9. Gas Plants | |||||||||||||||
| 9.1 LNG | −35.8 | 27.9 | 0.0 | 0.0 | 0.0 | 0.0 | 0.2 | 0.0 | 0.0 | 0.0 | 0.0 | 0.0 | 0.0 | 0.0 | 0.0 |
| 9.2 MDS | −0.9 | 0.0 | 0.0 | 0.0 | 0.1 | 0.0 | 0.0 | 0.0 | 0.0 | 0.3 | 0.0 | 0.0 | 0.0 | 0.0 | 0.0 |
| 9.3 GPP-LPG 2,3 | −4.1 | 0.0 | 0.0 | 0.0 | 0.0 | 0.0 | 2.4 | 0.0 | 0.0 | 0.0 | 0.0 | 0.0 | 0.0 | 0.0 | 0.0 |
| 9. Gas Plant Subtotal | −40.7 | 27.9 | 0.0 | 0.0 | 0.1 | 0.0 | 2.6 | 0.0 | 0.0 | 0.3 | 0.0 | 0.0 | 0.0 | 0.0 | 0.0 |
| 10. Refineries | 0.0 | 0.0 | −24.8 | 3.6 | 8.9 | 0.6 | 0.7 | 0.4 | 3.5 | 4.6 | 1.7 | 0.0 | 0.0 | 0.0 | 0.0 |
| 11. Power station and self-generation | |||||||||||||||
| 11.1 Hydropower Stations | 0.0 | 0.0 | 0.0 | 0.0 | 0.0 | 0.0 | 0.0 | 0.0 | 0.0 | 0.0 | 0.0 | 0.0 | −1.9 | 0.0 | 0.7 |
| 11.2 Thermal Stations | −11.0 | 0.0 | 0.0 | 0.0 | −1.0 | −1.1 | 0.0 | 0.0 | 0.0 | 0.0 | 0.0 | −13.0 | 0.0 | 0.0 | 9.6 |
| 11.3 Self-Generation | −1.7 | 0.0 | 0.0 | 0.0 | −0.2 | 0.0 | 0.0 | 0.0 | 0.0 | 0.0 | 0.0 | 0.0 | 0.0 | 0.0 | 0.4 |
| 11. Power Station Subtotal | −12.7 | 0.0 | 0.0 | 0.0 | −1.2 | −1.1 | 0.0 | 0.0 | 0.0 | 0.0 | 0.0 | −13.0 | −1.9 | 0.0 | 10.7 |
| 12. Losses & Own Use | −0.6 | −1.1 | 0.0 | 0.0 | 0.0 | 0.0 | 0.0 | 0.0 | 0.0 | −1.7 | −1.6 | 0.0 | 0.0 | 0.0 | −1.1 |
| 13. Statistical Discrepancy | 0.0 | 0.0 | 0.0 | 0.4 | 0.0 | 0.0 | 0.0 | 0.1 | 0.1 | 0.0 | 0.0 | 0.0 | 0.0 | 0.0 | −0.3 |
| 14. Total Secondary Supply | −54.1 | 26.9 | −24.8 | 4.0 | 7.9 | −0.5 | 3.3 | 0.6 | 3.6 | 3.0 | 0.0 | −13.0 | −1.9 | 0.0 | 9.3 |
| End use | |||||||||||||||
| 15. Residential | 0.0 | 0.0 | 0.0 | 0.0 | 0.0 | 0.0 | 0.8 | 0.0 | 0.0 | 0.0 | 0.0 | 0.0 | 0.0 | 0.0 | 2.0 |
| 16. Commercial | 0.0 | 0.0 | 0.0 | 0.0 | 0.4 | 0.0 | 0.6 | 0.0 | 0.0 | 0.0 | 0.0 | 0.0 | 0.0 | 0.0 | 3.2 |
| 17. Industrial | 4.3 | 0.0 | 0.0 | 0.2 | 1.3 | 0.3 | 0.2 | 0.0 | 0.0 | 0.0 | 0.0 | 1.8 | 0.0 | 0.0 | 4.0 |
| 18. Transportation | 0.3 | 0.0 | 0.0 | 8.0 | 6.2 | 0.0 | 0.0 | 0.0 | 2.6 | 0.0 | 0.0 | 0.0 | 0.0 | 0.0 | 0.0 |
| 19. Agriculture | 0.0 | 0.0 | 0.0 | 0.0 | 0.9 | 0.0 | 0.0 | 0.0 | 0.0 | 0.0 | 0.0 | 0.0 | 0.0 | 0.0 | 0.0 |
| 20. Non-Fuel | 3.9 | 0.0 | 0.0 | 0.0 | 0.0 | 0.0 | 1.3 | 0.0 | 0.0 | 1.2 | 0.0 | 0.0 | 0.0 | 0.0 | 0.0 |
| 21. Total End Use | 8.5 | 0.0 | 0.0 | 8.2 | 8.7 | 0.4 | 2.9 | 0.0 | 2.6 | 1.2 | 0.0 | 1.8 | 0.0 | 0.0 | 9.2 |
1. Crude oil production includes condensates comprising pentane and heavier hydrocarbons; 2. GPP-LPG extract liquid products such as condensate, ethane, butane and propane from natural gas; 3. Butane and propane as MTBE feedstock are presented as non-energy use under LPG column.
The energy Sankey diagram mapped in this study is an energy allocation diagram that only shows the energy allocation in a total energy balance and does not reflect any loss. The Primary Energy Quantity (PEQ) of each energy flow was required for mapping. The PEQ was defined as follows:
In the equation, KPEQ is defined as below:
KPEQ reflects the transformation factor, usually KPEQ ≥ 1. The value of KPEQ shows the unit of primary energy consumed to produce 1 unit of the secondary energy. We defined KPEQ of primary energy as 1.
InputPEQ: Total of resources input into the transformation sector counted in Primary Energy Quantity.
OutputSQ: Total of production output from the transformation sector counted in Standard Quantity. SQ means Standard Quantity.
The transformation factors used in the mapping are given in Table 4.
Table 4.
The transformation factors used in the mapping.
| Energy carrier | |||||
|---|---|---|---|---|---|
| Primary energy | Crude oil | Natural gas | Coal | Hydropower | |
| LNG | 1.34 | 0 | 1.34 | 0 | 0 |
| Petrol | 1.17 | 1.17 | 0 | 0 | 0 |
| Diesel | 1.19 | 1.16 | 0.03 | 0 | 0 |
| Fuel Oil | 1.17 | 1.17 | 0 | 0 | 0 |
| LPG | 1.55 | 0.23 | 1.32 | 0 | 0 |
| Kerosene | 1.31 | 1.09 | 0.23 | 0 | 0 |
| ATF & AV | 1.17 | 1.17 | 0 | 0 | 0 |
| Non-Fuel | 1.27 | 1.11 | 0.16 | 0 | 0 |
| Electricity | 3.30 | 0.29 | 1.40 | 1.41 | 0.20 |
Based on these factors and the original energy balance, a processed energy balance is provided in Table 5, in which all of the presented energy values represent the Primary Energy Quantity. These data were used as the input data for mapping with the energy Sankey diagram.
2.3.2. Other Energy Data
The Malaysia National Energy Balance 2011 table does not provide energy data for End-use. The data required for mapping End-use were collected from various literature sources, as listed in Table 6.
Table 5.
Input data for mapping energy allocation diagram of Malaysia (2011).
| Energy source | Natural gas | LNG | Crude oil | Others | Petroleum products | Coal | Hydropower | Electricity | ||||||
|---|---|---|---|---|---|---|---|---|---|---|---|---|---|---|
| Petrol | Diesel | Fuel oil | LPG | Kerosene | ATF AV | Non-Fuel | ||||||||
| Primary supply, input (+) and output (-) | ||||||||||||||
| 1. Primary Production | 69.8 | 0.0 | 28.7 | 0.0 | 0.0 | 0.0 | 0.0 | 0.0 | 0.0 | 0.0 | 0.0 | 1.9 | 1.9 | 0.0 |
| 2. Gas Flaring | −13.1 | 0.0 | 0.0 | 0.0 | 0.0 | 0.0 | 0.0 | 0.0 | 0.0 | 0.0 | 0.0 | 0.0 | 0.0 | 0.0 |
| 3. Imports | 7.0 | 0.0 | 9.2 | 0.2 | 4.9 | 4.5 | 1.7 | 0.8 | 0.2 | 0.6 | 1.3 | 13.4 | 0.0 | 0.1 |
| 4. Exports | −1.1 | −36.0 | −11.6 | −0.1 | 0.0 | −5.3 | −0.4 | −1.5 | −0.9 | −0.8 | −2.9 | −0.1 | 0.0 | 0.0 |
| 5. Bunkers | 0.0 | 0.0 | 0.0 | 0.0 | 0.0 | 0.0 | −0.2 | 0.0 | 0.0 | 0.0 | 0.0 | 0.0 | 0.0 | 0.0 |
| 6. Stock Change | 0.0 | 0.0 | −1.7 | 0.0 | 0.0 | 1.8 | 0.0 | 0.0 | 0.0 | −1.0 | −0.8 | −0.4 | 0.0 | 0.0 |
| 7. Total Primary Supply | 62.6 | −36.0 | 24.7 | 0.1 | 4.9 | 1.0 | 1.1 | −0.7 | −0.7 | −1.2 | −2.4 | 14.8 | 1.9 | 0.1 |
| Transformation, input (+) and output (-) | ||||||||||||||
| 8. Gas Plants | ||||||||||||||
| 8.1 LNG | −36.2 | 36.0 | 0.0 | 0.0 | 0.0 | 0.0 | 0.0 | 0.3 | 0.0 | 0.0 | 0.0 | 0.0 | 0.0 | 0.0 |
| 8.2 MDS | −0.9 | 0.0 | 0.0 | 0.0 | 0.0 | 0.2 | 0.0 | 0.0 | 0.1 | 0.0 | 0.5 | 0.0 | 0.0 | 0.0 |
| 8.3 GPP LPG | −4.1 | 0.0 | 0.0 | 0.0 | 0.0 | 0.0 | 0.0 | 4.1 | 0.0 | 0.0 | 0.0 | 0.0 | 0.0 | 0.0 |
| 8. Gas Plant Subtotal | −41.2 | 36.0 | 0.0 | 0.0 | 0.0 | 0.2 | 0.0 | 4.4 | 0.1 | 0.0 | 0.5 | 0.0 | 0.0 | 0.0 |
| 9. Refineries | 0.0 | 0.0 | −24.7 | −0.1 | 4.7 | 10.5 | 0.7 | 0.8 | 0.6 | 4.2 | 3.4 | 0.0 | 0.0 | 0.0 |
| 10. Power Station and Self-Generation | ||||||||||||||
| 10.1 Hydropower Stations | 0.0 | 0.0 | 0.0 | 0.0 | 0.0 | 0.0 | 0.0 | 0.0 | 0.0 | 0.0 | 0.0 | 0.0 | −1.9 | 1.9 |
| 10.2 Thermal Stations | −11.1 | 0.0 | 0.0 | 0.0 | 0.0 | −1.2 | −1.3 | 0.0 | 0.0 | 0.0 | 0.0 | −13.0 | 0.0 | 26.6 |
| 10.3 Self-Generation | −1.7 | 0.0 | 0.0 | 0.0 | 0.0 | −0.2 | 0.0 | 0.0 | 0.0 | 0.0 | 0.0 | 0.0 | 0.0 | 2.0 |
| 10. Power Station Subtotal | −12.9 | 0.0 | 0.0 | 0.0 | 0.0 | −1.4 | −1.3 | 0.0 | 0.0 | 0.0 | 0.0 | −13.0 | −1.9 | 30.4 |
| 11. Total Secondary Supply | −54.1 | 36.0 | −24.7 | −0.1 | 4.7 | 9.3 | −0.6 | 5.2 | 0.7 | 4.2 | 3.9 | −13.0 | −1.9 | 30.4 |
| End use | ||||||||||||||
| 15. Residential | 0.0 | 0.0 | 0.0 | 0.0 | 0.0 | 0.0 | 0.0 | 1.2 | 0.0 | 0.0 | 0.0 | 0.0 | 0.0 | 6.5 |
| 16. Commercial | 0.0 | 0.0 | 0.0 | 0.0 | 0.0 | 0.5 | 0.0 | 0.9 | 0.0 | 0.0 | 0.0 | 0.0 | 0.0 | 10.5 |
| 17. Industrial | 4.3 | 0.0 | 0.0 | 0.0 | 0.2 | 1.5 | 0.4 | 0.3 | 0.0 | 0.0 | 0.0 | 1.8 | 0.0 | 13.4 |
| 18. Transportation | 0.3 | 0.0 | 0.0 | 0.0 | 9.4 | 7.3 | 0.0 | 0.0 | 0.0 | 3.0 | 0.0 | 0.0 | 0.0 | 0.1 |
| 19. Agriculture | 0.0 | 0.0 | 0.0 | 0.0 | 0.0 | 1.0 | 0.0 | 0.0 | 0.0 | 0.0 | 0.0 | 0.0 | 0.0 | 0.1 |
| 20. Non-Fuel | 3.9 | 0.0 | 0.0 | 0.0 | 0.0 | 0.0 | 0.0 | 2.0 | 0.0 | 0.0 | 1.5 | 0.0 | 0.0 | 0.0 |
| 21. Total End Use | 4.6 | 0.0 | 0.0 | 0.0 | 9.5 | 10.3 | 0.5 | 2.5 | 0.0 | 3.0 | 0.0 | 1.8 | 0.0 | 30.5 |
Table 6.
Other data required for the mapping.
| Item | Data |
|---|---|
| Industrial | According to the energy audit launched under the Malaysian Energy Efficiency Improvement Program (MIEEIP) in 2005 [23], most of the energy input into the industrial sector was consumed by eight industries. Therefore, we could consider the industrial energy input equally based on these ratios: (1) Cement 47.6%; (2) Steel & iron 19.2%; (3) Pulp and paper 13.9%; (4) Food 10.6%; (5) Glass 2.9%; (6) Wood 1.4%; (7) Rubber 1.1%; (8) Ceramic 0.9%; and (9) Other 2.3%. |
| Commercial | Electricity and LPG were the main energy types consumed in the commercial sector. We assumed that LPG was used as cooking gas [12]. The end use of electricity could be allocated as (1) air-conditioning 64%; (2) illumination 12% and (3) others 24%. |
| Residential | Electricity and LPG were the main energy types consumed in the residential sector. We assumed that LPG was used as cooking gas [11]. The end use of electricity could be allocated as (1) refrigeration 21.1%; (2) cooking equipment 14.7%; (3) air-conditioning 11.9%; (4) washing machines 10.5%; (5) illumination 5.1% and others 36.7%. |
| Transportation | Four main vehicles were listed, including motorcars, trucks, buses and planes. Motorcycles, rail transport, and ships were ignored as they consume only a small portion of energy in Malaysia. We assumed that all petrol was consumed within gasoline cars. In addition, we also assumed diesel was consumed within only diesel cars, buses and trucks [24]: (1) motorcars (petrol) 100%; (2) motorcars (diesel) 6.6%; (3) buses (diesel) 5.5%; and (4) trucks (diesel) 87.9%. |
| Agriculture | Agricultural covers agricultural, forestry and fishing activity. This only contributes a very small portion of energy consumption in Malaysia. |
3. Current Status
Based on the method and data input introduced in Section 2.2, Malaysia’s energy allocation diagram was mapped as illustrated in Figure 2. In addition, the oil products portion was magnified into an oil product flow diagram for Malaysia as illustrated in Figure 3. Through these diagrams, the whole picture of Malaysia’s energy use is presented, and the main features of Malaysia energy use are summarized as follows:
- (1)
- Malaysia’s energy supply mainly came from crude oil, natural gas, coal and hydropower. Most of the crude oil and natural gas supply in Malaysia came from domestic production, whereas the vast majority of coal was imported.
- (2)
- Malaysia is a net energy exporting country, whereas crude oil and natural gas were the main energy types exported, and 97% of natural gas was exported in LNG form.
- (3)
- Though Malaysia was a net exporter of crude oil, it was a net importer of oil products, especially petrol (gasoline). Half of the petrol consumed in the end-use sectors was imported, and no petrol was exported.
- (4)
- The electricity supply of Malaysia mainly relied on domestic power generation, and most of the natural gas (74% of the supply), most of the coal (88% of the supply) and all the hydropower were used for electricity generation.
- (5)
- Electricity (49%), oil products (41%), natural gas (7%) and coal (3%) were the main energy forms for end-use. Each main end-use sector, including the transportation sector, industrial sector and domestic sector (residential, commercial and agriculture), accounted for approximately one-third of the energy consumption. The vast majority of oil products (69%) were consumed in the transportation sector.
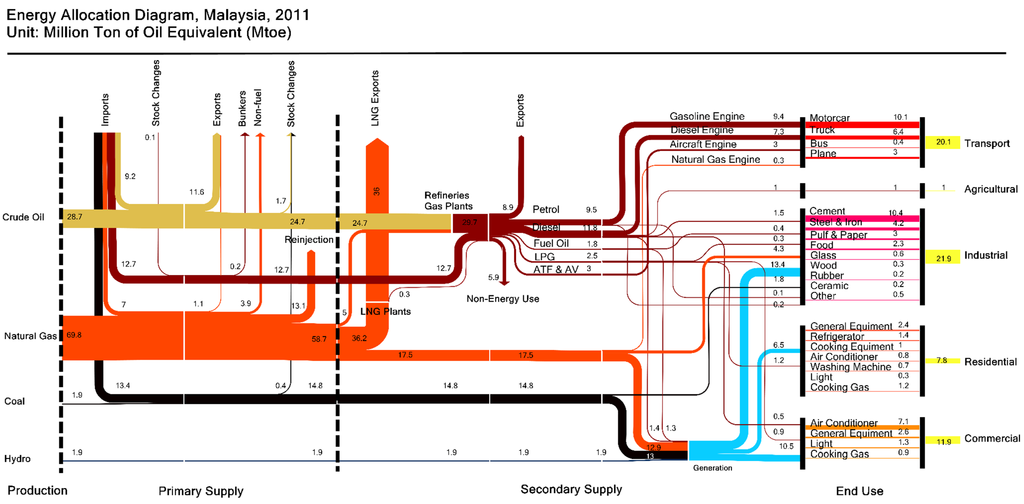
Figure 2.
Malaysia energy allocation diagram, 2011.
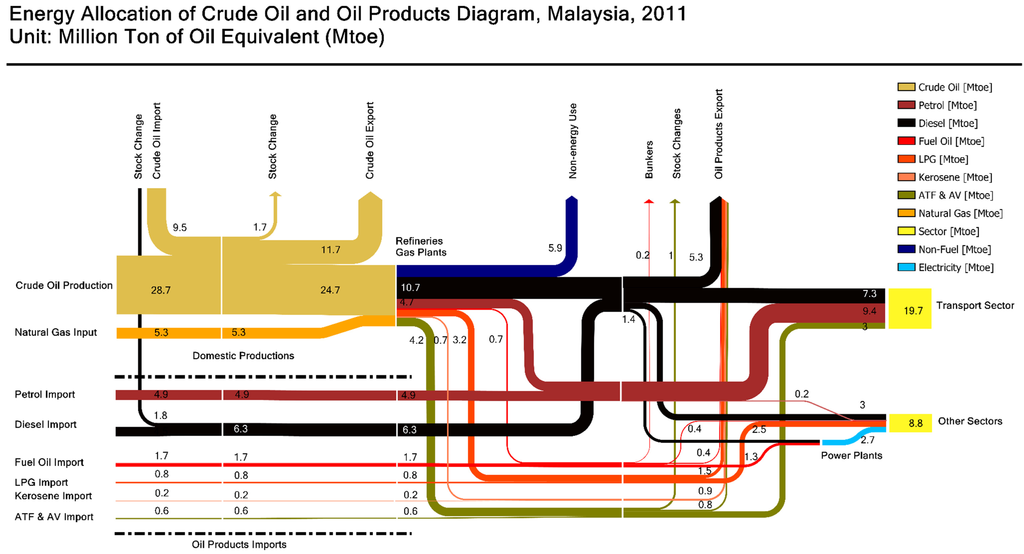
Figure 3.
Malaysia energy allocation of crude oil and oil products diagram in 2011.
The details of the current status of energy use in Primary supply, Secondary supply and End-use are further introduced in the following sections.
3.1. Primary Supply
In 2011, a total of 102.3 Mtoe of energy was produced in Malaysia, and for the most part this comprised natural gas and crude oil, which accounted for 96.3% of energy production. A total of 42.3 Mtoe of energy was imported, and 57.6 Mtoe of energy was exported. Natural gas (mainly in LNG form), crude oil and oil products were the main exports, and coal and oil products were the main imports. The structure of Malaysia’s energy production, imports and exports are illustrated in Figure 4.
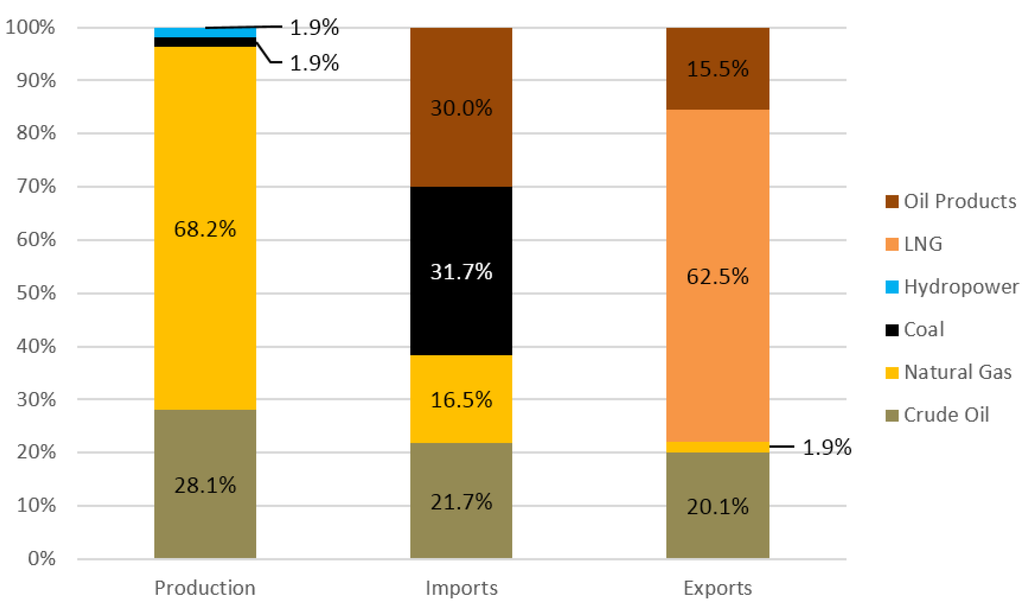
Figure 4.
The structure of Malaysia’s energy production, imports and exports in 2011.
In 2011, Malaysia produced 28.7 Mtoe of crude oil, which places the country 28th in the world and 4th in the Asia-Pacific area, ranking only after China, Indonesia and India [25]. The Malay Peninsula contributed 43%, whereas Sabah and Sarawak contributed 24% and 34% of the total. In 2011, 13.9 Mtoe of oil products were imported, and 11.8 Mtoe oil products were exported. Non-fuel use products imports and exports were ignored. Petrol and diesel were the most important oil products in Malaysian energy consumption, especially in the transportation sector. Diesel was the main export, whereas petrol was the main import. In addition, 51% of the petrol supply relied on imports. The import and export structure of oil products is shown in Figure 5 and Figure 6, respectively.
In 2011, Malaysia produced 69.8 Mtoe of natural gas, which places it 11th in the world and 3rd in the Asia-Pacific Area [25], ranking after China and Indonesia. The Malay Peninsula contributed 33%, whereas Sabah and Sarawak contributed 61% and 6% of the total. LNG was the main form for natural gas export in Malaysia in 2011. In 2011, 97% of natural gas was exported through liquefaction, whereas the remainder was transferred via pipelines. LNG exports accounted for 62.5% of total Malaysia energy exports. All natural gas was imported through the pipeline system. Malaysia was the third-largest LNG exporter [25], ranking only behind Qatar and Indonesia. In 2011, 36.0 Mtoe natural gas was liquefied. Most of this LNG was exported to Japan, South Korea, Taiwan and China, which contributed 61%, 21%, 12% and 5.5% of LNG export volume [26]. The Malaysia International Shipping Corporation Berhad which has 29 LNG carriers, making it currently the world’s largest single owner of an LNG fleet, was in charge of the transportation of this LNG [27].
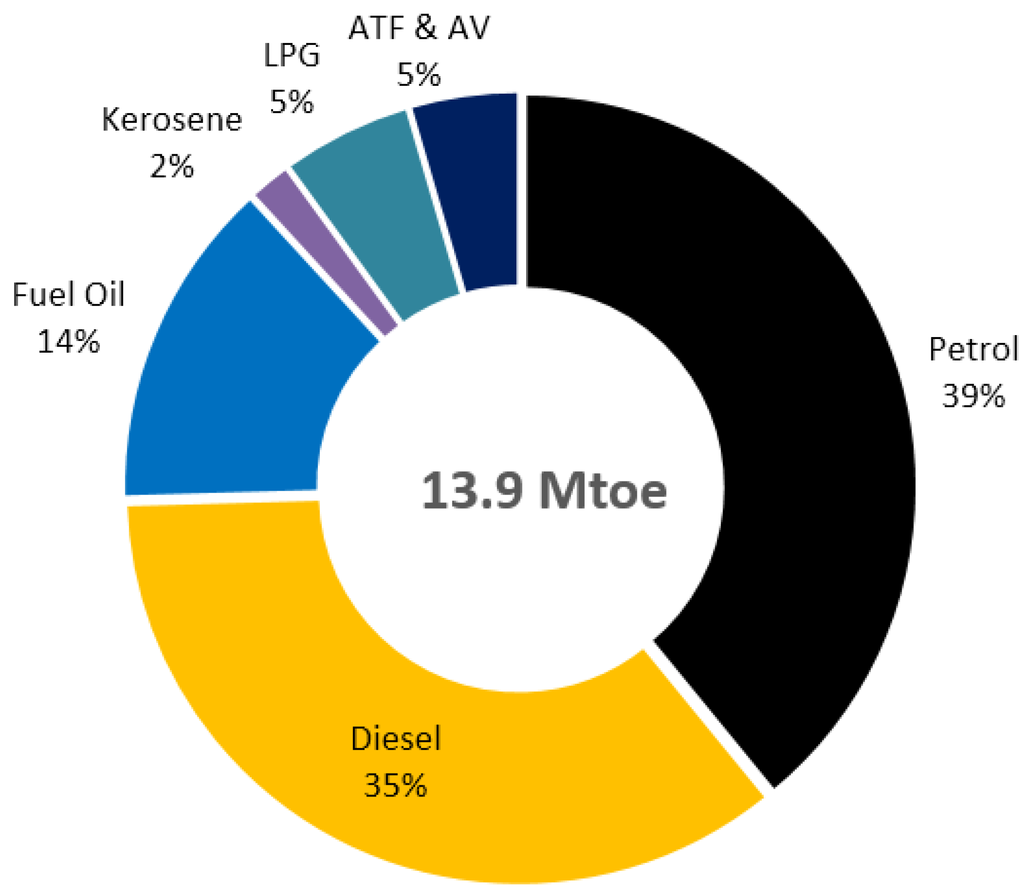
Figure 5.
The structure of Malaysia’s oil products imports in 2011.
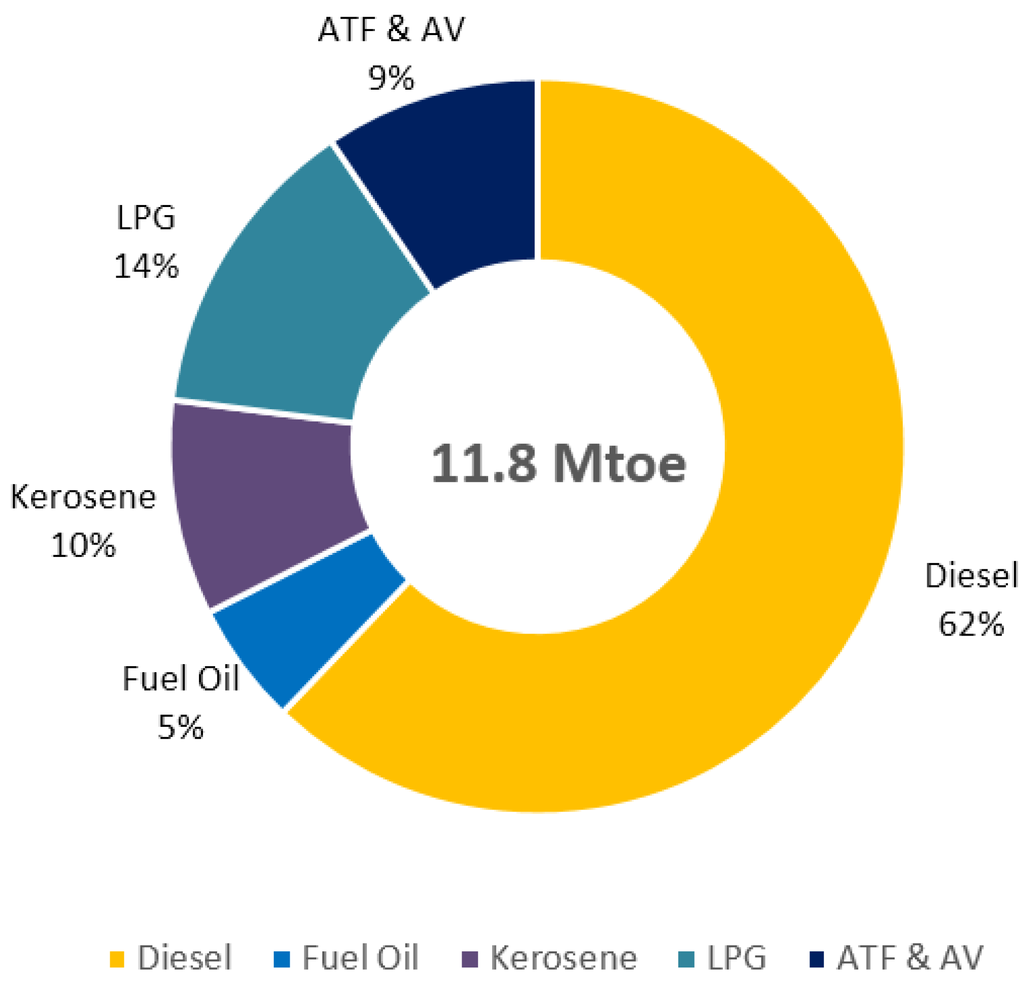
Figure 6.
The structure of Malaysia’s oil products exports in 2011.
Malaysia coal supply mainly relied on imports from Indonesia and Australia [16]. In 2011, 92.5% of the coal supply was imported, which accounted for 31.7% of Malaysia total energy imports, and the domestic production was only 1.9 Mtoe.
Hydropower is the only renewable energy that is commercially available on a large scale in Malaysia. Although Malaysia had a hydropower potential of 22,000 MW [16], of which 20,000 MW was distributed in Sarawak [28], only 3015 MW was utilized in 2011 [22]. This was basically due to the high capital investment required and social-political issues. Hydropower accounted for 1.9% of Malaysia domestic energy production.
3.2. Secondary Supply
In 2011, 24.7 Mtoe of crude oil and 5.3 Mtoe of natural gas were input into refineries and gas plants. As a result of transformation, 24.1 Mtoe of oil products were produced. In addition, 5.9 Mtoe of non-energy use was also produced in this section. Figure 7 illustrates the output structure of refineries and gas plants in Malaysia.
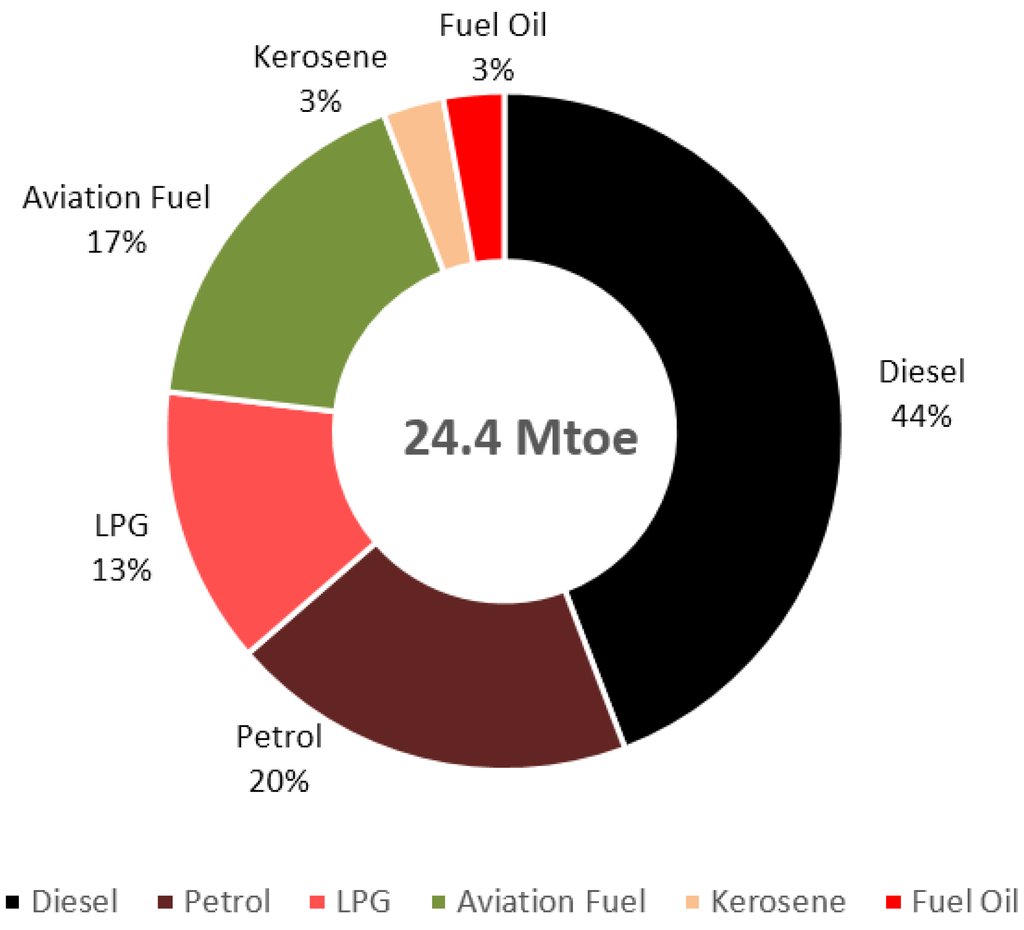
Figure 7.
Output structure of refineries and gas plants in 2011.
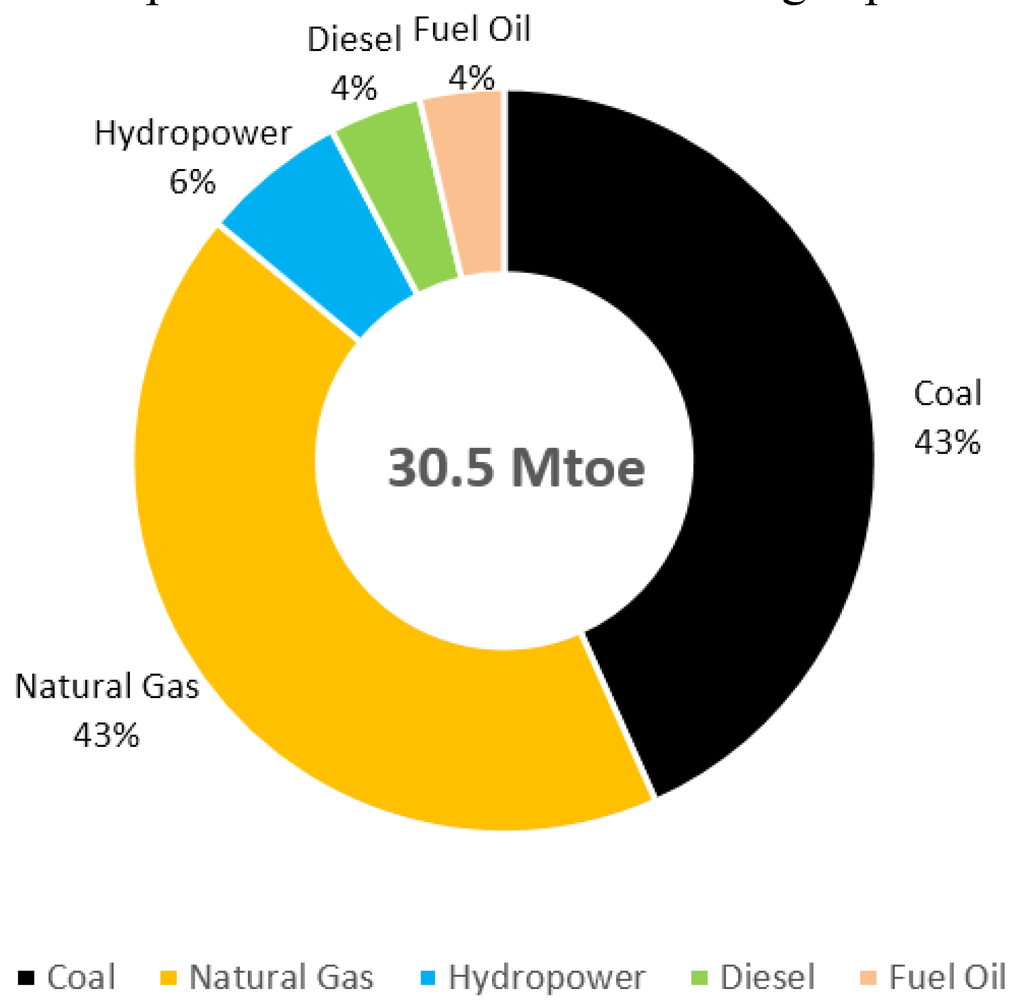
Figure 8.
Input structure of power plants in Malaysia in 2011.
A total of 30.5 Mtoe of primary energy was used for electricity generation in 2011. The main fuels consumed in the generation sector were coal and natural gas, which contributed 86% of energy for electricity generation. The others included hydropower, diesel and fuel oil. The energy input structure of power plants is given in Figure 8.
3.3. End-Use
According to Figure 1, a total of 62.7 Mtoe of energy was consumed in the Malaysian society in 2011 by the industrial, residential, commercial, agriculture and transportation sectors. The industrial sector was the largest energy consumer in 2011, followed by the transportation sector, which mainly consumed oil products, and then the commercial sector and residential sector. The agriculture sector only contributed 2% of primary energy consumption. The share of the industrial sector, transportation sectors, and domestic sectors (commercial, residential and agriculture sector) were very close and accounted for approximately one-third of end-use energy consumption in Malaysia in 2011, as illustrated in Figure 9.
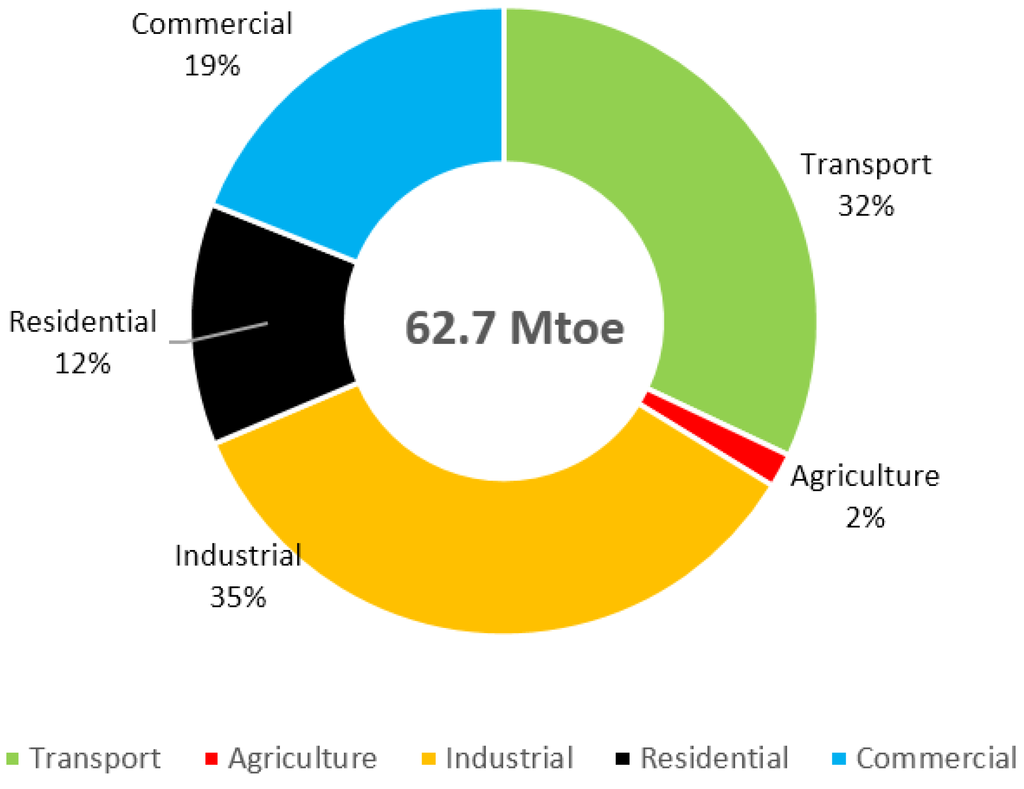
Figure 9.
End energy use in each sector in Malaysia in 2011.
Electricity was the main energy form consumed in the end-use sectors. In 2011, 30.5 Mtoe of electricity was consumed, followed by 25.9 Mtoe of oil products, with 76% of them consumed by the transportation sector. Natural gas and coal were typically consumed in the industrial sector as a fuel to provide heat steam and fluid, which accounted for 4.3 Mtoe and 1.8 Mtoe of consumption, respectively. The end-use sector energy consumption could also be expressed in primary energy form, as shown in Figure 10, Figure 11 and Figure 12.
Electricity was the main energy form used in the commercial sector in 2011. In 2011, 10.5 Mtoe of electricity was consumed in this sector. Air-conditioning, illumination and others were the main energy type of consumption in the commercial sector. In addition, 0.9 Mtoe of LPG was used as cooking gas in restaurants and hotels. The energy consumption structure in the commercial sector is given in Figure 13.
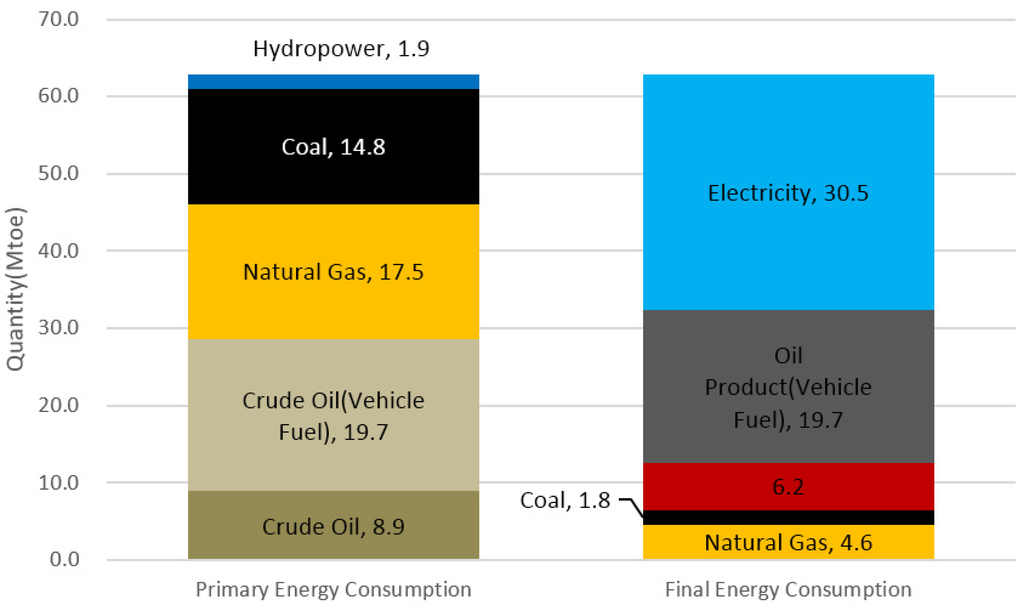
Figure 10.
Energy consumption in end-use sectors in Malaysia in 2011.
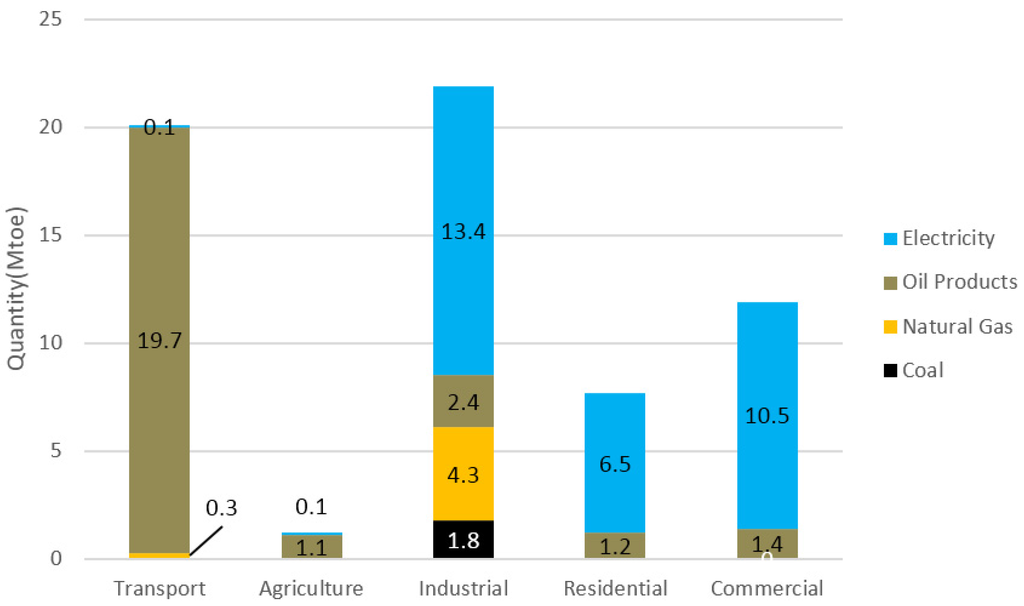
Figure 11.
Energy consumption in end-use sectors in Malaysia in 2011.
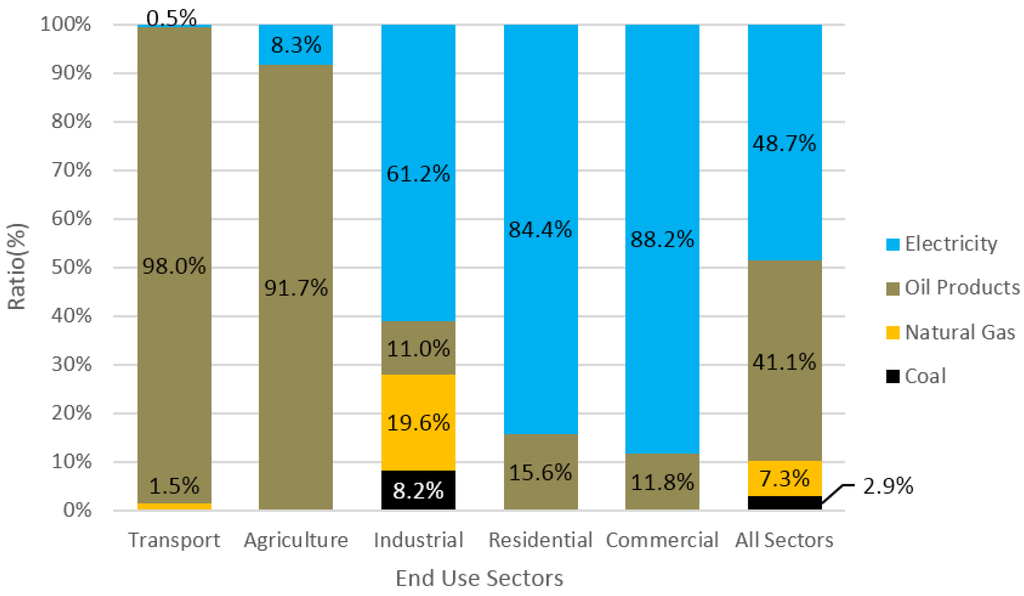
Figure 12.
The structure of energy consumption in end-use sectors in Malaysia in 2011.
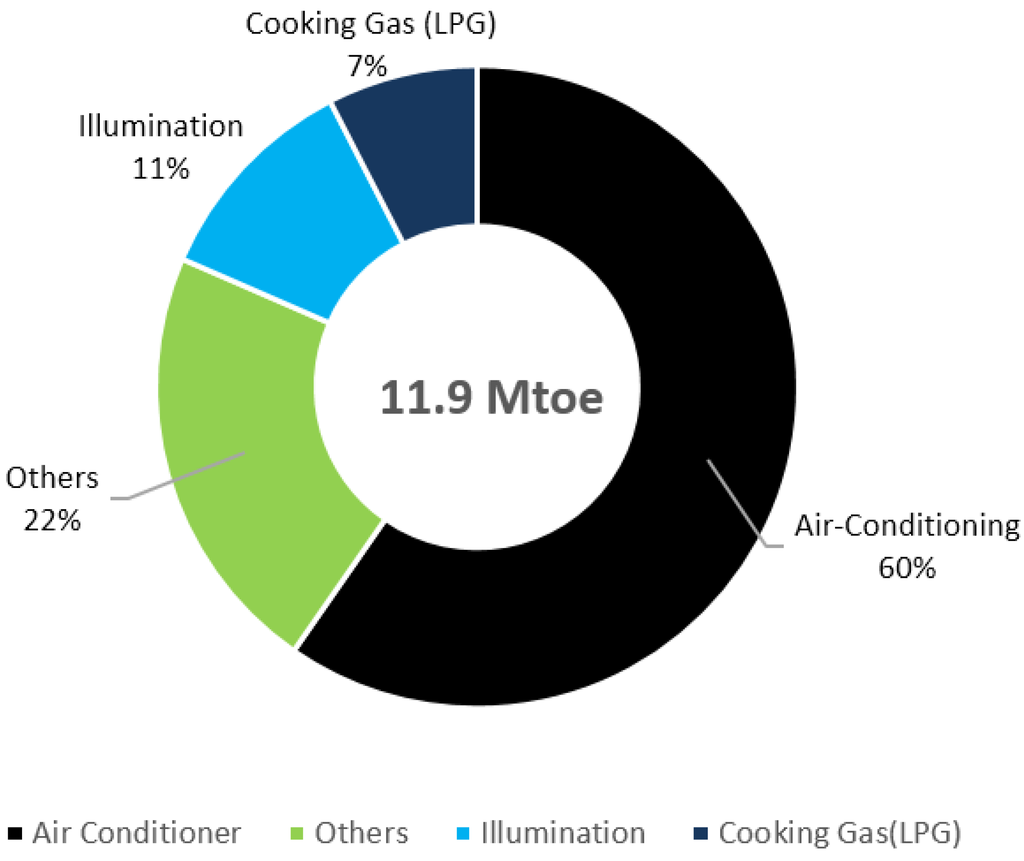
Figure 13.
Commercial energy use in Malaysia in 2011.
In 2011, residential sector consumed 6.5 Mtoe of electricity. This energy consumption was mainly due to refrigeration, cooking equipment, air-conditioning, washing machines, illumination and others. In addition, 1.2 Mtoe of LPG was consumed as cooking gas. The energy consumption structure in the residential sector is given in Figure 14.
In 2011, energy input into the industrial sector was 21.9 Mtoe. Electricity was the main energy form in this sector, followed by natural gas, coal and oil products. The cement industry, steel and iron industry, pulp and paper industry and food production industry were the main energy consumers in the industrial sector, which consumed 92% of industrial energy. The energy consumption structure in the industrial sector is given in Figure 15.
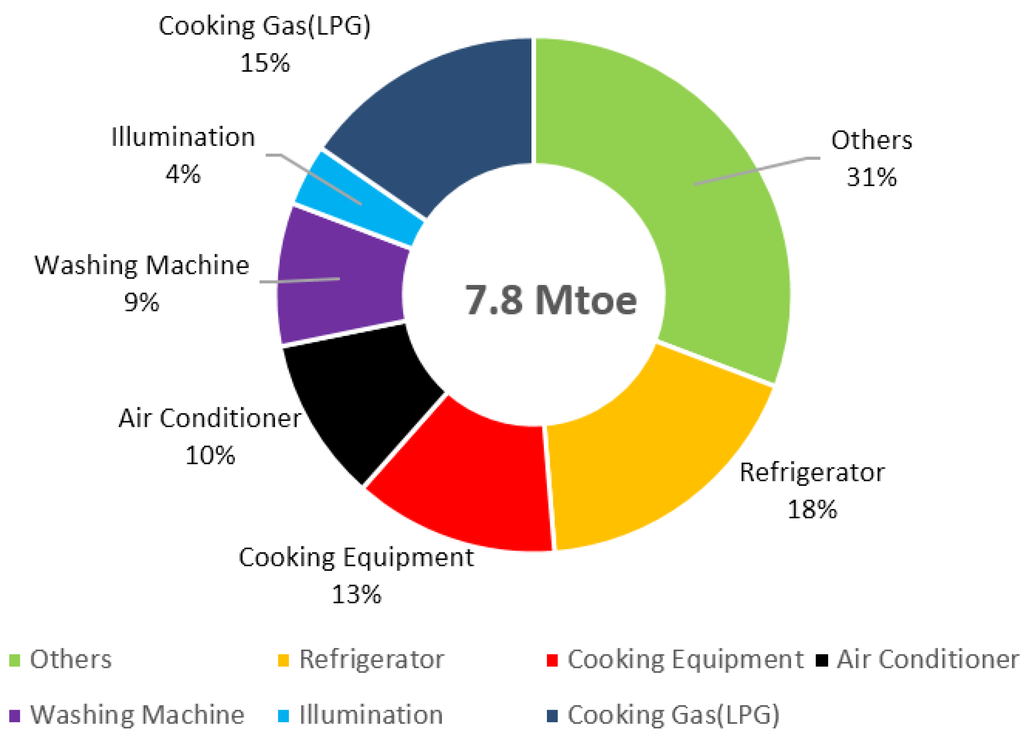
Figure 14.
The structure of residential energy consumption in Malaysia in 2011.
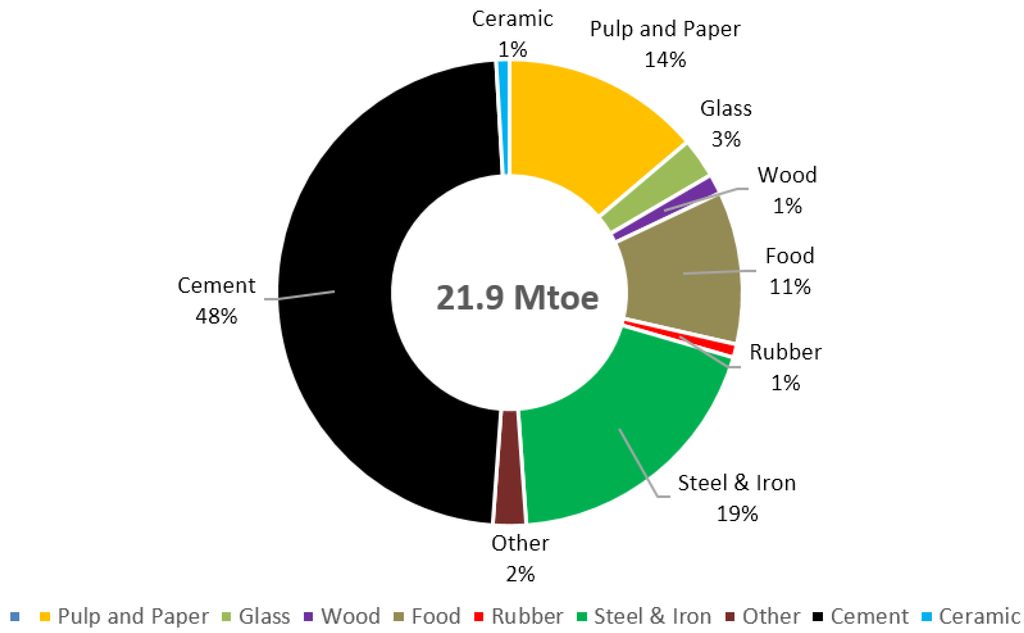
Figure 15.
Industrial sector energy consumption in Malaysia in 2011.
Agriculture only consumed 1.0 Mtoe of diesel and 0.1 Mtoe of electricity in 2011, which accounted for less than 2% of total end-use energy consumption. The transportation sector was the largest oil products consumer, especially petrol and diesel. In 2011, 19.7 Mtoe of oil products and 0.3 Mtoe of natural gas were consumed in the transportation sector. Motorcars were the largest consumer, as followed by trucks and buses. In addition, there was also 3.0 Mtoe of aviation fuel consumption. The energy consumption structure in the transportation sector is given in Figure 16.
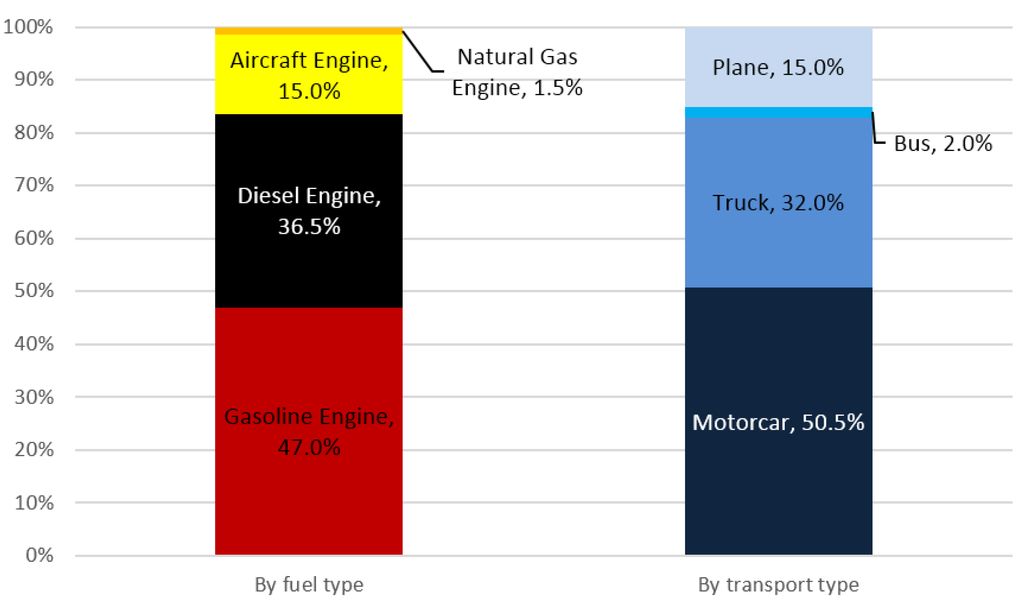
Figure 16.
The structure of energy consumption in the transportation sector in Malaysia in 2011.
4. Ongoing Trends
While Figure 1 provides a static state of energy flow from supply sector to end use sector in 2011, Malaysia is rapidly developing and the physical path of energy use is changing over time. Hence, it is important to take the understanding of Malaysia energy flows and then analyze it in light of historical and ongoing trends from the four key aspects: (1) Energy demand; (2) Resources availability; (3) Technology choice and (4) Policy adjustment.
4.1. Energy Demand
Malaysia, being a growing developing country, is expected to have continuous rise in energy demand. In last two decades, Malaysia’s gross domestic production (GDP, 1987 fixed price) [1] grew steadily at an average of 5.8% from 1990 to 2012, in which growth was 6.2% from 1990 to 2005 and 4.9% from 2005 to 2012. The GDP per capita [1] increased from RM 5820 to RM 12,556 (1987 fixed price) at an average of 3.6% in 1990–2012. Malaysia’s energy consumption grew at an average of 6.62% from 1980 to 2012, in which 5.74% from 1980 to 1990, 9.59% from 1990 to 2005 and 1.74% from 2005 to 2012. The historical trend of Malaysia energy consumption is provided in Figure 17 (by sector) and Figure 18 (by fuel type).
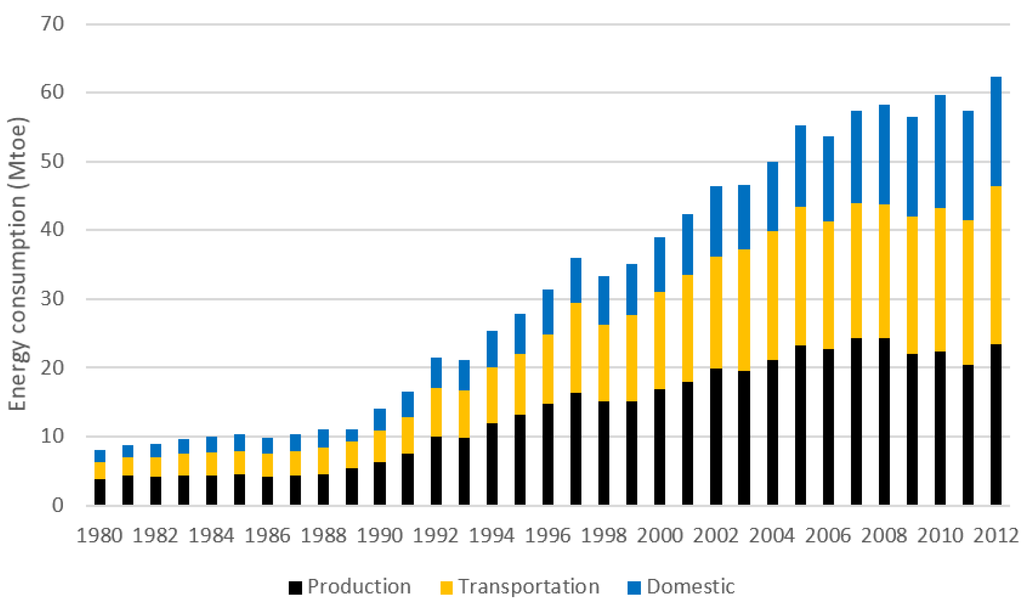
Figure 17.
Energy consumption of Malaysia expressed by sectors.
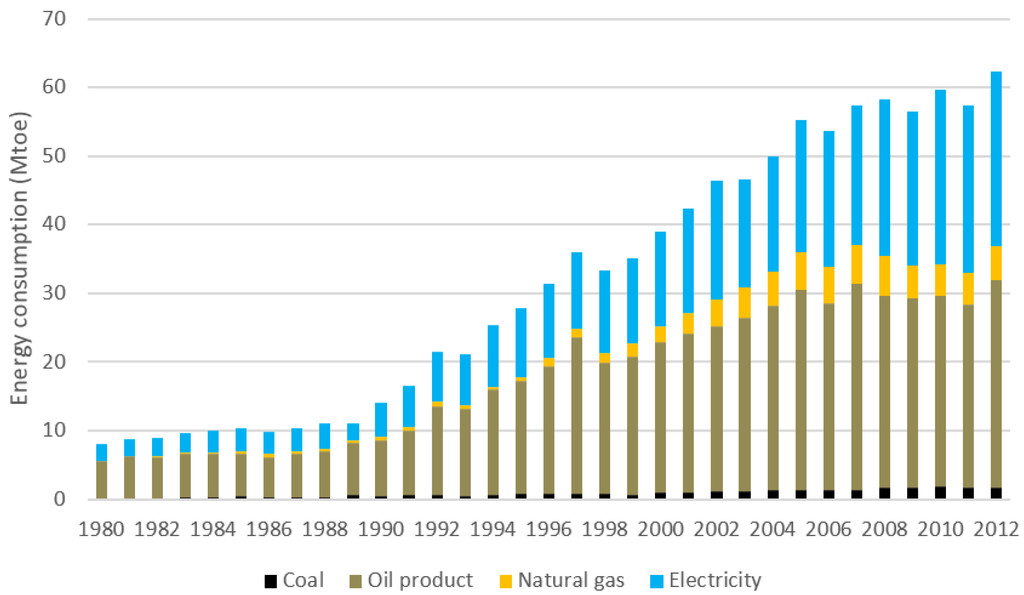
Figure 18.
Energy consumption of Malaysia expressed by fuel type.
The proportion of secondary industry in GDP formation [1] firstly increased from 40.3% in 1990 and reached a high point of 50.4% in 2005, and decreased to 44.8% in 2012, while the proportion of primary industry decreased from 36.9% to 24.9% and the tertiary industry increased from 22.8% to 30.3%. According to the data mentioned above, the development of energy consumption of Malaysia which shown in Figure 17 can be divided in three periods (Table 7):
- (1)
- 1980–1990: Initial stage of industrialization. Primary industry especially agriculture was replaced by secondary industry gradually, and energy consumption growth maintained at a low rate in this stage.
- (2)
- 1990–2005: Middle stage of industrialization. Malaysia was simultaneously experiencing rapid industrialization, urbanization and motorization in this stage. Huge amount of energy were consumed to support the rapid development of industrial sector and the new added demand of services primarily pertaining to energy-intensive products, such as houses, cars, machines and infrastructures. Both energy consumption in the manufacturing, transportation and domestic sectors experienced a high speed growth in this stage.
- (3)
- 2005–2012: Later in the middle stage of industrialization, the proportion of secondary industry decreased whereas the proportion of tertiary industry increased gradually. Comparing with the previous stages, energy consumption in all sectors showed an obvious deceleration, in which the energy consumption growth of the manufacturing sector was nearly zero.
Table 7.
Average annual end-use energy consumption growth.
| Period | Average annual end-use energy consumption growth (%) | |||
|---|---|---|---|---|
| Manufacture | Transportation | Domestic | Total | |
| 1980–1990 | 5.06% | 6.21% | 6.52% | 5.74% |
| 1990–2005 | 9.11% | 10.40% | 9.28% | 9.59% |
| 2005–2012 | 0.06% | 1.95% | 4.28% | 1.74% |
| 1980–2012 | 5.81% | 7.19% | 7.31% | 6.62% |
In 2010, Malaysia launched the New Economic Model, which aims for the country to reach high income status by 2020 while ensuring that growth is also sustainable and inclusive. There is a projection that the GDP growth of Malaysia will remain at 4.7%–5.2% by 2020 [29], in which the tertiary industry will become the dominant industry in near future. The continuously drawdown of the proportion and energy intensity of the manufacturing sector will slow down the energy consumption growth, but with the increasing GDP per capita and the expanding tertiary industry, the energy consumption will still increase and the share of electricity and liquid fuel for vehicle may increase in the near future.
4.2. Resource Availability
Malaysia is an energy net exporter as it has abundant energy resources, especially crude oil and natural gas. To ensure reliable energy supply and for strategic purposes, Malaysia also imported energy from the other countries.
4.2.1. Crude Oil
In 2011, Malaysia had 3.7 billion barrels of proven crude oil reserves, which places the country 5th in the Asia-Pacific area after China, India, Vietnam and Indonesia, based on data from BP [25]. However, the actual oil reserves in Malaysia might be greater than that, as the data provided by the Malaysia Energy Commission indicates reserves of 5.9 billion barrels [30]. In 2011, the reserve and production ratio of crude oil was 28 years. The crude oil production ongoing trend is shown in Figure 19.
Malaysia has remained a net oil exporter despite the narrowing gap between total exports and imports. Recently, crude oil imports have increased, whereas exports decreased, as shown in Figure 20. Malaysia exports about half of its crude oil production due to the high crude quality (light and sweet, Figure 21) which is attractive to the Asian markets, primarily Australia, India, Thailand and Japan. In return, Malaysia imports heavy sour crude oil for its own refineries because of its lower cost. Malaysia’s crude oil imports mainly comes from the Middle East, primarily Saudi Arabia, United Arab Emirates and Qatar.
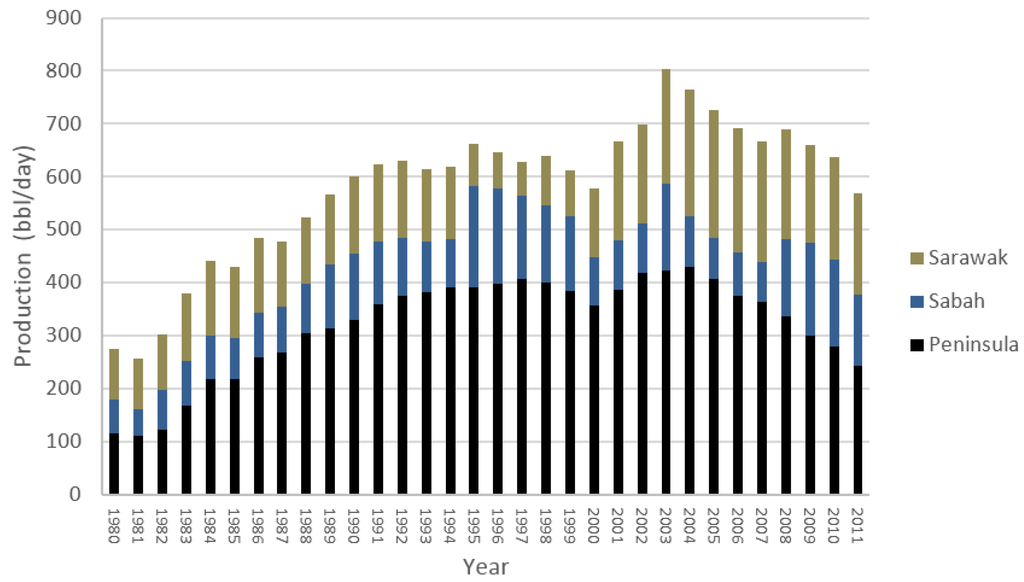
Figure 19.
Crude oil production in Malaysia from 1980 to 2011.
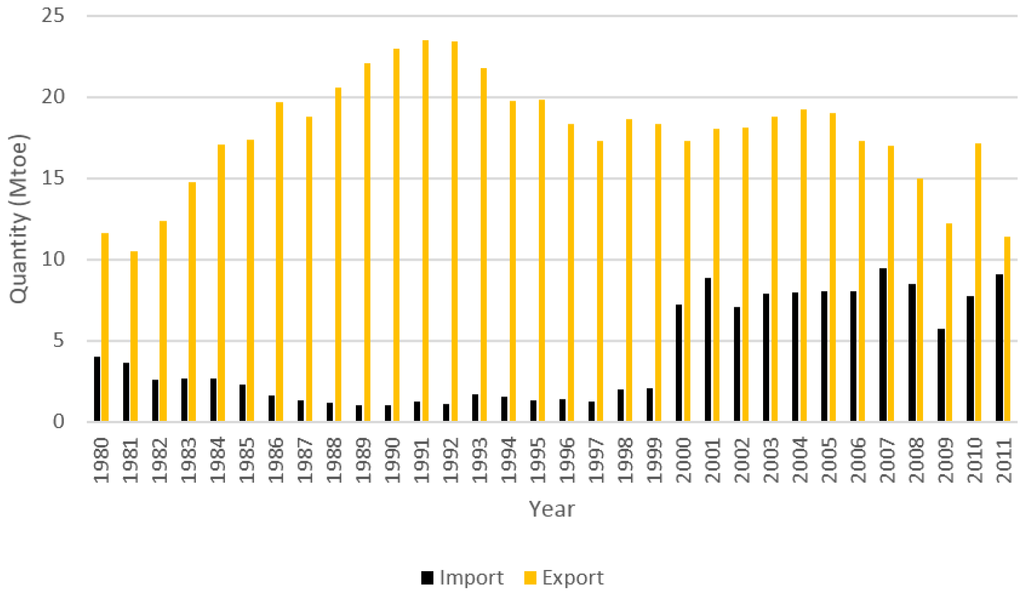
Figure 20.
Crude oil import and export in Malaysia from 1980 to 2011.
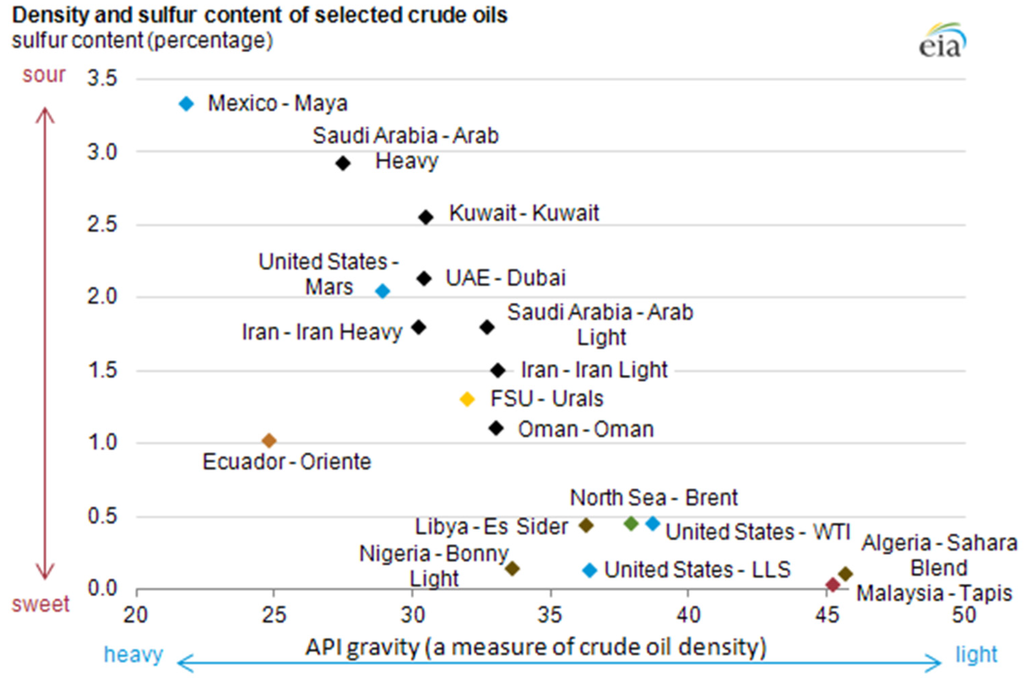
Figure 21.
Density and sulfur content of selected crude oils.
4.2.2. Natural Gas
According to 2011 statistics, Malaysia had proven natural gas reserves of 46.8 Tcf, which are the 5th largest natural gas reserves in the Asia-Pacific area ranking after Australia, China, Indonesia and India, and 21st in the world [25]. The natural gas reserves might actually be greater than that value, as the data provided by Malaysia Energy Commission indicated the amount was 90.0 Tcf [30]. In 2011, the reserves and productions ratio of natural gas was 34 years. The production trend of natural gas [30] is shown in Figure 22.
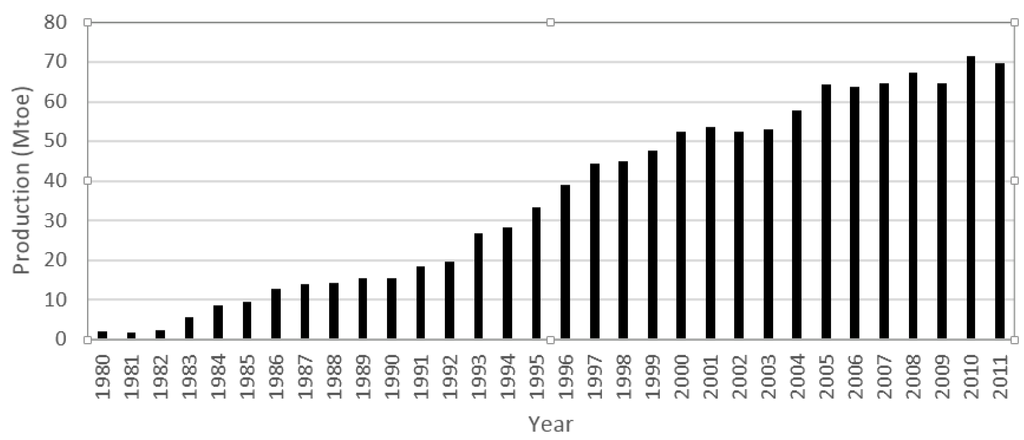
Figure 22.
Natural gas production in Malaysia.
LNG was the main form for natural gas exports in Malaysia in 2011. In 2011, 97% of natural gas was exported through liquefaction, whereas the remainder was transferred via pipelines. The ongoing LNG export trends [30] is given in Figure 23. In 2011, Malaysia was the third-largest LNG exporter, ranking only behind Qatar and Indonesia. In 2011, 36.0 Mtoe natural gas was liquefied. Most of this LNG was exported to Japan, South Korea, Taiwan and China, which contributed 61%, 21%, 12% and 5.5% of LNG export volume [26].
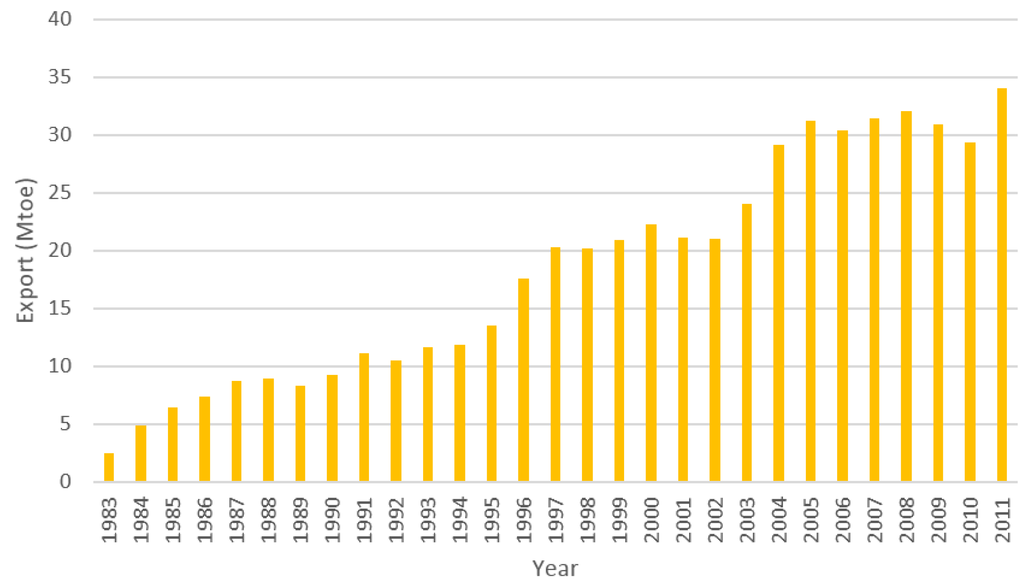
Figure 23.
LNG export in Malaysia from 1983 to 2011.
Although Malaysia is a natural gas exporter, it also imports natural gas (mainly as LNG) for commercial and strategic purposes. Malaysia currently experiences a geographic disparity whereby the the power and industrial sectors are in Peninsular Malaysia, while the gas supply is in East Malaysia which is separated by the South China Sea. In order to meet the needs in Peninsular Malaysia, various regasification terminals are going to set up to secure supply from the global market [31].
4.2.3. Coal
According to the estimates, in 2011, Malaysia had proven coal reserves of 1,938 million tons, 80% of them distributed in Sarawak, 19% in Sabah and 1% in the Malay Peninsula [22]. Most of these coal mines are located in deep mountains, and this makes mining difficult. Therefore, coal demand in Malaysia relies on imports from Indonesia and Australia [16]. In 2011, 92.5% of the coal supply was imported. Generally, coal is used in power plants and cement productions. Figure 24 presents the coal import trends for Malaysia [30].
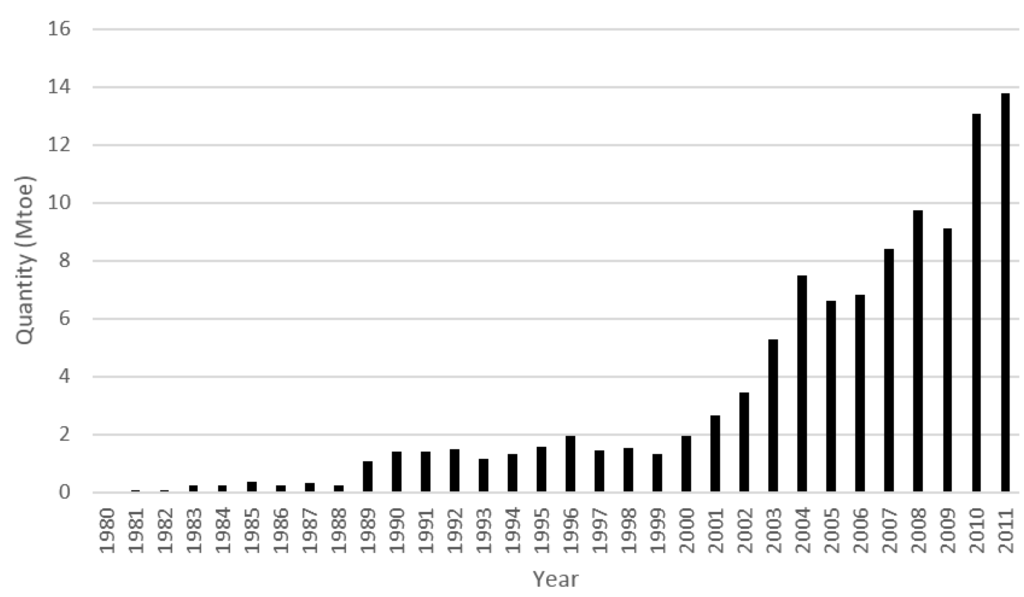
Figure 24.
Coal import in Malaysia from 1980 to 2011 [30].
4.2.4. Renewable Energy
Table 8 summarized the estimation of the renewable energy potential in Malaysia in the long run. Hydropower and solar PV are the suitable renewable energy for Malaysia. However, hydropower is the only renewable energy technology that is commercially viable on a large scale in Malaysia. Despite the large potential, only 3015 MW was utilized in 2011 [22]. This was basically due to the high capital investment required and social-political issues.
Table 8.
Renewable energy potential in Malaysia [5].
| Renewable energy | Potential (MW) |
|---|---|
| Hydropower | 22,000 (20,000 MW in Sarawak [28]) |
| Mini-hydro | 500 |
| Biomass/biogas (oil palm mill waste) | 1300 |
| Municipal solid waste | 400 |
| Solar PV | 6500 |
| Wind | Low wind speed |
4.3. Technology Choice
Although Malaysia has rich fossil fuel resources, Malaysian government are looking forward for more reliable and lower-cost energy sources to satisfy its domestic demand since the oil crisis in the 1970s, especially the fuel for electricity generation and vehicles.
4.3.1. Electricity Generation
Electricity generation is the key transformation sector in Malaysia energy system as the electricity accounted for 45.6% of total end-use energy consumption in Malaysia, and deducting the transportation sector from the end-use sectors, the share of electricity would increase to 67.1% in 2011. Hence, the electricity generation approach has significant impact on Malaysia energy supply structure. Figure 25 shows the fuel consumption trends in electricity generation, where we can clearly observe that the electricity generation structure has experience significant changes twice. First, natural gas replaced 70% of oil products and became the major fuel in power plants; second, coal replaced near half of the natural gas and become the major fuel in electricity generation.
Oil-Fired Power Plants
The depleting reserves and high price of oil have had a significant effect on the role of oil in the energy mix. The National Depletion Policy and National Fuel Diversification Policy were launched to reduce oil exploitation quantity and use in the generation industry [32].
There are only five main oil-fired power plants in Malaysia, and four of them are located in Sabah [33]. Small diesel engine power plants are usually used in hospitals and other sectors as backup electricity supply. In 2011, oil products contributed only 8.9% to electricity generation.
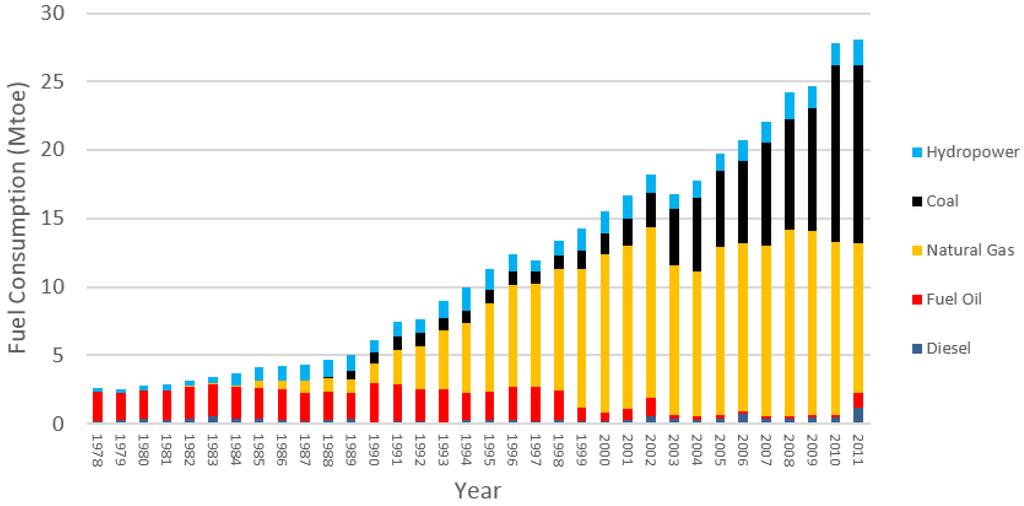
Figure 25.
Fuel consumption in electricity generation in Malaysia.
Gas-fired Power Plants
Natural gas contributed 42.3% of the electricity supply in 2011. Since 1986, the share of natural gas in generation has increased rapidly to 75% in 2000 due to its low price and stable supply. The share of natural gas decreased starting with the operation of the coal-fired power plants in 2000. Although Malaysia has rich natural gas reserves, the government started to reduce the natural gas share of generation because of the depletion of natural gas and national energy security. The share of natural gas in generation has been estimated as decreasing to 35% in 2030 as coal and hydropower become main fuels in future power plants.
Coal-fired Power Plants
Coal is the cheapest and most abundant available fossil fuel and plays an important role in the national energy mix of China and the United States. Since 1990, coal-fired began to contribute a small amount to the energy mix in Malaysia. In 2011, the ratio of coal-fired power had increased to 42.8%.
Coal will be the main fuel for power plants in the next 20 years in Malaysia. There were a series of plans generated to set up coal-fired power plants in the Malay Peninsula and East Malaysia. A total of 2,000 MW of supercritical coal-fired capacity will be installed at Manjung and Tanjung Bin by 2016. In addition, Malaysia has issued bids for companies to build another 3,000 MW of coal-fired capacity in two projects on the Malay Peninsula by 2019. Five coal-fired power plants will also be built in the future for a total capacity of 2,400 MW. The first plants are scheduled to commence operations in 2016 [26].
Hydropower Power Plants
According to the Sarawak Corridor of Renewable Energy (SCORE) Plan, hydropower capacity will be increased to 3,500 MW by 2015, 7,700 MW by 2020, and 20,000 MW by 2030 [5,28]. Sarawak will export approximately 5,000 MW of power in the medium term to the Malay Peninsula via 500 kV high-voltage direct current overhead (1,000 km) and undersea cables (650 km) by 2020 and an additional 5,000 MW by 2030. Thus, the hydropower share will increase from 5% to 35% in 2030, whereas the share from gas-fired plants will decrease from 60% to 30% [16].
Nuclear Power Plants
Although Malaysia has established a nuclear agency and has periodically reviewed the nuclear option, as of 2013 there are no nuclear power generation plants and plans for a nuclear plant are at the feasibility stage. If plans went ahead, construction would not begin before 2021 [34]. The Malaysian government is seriously suggesting nuclear power as Malaysia’s sixth energy mix component. However, this suggestion has been objected to by the parliamentary opposition and their supporters, considering the Fukushima nuclear crisis in 2011.
4.3.2. Oil Refining
There are six refineries in Malaysia, which have a capacity to process 494,000 bbl/d of crude oil [35] (Table 9). The information on these refineries is provided below. The ongoing refinery production trends and structure [30] were also provided in Figure 26. Petrol and diesel were the most important oil products in Malaysian energy consumption, especially in the transportation sector.
Table 9.
List of refineries in Malaysia.
| Refinery | Ownership | Capacity |
|---|---|---|
| Melaka I refinery | PETRONAS | 93,000 bbl/d |
| Melaka II refinery | PETRONAS, ConocoPhillips | 126,000 bbl/d |
| Kertih refinery | PETRONAS | 40,000 bbl/d |
| Port Dickson refinery | Royal Dutch Shell | 125,000 bbl/d |
| Petron Port Dickson refinery | Petron | 86,000 bbl/d |
| Kemaman Bitumen refinery | TIPCO | 24,000 bbl/d |
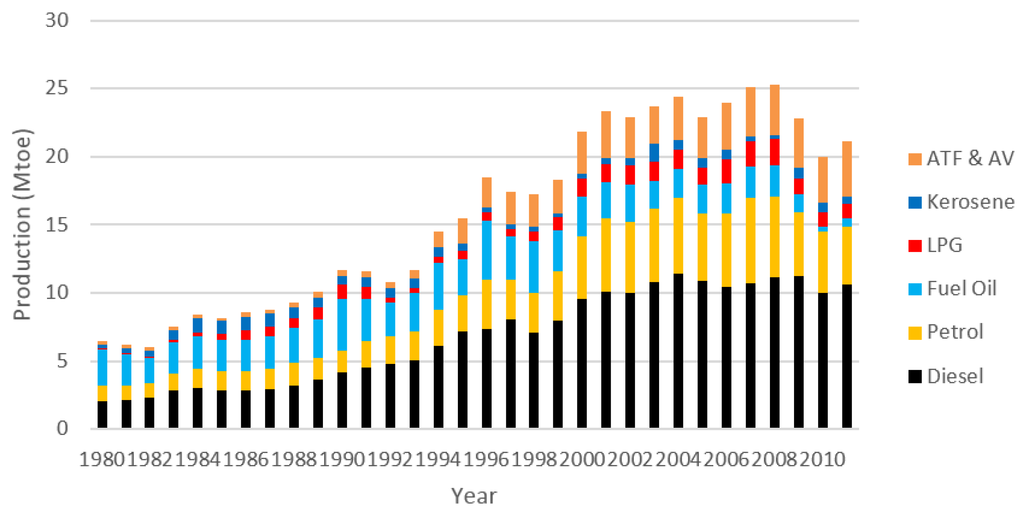
Figure 26.
Oil production in Malaysia from 1980 to 2011.
The ongoing petrol and diesel import and export trends [30] are also given in Figure 27 and Figure 28. The gaps between imports and exports show that Malaysia is a net diesel exporter and net petrol importer, in which more than half of the petrol supply relied on imports.
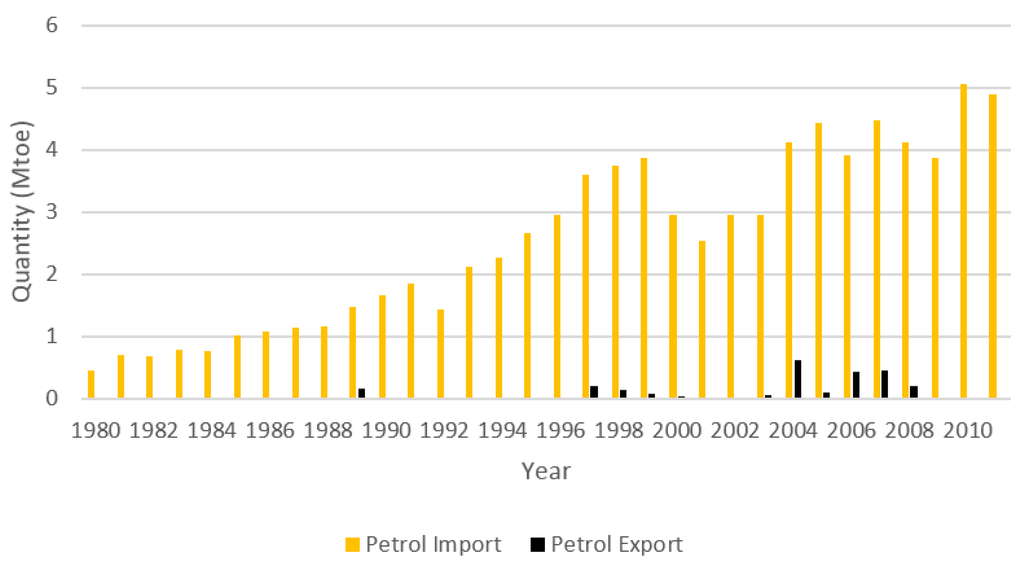
Figure 27.
Petrol import and export in Malaysia.
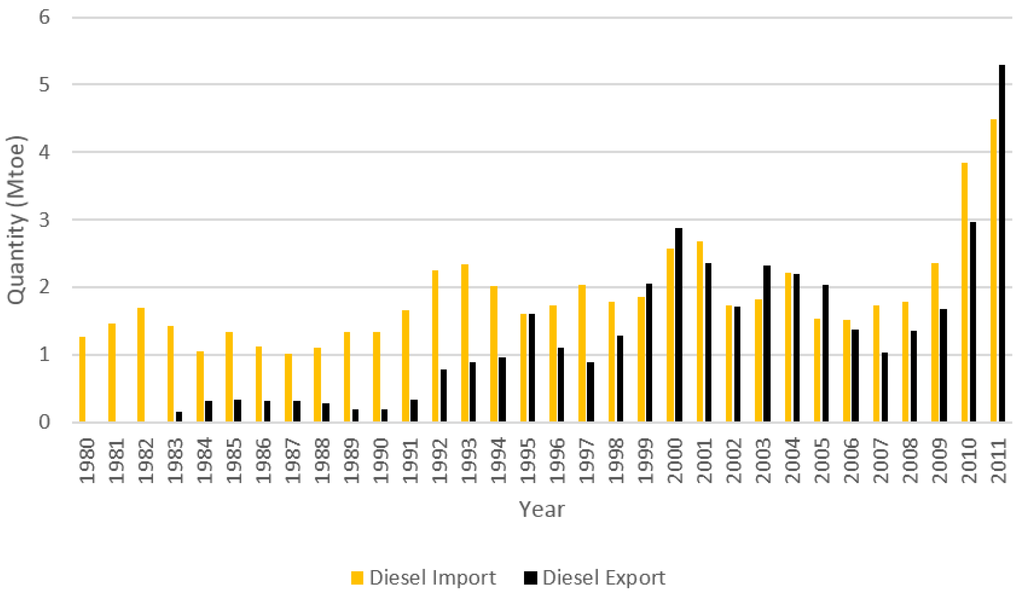
Figure 28.
Diesel import and export in Malaysia.
After relying on refineries in Singapore, Malaysia invested heavily in refining activities and now able to meet its domestic demand for oil products. A major Refining and Petrochemicals Integrated Development (RAPID) project has been introduced under the Economic Transformation Plan, which includes a 300,000 bbl/d refinery located in Johor state. RAPID aims at building a world-scale integrated refinery and petrochemical complex. The proposed refinery will have a capacity of 300,000 barrels per standard day and will supply naphtha and liquid petroleum gas feedstock for the RAPID petrochemical complex, as well as produce gasoline and diesel that meet European specifications [36]. Through this project, Malaysia is expected to turn into a net oil products importer in 2017. Besides, the Sabah Oil and Gas Terminal with a 300,000 bbl/d refinery will receive, store and export crude oil under the Sabah-Sarawak Integrated Oil & Gas Project, as well as receive, process, compress and transport the gas produced from the fields offshore Sabah, and can be operated in 2014 [37,38].
4.3.3. Biodiesel
Biodiesel is defined as a clean-burning alternative to diesel fuel. The quality standards and fuel properties of biodiesel may differ in each country due to its geographical location, nature of its feedstock and the production technology available locally. Currently, many countries around the world have explored and commercially used biodiesel as an alternative liquid fuel to vehicle. Considering these factors, biodiesel production in Malaysia mainly utilizes palm oil as primary oil on the basis of the availability of this feedstock, low price and desirable characteristics of the oil [39]. To popularize biodiesel, Malaysian government launched National Biofuel policy in 2006 and complemented it with Malaysian Biofuel Industry Act in 2007. The summary of the policy is summarized in Table 10. The implementation of B5 and B10 biodiesel will contribute to reductions in fossil fuel consumption and emission level which is in line with the global efforts to reduce the GHG emission [40]. However, biodiesel production is facing several issues and challenges like tough global competition, feedstock issue, food versus fuel war, sustainability, and limited land for use and deforestation. In current situation, Malaysia is overcome all the challenges and issues, and is far ahead in the development of palm biodiesel compared to all the other countries in the race with current available infrastructure, feedstock reserve and technological balance [41].
Table 10.
A summary of the short, medium and long term of the national biofuels policy [42].
| National biofuels policy | |
|---|---|
| Short-term plan | Establish Malaysian standard specifications for the B5 biodiesel; Participate in B5 biodiesel trials by selected government departments with their fleets of diesel vehicles; Establish B5 biodiesel pumps for the public at selected stations; Voluntary trials on B5 biodiesel by the Malaysian Palm Oil Board for selected users in the industrial sector; Promote awareness to educate the public on the use of B5 biodiesel. |
| Medium-term plan | Establish Malaysian standard specifications for palm oil-based methyl ester for domestic use and export; Engage engine manufacturers to extend warranties to include the use of B5 diesel; Conduct extensive B5 testing to facilitate granting of such engine warranties; Pass and enforce legislation to mandate use of B5 diesel; Encourage establishment of commercial methyl ester plants. The MPOB will act as catalyst by pioneering the establishment of palm biodiesel plants in Malaysia in collaboration with the private sector. |
| Long-term plan | Gradually increase the proportion of palm oil in the diesel blend; Promote greater uptake of biofuels technology by Malaysian companies and foreign companies abroad. |
4.4. Policy Adjustment
Since independence, the Malaysian government has launched numerous energy-related policies and enacted some energy-related acts in order to ensure the long-term reliability and stable energy supply for the sustainable social-economic development of Malaysia. Most of the energy policies had significant impacts on Malaysia energy system, both in energy supply, transformation and end-use sectors.
4.4.1. Policy Adjustment in the History
The transition of energy policies and acts of Malaysia can be classified into three stage which emphasized on different aspects: (1) Diversification of fossil fuel supplies; (2) Introduction of renewable energy and (3) Promotion of green technology.
Diversification of fossil fuel
In 1974, the Malaysian government enacted the Petroleum Development Act to provide for exploration and exploitation of petroleum whether onshore or offshore by PETRONAS, the state-owned oil and gas company, in which the entire ownership of and the exclusive rights, powers, liberties and privileges in respect of the said petroleum, and the control of carrying out downstream activities and development relating to petroleum and its products will be vested [43]. In second year, the Malaysian government launched the National Petroleum Policy to regulate the oil and gas industry to achieve the country’s economic needs [44]. The two oil crisis in 1970s has caused serious negative impacts on Malaysia’s economic development and alerted the Malaysian government to care about energy security. As a result, the Malaysian government launched the National Energy Policy in 1979 [45] to ensure the stability of energy supplies, which is the guideline for the energy policy in future based on three principal energy objectives, namely:
- (1)
- The Supply Objective, to ensure adequate, secure and cost-effective energy supply through developing and utilizing alternative sources of energy (both non-renewable and renewable) from within and outside the country;
- (2)
- The Utilization Objective, to promote efficient utilization of energy and discourage wasteful and non-productive patterns of energy consumption;
- (3)
- The Environmental Objective, to minimize the negative environmental impacts on the energy supply chain i.e., energy production, conservation, transportation and utilization.
To achieve the supply objective in the National Energy Policy, the National Depletion Policy was launched in 1980 aimed at safeguarding the country’s finite and non-renewable petroleum resources from over-exploitation [46]. Production control was enforced on major oilfields of over 400 million barrels of oil initially in place (OIIP) to a conservative 1.75% of OIIP that subsequently was revised to 3% in 1985.
In 1981, the Four-Fuels Diversification Policy was introduced. It is designed to reduce over-dependence on oil as the main energy source, and replace oil with natural gas, coal and hydro [46]. As a result of this energy diversification policy, the proportion of oil products in electricity generation was replaced by natural gas after 1980, and the proportion of natural gas was replaced by coal after 2000, as shown in Figure 29.
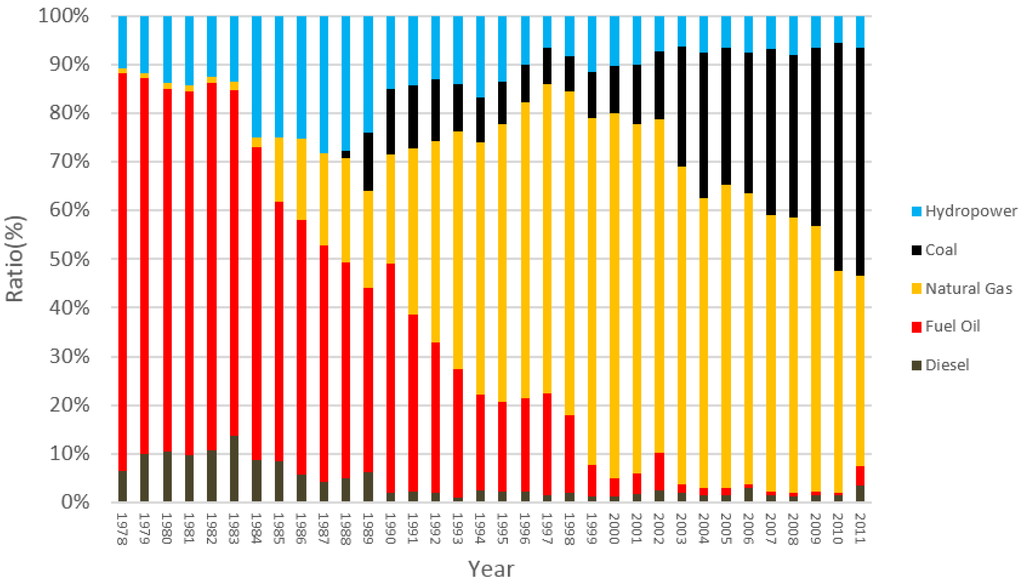
Figure 29.
The structure of fuel consumption in Malaysia’s power plants from 1978 to 2011.
Introduction of renewable energy
Considering the climate changes and pollution issues, renewable energy was considered as the fifth energy in Malaysia energy mix under the Fifth Fuel Policy which was launched in 2000 [46]. Renewable energy was planned to be a significant contributor of the country’s total electricity supply. Greater efforts have been undertaken to encourage the utilization of renewable resources, including biomass, biogas, solar and small hydropower [47]. However, the development of renewable energy in Malaysia is rather slow and is still in the infant stage [48]. As a result, the Malaysian government launched the National Renewable Energy Policy in 2010 after analyzing the problems caused previous failures. The policy included a comprehensive roadmap of Malaysian renewable energy development [49]. Table 11 and Table 12 list the policy targets of the installation capacity and electricity generation for renewable energy in Malaysia.
Table 11.
Policy target of installed capacity of renewable power in Malaysia.
| Year | Renewable energy installation capacity (MW) | Share in electricity generation capacity | |||||
|---|---|---|---|---|---|---|---|
| Biomass | Biogas | Small-hydropower | Solar PV | Solid waste | Total | ||
| 2015 | 330 | 100 | 290 | 55 | 200 | 975 | 6% |
| 2020 | 800 | 240 | 490 | 175 | 360 | 2065 | 10% |
| 2030 | 1340 | 410 | 490 | 854 | 390 | 3484 | 13% |
| 2050 | 1340 | 410 | 490 | 8874 | 430 | 11,544 | 34% |
Table 12.
Policy target of electricity generation from renewable energy in Malaysia (The electricity generation value are in the SQ form).
| Year | Annual electricity generation (Mtoe) | |||||
|---|---|---|---|---|---|---|
| Biomass | Biogas | Small-hydropower | Solar PV | Solid waste | Total | |
| 2015 | 2024 | 613 | 1450 | 61 | 1223 | 5374 |
| 2020 | 4906 | 1472 | 2450 | 194 | 2208 | 11,229 |
| 2030 | 8217 | 2514 | 2450 | 1019 | 2392 | 16,592 |
| 2050 | 8271 | 2514 | 2450 | 13,540 | 2637 | 29,358 |
Biodiesel was identified as one of the potential renewable energy sources for vehicle fuel, and based on the Fifth Fuel Policy, the government of Malaysia has launched the National Biofuel Policy [50] in 2006 to encourage the use of environmentally friendly, sustainable and viable sources of biomass energy. The major highlights of this policy is the production of a biodiesel fuel blend of 5% processed palm oil with 95% petroleum diesel.
Promotion of green technology
In 2009, Malaysian government launched the National Green Technology Policy [51] to provide direction and motivation for Malaysians to continuously enjoy good quality of life and a healthy environment. The National Green Technology Policy is built on four pillars: (1) Energy; (2) Environment; (3) Economy and (4) Social. In which energy pillar emphasized on seeking to attain energy independence and promoting efficient utilization.
This policy consists of five objectives as follows: (1) To minimize growth of energy consumption while enhancing economic development; (2) To facilitate the growth of the Green Technology industry and enhance its contribution to the national economy; (3) To increase national capability and capacity for innovation in Green Technology development and enhance Malaysia’s competitiveness in Green Technology in the global arena; (4) To ensure sustainable development and conserve the environment for future generations; and (5) To enhance public education and awareness on Green Technology and encourage its widespread use.
4.4.2. Facing the Challenge of Global Climate Change
Climate change is the change in climate caused by the increasing greenhouse effect. Energy-related carbon dioxide (CO2) emissions are the majority of global greenhouse gas (GHG) emissions [52]. The fight against climate change has become a defining feature in energy policy-making. As a developing country, Malaysia has no quantitative commitments under the Kyoto Protocol at present. However, together with all other countries, Malaysia is already committed under the United Nations Conference on Environment and Development (UNFCCC) and has ratified the Kyoto Protocol [53]. During the Fifteenth session of the Conference of the Parties under UNFCCC (COP 15) in December 2009 at Copenhagen, the Prime Minister of Malaysia announced that Malaysia is adopting an indicator of a voluntary reduction of up to 40 percent in terms of emissions intensity of gross domestic product (GDP) by the year 2020 compared to 2005 levels [53,54].
However, there are three major challenges for Malaysian government to face the challenge of global climate change, as follows:
(1) Increasing the coal proportion in electricity generation
Although Malaysia has successfully changed its energy supply structure through introducing coal as a major fuel in electricity generation since 2000 to ensure Malaysia’s energy security, more carbon dioxide emission have occurred compared with gas-fired plants. Currently, coal-fired plants contribute near half of the electricity generation of Malaysia.
(2) Undeveloped renewable energy
In 2000, renewable energy was announced by the Malaysian government as the 5th fuel in the energy supply mix after natural gas, crude oil, coal and hydropower. Renewable energy was planned to be a significant contributor of the country’s total electricity supply. Greater efforts have been undertaken to encourage the utilization of renewable resources, including biomass, biogas, solar and small hydropower [47]. However, it did not promote renewable energy utilization in Malaysia very successfully.
(3) Low energy price in the end-use sector
The high subsidies given by the Malaysian government for electricity generation and vehicle fuels have already delayed the development of renewable energy. The lower price of fossil fuel made it more attractive to Malaysians, and this has also caused Malaysians to be lacking in energy-saving awareness. Although the Malaysian government is going to reduce the subsidy in a stepwise fashion, some Malaysians still oppose the policy adjustment.
To address the challenge of global climate change, the Malaysian government should further take a series of necessary countermeasures. Especially, while Malaysia is becoming a high-income country, the subsidy for fossil fuel energy especially in electricity generation and vehicle fuels should be reduced gradually. The current ruling party should negotiate with the opposition parties to plan a long-term plan to reduce the energy subsidies to reduce the expenditure, and increase the fiscal budget for the development of renewable energy and green technology and the improvement of energy efficiency. At the same time, the Malaysian government should also carefully control the development of coal-fired power generation.
5. Conclusions and Suggestions
In this work, a comprehensive description of Malaysia’s energy use was presented by mapping energy flow Sankey diagrams and analyzing ongoing trends of main factors influencing these energy flows. According to the results, currently Malaysia is a net energy exporter, and crude oil and natural gas are the main exports. Most of the natural gas was exported in LNG form. Coal and oil products are the main imports. The vast majority of the coal supply in Malaysia is imported. The lack of refineries also has required many petrol imports to satisfy domestic needs. Coal, natural gas, oil products and hydropower are the main fuels used for electricity generation. Electricity, oil products especially petrol and diesel, natural gas and coal were the main energy forms in the end-use sectors. The shares of the industrial, transportation and domestic sectors are almost the same, accounting for approximately one-third of the energy consumption in Malaysia.
In the past, Malaysia has successfully optimized its energy structure to ensure energy security. In 1980, Malaysia’s government launched the National Diversification Policy to reduce oil product consumption in electricity generation and replace it with natural gas, coal and hydropower. The share of oil products decreased from 88% to 10% by 2000, whereas the share of natural gas increased from 1% to 75%. After 2000, the share of coal-fired increased from 10% to 47% in 2011, and the share of natural gas and oil products decreased to 39% and 7%, respectively. In 2011, hydropower contributed to 7% of electricity generation. However, except for hydropower, there is no renewable energy form that is large enough to be illustrated in the energy Sankey diagram.
For a sustainable development in the long term, the Malaysian government has launched a series of plans to encourage the utilization of renewable energy. It is expected that by 2050 renewable energy will contribute 56% of electricity generation, whereas 43% will be contributed by large hydropower. However, the development of renewable energy has been much slower than expected. In addition, Malaysians still lack of energy conservation awareness because of the low energy prices. To address the challenge of global climate change, more emphasis must be placed on the utilization of renewable energy, green technology and energy conservation in Malaysia, and the energy subsidy for fossil fuel must be gradually reduced.
The lack of energy data and information in Malaysia were the main difficulties in completing this study. Although the energy balance was given, more detailed data are difficult to obtain because of the lack of consistent data standards in the various departments. More attention to data statistics and data publicity is requited to encourage more studies on Malaysia’s energy system in the future.
Acknowledgments
The authors gratefully acknowledge the financial support from the BP Company in the context of the Phase II Collaboration between BP and Tsinghua University.
Author Contributions
Chinhao Chong coordinated the main theme of this paper and wrote this manuscript. Linwei Ma and Pei Liu discussed the research results and commented on the manuscript. Final review was done by Weidou Ni and Zheng Li. All the authors read and approved the final manuscript.
Abbreviations
| AV | Aviation fuel |
| ATF | Aviation Turbine Fuel |
| bbl/d | barrel per day |
| GPP | Gas Processing Plant |
| LNG | Liquefied Natural Gas |
| LPG | Liquefied Petroleum Gas |
| MDS | Middle Distillate Synthesis |
| MMscfd | Metric million standard cubic feet per day |
| Mtoe | Million ton of oil equivalent |
| PEQ | Primary Energy Quantity |
| SQ | Standard Quantity |
| Tcf | Trillion cubic feet |
Conflicts of Interest
The authors declare no conflict of interest.
References
- Malaysia Government. Statistical Handbook Malaysia 2013; Department of Statistics: Kuala Lumpur, Malaysia, 2014.
- Malaysia Overview. Available online: http://www.worldbank.org/en/country/malaysia/overview (accessed on 21 November 2014).
- Wawasan 2020. Available online: http://www.epu.gov.my/wawasan-2020-1991-2020 (accessed on 21 November 2014).
- Malaysia’s Transformation. Available online: http://etp.pemandu.gov.my/Invest_In_Malaysia-@-Malaysia’s_Transformation.aspx (accessed on 21 November 2014).
- Ong, H.C.; Mahlia, T.M.I.; Masjuki, H.H. A review on energy scenario and sustainable energy in Malaysia. Renew. Sustain. Energy Rev. 2011, 15, 639–647. [Google Scholar] [CrossRef]
- Rahim, K.A.; Liwan, A. Oil and gas trends and implications in Malaysia. Energy Policy 2012, 50, 262–271. [Google Scholar] [CrossRef]
- Gan, P.Y.; Komiyama, R.; Li, Z. A low carbon society outlook for Malaysia to 2035. Renew. Sustain. Energy Rev. 2013, 21, 432–443. [Google Scholar] [CrossRef]
- Ali, R.; Daut, I.; Taib, S. A review on existing and future energy sources for electrical power generation in Malaysia. Renew. Sustain. Energy Rev. 2012, 16, 4047–4055. [Google Scholar] [CrossRef]
- Shekarchian, M.; Moghavvemi, M.; Mahlia, T.M.I.; Mazandarani, A. A review on the pattern of electricity generation and emission in Malaysia from 1976 to 2008. Renew. Sustain. Energy Rev. 2011, 15, 2629–2642. [Google Scholar] [CrossRef]
- Ahamed, J.U.; Saidur, R.; Masjuki, H.H.; Mekhilef, S.; Ali, M.B.; Furqon, M.H. An application of energy and exergy analysis in agricultural sector of Malaysia. Energy Policy 2011, 39, 7922–7929. [Google Scholar] [CrossRef]
- Saidur, R.; Masjuki, H.H.; Jamaluddin, M.Y. An application of energy and exergy analysis in residential sector of Malaysia. Energy Policy 2007, 35, 1050–1063. [Google Scholar] [CrossRef]
- Saidur, R.; Sattar, M.A.; Masjuki, H.H.; Abdessalam, H.; Shahruan, B.S. Energy and exergy analysis at the utility and commercial sectors of Malaysia. Energy Policy 2007, 35, 1956–1966. [Google Scholar] [CrossRef]
- Saidur, R.; Sattar, M.A.; Masjuki, H.H.; Ahmed, S.; Hashim, U. An estimation of the energy and exergy efficiencies for the energy resources consumption in the transportation sector in Malaysia. Energy Policy 2007, 35, 4018–4026. [Google Scholar] [CrossRef]
- BoroumandJazi, G.; Rismanchi, B.; Saidur, R. A review on exergy analysis of industrial sector. Renew. Sustain. Energy Rev. 2013, 27, 198–203. [Google Scholar] [CrossRef]
- Chua, S.C.; Oh, T.H. Review on Malaysia’s national energy developments: Key policies, agencies, programmes and international involvements. Renew. Sustain. Energy Rev. 2010, 14, 2916–2925. [Google Scholar] [CrossRef]
- Oh, T.H.; Pang, S.Y.; Chua, S.C. Energy policy and alternative energy in Malaysia: Issues and challenges for sustainable growth. Renew. Sustain. Energy Rev. 2010, 14, 1241–1252. [Google Scholar] [CrossRef]
- Ma, L.W.; Fu, F.; Li, Z.; Liu, P. Oil development in China: Current status and future trends. Energy Policy 2012, 45, 43–53. [Google Scholar] [CrossRef]
- Schmidt, M. The Sankey diagram in energy and material flow management. J. Ind. Ecol. 2008, 12, 82–94. [Google Scholar] [CrossRef]
- Cullen, J.M.; Allwood, J.M. The efficient use of energy: Tracing the global flow of energy from fuel to service. Energy Policy 2010, 38, 75–81. [Google Scholar] [CrossRef]
- Ma, L.W.; Allwood, J.M.; Cullen, J.M.; Li, Z. The use of energy in China: Tracing the flow of energy from primary source to demand drivers. Energy 2012, 40, 174–188. [Google Scholar] [CrossRef]
- Chong, C.H.; Ma, L.W.; Li, Z.; Geng, J.; Zhang, T.K. A programmed data-processing method for mapping energy allocation sankey diagram of China. In Proceedings of the 2014 International Conference on Power and Energy, Shanghai, China, 29 November 2014.
- Malaysia Energy Commission. Malaysia National Energy Balance 2011; Suruhanjaya Tenaga Malaysia: Putrajaya, Malaysia, 2013. [Google Scholar]
- Van den Akker, J. Malaysian Energy Effiency Improvement Programme. Available online: http://www.my.undp.org/content/malaysia/en/home/operations/projects/environment_and_energy/13472_EnergyEfficiency.html (accessed on 22 November 2014).
- Kennedy, S.; Ahamad, F. Estimating the impact of vehicle modification costs on the demand for biofuels in Malaysia. Energy Sustain. Dev. 2007, 11, 67–76. [Google Scholar] [CrossRef]
- British Petroleum. Bp Statistical Review of World Energy. June 2014. Available online: http://www.bp.com/content/dam/bp/pdf/Energy-economics/statistical-review-2014/BP-statistical-review-of-world-energy-2014-full-report.pdf (accessed on 22 November 2014).
- An Overview Report of Malaysia Energy System. Available online: http://www.eia.gov/countries/cab.cfm?fips=MY (accessed on 22 November 2014).
- LNG Shipping of Misc Berhad. Available online: http://www.misc.com.my/LNG_Shipping-@-LNG_Shipping.aspx (accessed on 22 November 2014).
- Sovacool, B.K.; Bulan, L.C. Energy security and hydropower development in Malaysia: The drivers and challenges facing the Sarawak corridor of renewable energy (score). Renew. Energy 2012, 40, 113–129. [Google Scholar] [CrossRef]
- Worldbank. East Asia and the Pacific Country Forecasts. Available online: http://www.worldbank.org/en/publication/global-economic-prospects/regional-outlooks/eap#5 (accessed on 24 February 2015).
- Malaysia Energy Commission. Malaysia Energy Information Hub Statistics Online Database; Malaysia Energy Commission: Putrajaya, Malaysia, 2013. [Google Scholar]
- Energy Information Administration. An Overview Report of Malaysia Energy System. Available online: http://www.eia.gov/countries/cab.cfm?fips=my (accessed on 24 November 2014).
- Energy Supply Objective of Malaysia. Available online: http://www.kettha.gov.my/en/content/supply-objective (accessed on 24 February 2015).
- List of Power Stations in Malaysia. Available online: http://en.wikipedia.org/wiki/List_of_power_stations_in_Malaysia (accessed on 24 February 2015).
- Today, F.M. Official: Nuclear Power Plan Delayed. Available online: http://www.freemalaysiatoday.com/category/nation/2013/01/15/official-nuclear-power-plan-delayed/ (accessed on 24 December 2014).
- Oil Refineries in Malaysia. Available online: http://en.wikipedia.org/wiki/List_of_oil_refineries#Malaysia (accessed on 24 November 2014).
- EPCengineer. Refinery and Petrochemicals Integrated Development (Rapid) Project. Available online: http://www.epcengineer.com/projects/details/2342/refinery-and-petrochemicals-integrated-development-rapid-project (accessed on 24 November 2014).
- Petronas. Sabah-Sarawak Integrated Oil & Gas Project. Available online: http://www.petronas.com.my/our-business/gas-power/gas-processing-transmission/Pages/gas-processing-transmission/sabah-sarawak-integrated-oil-gas-project.aspx (accessed on 24 November 2014).
- New Sabah Times. SOGT to be Fully Operational in April. Available online: http://www.newsabahtimes.com.my/nstweb/fullstory/73798 (accessed on 24 November 2014).
- Johari, A.; Nyakuma, B.B.; Mohd Nor, S.H.; Mat, R.; Hashim, H.; Ahmad, A.; Yamani Zakaria, Z.; Tuan Abdullah, T.A. The challenges and prospects of palm oil based biodiesel in Malaysia. Energy 2015, 81, 255–261. [Google Scholar] [CrossRef]
- Yusoff, M.H.M.; Abdullah, A.Z.; Sultana, S.; Ahmad, M. Prospects and current status of B5 biodiesel implementation in Malaysia. Energy Policy 2013, 62, 456–462. [Google Scholar] [CrossRef]
- Mekhilef, S.; Siga, S.; Saidur, R. A review on palm oil biodiesel as a source of renewable fuel. Renew. Sustain. Energy Rev. 2011, 15, 1937–1949. [Google Scholar] [CrossRef]
- Abdul-Manan, A.F.N.; Baharuddin, A.; Chang, L.W. A detailed survey of the palm and biodiesel industry landscape in Malaysia. Energy 2014, 76, 931–941. [Google Scholar] [CrossRef]
- Attorney General's Chambers of Malaysia. Petroleum Development Act 1974. http://www.agc.gov.my/Akta/Vol.%203/Act%20144.pdf (accessed on 24 November 2014).
- Malaysia Government. National Petroleum Policy 1975. Available online: http://kettha.gov.my/portal/index.php?r=kandungan/index&menu1_id=2&menu2_id=26&menu3_id=111#.VNyczfmUf84 (accessed on 24 November 2014).
- National Energy Policy. Available online: http://kettha.gov.my/portal/index.php?r=kandungan/index&menu1_id=2&menu2_id=26&menu3_id=110#.VNydjPmUf84 (accessed on 24 November 2014).
- Academy of Sciences Malaysia. Sustainable Energy Options for Electric Power Generation in Peninsular Malaysia to 2030; Perpustakaan Negara Malaysia: Kuala Lumpur, Malaysia, 2013. [Google Scholar]
- Hashim, H.; Ho, W.S. Renewable energy policies and initiatives for a sustainable energy future in Malaysia. Renew. Sustain. Energy Rev. 2011, 15, 4780–4787. [Google Scholar] [CrossRef]
- Mekhilef, S.; Barimani, M.; Safari, A.; Salam, Z. Malaysia’s renewable energy policies and programs with green aspects. Renew. Sustain. Energy Rev. 2014, 40, 497–504. [Google Scholar] [CrossRef]
- Ministry of Energy, Green Technology and Water of Malaysia. National Renewable Energy Policy & Action Plan; Ministry of Energy, Green Technology and Water of Malaysia: Putrajaya, Malaysia, 2009.
- National Biofuel Policy. Available online: http://www.greentechmalaysia.my/Pages/pages.aspx?View=GreenBiofuel (accessed on 24 November 2014).
- Malaysia Government. National Green Technology Policy; Ministry of Energy, Green Technology and Water: Putrajaya, Malaysia, 2009.
- International Energy Agency. Climate Change. Available online: http://www.iea.org/topics/climatechange/ (accessed on 24 November 2014).
- Available online: http://cetdem.org.my/wordpress/?page_id=9 (accessed on 24 November 2014).
- BERNAMA. Malaysia announces conditional 40 percent cut in emissions. Available online: http://ww2.utusan.com.my/utusan/special.asp?pr=theMessenger&y=2009&dt=1218&pub=theMessenger&sec=Home_News&pg=hn_09.htm (accessed on 24 November 2014).
© 2015 by the authors; licensee MDPI, Basel, Switzerland. This article is an open access article distributed under the terms and conditions of the Creative Commons Attribution license (http://creativecommons.org/licenses/by/4.0/).