Abstract
A multi-pulse injection strategy for premixed charge compression ignition (PCCI) combustion was investigated in a four-valve, direct-injection diesel engine by a computational fluid dynamics (CFD) simulation using KIVA-3V code coupled with detailed chemistry. The effects of fuel splitting proportion, injection timing, spray angles, and injection velocity were examined. The mixing process and formation of soot and nitrogen oxide (NOx) emissions were investigated as the focus of the research. The results show that the fuel splitting proportion and the injection timing impacted the combustion and emissions significantly due to the considerable changes of the mixing process and fuel distribution in the cylinder. While the spray, inclusion angle and injection velocity at the injector exit, can be adjusted to improve mixing, combustion and emissions, appropriate injection timing and fuel splitting proportion must be jointly considered for optimum combustion performance.
1. Introduction
Plenty of studies [1,2,3,4] have demonstrated that the Premixed Charge Compression Ignition (PCCI) combustion strategy can be a practical solution to meet the increasingly stringent emission regulations due to its potential for suppressing the formation of nitrogen oxides (NOx) and soot simultaneously. Premixed combustion with a long ignition delay allows sufficient time for the formation of a uniform mixture before the start of combustion. Low soot emission is then achieved as local rich regions are avoided. Utilizing a high level of Exhaust Gas Recirculation (EGR), the combustion can be performed under low temperature conditions, which are below the NOx formation region. Representative research about the effects of equivalence ratio (Ф) and temperature (T) on the formation of NOx and soot was introduced by Kamimoto [5]. Based on his studies, Sun [6] placed the PCCI, Homogeneous Charge Compression Ignition (HCCI), and traditional diesel operating regimes on the Ф-T chart, as shown in Figure 1.
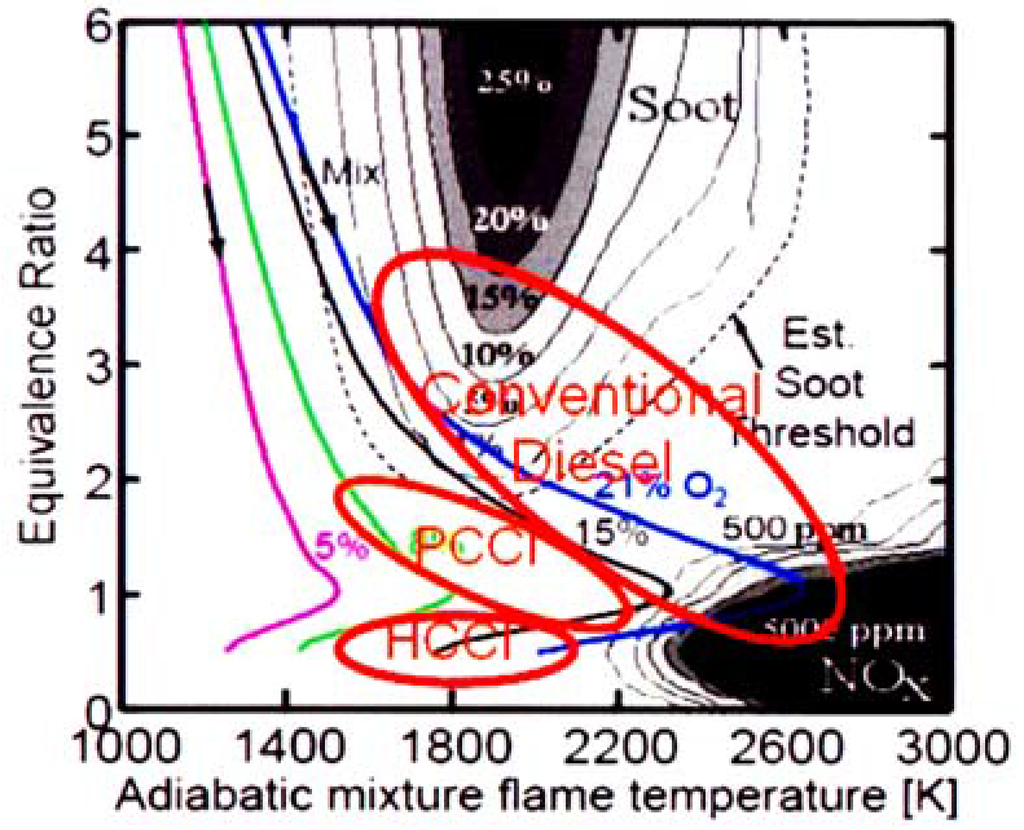
Figure 1.
Diesel combustion strategies in Ф-T space [6].
To realize PCCI combustion, early injection is usually utilized in order to obtain a premixed fuel-air mixture before ignition. Lee and Reitz [7] have shown some characteristics of the PCCI engine with single injection. Their results demonstrated the combustion performance and emissions are strongly affected by the injection timing. Their research also indicated that spray targeting angle in the cylinders directly impacted the formation of pollutants. In their opinion, the injection timing alone could not explain the emissions for PCCI, but rather must be combined with spray factors, like inclusion angle. As a result of their research, the optimum PCCI combustion through different engine operating conditions was considered to be when the spray targets are near the piston bowl edge, because the squish flow would enhance mixture preparation when the spray was injected at this location.
Kokjohn [8] discussed a Two-Stage Combustion (TSC) concept in which the fuel injection per cycle was split into two portions. One portion was fully premixed with air to achieve homogeneous conditions in the cylinder at the beginning of the compression process, and the second portion of fuel was injected directly into the combustion chamber near Top Dead Centre (TDC). Two combustion modes were thus combined in the combustion process—ideal HCCI combustion in the first stage and more diffusion-dominated combustion in the second stage. In the study, six objectives including improving NOx, soot, carbon monoxide (CO), unburned hydrocarbon (UHC or HC), Indicated Specific Fuel Consumption (ISFC), and peak Pressure Rise Rate (PRR) were optimized by adjusting four parameters including boost pressure, EGR rate, fraction of premixed fuel, and start-of-injection timing. His results demonstrated a low NOx and soot with a low peak PRR of 4.3 bar/deg could be achieved by utilizing high EGR (54%), low Intake Valve Close (IVC) pressure (1.74 bar), premixing rate of 36%, and late second-stage injection timing of 2.9 degree After Top Dead Centre (ATDC).
Koci et al. [9] investigated experimentally the emission mechanisms and engine performance with multiple injections under Low Temperature Combustion (LTC) under a light to medium load condition of 5.5 bar net IMEP at 2000 rev/min. An optimal split ratio was proposed to minimize the unburned HC and CO emissions. Their results showed that reducing boost pressure increased the area of the rich region, especially after the main injection, and thus increased HC and CO emissions. Meanwhile their research also suggested that spreading of heat releases using two even sized injections was the most effective noise reduction strategy. Nevertheless, soot decreased with lower boost pressures with split injections under the operating condition. Moreover, increases in injection pressure reduced soot emissions over all split fuel injection ranges.
While these research results have demonstrated that the spray targeting angle and injection timing significantly affect fuel/air mixing and PCCI combustion and emissions with single injection pulses, it is not clear how the spray targeting angle might influence multi-pulse injection, which has been suggested as an optimum strategy for PCCI/HCCI combustion by a number of researchers. Based on these research results, the objectives of this study were to investigate the effects of injection parameters on combustion performance and emission formations in PCCI combustion when multi-pulse injections are employed. Fuel splitting proportion, injection timing, spray targeting angle and injecting velocity are the parameters incorporated in this study. For these purposes, the mixing process and formation of NOx and soot emissions form the focus of this research.
2. Numerical Methods
2.1. Methodology
Numerical simulations were conducted using the KIVA-3V code [10], which was improved by introducing several submodels, as shown in Table 1. The submodels introduced have been tested by previous research and it has been suggested that these new submodels are more appropriate for diesel PCCI combustion. For resolving the turbulent flows in cylinder, the Renormalization Group (RNG) k-ε turbulence model [11] was used. The heat transfer from the wall was computed by the model developed by Han and Reitz [12] which counted the variations of both gas density and the turbulent Prandtl number in the boundary layer.

Table 1.
Computational Submodels.
| Turbulent Model | RNG k-ε Model [11] |
| Break Up Model | KH-RT Model [13] |
| Collision Model | Nordin Model [14] |
| Splash Model | Han et al. Model [15] |
| Heat Transfer (wall) | Han-Reitz Model [12] |
| Combustion | CHEMKIN [16] |
| Fuel Chemistry | Reduced n-Heptane Mechanism [18] |
| Soot Model | Phenomenological Model [17] |
| NOx Mechanism | Extended Zeldovich Mechanism [17] |
The spray process was modeled by a particle method, where the break-up processes of injected droplets were simulated by a Kelvin-Helmholtz Rayleigh-Taylor (KH-RT) model [13]. The collision model used here was one developed by Nordin [14], with improved grid independence. The interaction between spray and wall was represented by the model introduced by Han et al. [15], which considered the effects of gas density variation in simulating the size of secondary droplets in splashing.
The CHEMKIN [16] solver was coupled with the KIVA-3V code to compute the chemical reactions. A reduced n-heptane reaction mechanism [17] was used to simulate diesel fuel chemistry, where the soot formation was solved by a phenomenological model, and NOx formation was represented with the extended Zeldovich mechanism. From the simulation results of Jia et al. [17], it has been shown that fair agreement with experimental results could be achieved when the simulation method was used.
2.2. Computational Grid
Since the diesel injector used in the research has six equally distributed orifices, the combustion chamber was represented by a 60° sector grid with periodic boundary conditions, as shown in Figure 2. The grid has approximately 25,231 hexahedral cells. The typical cell size is smaller than 3 mm in three dimensions, which is much better than the grid employed by Abani et al. [19]. Abani et al. also employed a spray model similar to the one used in this study and found that the difference between the results of fine and coarse grids was not obvious. In other research, conducted by Kim et al. [20], it was also shown that KIVA-3V results have some confidence of precision when using relatively coarser grids (2.2 × 2.2 × 3.0 mm3). Therefore the grid used here is considered to yield sufficient accuracy for those predictions.
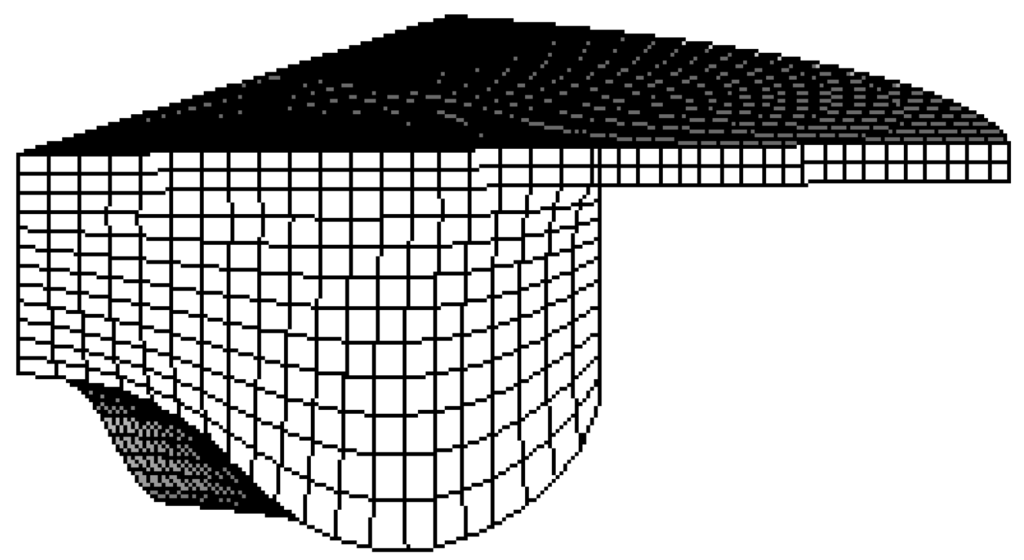
Figure 2.
Computational grids at TDC.
3. Engine Specifications
The engine used in this study was a High Speed Direct Injection (HSDI) diesel engine, as experimentally investigated by Lee [21]. The engine has four valves and a displacement of 0.477 L per cylinder. Most of engine parameters were kept the same as in Lee’s original experiments for the model validation, except some modifications made to the injector for further combustion simulations. The original nozzle with eight orifices of 0.133 mm diameter was replaced by a nozzle with six orifices of 0.11 mm diameter. The specifications for the engine are listed in Table 2, while the details for the injection system are given in Table 3.
Table 2.
Engine Specifications.
| Engine Type | 4 valve HSDI diesel |
| Bore × Stroke | 82.0 mm × 90.4 mm |
| Compression Ratio | 16.0:1 |
| Displacement | 477 cm3 |
| Combustion Chamber | Open Crater Type Bowl |
| Intake Ports | 1 helical + 1 direct port |
| Swirl Ratio (at IVC) | 1.83 ~ 3.30 (1.85) |
| Piston Bowl Diameter | 48 mm |
| Squish Height | 1.61 mm |
| IVO/IVC | 350 °CA ATDC/−142 °CA ATDC |
| EVO/EVC | 142 °CA ATDC/368.5 °CA ATDC |
Table 3.
Injection System Specifications.
| Injector Type | Electro-hydraulically Controlled |
| Nozzle Type | Dual guided VCO |
| Injection Pressure | 1,800 bar maximum |
| Flow Number | 400 cm3/30 s @ 100 bar |
| Included Angle | 120°, 130°, 140° |
| Number of Orifices | 6 |
| Orifice Diameter | 0.11 mm |
4. Model Validation
The model has been fully validated with single injection pulse by previous research whose details can be found in [17]. The validation presented here was mainly combined with split injections and the engine experimental results used were mainly conducted by Lee [21].
The fuel mass per cycle operated for the validation was 15~22 mg, with 25% in the first injection pulse and 75% in the second pulse. The injection timing or Start of Injection of the first injection (SOI_1) was kept constant at −35° Crank Angle (CA) ATDC and the injection timing or the Start of Injection of the second injection (SOI_2) varied from −25° CA to −5° CA ATDC. Other operating conditions were kept the same as described in [21]. Figure 3 shows the comparison of the in-cylinder pressure and heat release rate between the simulation and Lee’s experimental results with an SOI_2 of 25° CA BTDC. From the figure, it can be seen that good agreement was achieved between experimental and simulation results.
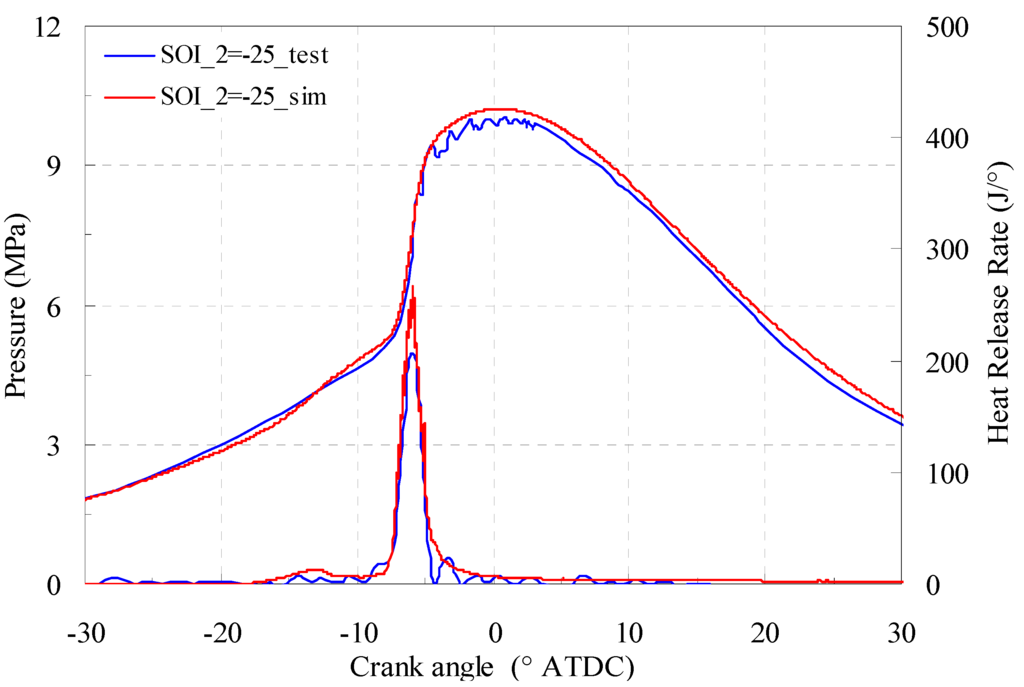
Figure 3.
Comparison between experimental and simulating results for the pressure and heat release rate when SOI_2 is −25° CA ATDC.
While previous research has provided adequate validation for NOx and soot models, there is an emphasis here on comparing CO and unburned HC emissions between predictions and experimental results. The experimental investigation showed this PCCI engine still has very high CO emissions, even with split injections. When the start of second injection was retarded, it showed some reduction, as shown in Figure 4. Although the simulation results have a small under prediction in CO emissions, the overall trend through all range of SOI_2 has some agreement. For UHC emission prediction, large over prediction was observed for early SOI_2 (before −20° ATDC). Good agreements were achieved when SOI_2 was retarded to later than −15° ATDC.
5. Results and Discussion
5.1. Baseline—Sweep of Second Pulse Timing
A preliminary research by sweeping the second pulse timing (SOI_2) from −30° to −5° CA ATDC with an interval of 5° CA was conducted to obtain an initial understanding of the effects of multi-pulse injections on the diesel PCCI engine. The engine speed was fixed at 2500 rev/min and the initial in-cylinder temperature at IVC was fixed to be 360 K. The fuel mass per cycle was 30 mg, 20% of which was injected during the first injection with SOI_1 at −40° CA ATDC. The injector used as the baseline has an inclusion angle of 120°. The injection velocity at the nozzle exit is assumed to be 400 m/s for the baseline case. The shape of injection rate was simplified to two square pulses. More simulation conditions can be found from Table 4.
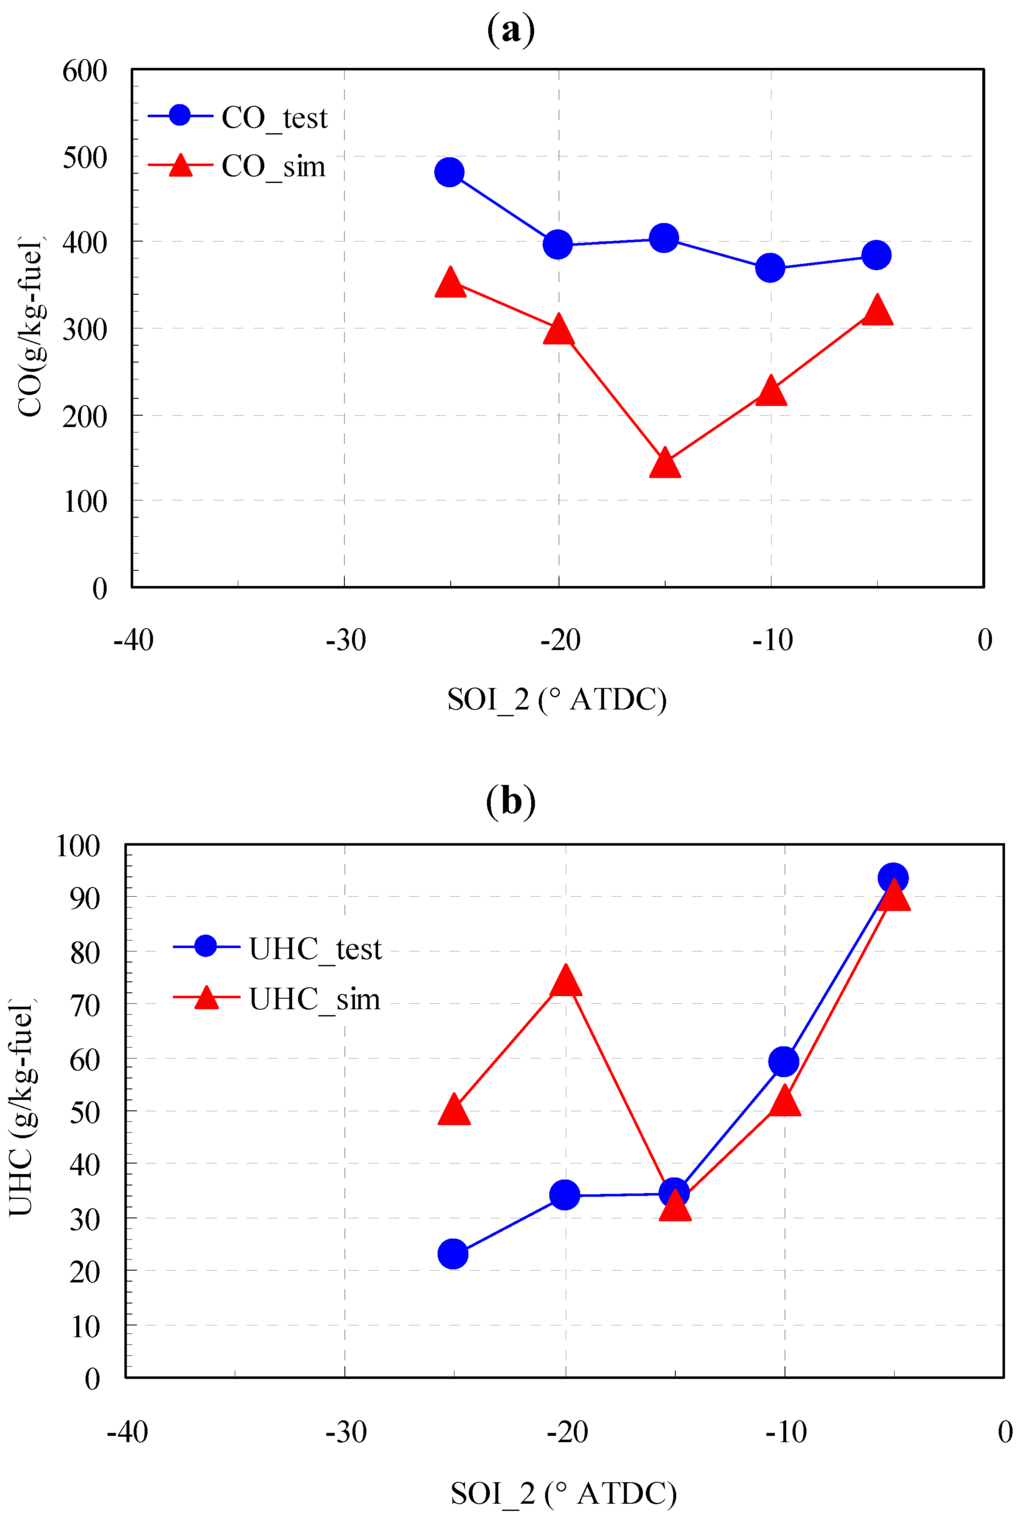
Figure 4.
Comparison between experimental and simulation results for CO and UHC with different SOI_2: (a) CO emissions; (b) UHC emissions.
Table 4.
Baseline Simulation Conditions.
| Engine Speed | 2500 rpm |
| IVC Temperature | 360 K |
| Velocity at injector | 400 m/s |
| Fuel Mass | 30 mg/cycle |
| SOI_1 | −40° CA ATDC |
| SOI_2 | −30°~−5° CA ATDC |
| Injection Duration_1 | 3° CA |
| Injection Duration_2 | 5.04° CA |
| Fuel Mass of 1st Injection | 20% |
| Included Angle | 120° |
| Swirl Ratio | 1.83 |
| EGR Rate | 35% |
The simulation period for each combustion cycle covered from IVC to Exhaust Valves Opening (EVO). Although the first injection has taken place at −40° CA ATDC, it is not until −20° CA ATDC when any observable heat release can be found, as shown in Figure 5. This suggests the in-cylinder temperature and pressure are insufficiently high for starting of combustion until −20° CA ATDC.
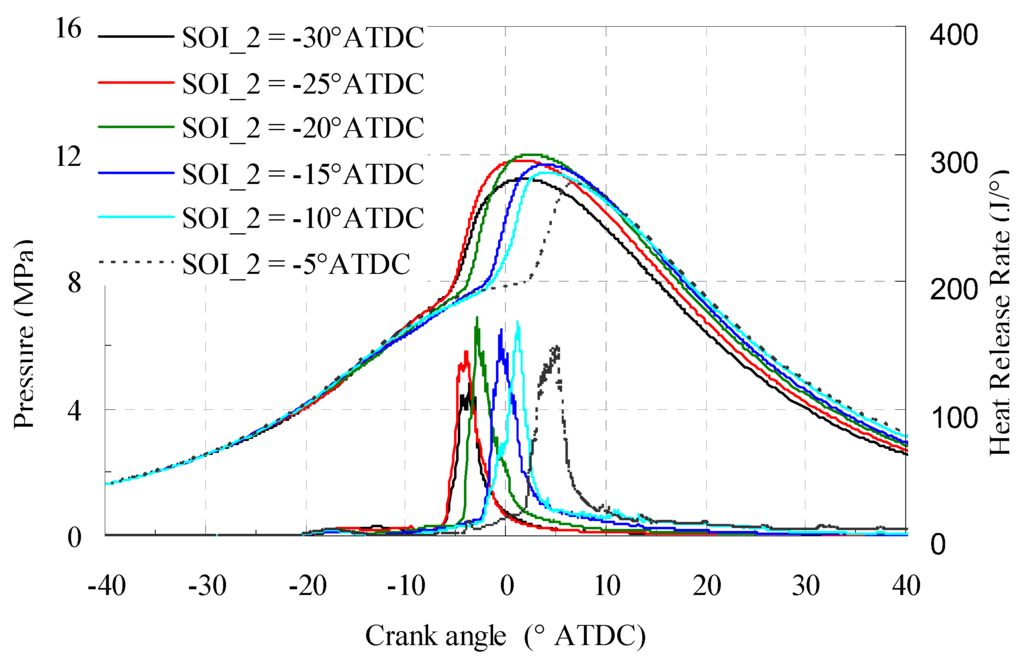
Figure 5.
The pressure and heat release rate of the baseline case with different second injection timings.
Since the second injection stopped earlier than the start of ignition when the second injection starts were before −20° CA ATDC, it was difficult to distinguish heat releases of the two injections because the fuel of both injections might react simultaneously. However, for those cases whose second injection starts were later than −20° ATDC, the heat releases from the fuels of the first and second injections could be displayed separately.
The case of SOI_2 = −30° CA ATDC has the lowest peak Heat Release Rate (HRR), and the combustion doesn’t start until 5° CA after the second injection completed. This suggests more time is available for the mixing of fuel and air, hence a more homogeneous mixture is expected. However, there is serious wall film due to the relatively low in-cylinder temperature during the evaporation process. The wall film could result in poor combustion efficiency and high soot emissions.
For those cases where the start of second injection is later than −25° CA ATDC, although the mixing time is very short, higher in-cylinder temperature might accelerate the spray evaporation and fuel-air mixing, while the ignition has taken place about 1° CA before the finish of the second injection. As a result, the case SOI_2 = −25° CA ATDC even showed precedence in High Temperature Heat Release (HTHR) phase when compared with the former case.
As shown in Figure 6, there are variations of NOx and soot emissions as a function of the second injection timing. These results show that the SOI_2 = −25° CA ATDC and −20° CA ATDC cases had the highest NOx emissions since they have relatively faster and more intensive heat release, which implies higher combustion temperatures. For the case SOI_2 = −30° CA ATDC, the combustion was slow and at the low temperature, NOx emission was low. When the start of the second injection is later than −20° CA ATDC, NOx emissions decrease again because of the excess retarding of the second injection pulse. For the cases with SOI_2 before −15° CA ATDC, soot emissions were lower than 0.1 g/kg-fuel. Dramatic high soot formation was observed when the start of main injection was retarded to after −15° CA ATDC.
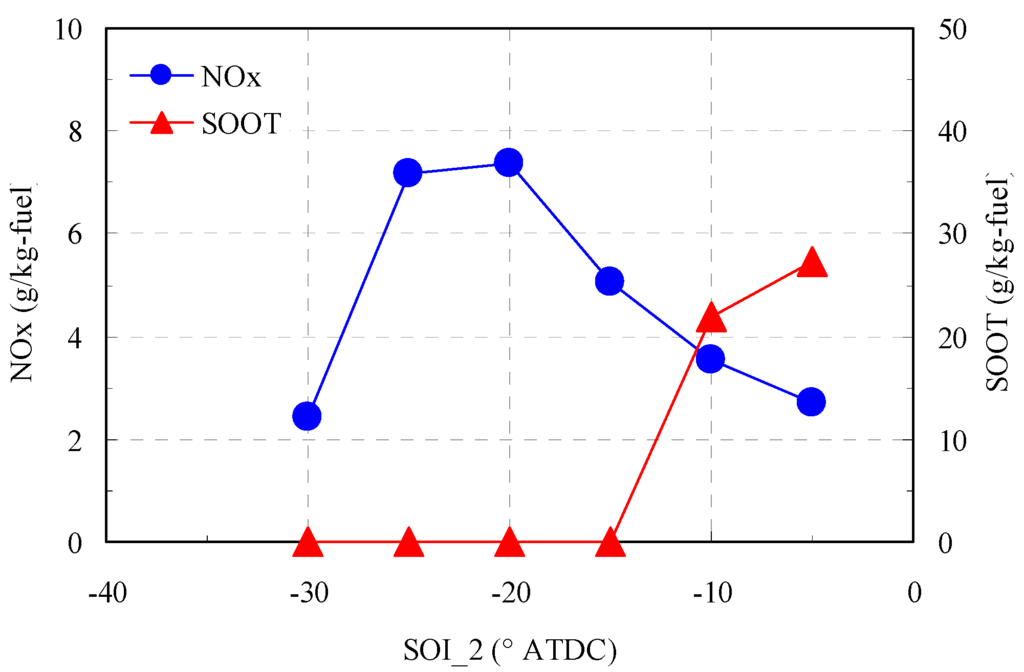
Figure 6.
NOx and soot emissions of the baseline case with different SOI_2 timings.
CO emissions had a similarly high level in the validation cases, while UHC emissions were very low for all cases, as shown in Figure 7. With the start of main injection later than −15° ATDC, both CO and UHC emissions increase due to poor fuel-air mixture formation.
Figure 8 shows the distribution of equivalence ratio before ignition and before the start of the second heat release phase for the low-soot case (SOI_2 = −30° CA ATDC) and high-soot case (SOI_2 = −5° CA ATDC). Pre-ignition, the mixture was more uniform in the case of SOI_2 = −5° CA ATDC because less fuel had to be mixed. At that time all fuel had been injected for the case of SOI_2 = −30° CA ATDC, and a high equivalence ratio area existed in the corner of the piston bowl. Since the temperature was very low, soot emissions did not increase. After the mixing in the following 15° crank angle, the mixture was quite uniform and lean in most areas of cylinder for the case of SOI_2 = −30° CA ATDC at the start of the second heat release phase, so very low soot emissions were achieved in this case. On the other hand, very poor fuel-air mixing could be observed in the case of SOI_2 = −5° CA ATDC before the start of the second heat release phase. Considering the relatively high temperature here, the poor mixture formation could be considered as the reason for the high soot emission observed.
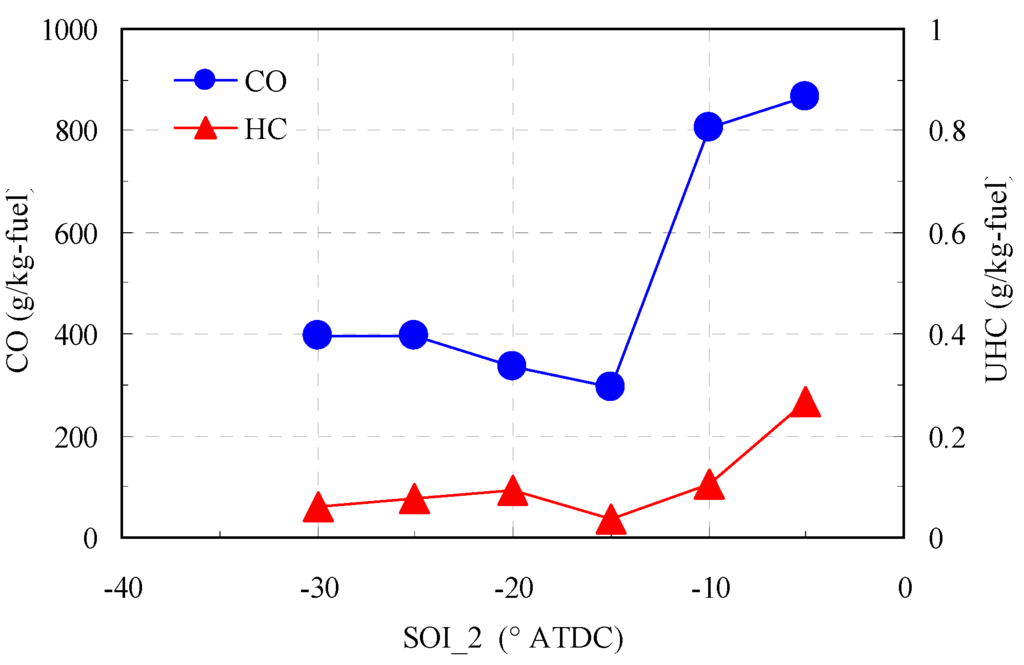
Figure 7.
CO and UHC emissions of the baseline case with different SOI_2 timings.
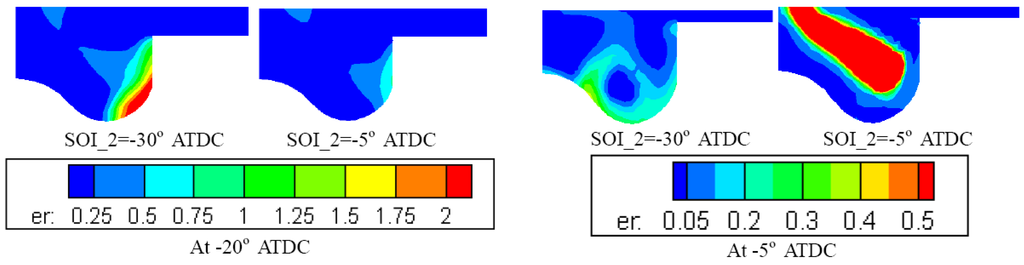
Figure 8.
Equivalence ratio distribution prior to ignition and prior to the start of the second heat release phase for SOI_2 = −30° CA ATDC, and SOI_2 = −5° CA ATDC.
5.2. Effect of Injection Splitting Proportion
In this section two more fuel splitting strategies (10% and 30% fuel in the first injection pulse) were simulated, and the comparisons of emissions are shown in Figure 9. For SOI_2 earlier than −20° CA ATDC, NOx emission increased with the increase of the fuel amount in the first injection, while soot emissions showed low sensitivity and remained at a very low level (less than 0.1 g/kg-fuel). After SOI_2 is retarded later than −20° CA ATDC, the trend switched to an opposite direction with NOx emissions decreasing when the fuel amount increased for the first injection. Meanwhile, soot emissions increased as well. This suggests that, for the cases where the fuel is injected prior to occurrence of combustion in the first injection, the mixture at ignition was richer. This would result in higher temperature during combustion, and thus more NOx formation. For the cases where more fuel was injected in the first injection, it means less fuel is left to be oxidized in the second heat release phase. Lower combustion temperature can be expected for these cases, with lower NOx formation. As the proportion of fuel in the first injection increased, both CO and UHC emissions increased. The range of that increase grew when the start of the main injection was retarded.
5.3. Effect of Spray Angle
To understand the effect of the spray targeting angel, three different spray inclusion angles (120°, 130°, and 140°) were studied. As shown in Figure 10, more fuel will be captured in the squish region with a larger inclusion angle.
When the inclusion angle increased from 120° to 130°, no significant differences appear in NOx emission and UHC emission, as shown in Figure 11. Only slight disadvantages were observed in the increase of CO emission for this structural change. Once the inclusion angle was enlarged more to 140°, NOx emissions increased visibly, and CO emissions dropped simultaneously. This demonstrated that higher combustion efficiency and higher in-cylinder temperature resulted from a higher inclusion angle. For this increase in the inclusion angle, soot emissions were reduced when the start of second injection was retarded to later than −15° CA ATDC.
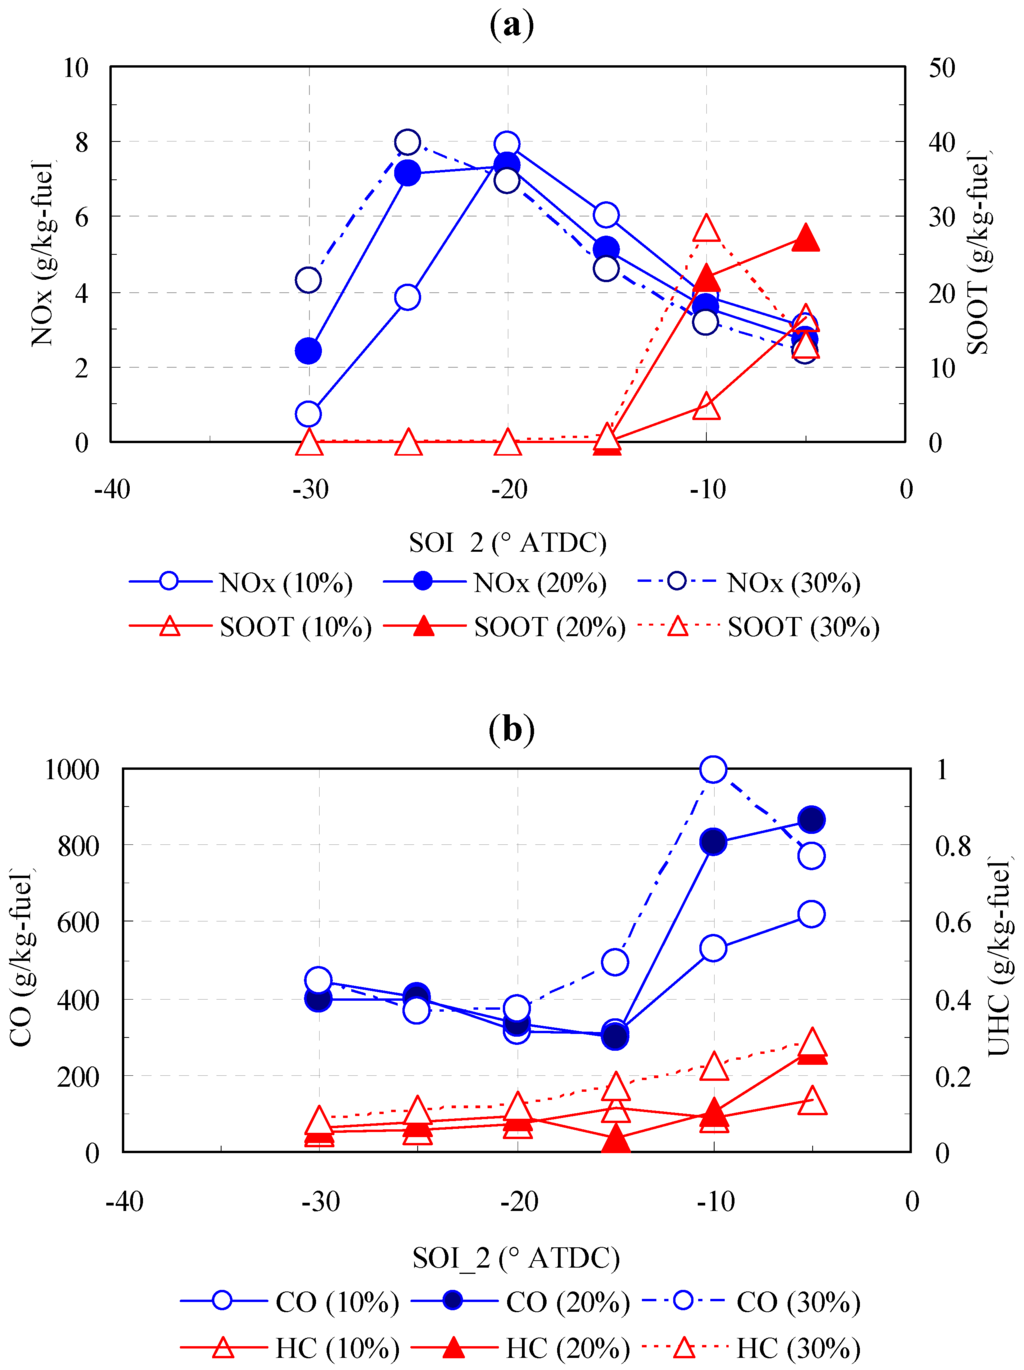
Figure 9.
Emissions for different fuel splitting proportions: (a) NOx and soot emissions; (b) CO and UHC emissions.
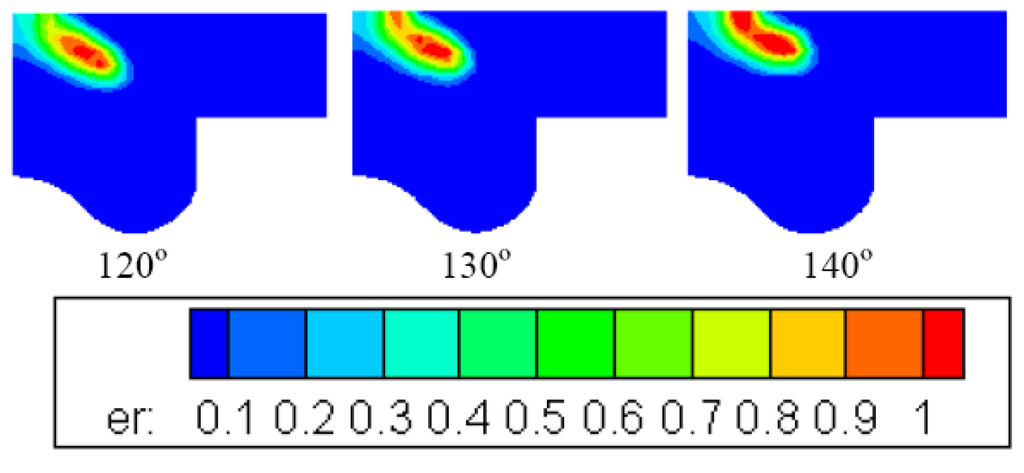
Figure 10.
Equivalence ratio distribution at 2° CA after the first injection with different inclusion angles, SOI_2 = −30° CA ATDC.
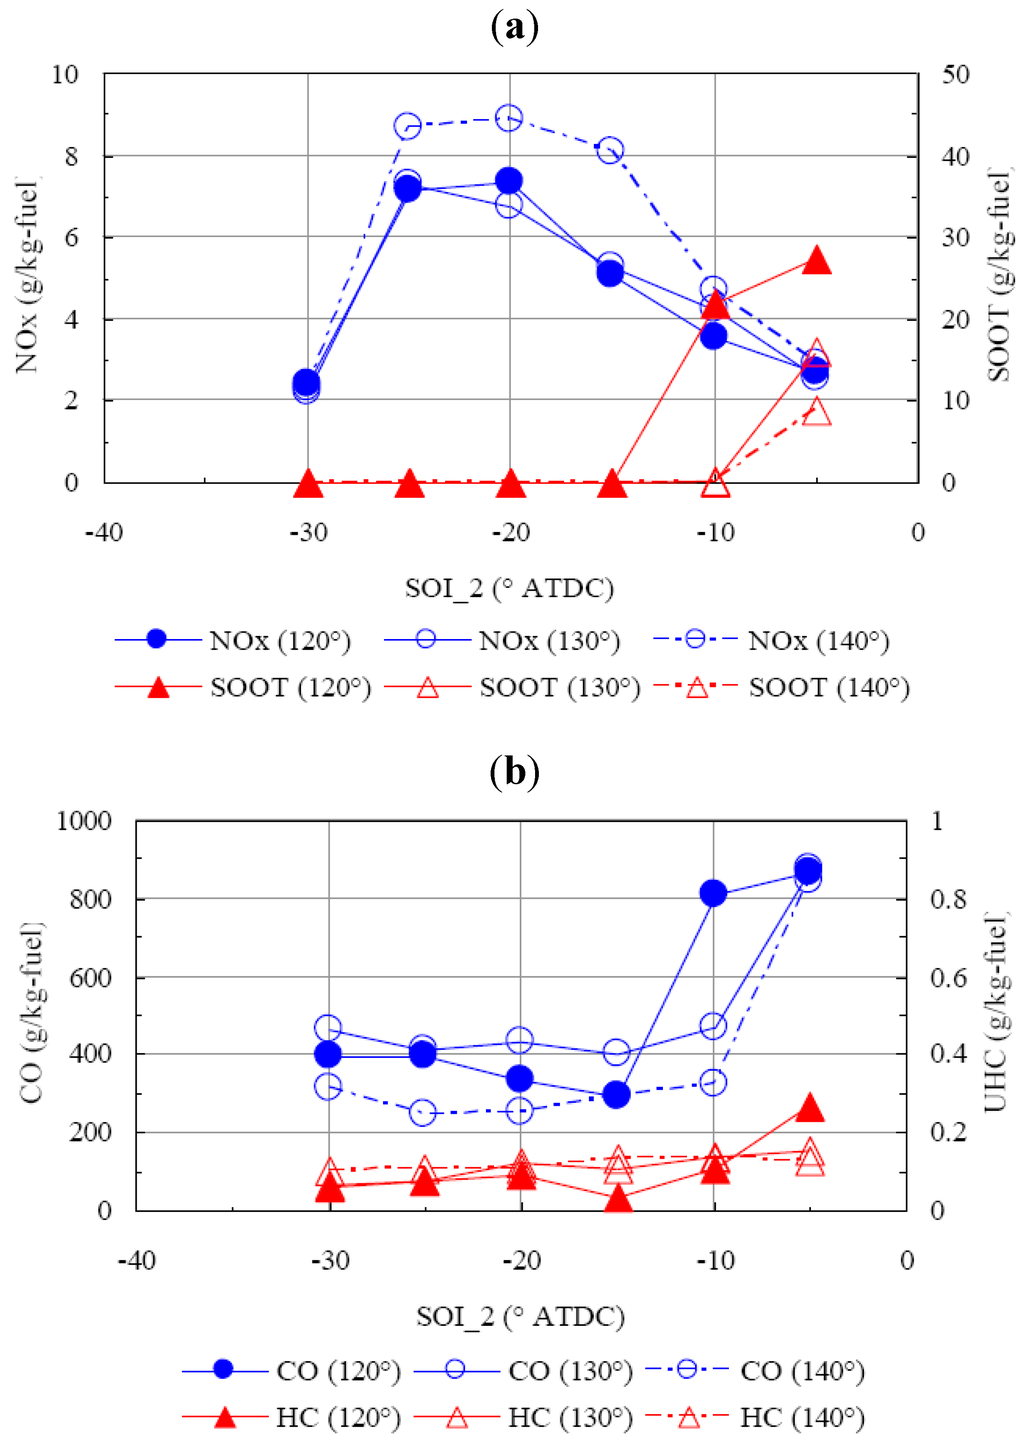
Figure 11.
Emissions for fuel spray angle variation: (a) NOx and soot emissions; (b) CO and UHC emissions.
5.4. Effect of Injection Velocity
Three different velocities (200, 300 and 400 m/s) at the exit of injector were simulated for an understanding of the effects of injection pressure on the mixing and combustion processes. As shown in Figure 12, when the velocities at the injector were increased, the spray penetrated faster and further into the combustion chamber and the spray targeting moved up with higher injection velocity. As shown in Figure 12, a larger area is covered by the fuel and a richer area was seen in the case of the highest injection velocity. These could be considered benefitial for a more efficient evaporation due to faster injection. As a result of better evaporation, faster combustion was expected.
The higher the injection velocity was, the higher the NOx emissions obtained were, as shown in Figure 13, because more intensive heat release took place in the cylinder. The increase of NOx was larger when the start of second injection was earlier than −15° CA ATDC, and the greater distance between injector and targeting position resulted in a more obvious velocity effect. A rise in soot emissions could be seen as the injection velocity increases for cases with late second injection. This is because of the worse impinging on the piston bowl as a consequence of the sharper injection and greater space constraints. The cases with the lowest injection velocity showed a flat CO emission curve as the SOI_2 varied. UHC emissions did not change much when the injection velocity was varied.
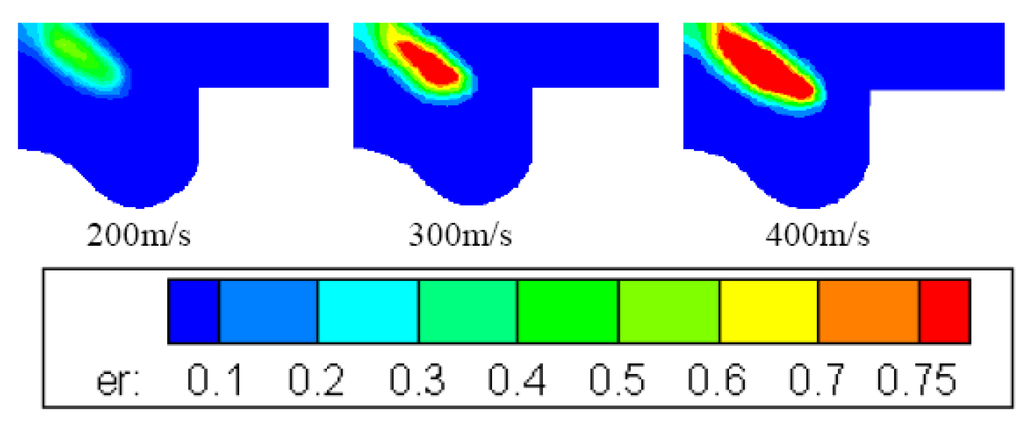
Figure 12.
Equivalence ratio distribution 2° CA after the second injection with different injection velocities, SOI_2 = −30°CA ATDC.
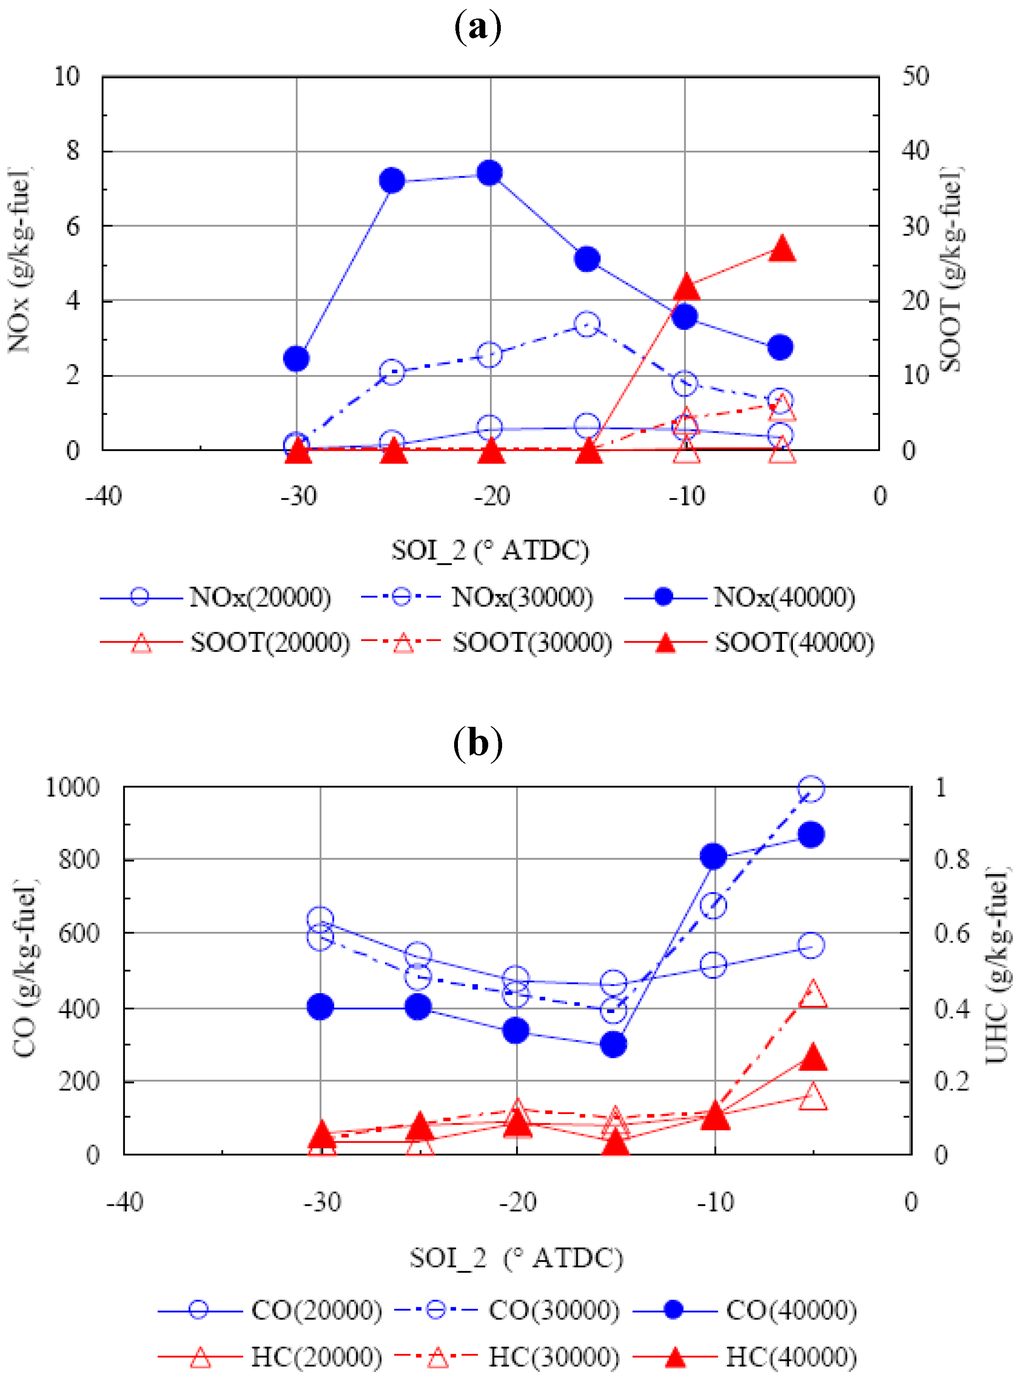
Figure 13.
Emissions for injection velocity variation (velocity unit cm/s). (a) NOx and soot emissions; (b) CO and UHC emissions.
6. Conclusions
The study presented in this paper investigated the behavior of multiple injections in a diesel PCCI engine with the Computational Fluid Dynamics method. A primary objective was to gain an initial understanding of multiple injections on diesel PCCI combustion. The effects of fuel splitting proportion, spray inclusion angle, and velocity at the injector were then explored. From those investigations, the following conclusions were obtained:
- ○
- The timing of second injection and the fuel velocity at the injector significantly impact the combustion and emissions due to the considerable changes to the mixing process and fuel distribution in the cylinder. A “key timing” exists between the start of ignition and the end of first heat release phase, where the trend of emissions’ varies according to the start of the second (main) injection.
- ○
- The more fuel injected in the first injection, the more homogeneous the mixture is. For the cases where all the fuel was injected before the start of ignition, reducing the fuel amount in the first injection can achieve lower NOx emissions. To the contrary, when increasing the fuel amount in the first injection one can obtain better NOx emissions when the start of the main injection is retarded after ignition.
- ○
- A large inclusion angle shows advantages in achieving low soot, CO and UHC emissions, but display some disadvantages in NOx control.
Acknowledgments
Financial support from the ERDF (European Regional Development Fund, 05-25-SCODECE) and Program 111 are gratefully acknowledged.
Acronyms
| ATDC | after top dead centre; |
| CO | carbon monoxide; |
| EGR | exhaust gas recirculation; |
| EVC | exhaust valve close; |
| EVO | exhaust valve opening; |
| HCCI | homogeneous charge compression ignition; |
| HC | hydrocarbon; |
| HRR | heat release rate; |
| HSDI | high speed direct injection; |
| HTHR | high temperature heat release; |
| ISFC | indicated specific fuel consumption; |
| IVC | intake valve close; |
| IVO | intake valve opening; |
| LTC | low temperature combustion; |
| NOx | nitrogen oxides; |
| PCCI | premixed charge compression ignition; |
| PRR | pressure rise rate; |
| TDC | top dead centre; |
| TSC | two-stage combustion; |
| UHC | unburned hydrocarbon |
References
- Okude, K.; Mori, K.; Shiino, S.; Moriya, T. Premixed Compression Ignition (PCI) Combustion for Simultaneous Reduction of NOx and Soot in Diesel Engine. SAE Trans. 2004, 113, 1002–1013. [Google Scholar]
- Lechner, G.A.; Jacobs, T.J.; Chryssakis, C.A.; Assanis, D.N.; Siewert, R.M. Evaluation of Narrow Spray Cone Angle, Advanced Injection Timing Strategy to Achieve Partially Premixed Compression Ignition Combustion in a Diesel Engine. SAE Trans. 2005, 114, 394–404. [Google Scholar]
- Kanda, T.; Hakozaki, T.; Uchimoto, T.; Hatano, J.; Kitayama, N.; Sono, H. PCCI Operation with Early Injection of conventional Diesel Fuel. SAE Trans. 2005, 114, 584–593. [Google Scholar]
- Jacobs, T.; Bohac, S.; Assanis, D.N.; Szymkowicz, P.G. Lean and Rich Premixed Compression Ignition Combustion in a Light-Duty Diesel Engine. SAE Trans. 2005. [Google Scholar] [CrossRef]
- Kamimoto, T.; Bae, M. High Combustion Temperature for the Reduction of Particulate in Diesel Engines. SAE Trans. 1988. [Google Scholar] [CrossRef]
- Sun, Y. Diesel combustion optimization and emissions reduction using adaptive injection strategies (AIS) with improved numerical models. Ph.D. Thesis, University of Wisconsin, Madison, WI, USA, 2007. [Google Scholar]
- Lee, S.; Reitz, R.D. Spray Targeting to Minimize Soot and CO Formation in Premixed Charge Compression Ignition (PCCI) Combustion with a HSDI Diesel Engine. SAE Trans. 2006. [Google Scholar] [CrossRef]
- Kokjohn, S.L.; Reitz, R.D. A Computational Investigation of Two-stage Combustion in a Light-Duty Engine. SAE Int. J. Engines 2008, 1, 1083–1104. [Google Scholar]
- Koci, C.P.; Ra, Y.; Krieger, R.; Andrie, M.; Foster, D.E.; Siewert, R.M.; Durrett, R.P. Multiple-Event Fuel Injection Investigations in a Highly-Dilute Diesel Low Temperature Combustion Regime. SAE Int. J. Engines 2009, 2, 837–857. [Google Scholar]
- Amsden, A.A. In Kiva-3v: A Block-Structured Kiva Program for Engines with Vertical or Canted Values; Technical Report Number LA-13313-MS. Los Alamos National Laboratory: Los Alamos, NM, USA, 1997. [Google Scholar]
- Han, Z.Y.; Reitz, R.D. Turbulence Modeling of Internal Combustion Engines Using RNG K-E Models. Combust. Sci. Technol. 1995, 106, 267–295. [Google Scholar] [CrossRef]
- Han, Z.Y.; Reitz, R.D. A temperature wall function formulation for variable-density turbulence flows with application to engines convective heat transfer modeling. Int. J. Heat and Mass Transfer 1997, 40, 613–625. [Google Scholar] [CrossRef]
- Ricart, L.M.; Reitz, R.D.; Dec, J.E. Comparisons of diesel spray liquid penetration and vapor fuel distributions with in-cylinder optical measurements. Trans. ASME J. Engn. Gas Turbines Power 2000, 122, 588–595. [Google Scholar] [CrossRef]
- Nordin, N. Complex chemistry modeling of diesel spray combustion. Ph.D. Thesis, Chalmers University of Technology, Goteborg, Sweden, 2001. [Google Scholar]
- Han, Z.Y.; Xu, Z.; Trigui, N. Spray/wall interaction models for multidimensional engine simulation. Int. J. Engine Res. 2000, 1, 127–146. [Google Scholar] [CrossRef]
- Kee, R.J.; Rupley, F.M.; Meeks, E.; Miller, J.A. CHEMKIN-III: A FORTRAN chemical kinetics package for the analysis of gas phase chemical and plasma kinetics. Technical Report for Sandia National Laboratories: Albuquerque, NM, USA, 1996. [Google Scholar]
- Jia, M.; Peng, Z.J.; Xia, M.Z. Numerical Investigation of Soot Reduction Potentials with Diesel Homogeneous Charge Compression Ignition Combustion by An Improved Phenomenological Soot Model. J. Automot. Eng. 2009, 223, 396–399. [Google Scholar]
- Patel, A.; Kong, S.C.; Reitz, R.D. Development and validation of reduced reaction mechanism for HCCI engine simulation. SAE Int. 2004. [Google Scholar] [CrossRef]
- Abani, N.; Kokjohn, S.L.; Park, S.W.; Bergin, M.; Munnannur, A.; Ning, W.; Reitz, R.D. An improved Spray Model for Reducing Numerical Parameters Dependencies in Diesel Engine CFD Simulations. SAE Int. 2008. [Google Scholar] [CrossRef]
- Kim, Y.J.; Lee, S.H.; Cho, N.H. Effect of Air Motion on Fuel Spray Characteristics in a Gasoline Direct Injection Engine. SAE Int. 1999. [Google Scholar] [CrossRef]
- Lee, S.S. Investigation of two low emissions strategies for diesel engines: premixed charge compression ignition (PCCI) and stoichiometric combustion. Ph.D. Thesis, University of Wisconsin, Madison, WI, USA, 2006. [Google Scholar]
© 2011 by the authors; licensee MDPI, Basel, Switzerland. This article is an open access article distributed under the terms and conditions of the Creative Commons Attribution license (http://creativecommons.org/licenses/by/3.0/).