Article

Effect of Methane Substitution with Hydrogen in a Dual-Fuel Diesel/Methane Engine with Late Pilot Injection Strategy


by
Antonio Paolo Carlucci
,
Luciano Strafella
* and
Antonio Ficarella
Department of Engineering for Innovation, University of Salento, Via per Arnesano, 73100 Lecce, Italy
*
Author to whom correspondence should be addressed.
Energies 2026, 19(8), 1909; https://doi.org/10.3390/en19081909
Submission received: 10 March 2026 / Revised: 6 April 2026 / Accepted: 7 April 2026 / Published: 15 April 2026
(This article belongs to the Special Issue Internal Combustion Engines: Research and Applications—3rd Edition)

Abstract

Hydrogen is recognized as a promising energy vector for the decarbonization of energy production. Besides the undoubted benefits, its utilization poses some technological challenges in the generation, transportation, storage and utilization phases, which must be carefully assessed. The aim of this work is to assess the effect of methane substitution with hydrogen in a dual-fuel diesel/methane engine on fuel conversion efficiency and pollutant emission levels. Therefore, an extensive experimental campaign has been designed in which a hydrogen/methane mixture with variable composition is ignited with a pilot injection of diesel fuel. The engine was operated in naturally aspirated or supercharged conditions, and conventional or alternative combustion strategies were implemented, spanning a pilot injection timing over a broad range of values. The results show that the effect of a variation in H2 percentage of up to 20% strongly depends on air intake pressure and pilot injection timing. In particular, engine efficiency and HC and CO emissions are penalized as H2 percentage increases; however, this penalty can be mitigated in naturally aspirated conditions if a late pilot SOI strategy is adopted. In terms of NOx, a reduction is observed as H2 percentage increases. Late SOIs determine the lowest levels of NOx emissions in both naturally aspirated and supercharged conditions.

1. Introduction

The path towards decarbonization requires replacing conventional fuels with carbon-free ones. In particular, in reciprocating Internal Combustion Engines (ICE), hydrogen has been proposed as a replacement for methane in both spark and compression ignition dual-fuel (DF) engines [1,2,3]. In the latter, hydrogen addition has been proposed as a way for improving the exploitation of methane in dual-fuel diesel/methane engines. Hydrogen is characterized by a higher flammability limit and a faster burning rate compared to methane. Therefore, hydrogen can improve the poor combustion of methane at low to medium loads. On the other hand, methane can control hydrogen combustion at high loads [4].
Unfortunately, hydrogen still presents critical problems in the production, transportation and storage phases from both energetic and economic points of view [5,6]. For example, concerning production, electrolysis is the only technology which can, at present, guarantee near-zero carbon emissions but only if electric power is produced from renewables. In addition, electrolyzers’ efficiency, based on today’s technologies, is not high enough to make hydrogen utilization profitable. Moreover, the transport phase presents some issues as well; the existing piping, designed for natural gas transportation, shows embrittlement if hydrogen is added to natural gas at a percentage exceeding 10% in volume. The addition of higher hydrogen percentages would therefore require significant investments to upgrade the existing piping. As a consequence, the substitution percentage to be adopted in dual-fuel diesel/methane engines must be carefully established, evaluating the drawbacks on the transportation side (infrastructure upgrade) and the effects on the utilization side, particularly in terms of fuel conversion efficiency, CO2 and pollutant emission levels. Obviously, improving the effects on the utilization side would make the investments on the transportation side more affordable. Therefore, it is mandatory to further improve hydrogen utilization strategies in ICE.
Concerning this last point, research on combustion path improvement is still ongoing, aiming to control pollutants and improve the fuel economy. While there is extensive documented experimental and simulation research on spark ignition engines fed with methane/hydrogen mixtures, research activity on compression ignition DF engines fed with methane/hydrogen mixtures is less common, despite the higher fuel conversion efficiency that can be reached in full- and part-load operations thanks to the higher volumetric compression ratio. In DF engines, recent research has focused on combustion characteristics and how to obtain them through proper in-cylinder charge preparation. Low-Temperature Combustion (LTC) has been proposed to reduce pollutant levels and several strategies have been tested in order to obtain this on ICE [7,8,9,10]. However, there is a limited number of studies available in the literature dealing with the effect of injection strategies and their effectiveness in improving combustion development [11]. Among the most tested is the early introduction of high-reactivity fuel in the cylinder [12,13,14]. This strategy can obtain a quite homogeneous air–fuel mixture before ignition thanks to the long ignition delay but, for the same reason, unburned fuel reaches the cylinder walls, resulting in wall quenching (and therefore combustion losses) and lubricating oil deterioration. For this reason, the authors of the present paper have proposed a different strategy, consisting of injecting a high-reactivity fuel close to TDC [15]. This approach, which was previously proposed for diesel engines [16], can still obtain a long ignition delay. Moreover, the swirl motion, which is more intense when close to TDC than during the early compression stroke, supported a fast mixing between air and fuel and, consequently, a fast premixed combustion. In previous tests [15], the effect of the injection pressure, intake air pressure and H2 addition were evaluated with a late pilot injection and the results were compared with conventional and early pilot injections on a DF diesel/methane engine. During tests, the % substitution of methane with hydrogen was kept constant, equal to 10%. This concentration was indicated in previous studies and standards as the maximum percentage that can be safely injected into existing natural gas pipelines without the risk of embrittlement.
The aim of this work is therefore to extend the previous study, in particular assessing the effect of methane substitution % variation with hydrogen in a dual-fuel diesel/methane compression ignition engine and verifying whether the improvement of the engine operation can justify investments for piping upgrade. The engine used for testing activities was fed using diesel as high reactivity fuel and three gaseous mixtures of methane and hydrogen—with hydrogen volumetric percentages of 5, 10 and 20%—as low-reactivity fuel. During tests, pilot Start OF Injection (SOI) spanned over a wide range covering early, conventional and late phasings, pilot injection pressure (PIP) was varied on two levels, and air intake pressure was varied on two levels corresponding to naturally aspirated (NA) and supercharged (SC) conditions. Their effect was evaluated on engine performance, combustion behaviour and gaseous emission levels.

2. Materials and Methods

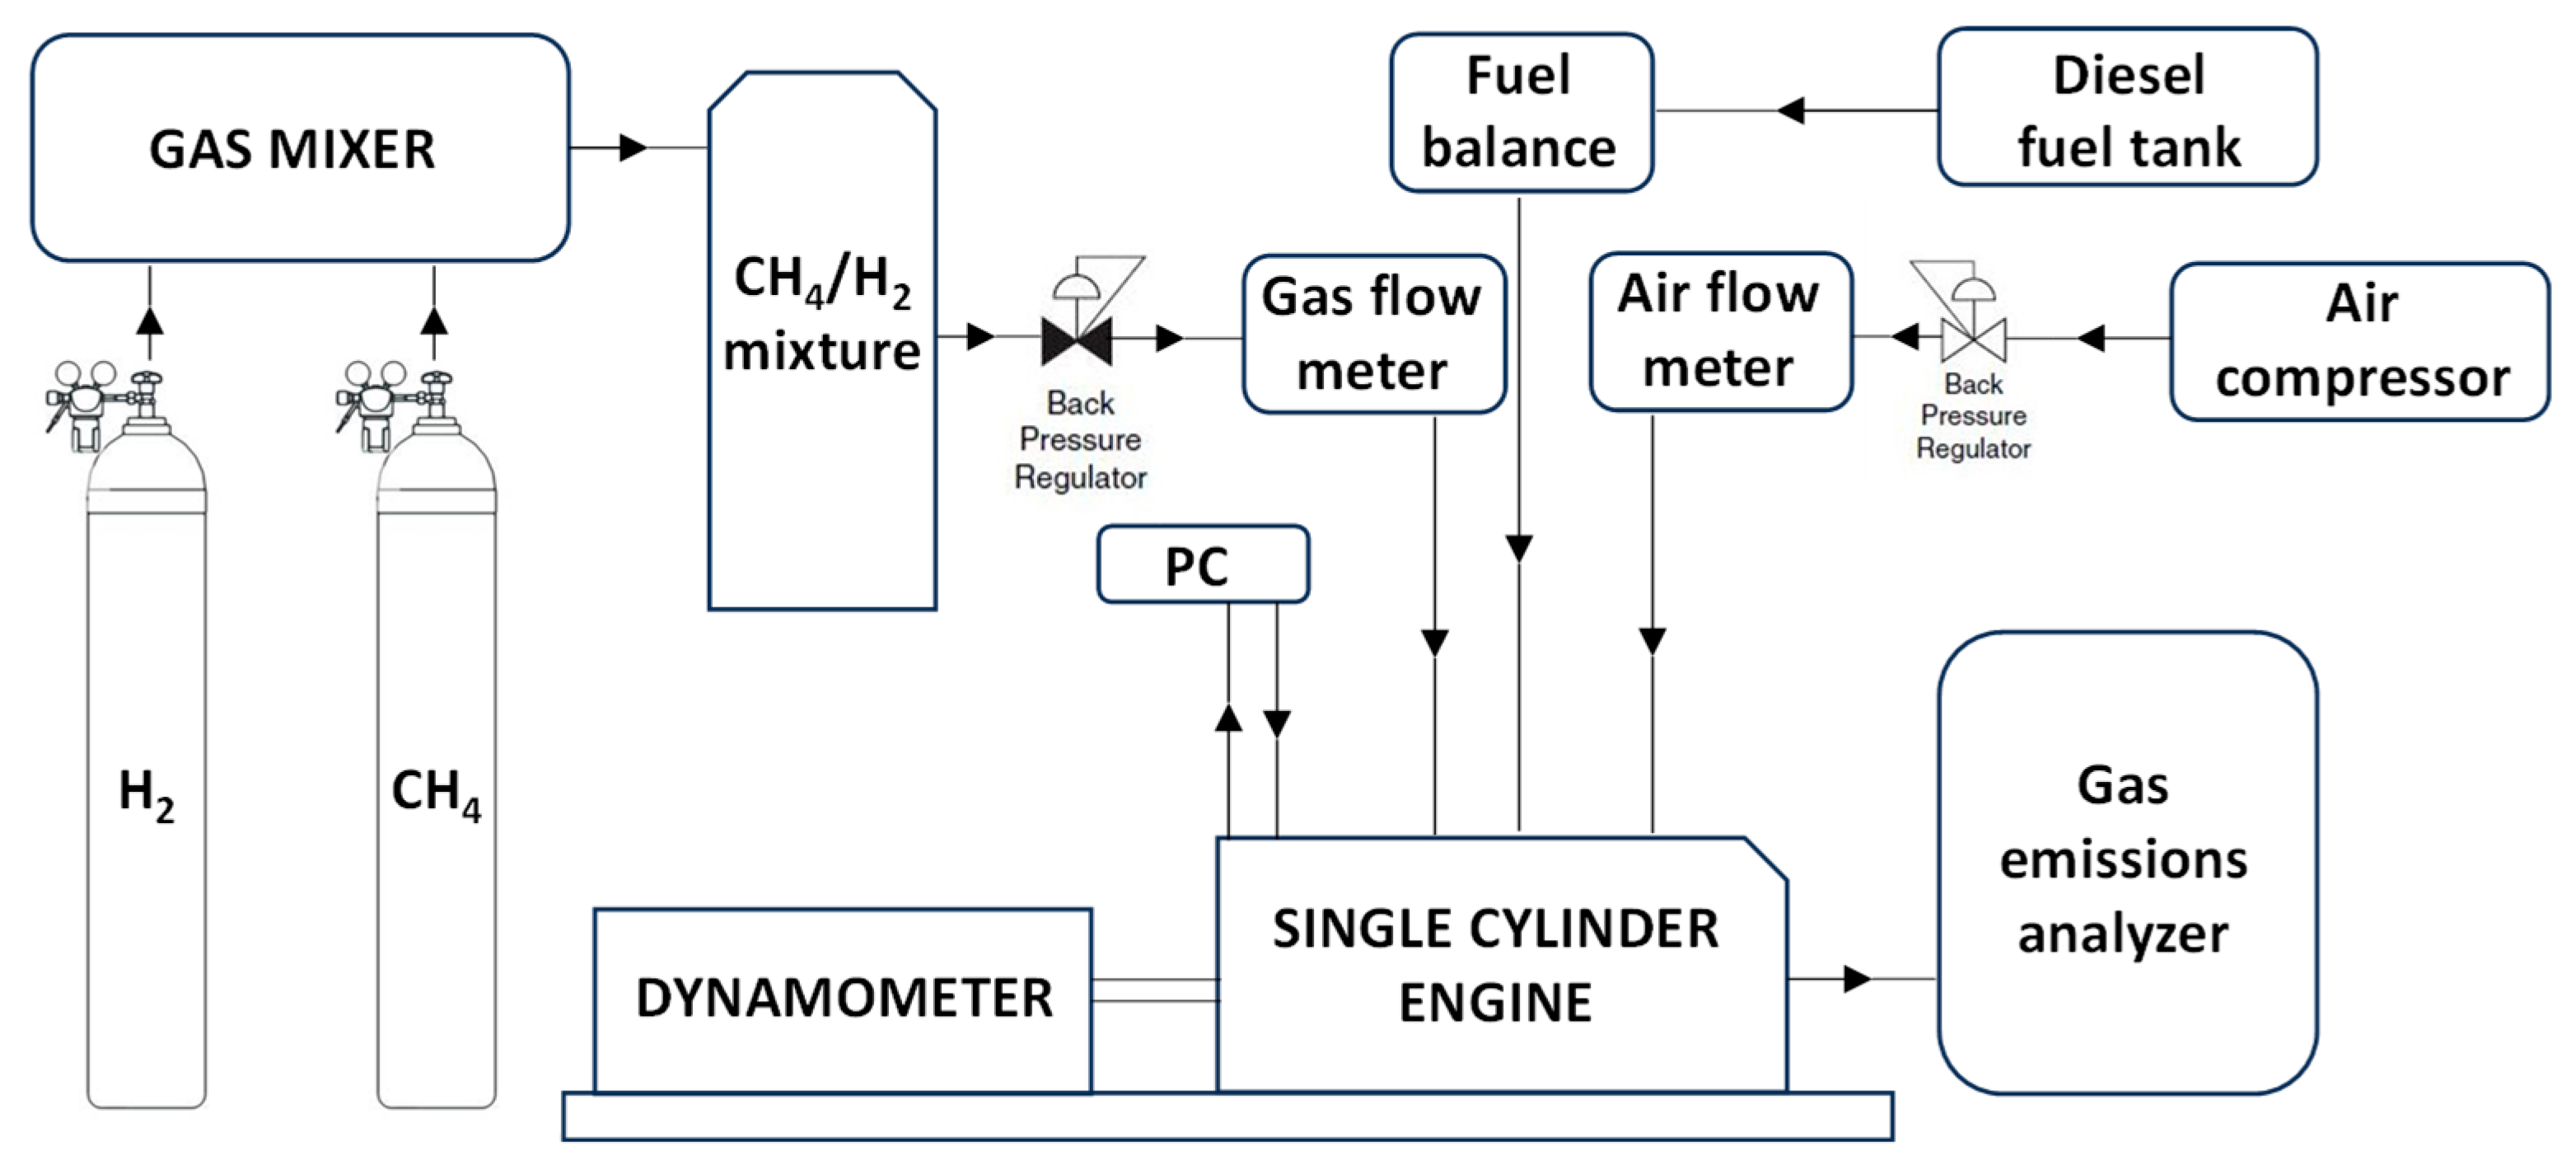
Figure 1 depicts the experimental setup. The tested engine is the single-cylinder, 4-stroke, common-rail diesel engine AVL model 5402 (AVL List GmbH, Graz, Austria). The main characteristics of the engine are reported in Table 1, while the experimental setup is shown in Figure 1.
In addition to the parameters—intake air pressure, methane substitution with H2, pilot injection pressure and timing—varied during the experimental campaign illustrated in [14], in this work, the impact of H2 percentage has been evaluated. An injector (see [17] for details) positioned along the engine’s intake duct introduces the gas (a mixture of methane and hydrogen in variable %), which then mixes homogeneously with the intake air before entering the cylinder through a swirling intake port and the intake valve.
The engine supercharging was obtained thanks to an external volumetric compressor ATLAS COPCO GA30 (ATLAS COPCO AB, Nacka/Stockholm, Sweden).
In-cylinder dynamic pressure was measured using a piezoelectric pressure sensor AVLQC33C (AVL List GmbH, Graz, Austria) and pegged using a Kistler piezoresistive sensor, model 4045A2 (Kistler GmbH, Winterthur, Switzerland). Data were acquired every 0.2 CAD for 250 consecutive cycles and then averaged. Based on absolute in-cylinder pressure (pcyl,abs), the gross heat release rate (HRR) was estimated as:
H R R ( C A D ) = k k 1 p c y l , a b s d V d ( C A D ) + 1 k 1 V d p c y l , a b s d ( C A D ) + d Q w d ( C A D )
where k is the ratio of constant pressure to constant volume-specific heats (assumed equal to 1.38), V is the instantaneous volume of the cylinder and Qw is the heat transferred to the cylinder walls. The term d Q w d ( C A D ) has been estimated as:
d Q w d ( C A D ) = A h t h c T T w
where Aht is the instantaneous heat exchange area, T is the instantaneous bulk temperature, determined using the state equation of perfect gases, and Tw is the temperature of the cylinder walls, set constant and equal to 600 K (suggested in the literature as average value of cylinder head, piston, and cylinder walls). The heat transfer coefficient, hc, was calculated using the Woschni model:
h c = 130 D 0.2 p c ( C A D ) 0.8 T c ( C A D ) 0.53 C 1 c m + C 2 V D T c , 1 p c , 1 V c , 1 p c ( C A D ) p c , m ( C A D ) 0.8
D is the cylinder bore, pc and Tc are the instantaneous in-cylinder pressure and temperature in fired conditions, cm is the mean piston speed, VD is the engine displacement, Tc,1, pc,1 and Vc,1 are the temperature, pressure and cylinder volume at Inlet Valve Closing (IVC), pc,m is the instantaneous in-cylinder pressure in motored conditions, and C1 and C2 are constants, respectively, equal to 2.28 and 3.24 × 10⁻³. Tc,1 has been set equal to 410 K, while in-cylinder temperature traces were derived from in-cylinder pressure curves, calculated using the state equation of perfect gases and assuming constant the mass trapped in the cylinder during compression and expansion strokes.
Once HRR(CAD) is known, it is possible to estimate its peak value and the related CAD, as well as CAD at which the heat released from the combustion beginning is 10% of overall heat released during one engine cycle.
Based on pcyl,abs measurement, the indicated power Pi was estimated as:
P i = c y c l e p c y l , a b s d V n n R
where n is the engine speed, while nR is the number of crank revolutions per power stroke (equal to 2 for a 4-stroke engine). Diesel fuel mass flow rate, m ˙ d , was measured using an AVL 733S Fuel Balance (AVL List GmbH, Graz, Austria). The gaseous fuel flow rate, m ˙ g f , was measured using a thermal flow controller Aalborg Instruments and Controls Inc., model DFC 36 (Aalborg Instruments & Controls, Inc., Orangeburg, NY, USA), whose output was rectified in order to take into account the composition and the density of the gas mixture under test. The Percentage Energy Substitution (PES) was then calculated as:
P E S = m ˙ g f   H i , g f m ˙ d   H i , d + m ˙ g f   H i , g f
where H i , d and H i , g f are the lower calorific values, respectively, of diesel (44.4 MJ/kg) and gaseous fuel (see Table 1).
Indicated fuel conversion efficiency (ηf) has been calculated as:
η f = P i m ˙ d   H i , d + m ˙ g f   H i , g f
An AVL AMA i60 emission analyzer (AVL List GmbH, Graz, Austria) was used in order to measure emission levels of gaseous regulated pollutants like indicated specific nitric oxides (ISNOx), hydrocarbons (ISHC), and carbon monoxide (ISCO). Measured levels have been converted in g/kWh as indicated on SAEJ1003 standard [18]. Particulate matter was not measured since it has been shown by the same Authors in a previously published paper [15] that dual-fuel combustion with methane/hydrogen mixture as low reactivity fuel fumigated along the intake duct and ignited by a late pilot injection determines very low levels of particulate matter. In Table 2, the error associated with each experimental device is reported.
In ICE fed with methane (and hydrogen) fumigated along the intake duct, a small portion of methane (and hydrogen) can flow directly from the intake to the exhaust valve during the valve overlap, i.e., the angular (or time) interval during which both valves are open. This phenomenon, referred to as methane (and hydrogen) slip, can determine significant emissions of methanic hydrocarbons and hydrogen directly at the exhaust. While surely present on the engine under test, these species have not been measured. However, their levels at the exhaust mainly depend on angular interval of overlap and engine speed. Both these parameters have not been varied during tests; therefore, it can be argued that the impact of methanic hydrocarbons and hydrogen emissions due to slip is the same for all tested conditions.
Table 1 reports the experimental factors and the related levels set during the experiments. The heat introduced per cycle was fairly constant despite the variation in gaseous fuel composition. Moreover, PES was equal to about 75%.
During the experimental campaign, the Coefficient of Variance (CoV) associated with maximum in-cylinder pressure peak over 250 cycles was also calculated, since values higher than 5% are generally considered unacceptable and, in the literature [19,20], it is reported that early and late injections lead to higher CoV. In particular, in the present Design of Experiments, several operating conditions characterized by SOI = −2.5 CADBTDC and SOI earlier than 35 CADBTDC exhibited CoV > 5%. Therefore, in the following section, data relating to those operating conditions have not been plotted.

3. Results and Discussion

3.1. Combustion Analysis

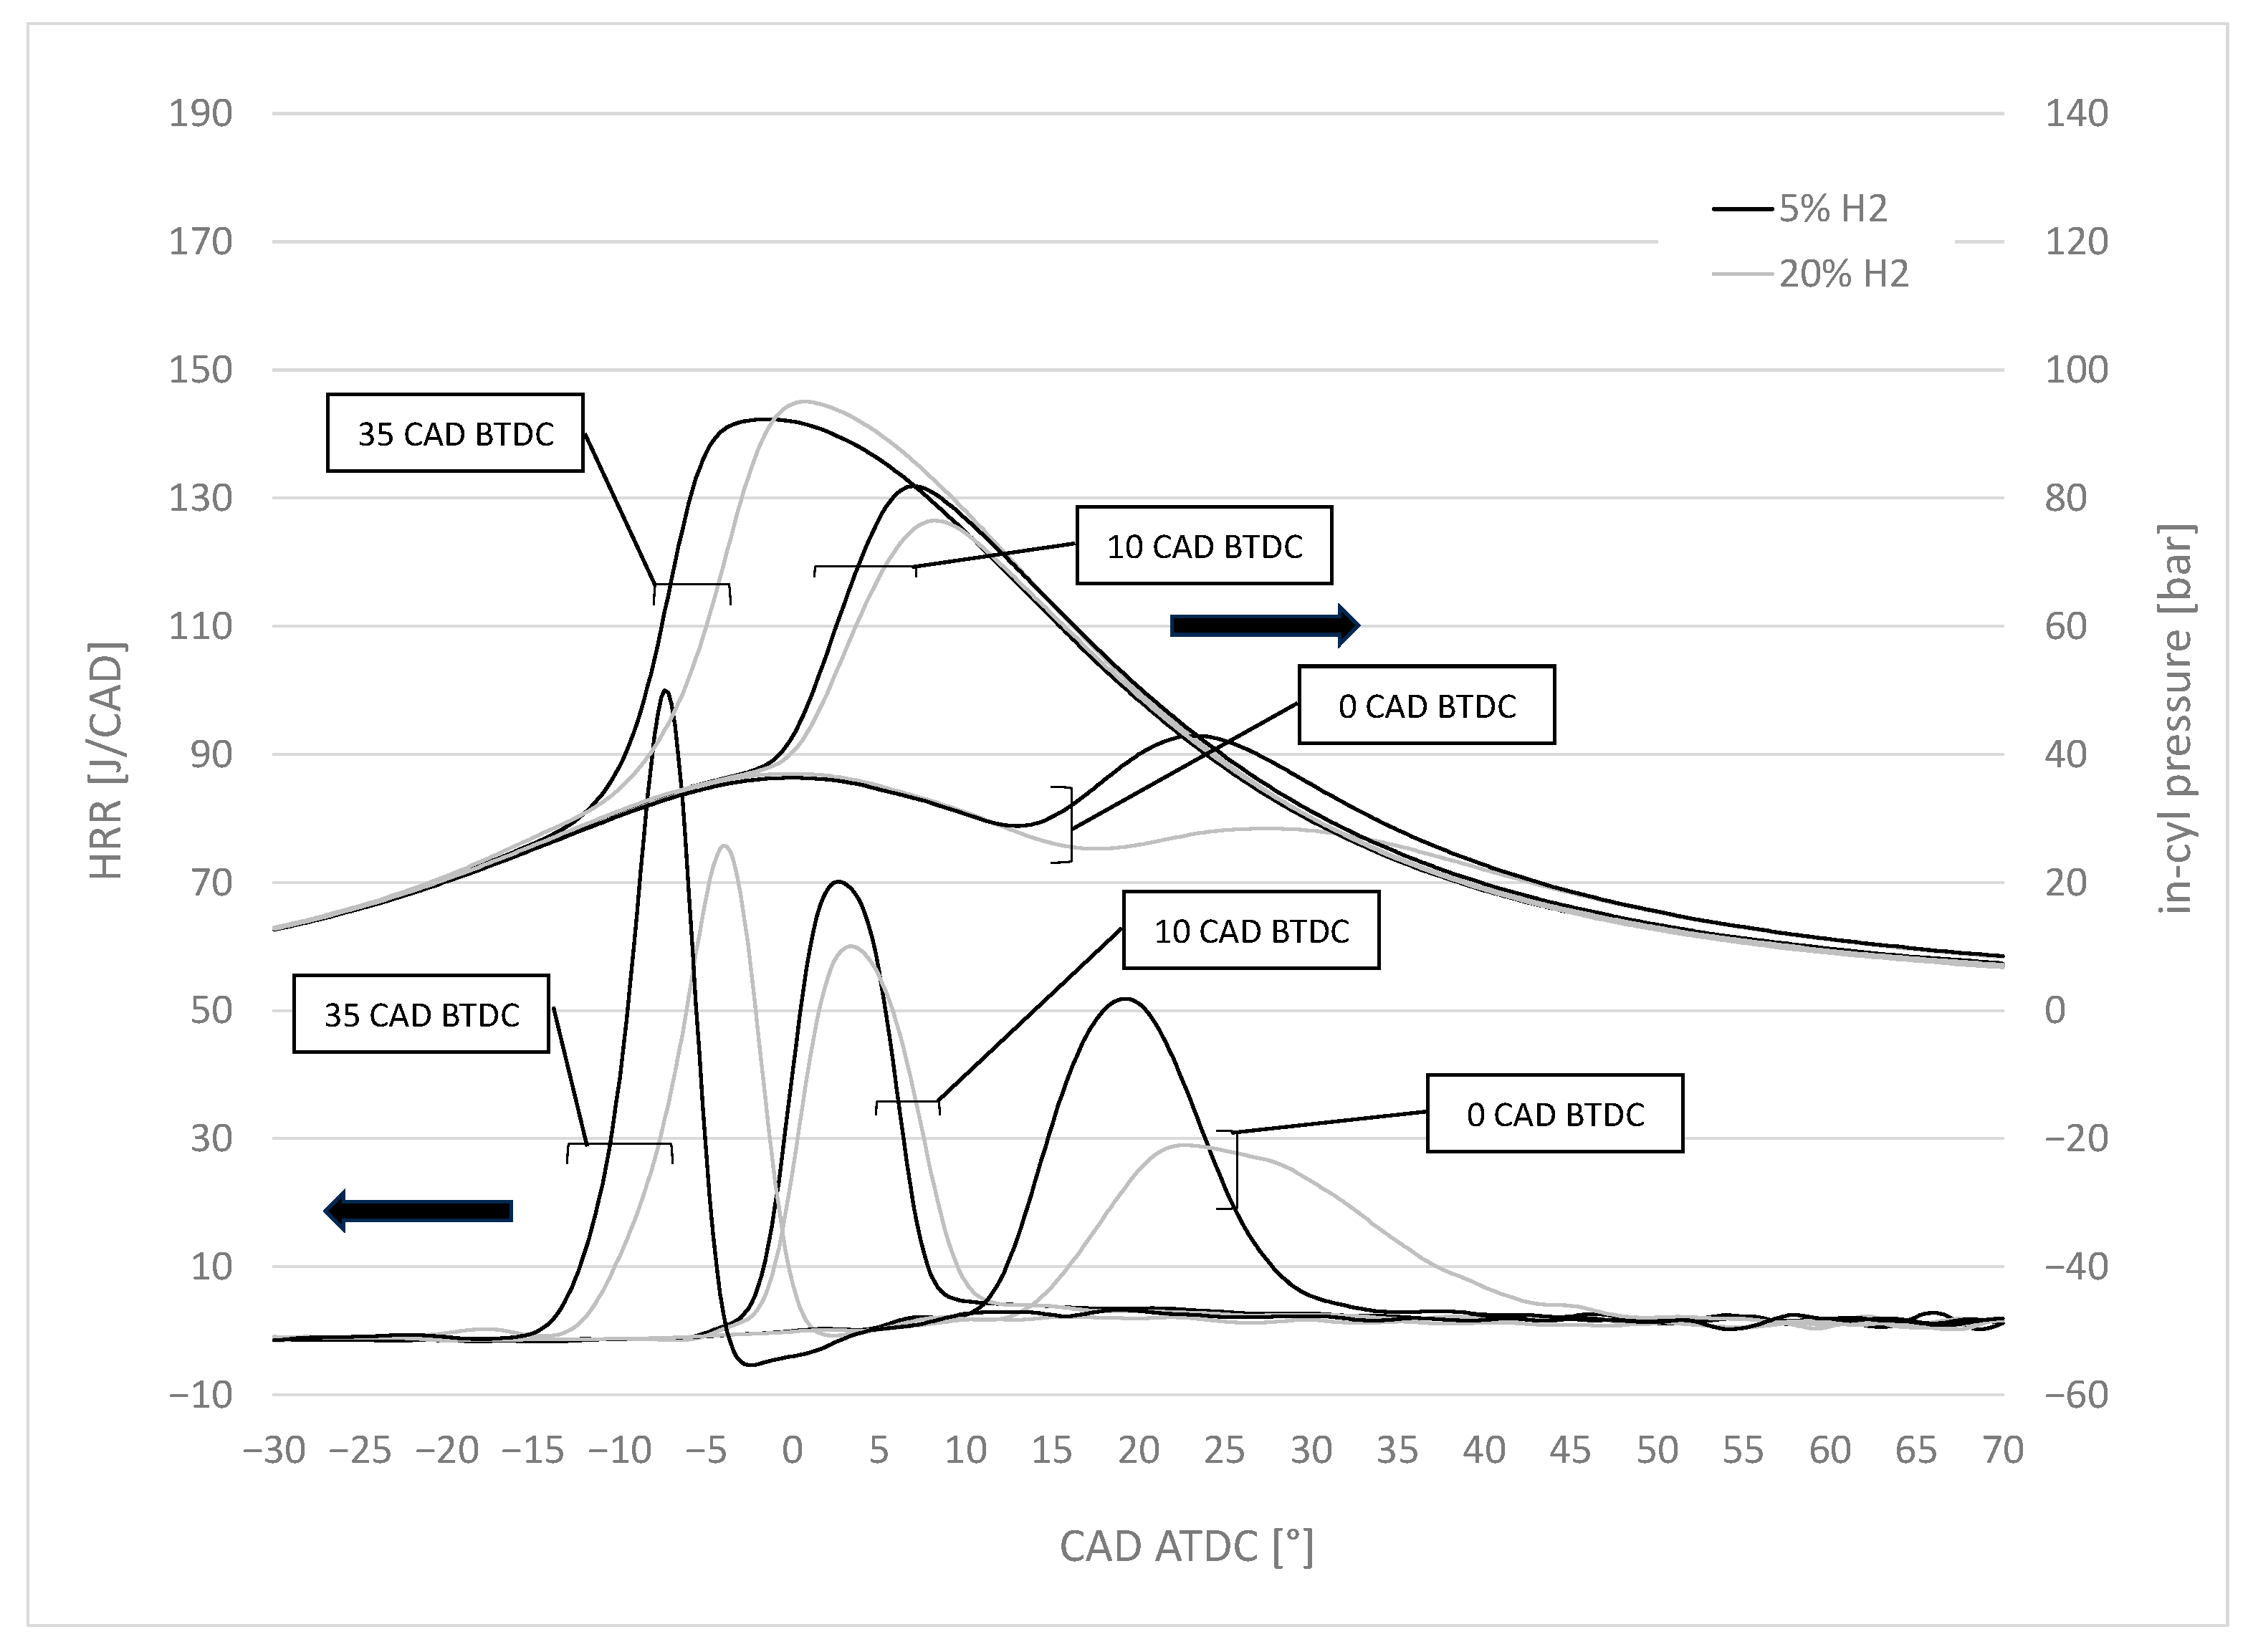
Figure 2 shows the effect of SOI delay at different H2 percentages on in-cylinder pressure and corresponding HRR traces acquired in NA conditions and with a PIP = 1000 bar. When SOI is 35 CAD BTDC, the HRR shows a shape characteristic of premixed combustion. This shape, already reported associated with dual-fuel operation with advanced pilot injection [21,22], does not change when SOI is further advanced. With 5% H2, combustion starts earlier, is characterized by a higher HRR peak, and is shorter than with 20% H2. When SOI is delayed (10 and 0 CAD BTDC), combustion is characterized by a shorter ignition delay, a lower HRR peak, and a longer combustion duration. In these cases as well, the effect of increasing H2 percentage is to delay combustion, reduce the HRR peak, and increase combustion duration.
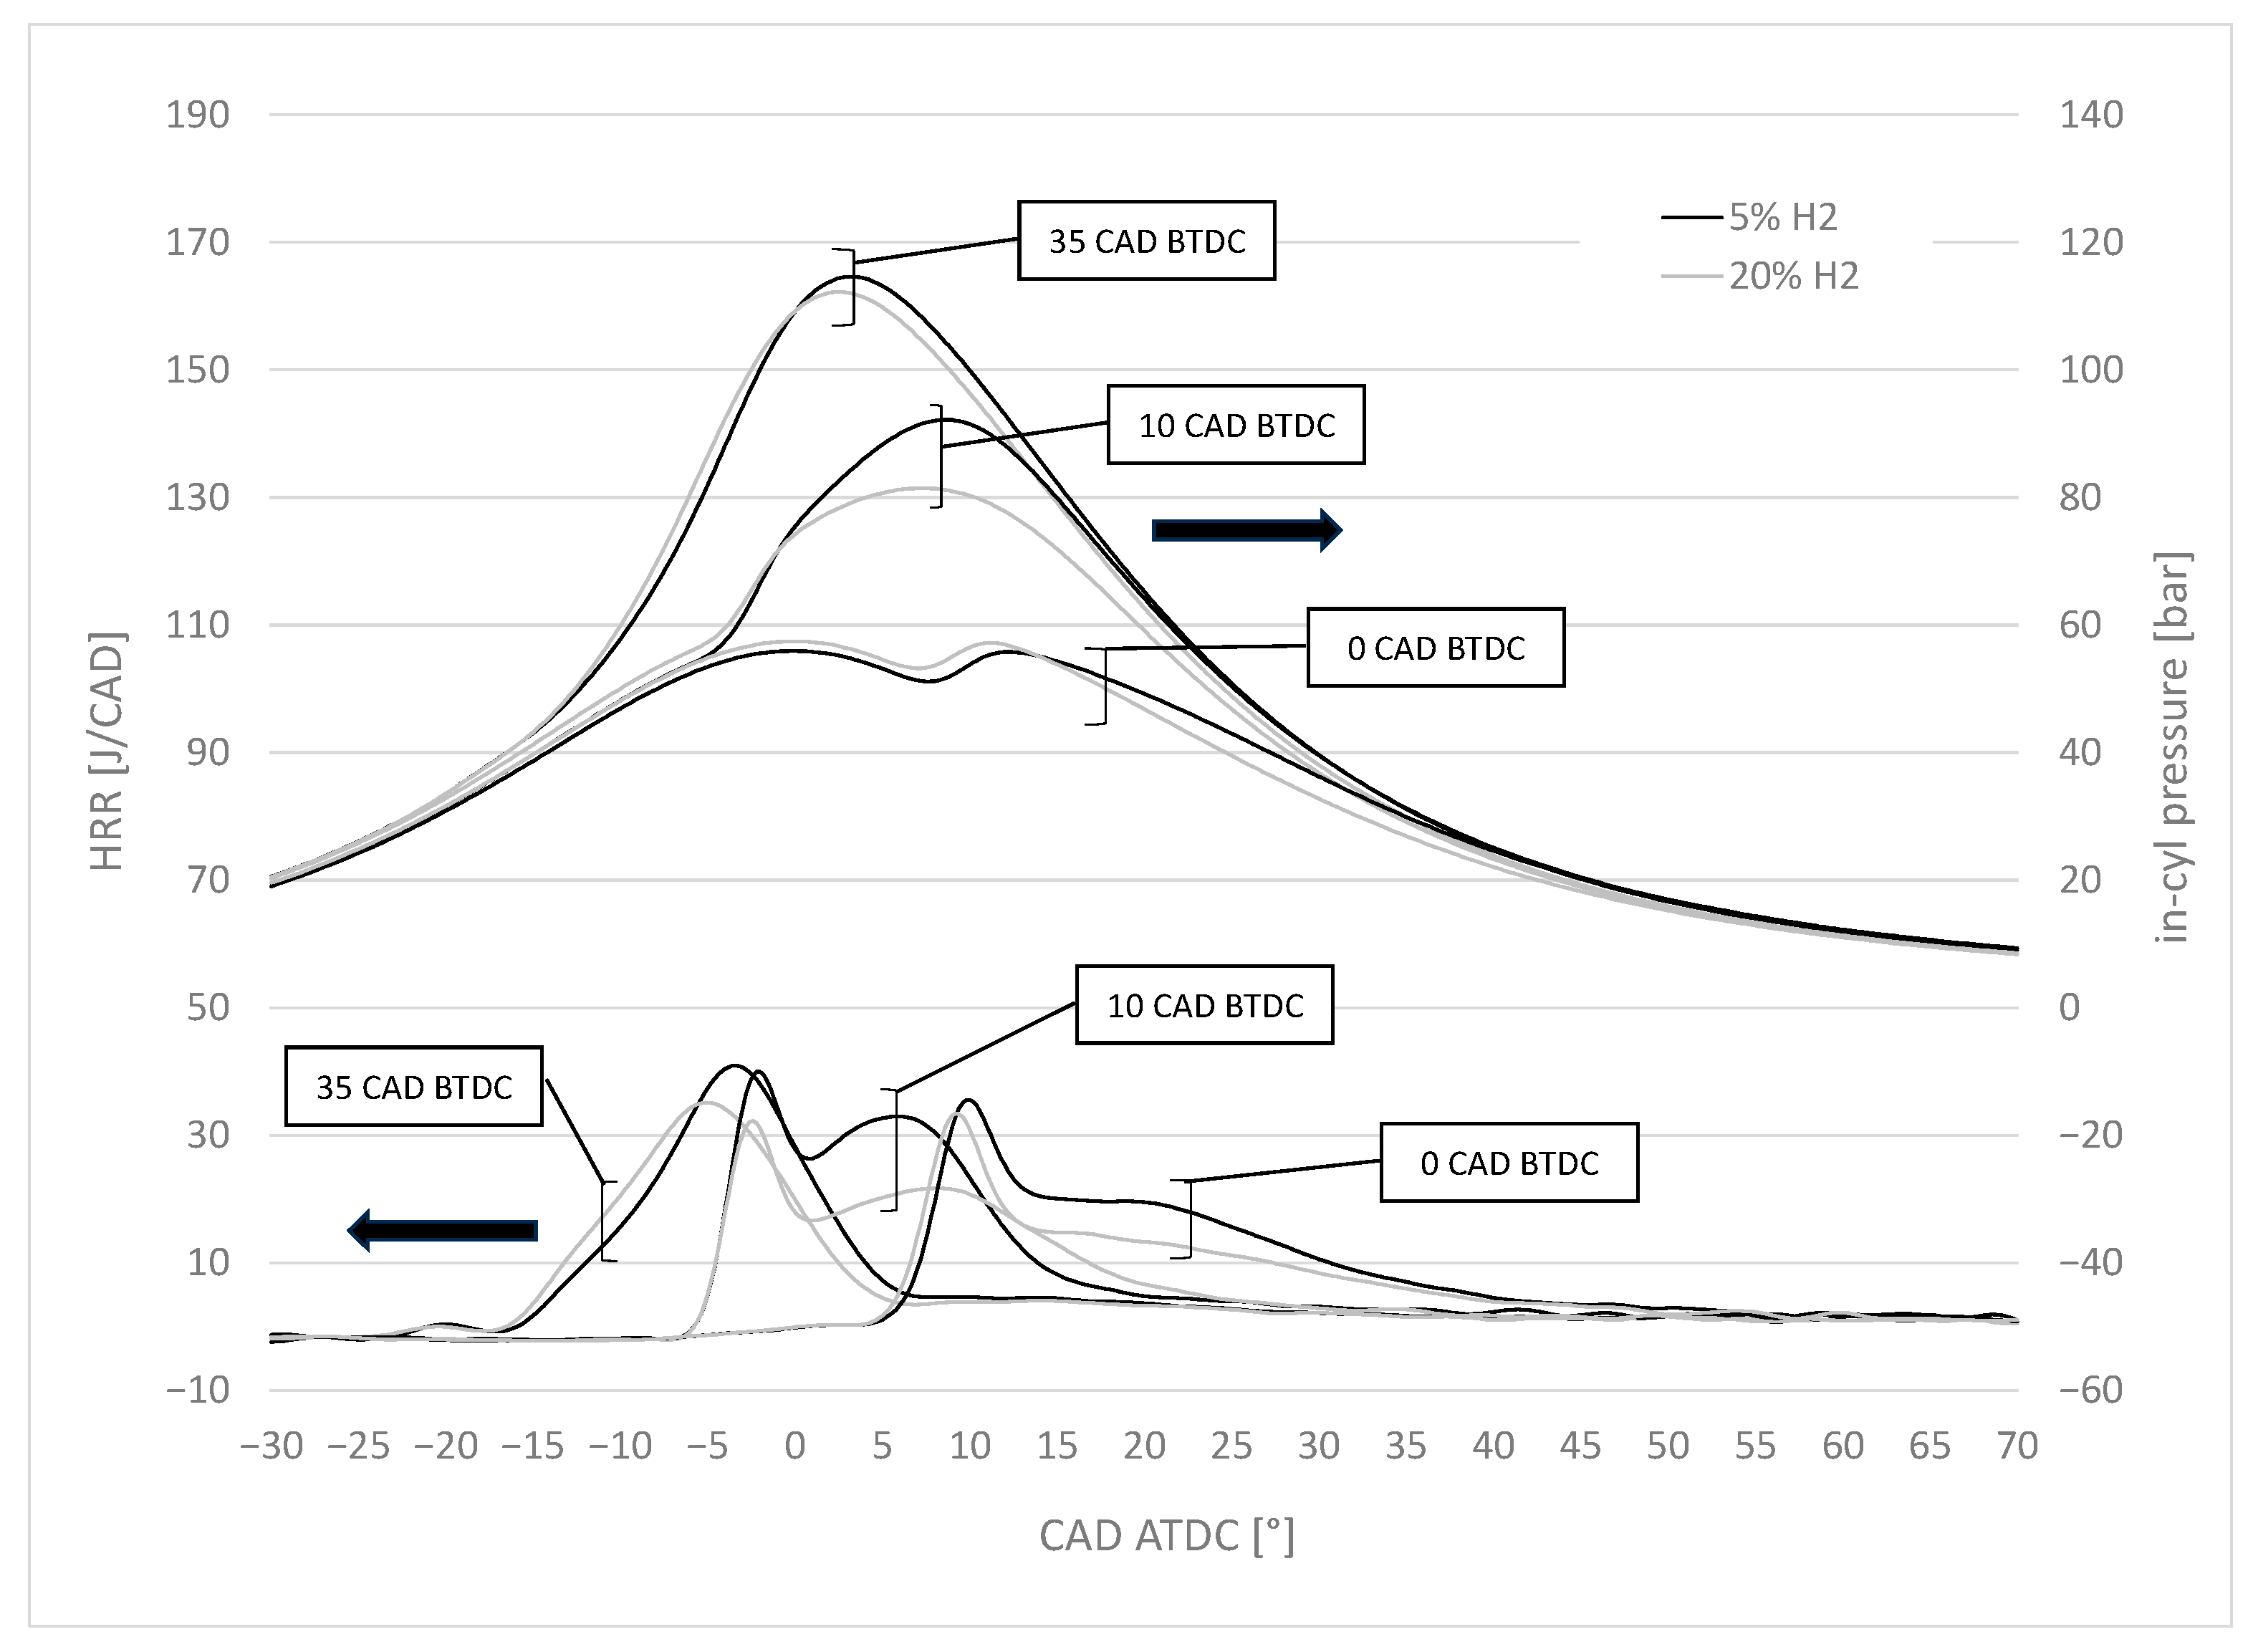
The comparison of Figure 2 and Figure 3 allows the effect of supercharging the engine to be evaluated. In fact, apart from the air mass trapped in the cylinder, the traces shown in Figure 3 have been obtained while keeping unchanged all the other parameters used for obtaining the data reported in Figure 2. In SC conditions (Figure 3), advanced SOI leads to a HRR with a shape still related to premixed combustion. However, compared to previous results, in this case, it is evident that the HRR peak is significantly reduced and combustion duration is increased. Moreover, heat release starts earlier compared to NA conditions and at higher H2 percentages. Delaying SOI, however, determines a significant variation in HRR shape. In particular, it is possible to notice that, for both H2 percentages tested, the HRR is characterized by a first premixed combustion phase followed by a diffusive queue. The premixed peak is significantly lower than in NA conditions. Consequently, combustion duration is higher. The effect of increasing H2 percentage is to slightly advance combustion and reduce the HRR peak, while combustion duration remains comparable.
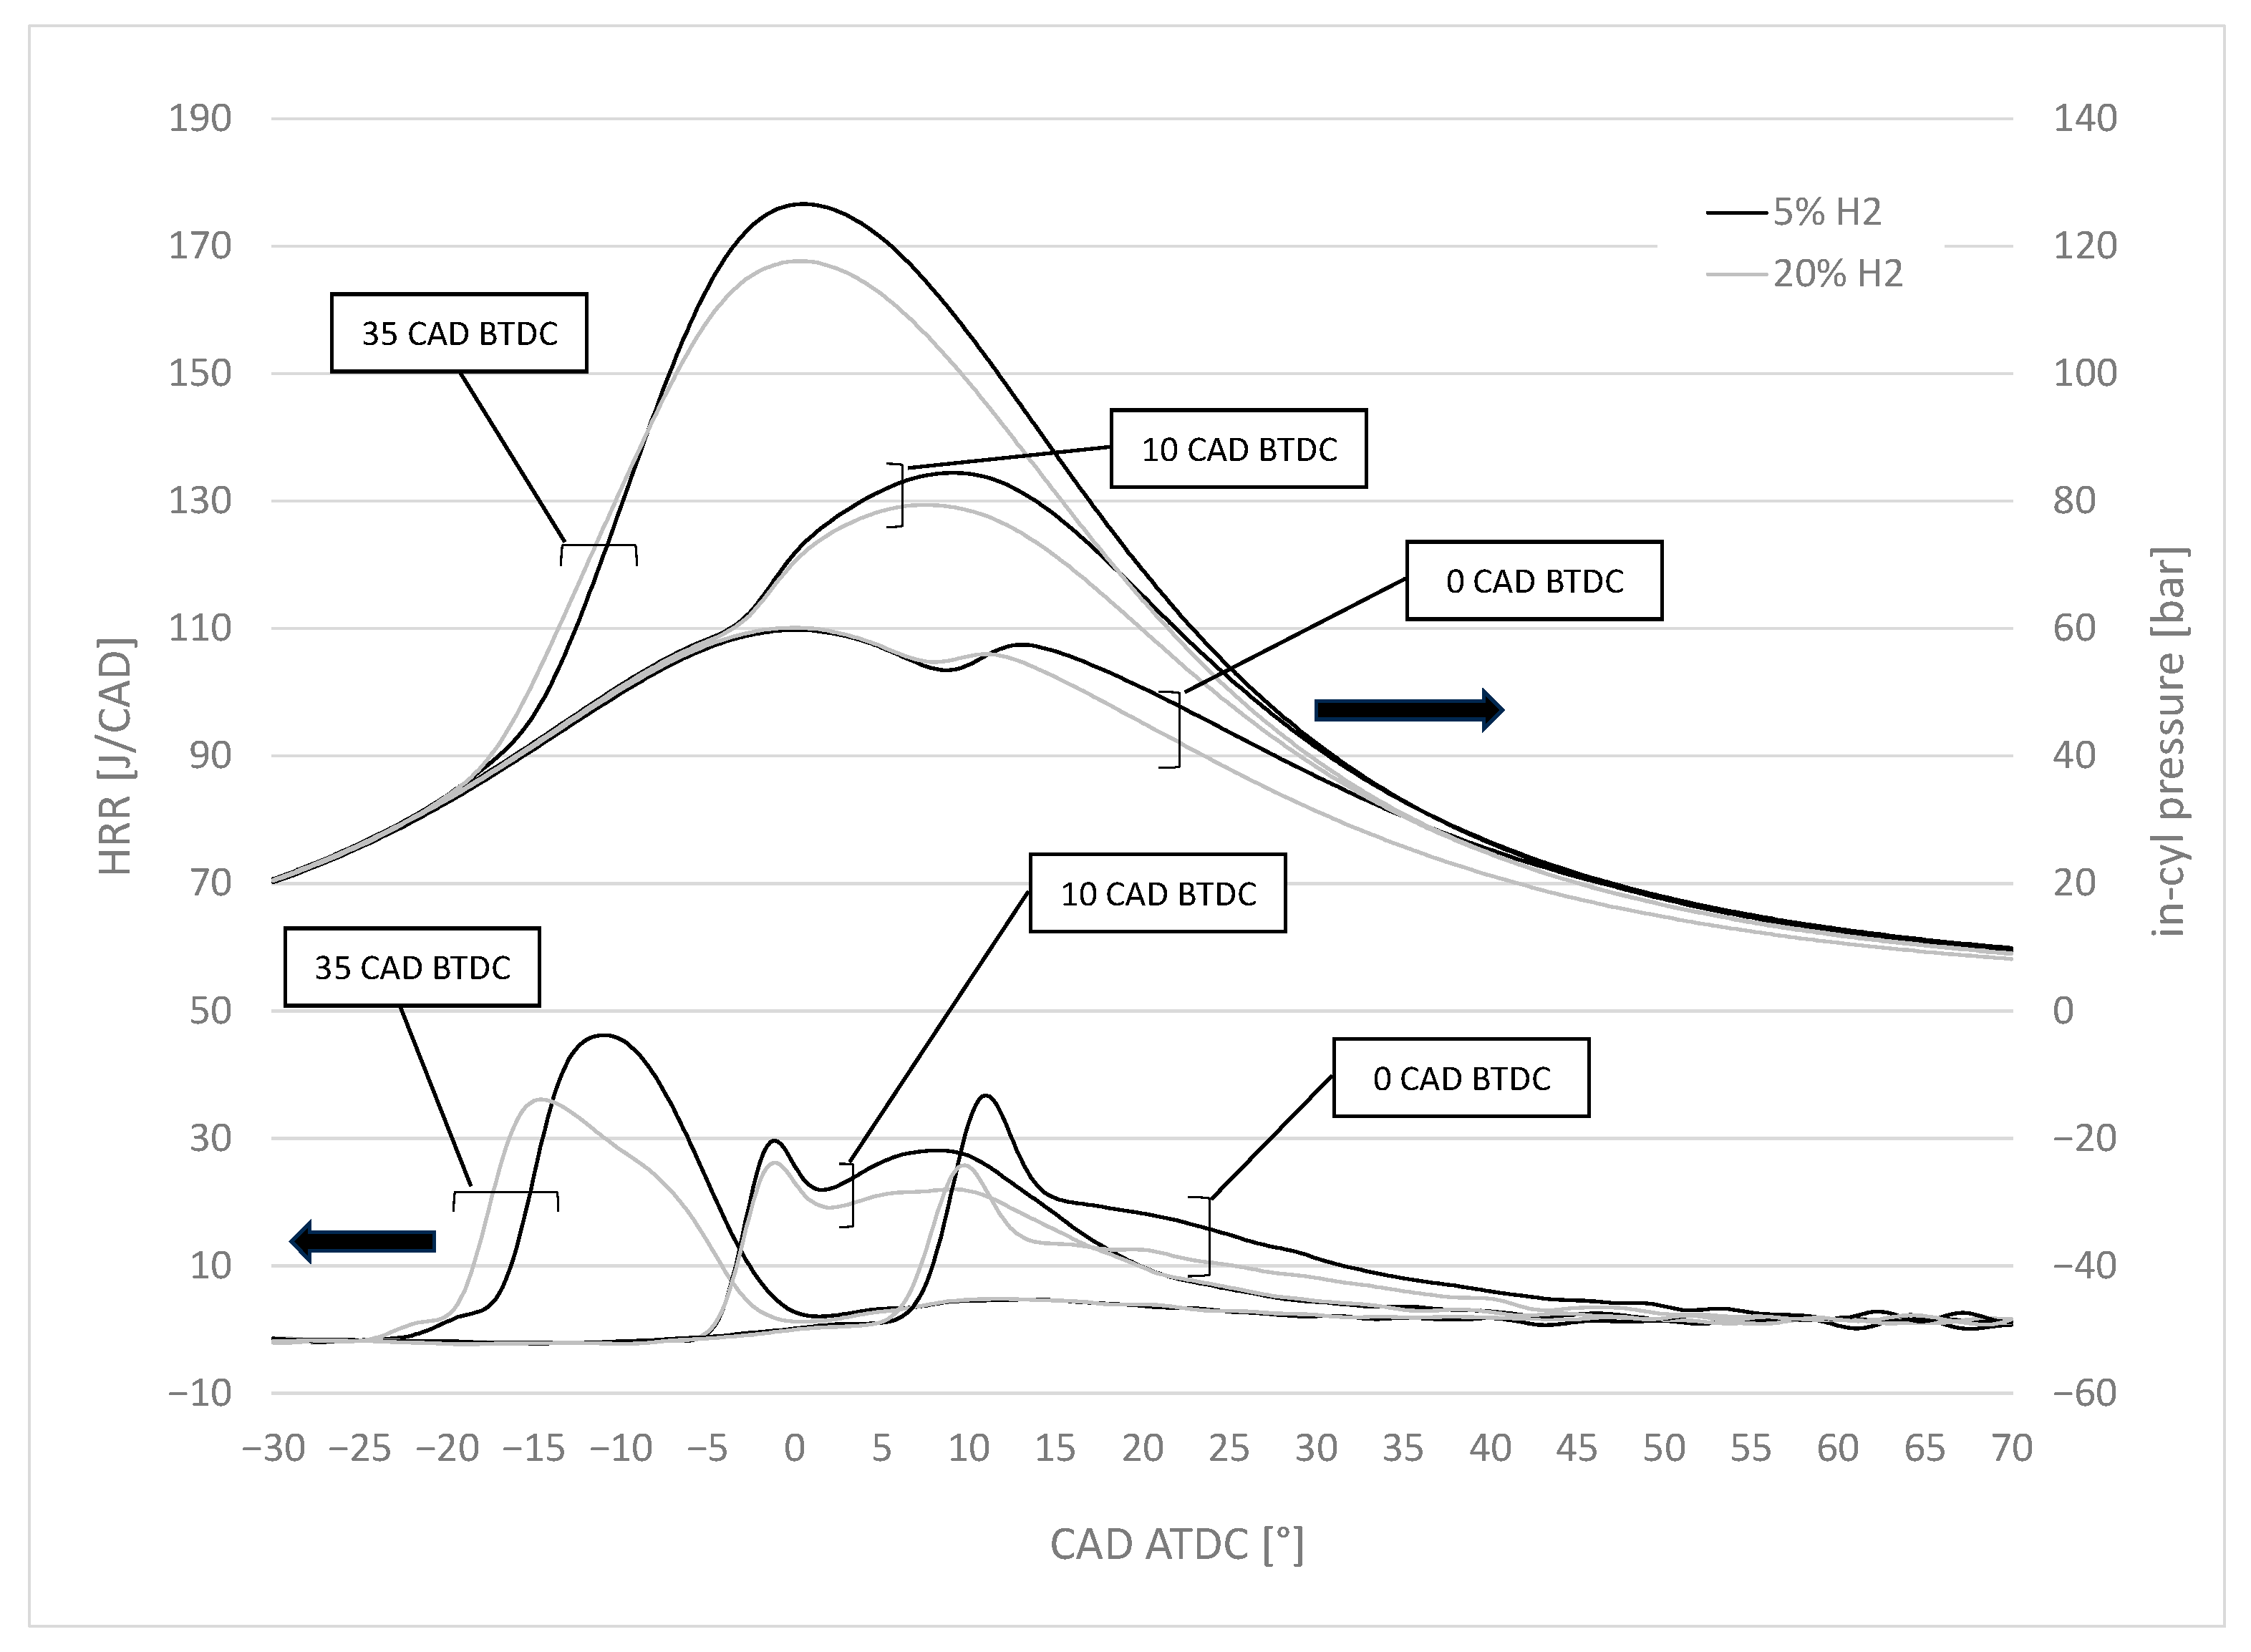
Finally, comparing Figure 3 and Figure 4, it is possible to evaluate the effect of PIP, decreased to 500 bar in Figure 4, while keeping constant all the other parameters with respect to the data reported in Figure 3. The results indicate that the differences determined by a reduction in pilot injection pressure are negligible compared to the effect determined by the variation in the other parameters previously analyzed.
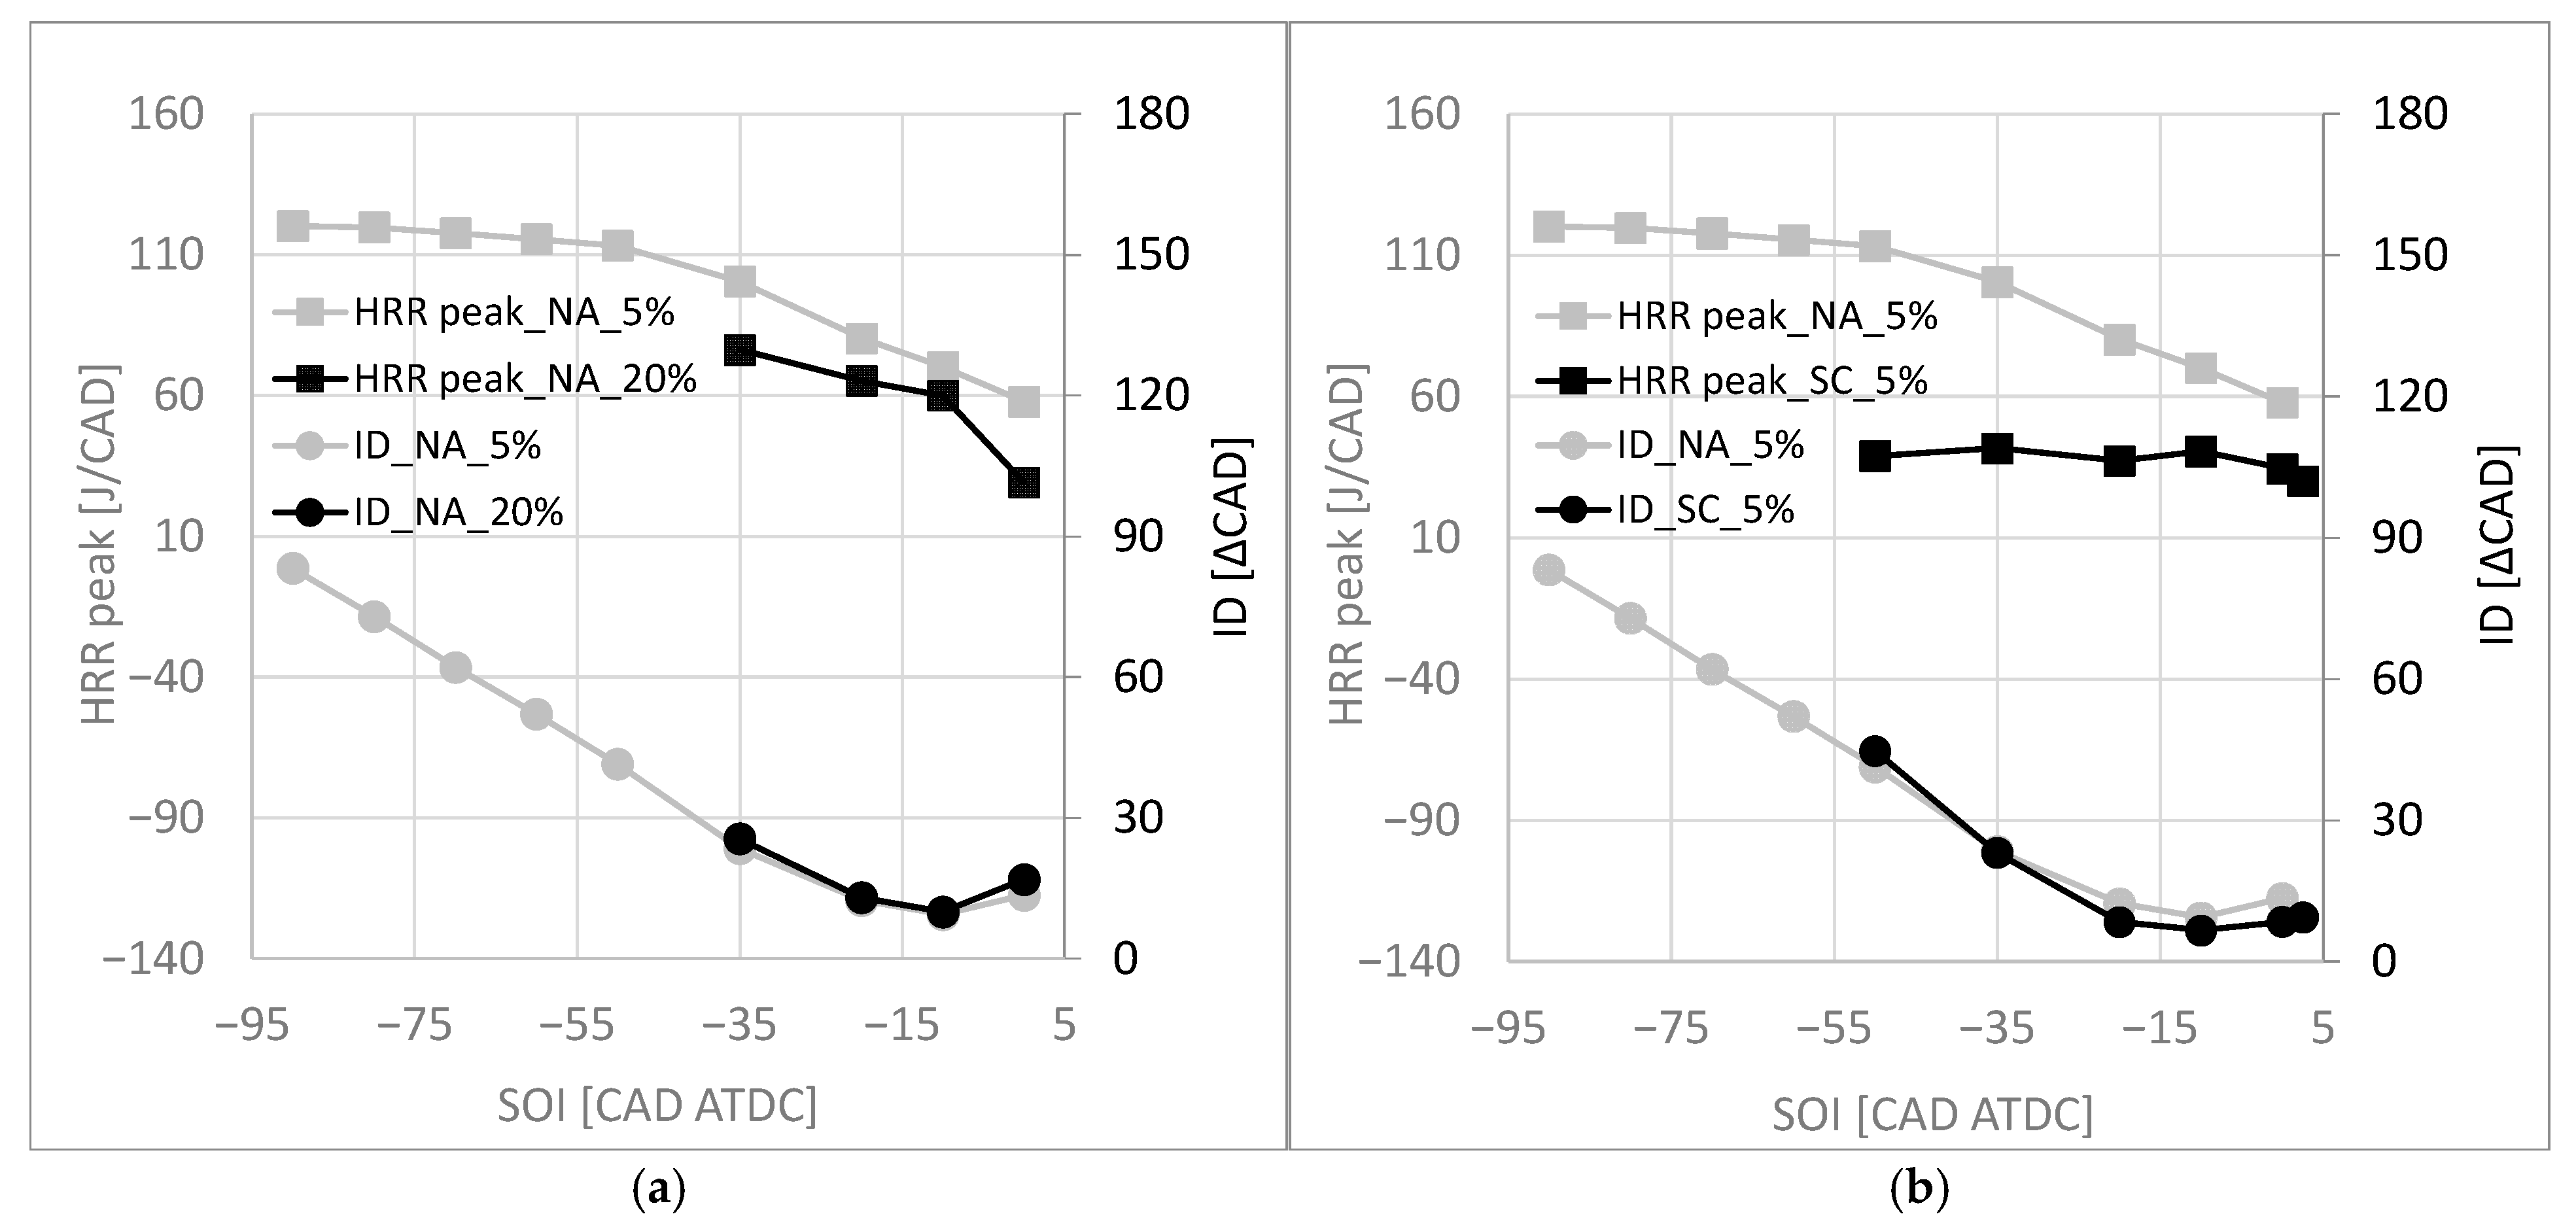
In Figure 5, the descriptive analysis of Figure 2 and Figure 3 is quantified, reporting the peak of HRR and the Ignition Delay (ID), defined as the angular interval between SOI and the CAD at which 10% of the overall fuel heat has been released.
In particular, in Figure 5a, data related to tests run in NA conditions, PIP = 1000 bar, and H2% = 5% and 20% are compared, while, in Figure 5b, data related to tests run with H2% = 5%, PIP = 1000 bar, and NA and SC conditions are compared. Figure 5a shows that HRR decreases with delayed SOI. ID decreases with delayed SOI as well; however, for very delayed values, ID inverts the previous trend. The effect of H2% increase from 5% to 20% is to reduce the HRR peak and slightly increase ID. Figure 5b illustrates that supercharging the engine (SC conditions) determines a reduction in HRR peak compared to NA conditions while keeping unchanged the dependence on SOI. The effect of SOI on ID in SC conditions is a decreasing then increasing trend with delayed SOI, as for NA conditions. Moreover, supercharging the engine leads to shorter ID with conventional and late SOI, while the opposite can be observed for early SOI.
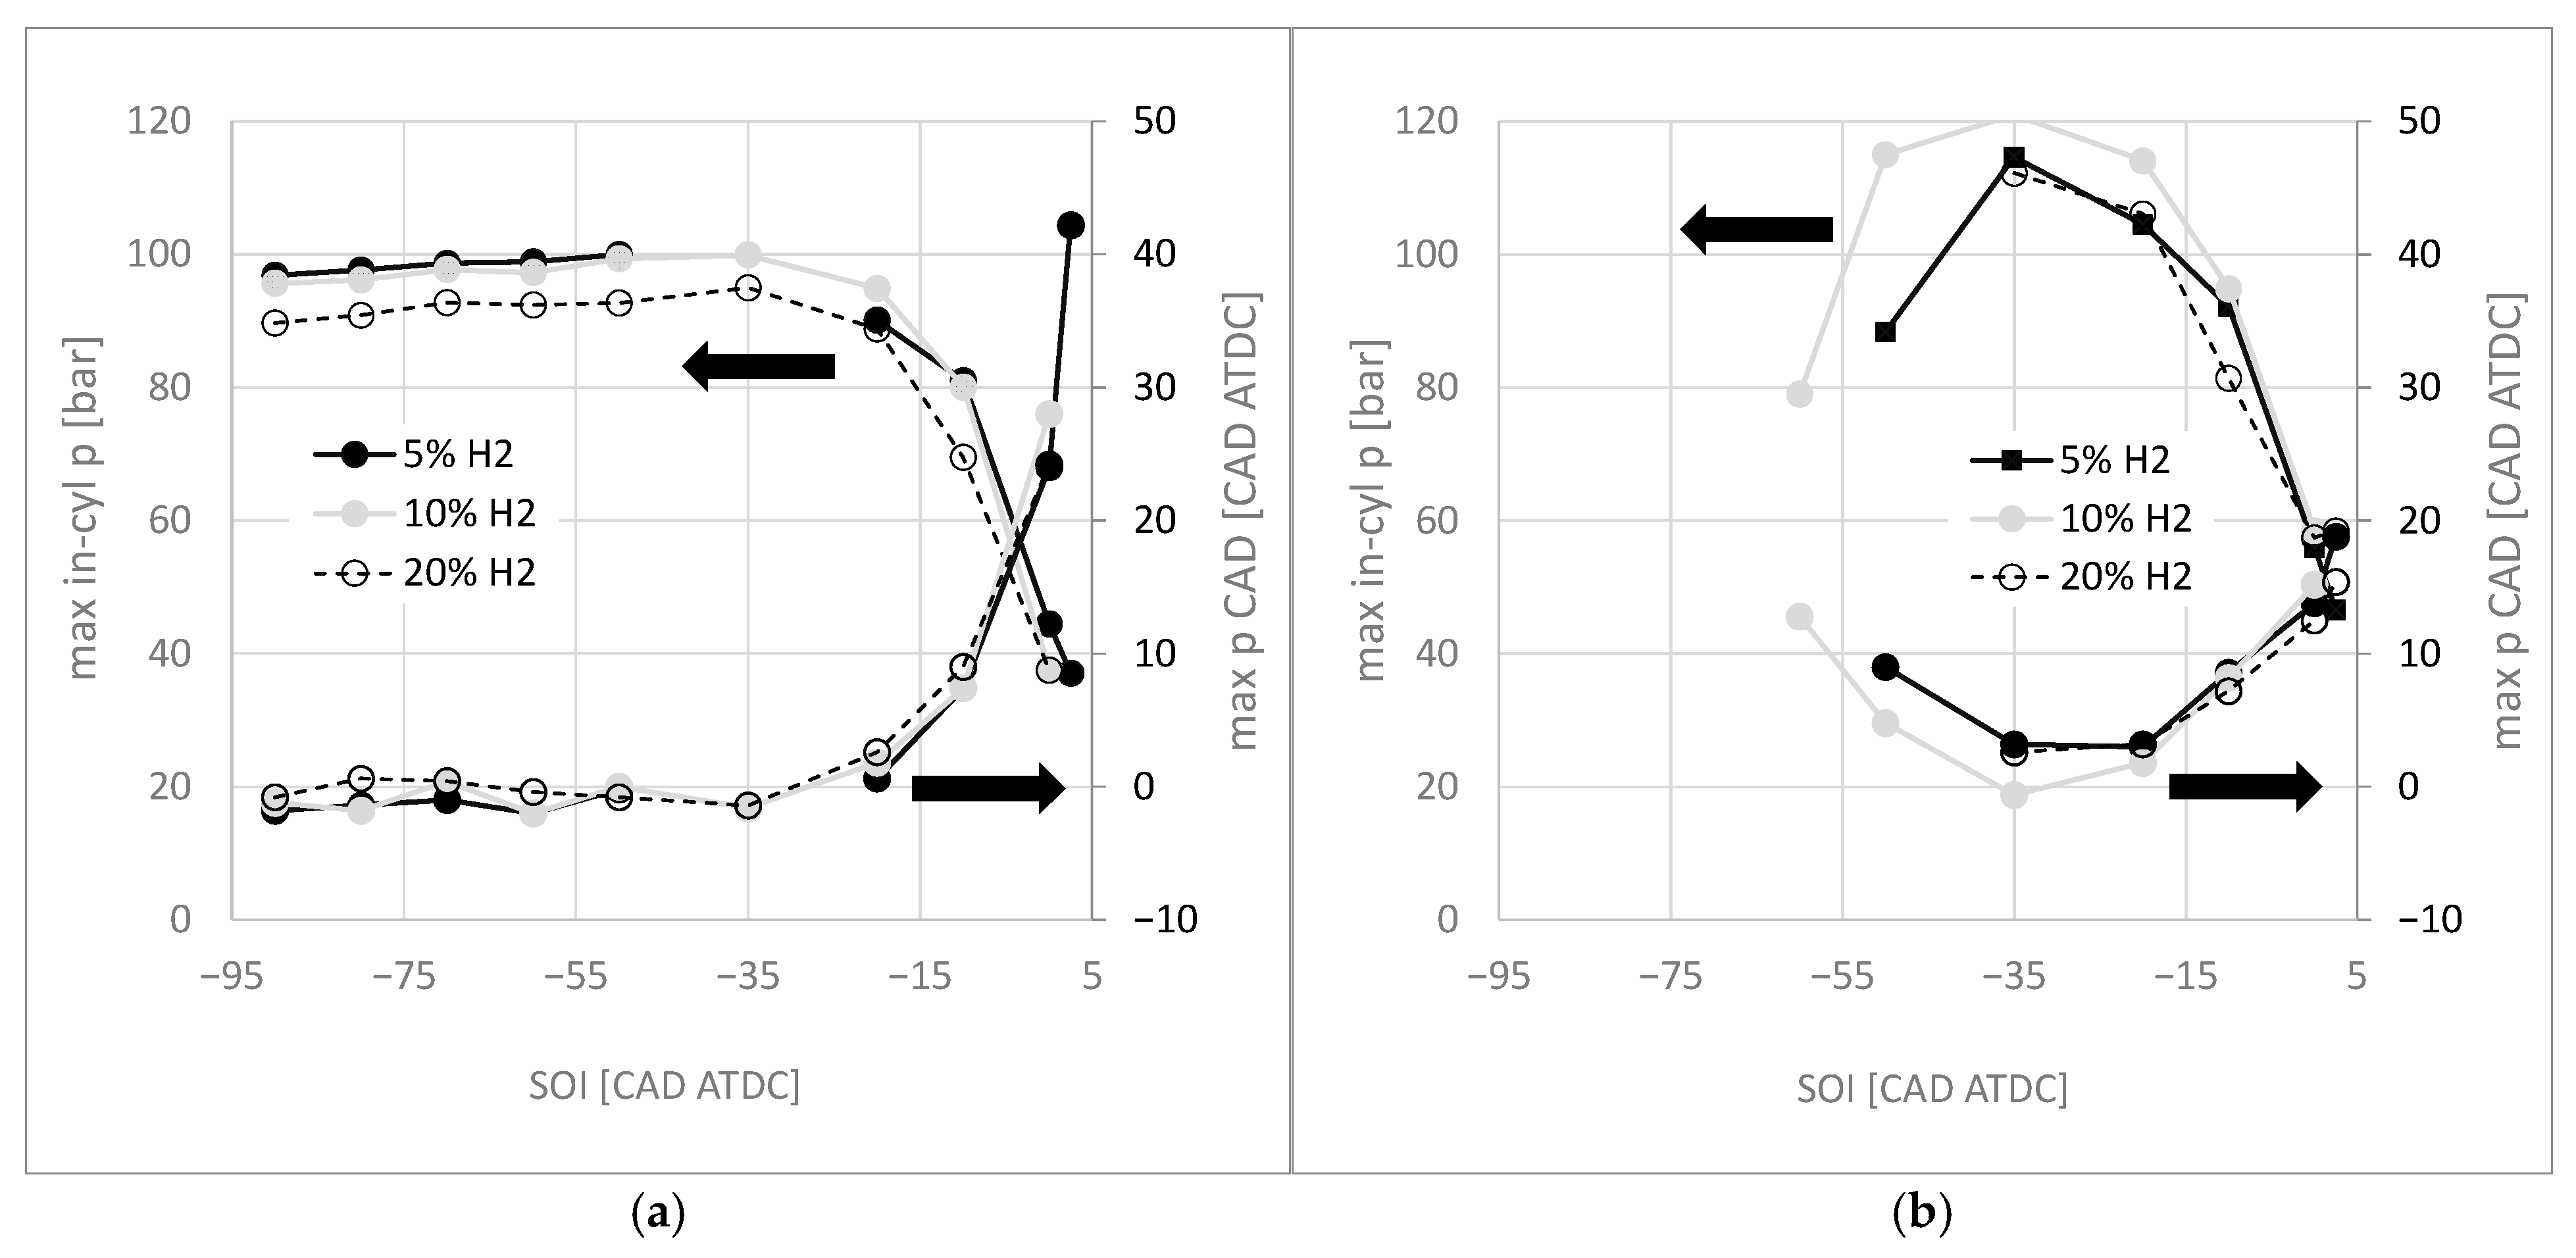
In Figure 6, the maximum in-cylinder pressure and related CAD are shown as a function of SOI and for different H2 percentages. In particular, Figure 6a shows data related to NA conditions and PIP = 500 bar, while Figure 6b illustrates data related to SC conditions and PIP = 1000 bar. In NA conditions (Figure 6a), maximum in-cylinder pressure does not vary significantly from early to conventional SOI, while a remarkable reduction is observed with SOI from conventional to late. At the same time, CAD related to maximum in-cylinder pressure does not change significantly from early to conventional SOI, while a remarkable increase (indicating a delayed combustion) is observed, further delaying SOI. Supercharging the engine modifies slightly this behaviour. In fact (Figure 6b), the first difference with NA conditions is that SOI range with stable operation is narrower. Moreover, moving from early to conventional SOI, an increase in maximum in-cylinder pressure and a reduction in CAD-related angle (indicating advanced combustion) is observed. Delaying SOI further determines a behaviour similar to that analyzed in NA conditions. The effect of H2 percentage increase from 5% to 20% in NA conditions is to reduce in-cylinder pressure peak as H2 percentage increases. In SC conditions, on the other hand, in-cylinder pressure peaks first increase (from 5% to 10%) and then decrease (from 10% to 20%). The reduction in in-cylinder pressure peak with increasing H2 percentage in methane–hydrogen mixtures in dual-fuel engines has been reported in other works [15,23,24,25]. The effect of methane substitution with H2 in compression ignition engines on combustion development is still investigated and not fully understood. It depends on many factors, such as PES, air-to-fuel ratio, H2 percentage, and spatial distribution of high-reactivity fuel in the combustion chamber. In particular, in the conditions proposed in this work, characterized by high values of PES and low values of H2 percentage, the effect of H2 is to inhibit fuel autoignition, thus leading to the observed reduction in maximum in-cylinder combustion pressure. Concerning the SOI effect, late timings lead combustion to develop during the expansion stroke, thus resulting in lower peak values.
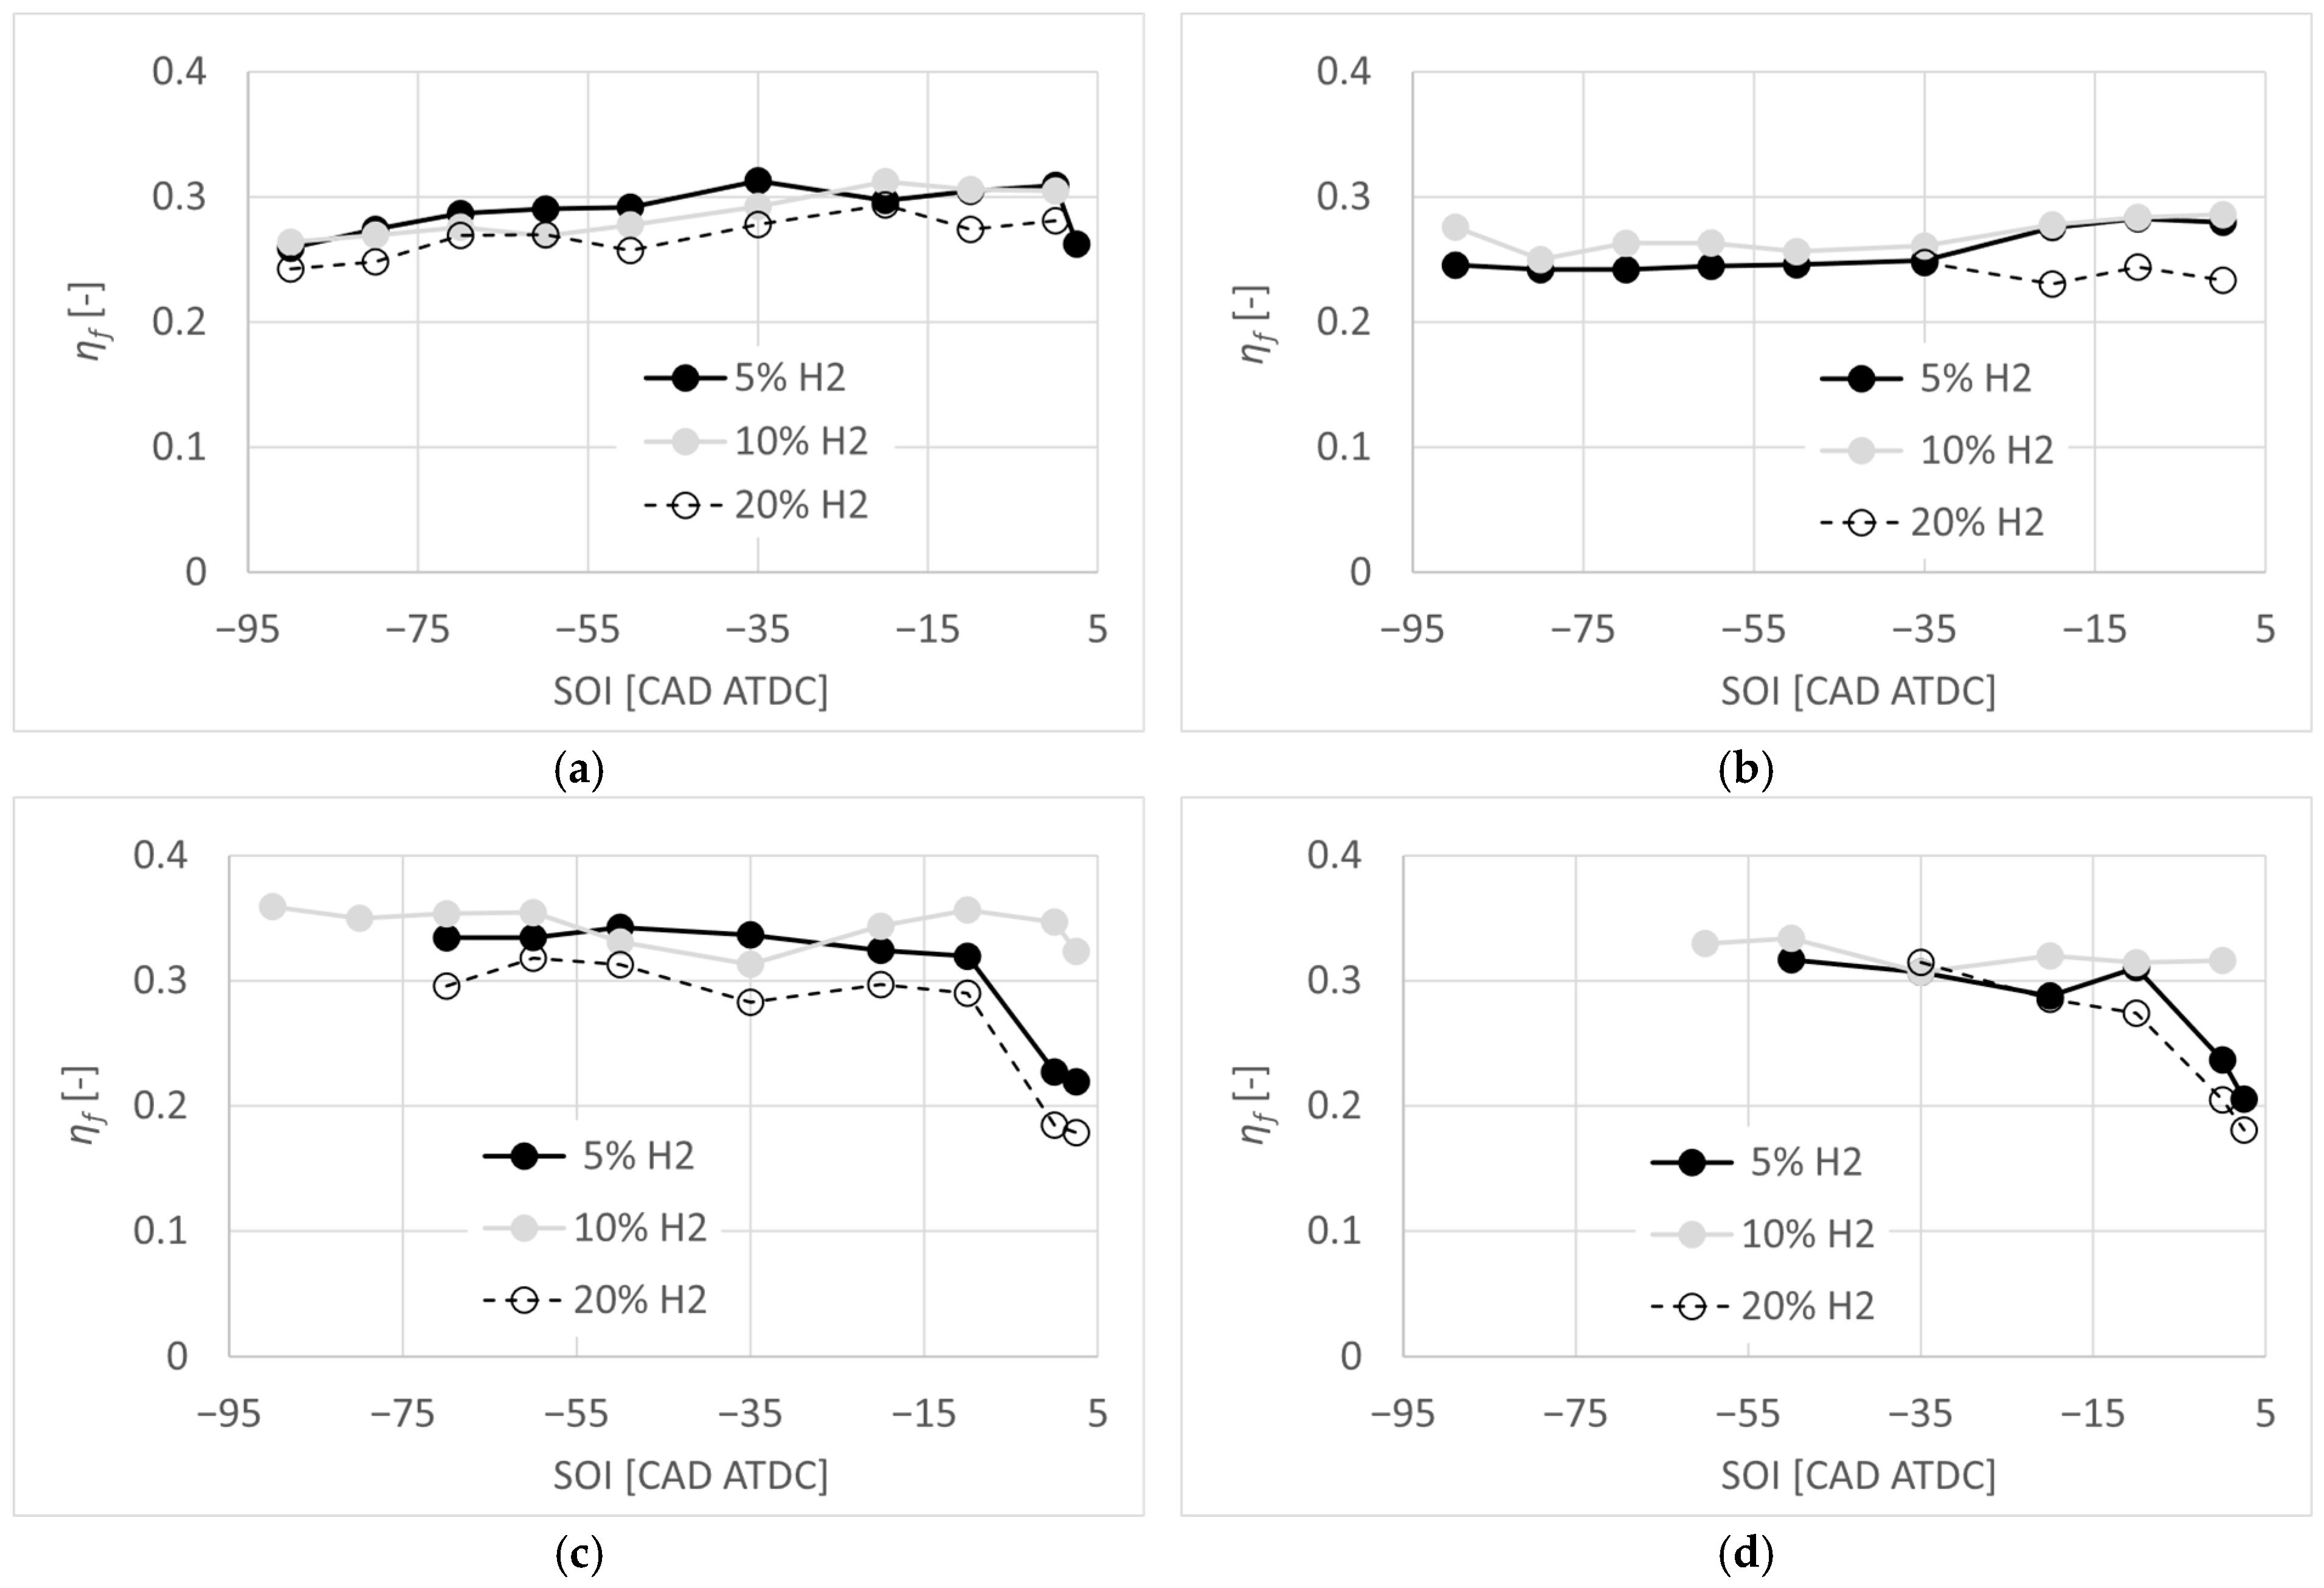
The in-cylinder pressure development previously described justifies the behaviour of indicated fuel conversion efficiency (ηf), reported in Figure 7. In particular, the following conclusions can be derived:
  • In NA conditions (Figure 7a,b), the effect of SOI delay is to increase ηf until SOI reaches TDC; further delaying pilot injection, an abrupt reduction is observed or, in the worst case, unacceptable values of CoV. On the other hand, in SC conditions (Figure 7c,d), ηf remains fairly constant until SOI = 10CADBTDC, while, for more delayed values, a significant reduction is observed; this reduction is more pronounced for low and high H2 percentage tested, while for intermediate values this variation is not significant.
  • In general, it can be stated that an increase in H2 percentage reduces ηf; this is in agreement with the lower values of maximum in-cylinder pressure and related CAD shown in Figure 7; similar findings are reported in other works [26].
  • Supercharging the engine generally leads to higher values of ηf; the only exception is represented by the cases with SOI delayed more than 10 CADBTDC, for which, as previously stated, NA cases show fairly constant values, while SC shows a significant reduction.
  • Finally, increasing pilot injection pressure (comparison between Figure 7a and Figure 7b and Figure 7c and Figure 7d) leads to a reduction in ηf.
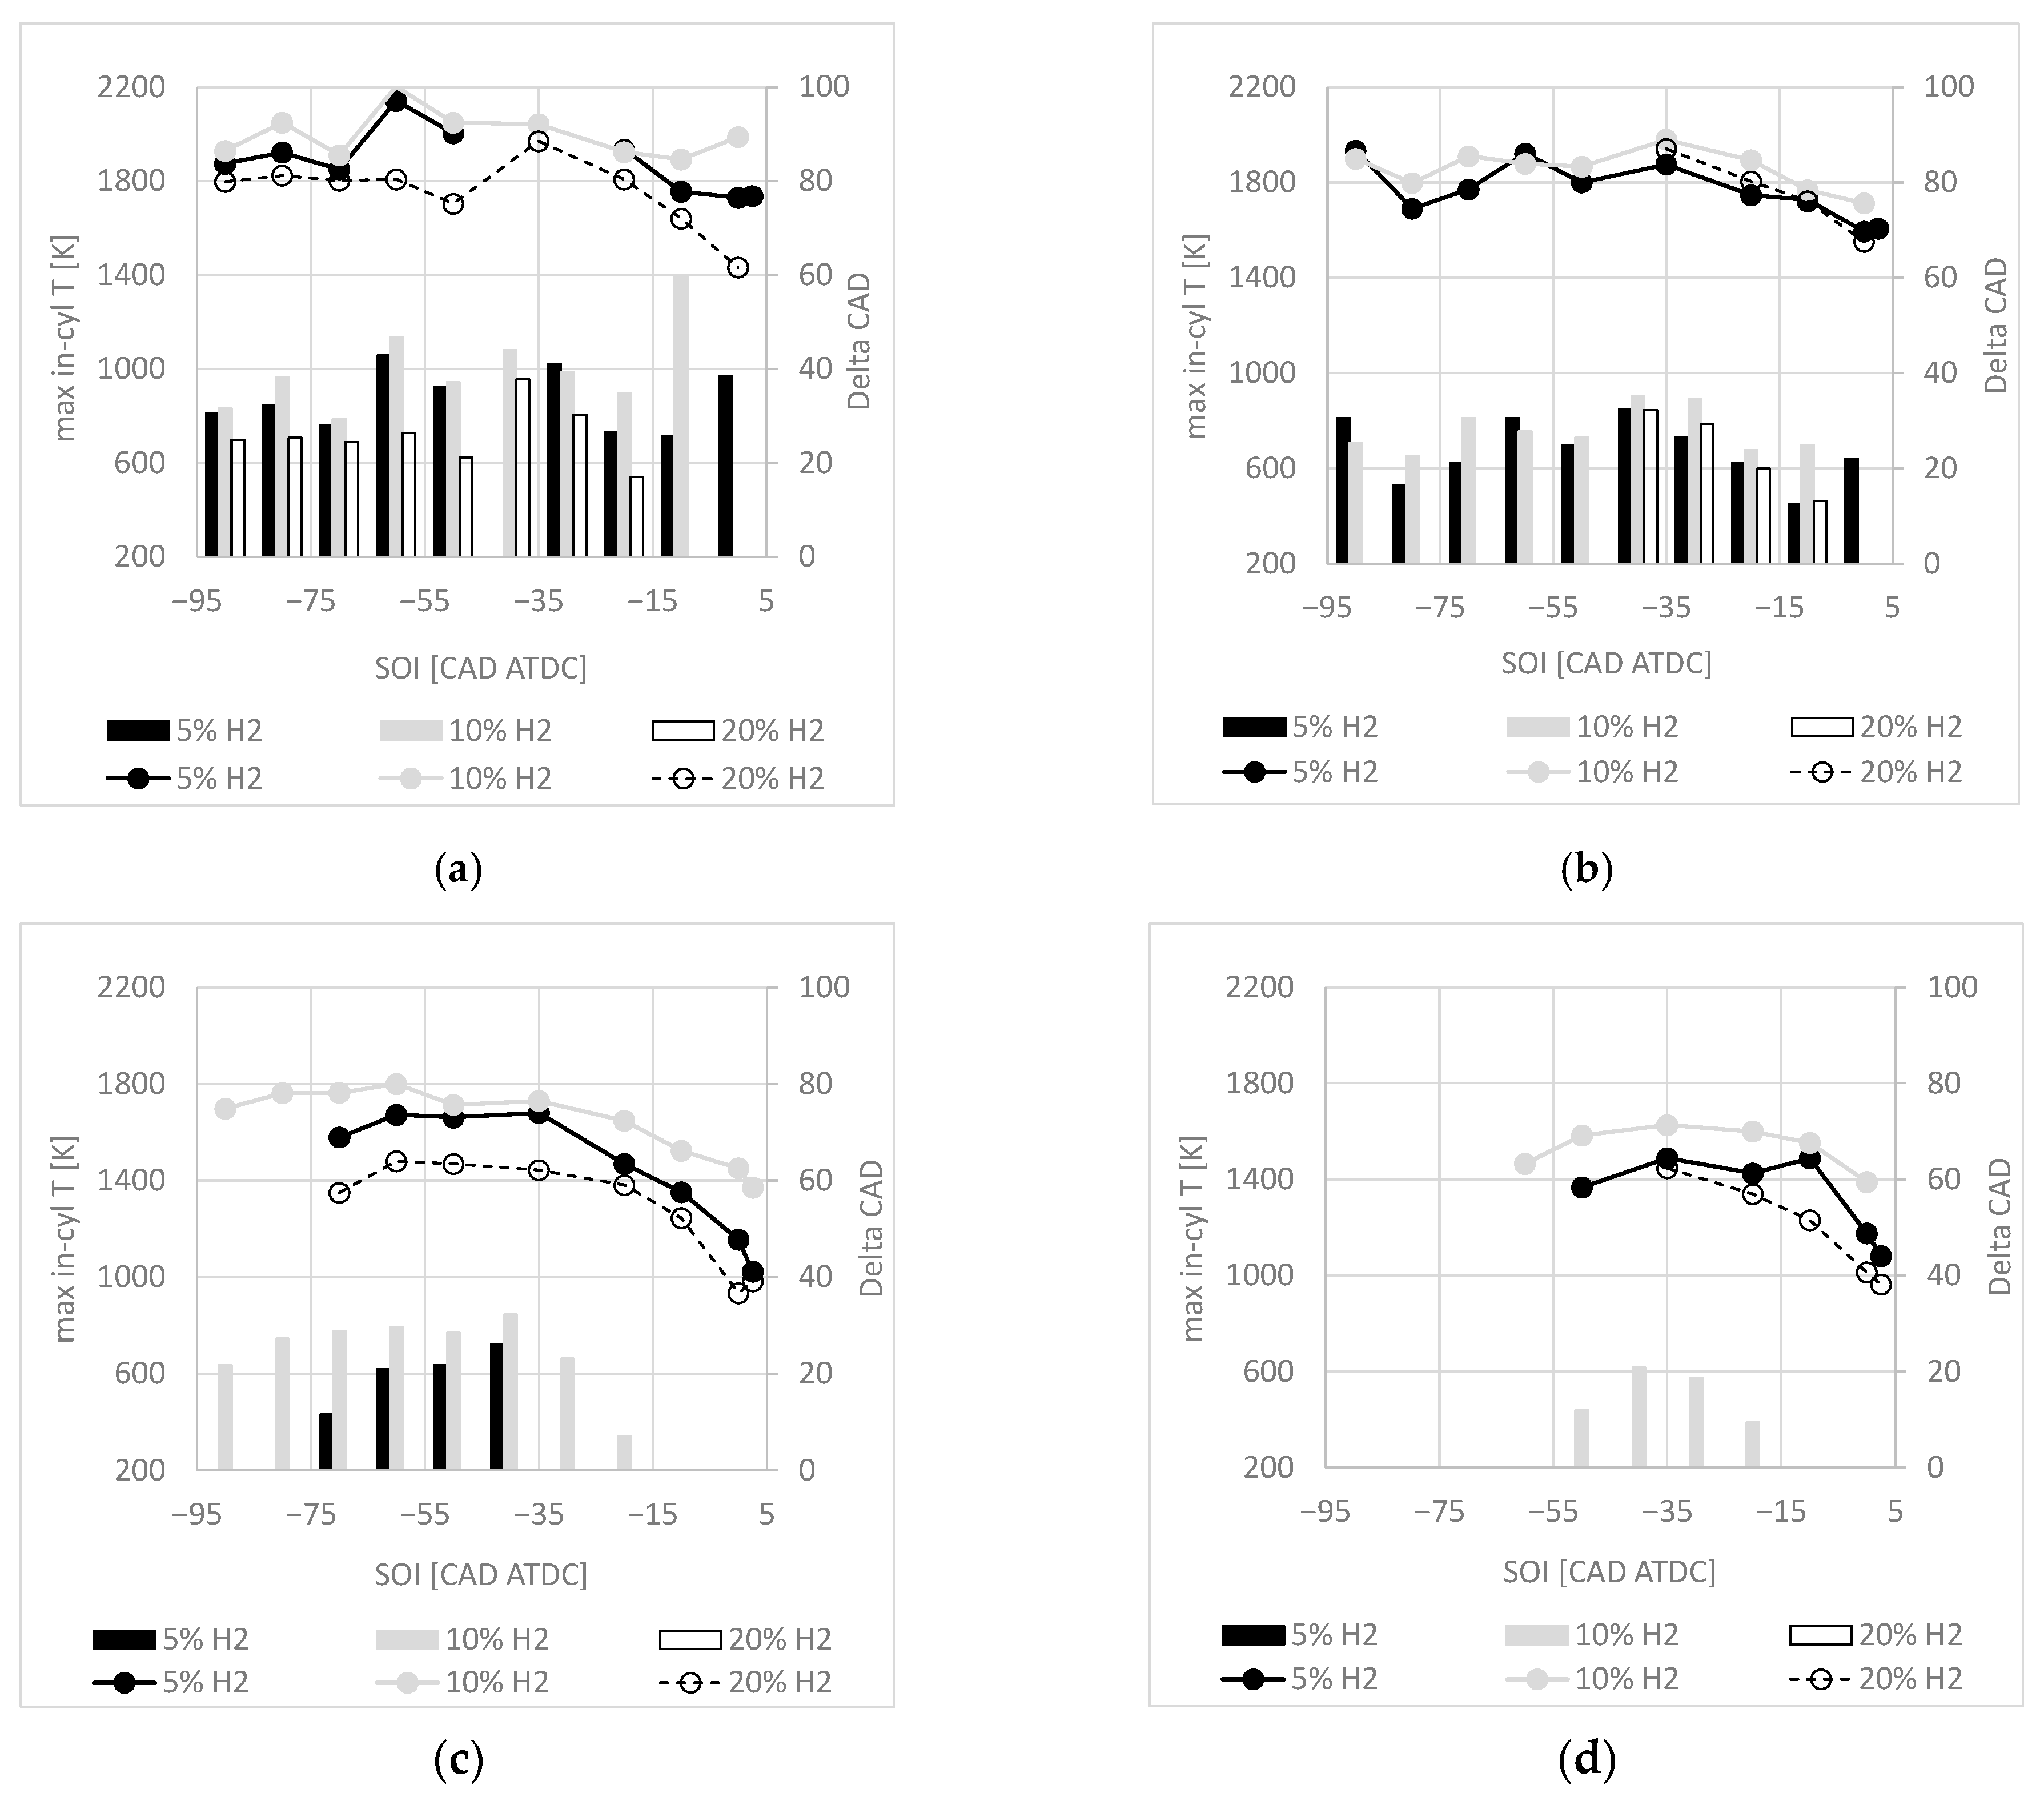
As previously discussed, from in-cylinder pressure curves, it is possible to derive in-cylinder temperature traces, calculated using the state equation of ideal gases and assuming constant mass trapped in the cylinder during the compression and expansion strokes. Moreover, the in-cylinder gas temperature at IVC has been assumed equal to 410 K. In Figure 8, maximum in-cylinder charge temperature and the angular duration in which the bulk temperature exceeds 1500 K are shown for different values of SOI and H2 percentages. This is because, in [27], it is indicated that a peak in-cylinder temperature of 1500 K is required for complete CO oxidation, regardless of hydrocarbon fuel type and autoignition characteristics. From Figure 8, the following conclusions can be derived:
  • In NA conditions (Figure 8a,b), the effect of SOI delay is first to increase maximum in-cylinder temperature and then to decrease until the most retarded SOI is reached; however, with low H2 percentage values (5% and 10%), it can be observed that for the most retarded SOIs, maximum in-cylinder temperature does not decrease (5% H2) or even increase (case 10% H2 in Figure 8a). This behaviour can be explained by observing that, on one hand, the ignition delay is reduced with SOI around TDC; in addition, around TDC, bulk motions in the combustion chamber, in particular swirl, are more intense. It is well known that swirl motion in compression ignition engines is decisive in promoting mixing between air and fuel, and the presence of H2 further supports combustion development and allows one to reach higher peak temperatures even if the combustion develops during the expansion stroke. On the other hand, in SC conditions (Figure 8c,d), the increasing then decreasing behaviour of maximum in-cylinder temperature is evident. In SC conditions, it can be seen that in-cylinder maximum temperature is globally reduced. This behaviour is mainly due to the presence of more air in the cylinder. Therefore, the same heat released by the fuel leads to lower charge temperatures. The temperature reduction slows down the phenomena leading to the autoignition of the high-reactivity fuel as well as the combustion development. This behaviour explains why maximum in-cylinder temperature monotonically decreases when late SOI is adopted in SC conditions.
  • In SC conditions (Figure 8c,d), it can be stated that H2 percentage increase reduces maximum in-cylinder temperature [28], while in NA conditions (Figure 8a,b) a univocal trend is not observed.
  • Finally, increasing pilot injection pressure (comparison between Figure 8a and Figure 8b and between Figure 8c and Figure 8d) leads to a reduction in maximum in-cylinder temperature.
The behaviour of angular duration during which the bulk temperature exceeds 1500 K follows the behaviour of maximum in-cylinder temperature.

3.2. Emissions Analysis

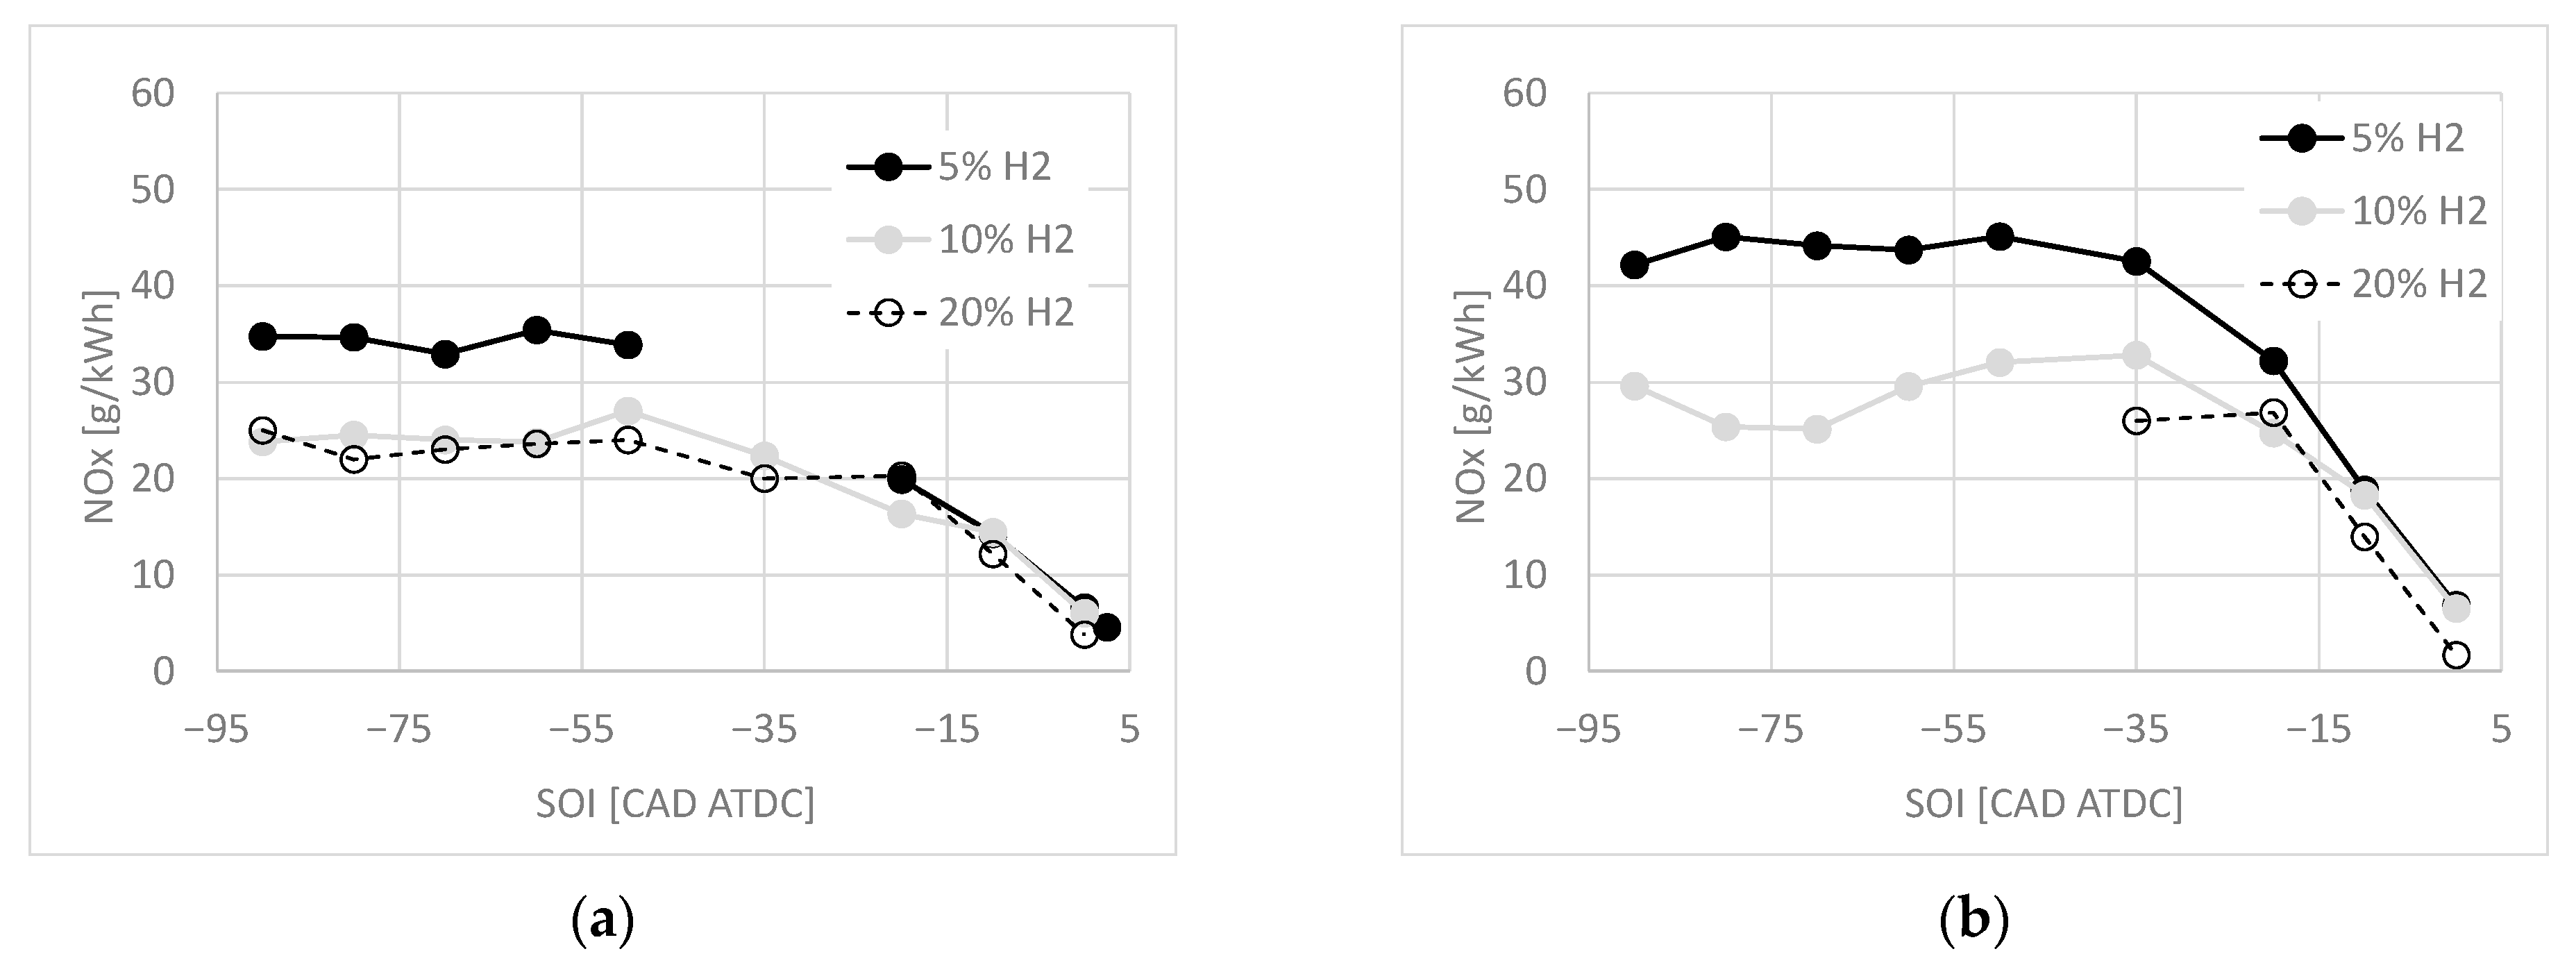
In Figure 9, ISNOx emission levels are shown for all tested conditions. In NA condition operation (Figure 9a,b), delaying SOI is beneficial for NOx reduction. In fact, while ISNOx levels remain steadily high with early and conventional SOI, they reduce if SOI is delayed. This behaviour is observed with all H2 percentages tested. In addition, ISNOx levels are lower as H2 percentage increases. This trend is in line with the maximum in-cylinder temperature behaviour, whose lower values are found with the highest H2 percentage. Increasing PIP (comparison between Figure 8a and Figure 8b and between Figure 9c and Figure 9d) leads to an increase in ISNOx emission levels.
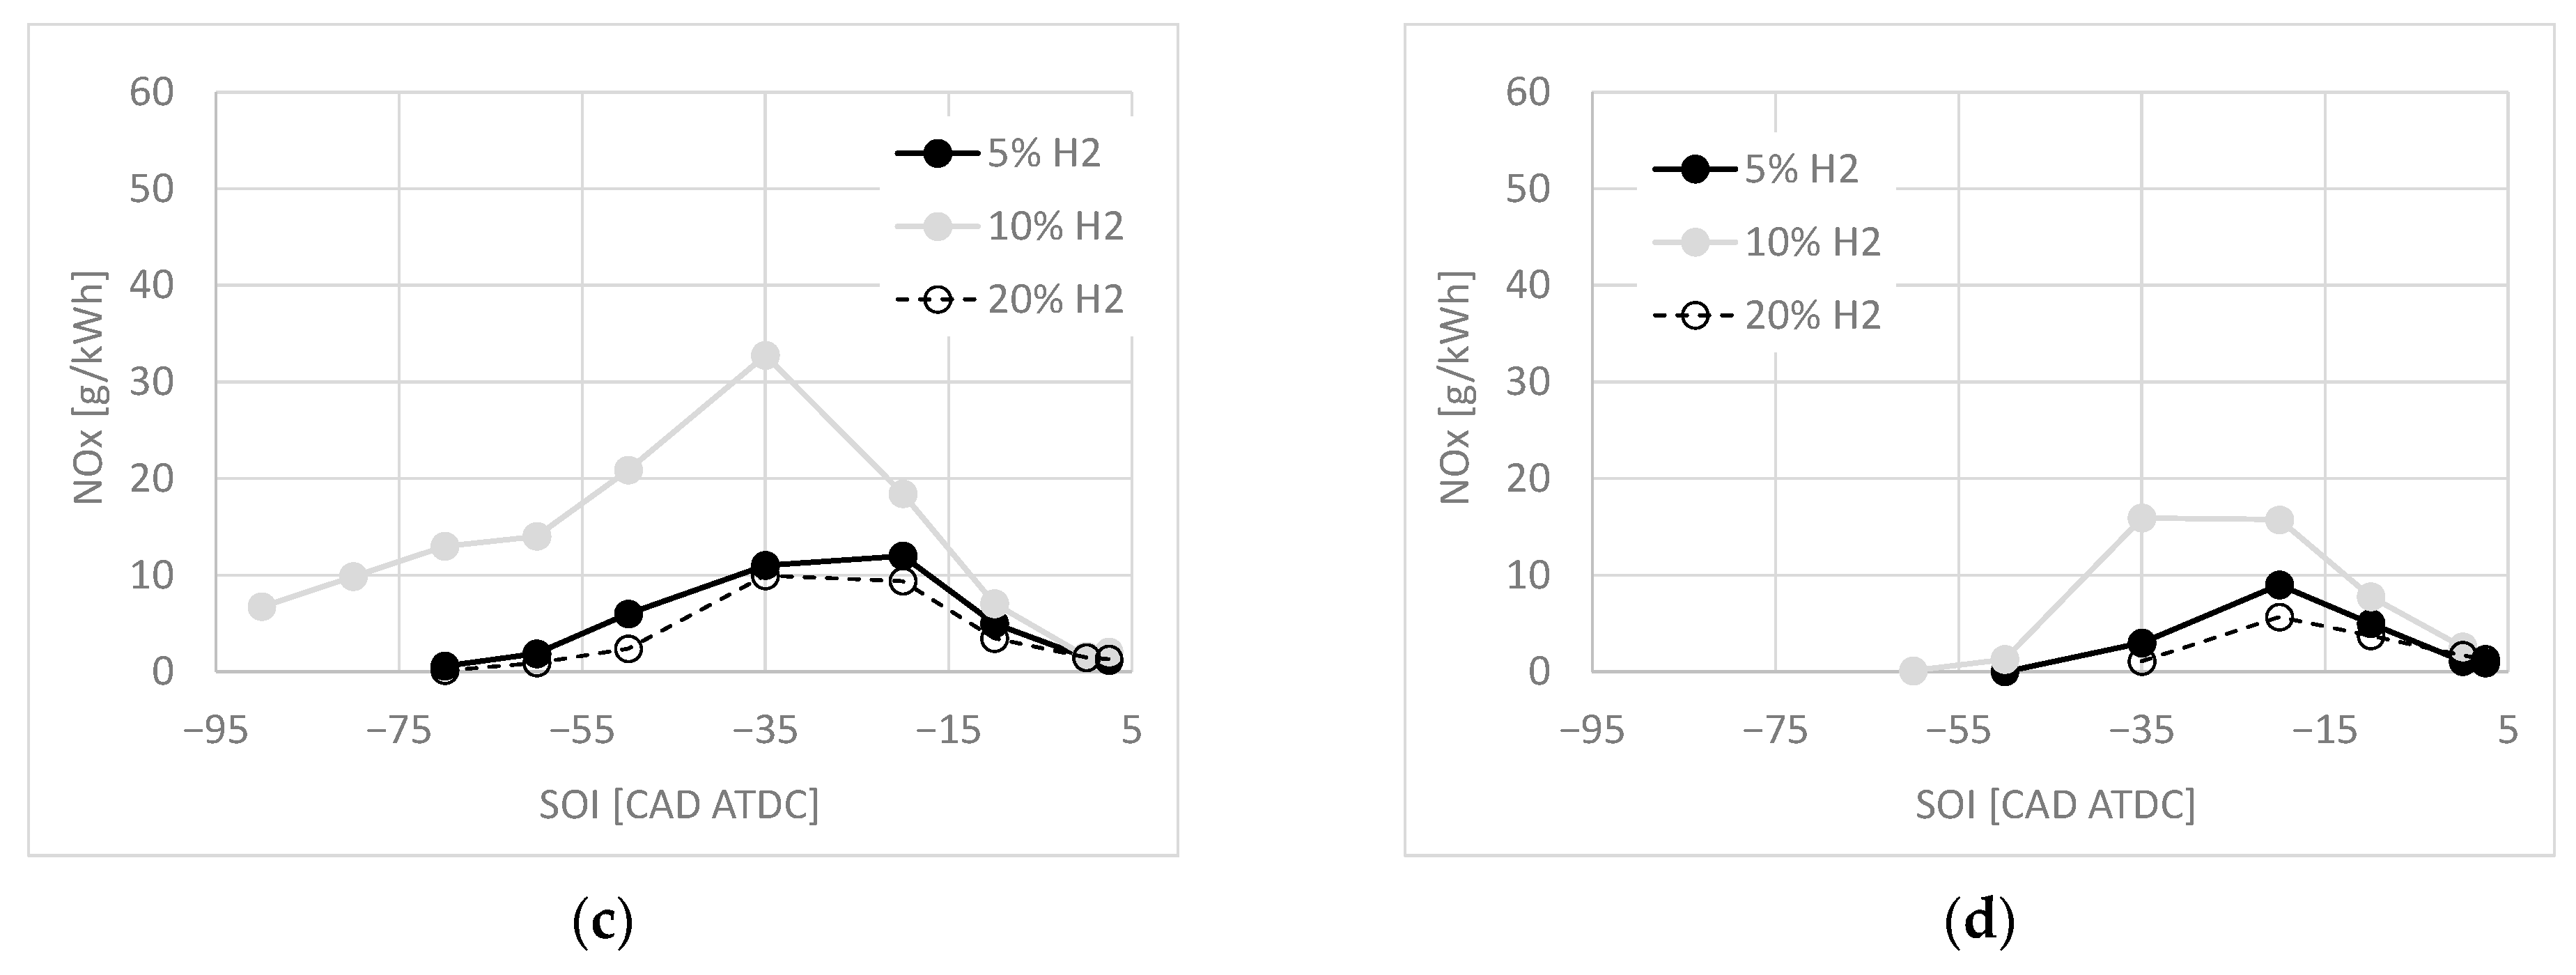
In SC conditions (Figure 9c,d), the behaviour is different. In particular, the following features can be noticed:
  • ISNOx emission levels are globally reduced compared to NA operation. This result can be justified by the reduction in in-cylinder temperature reported in Figure 8.
  • Delaying SOI from early timings determines an increasing then decreasing behaviour; therefore, lower values are observed with either early or late pilot injections, while higher values are measured with conventional timings. This behaviour reflects what is observed in terms of in-cylinder temperature (Figure 8); however, this reduction is accompanied by an equally marked reduction in ηf, especially with low or high H2 percentage values.
  • The highest ISNOx emission levels are observed with intermediate H2 percentage, while they are reduced as H2 percentage either increases or decreases. This result is in line with the behaviour of in-cylinder temperature shown in Figure 8c,d.
  • Finally, in SC conditions, increasing PIP leads to a reduction in ISNOx emission levels. With higher PIP, high reactivity fuel is better atomized and mixed with air and low reactivity fuel in the combustion chamber. Therefore, its autoignition and subsequent combustion leads to lower local temperature peaks, resulting in lower NOx emission levels.
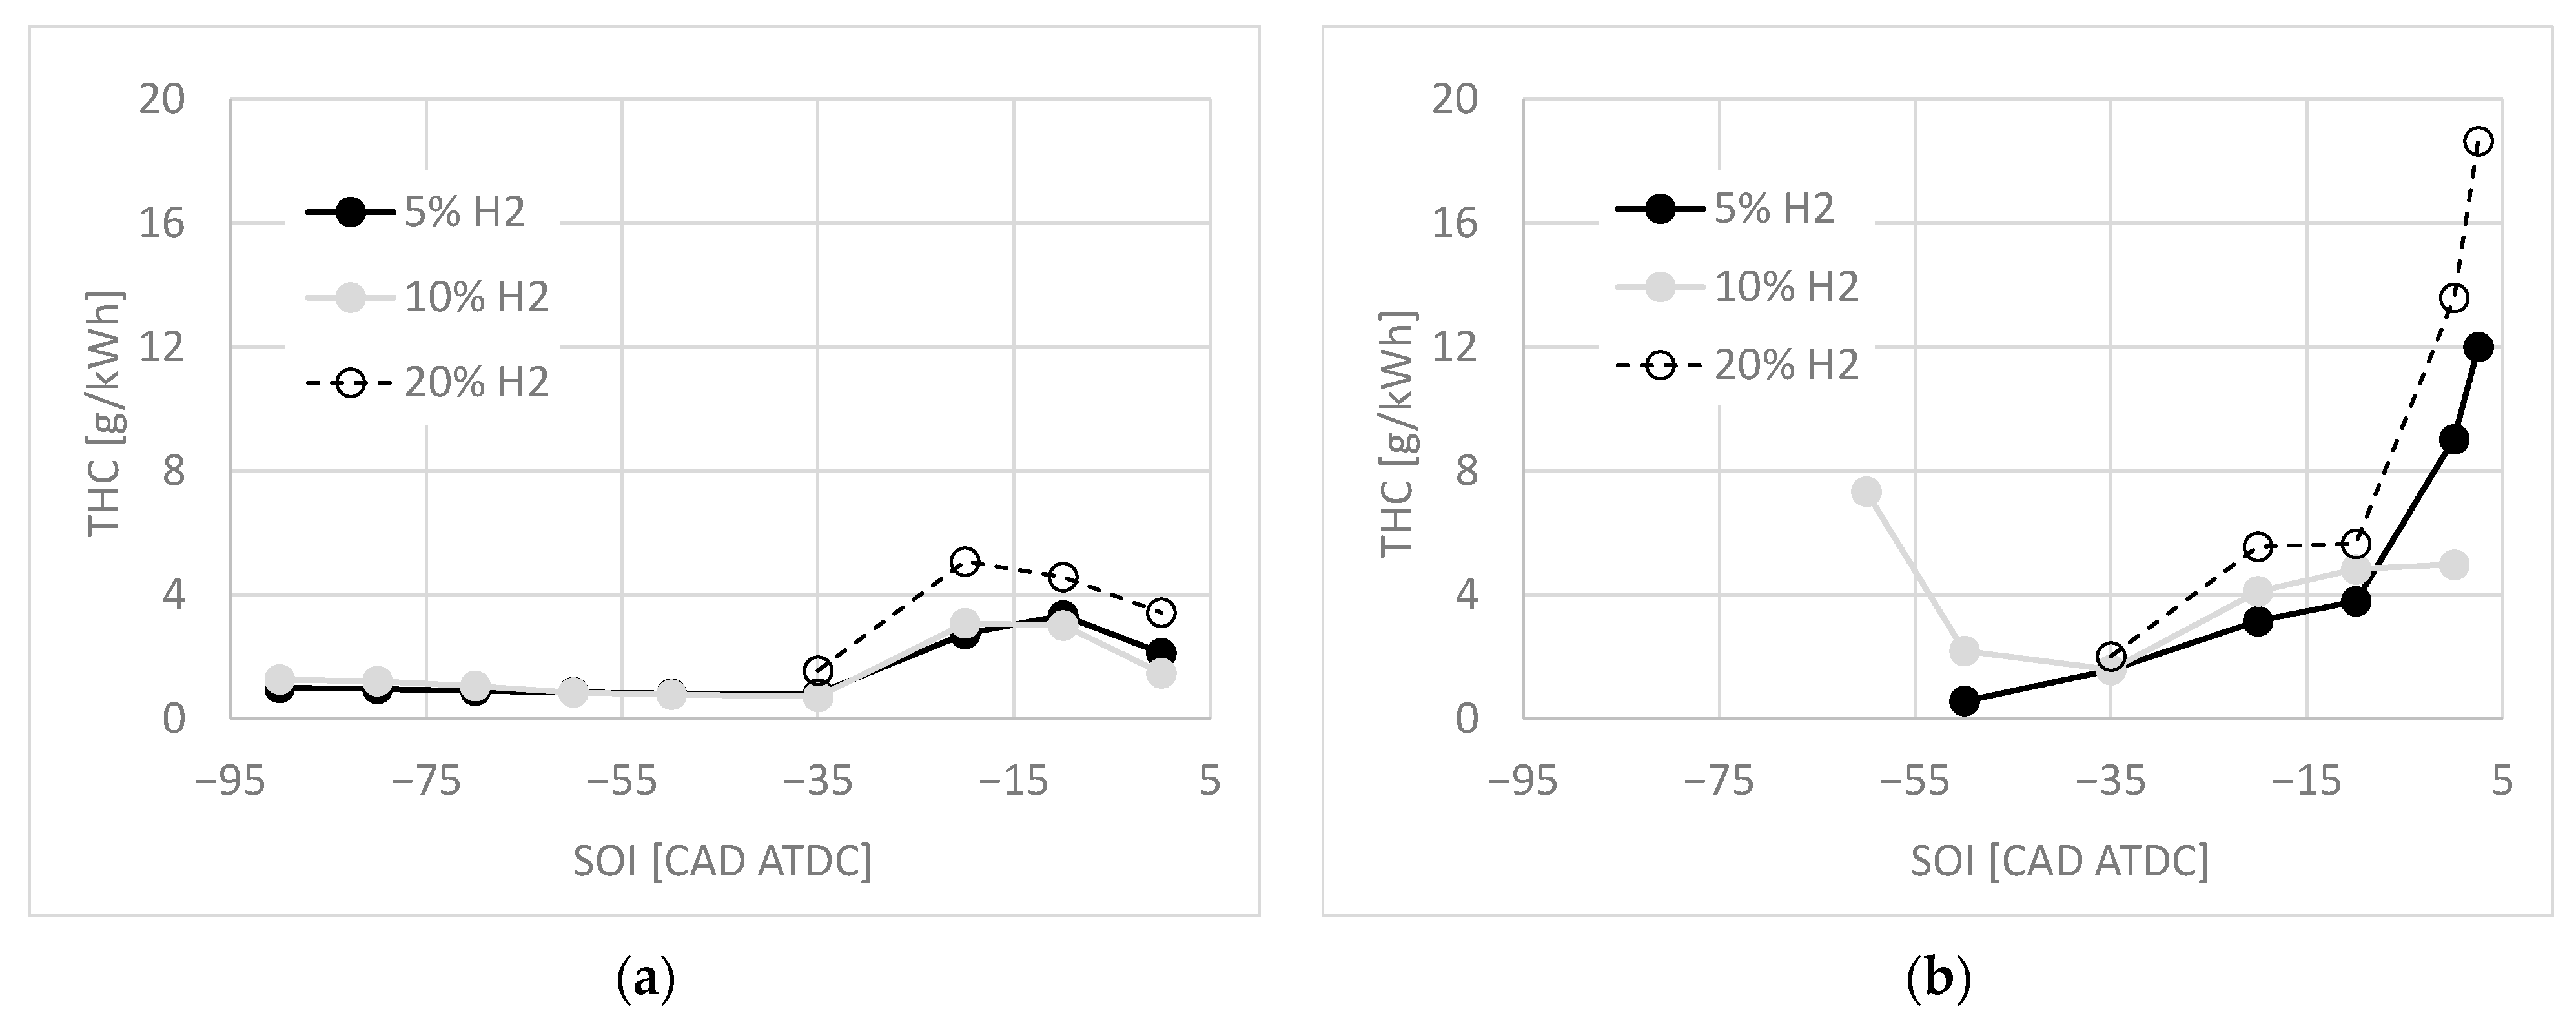
In Figure 10, ISHC emission levels are shown for all tested conditions. HC emissions vary greatly depending on whether the engine is operating in NA or SC conditions. In particular, in NA conditions (Figure 10a), low levels can be observed with early SOI; these levels tend to increase with conventional SOI and then decrease with late SOI. Similarly, this behaviour is observed if PIP is reduced to 500 bar, always in NA operation. In this case, PIP reduction does not determine relevant variations in the absolute emission levels.
In supercharging conditions (Figure 10b), however, the pattern changes. Specifically, high values are observed with both early and late SOIs, while conventional SOI values produce the lowest emission levels. The highest H2 levels also result in the highest emission levels, while low and intermediate levels result in comparable THC levels. In addition, this behaviour is observed if PIP is reduced to 500 bar, always in SC operation. In this case, PIP reduction does not determine relevant variations in the absolute emission levels as well.
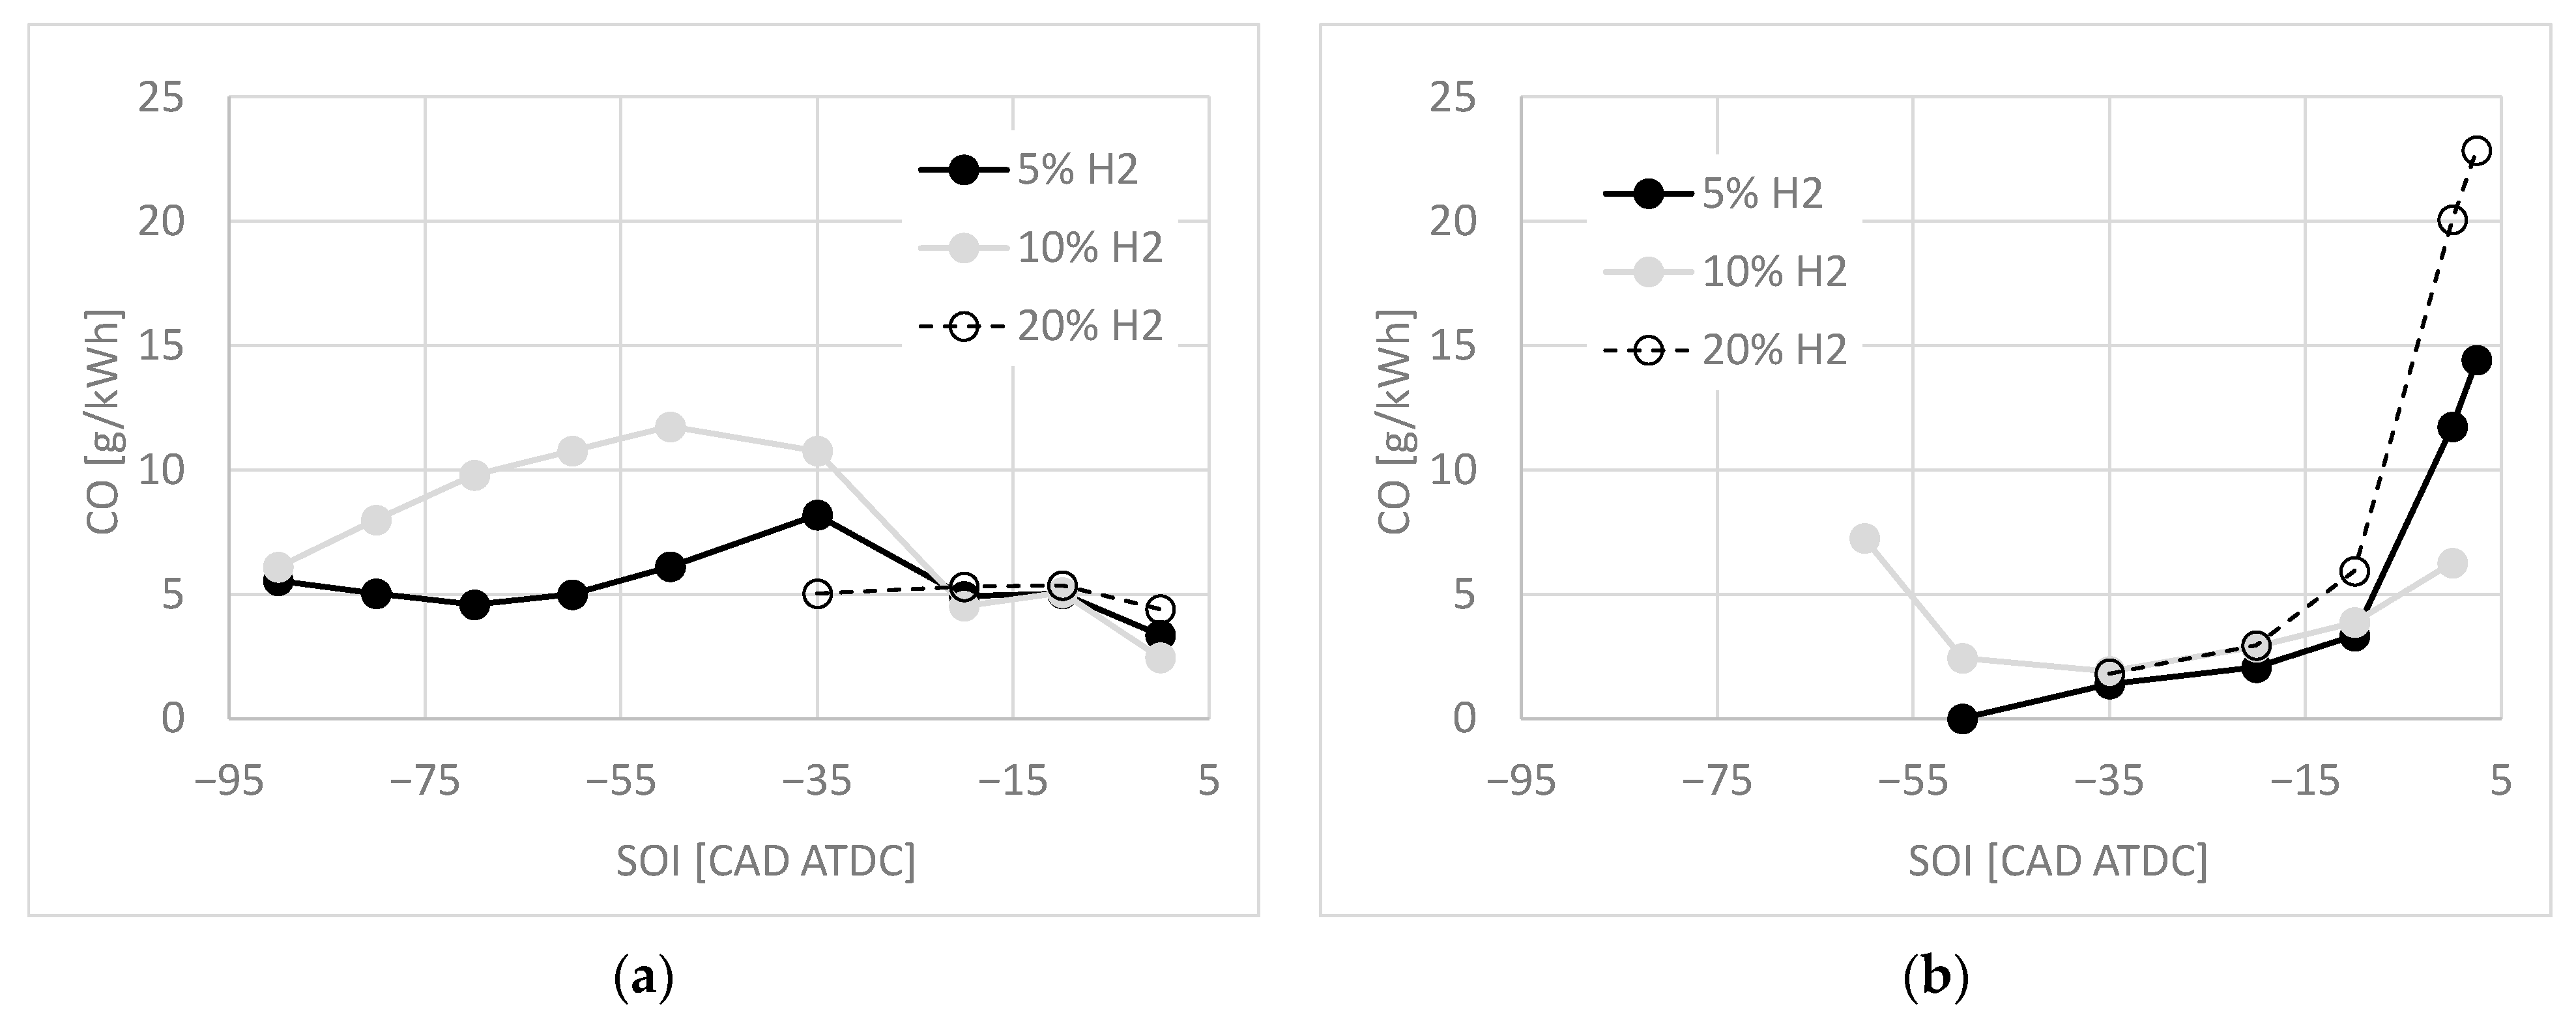
Finally, with reference to CO emissions, the observed trends under SC conditions are similar to those illustrated for HC, as can be seen by analyzing the data reported in Figure 10. Regarding NA conditions (Figure 11a), however, a delayed SOI in this case minimizes CO levels compared to all other CO values and for all H2 percentages tested.

4. Conclusions

In this work, the effect of methane substitution with hydrogen in a dual-fuel diesel/methane compression ignition engine has been assessed, in which the low reactivity gaseous fuel mixture has been ignited through a pilot diesel injection. The tested substitution percentages of methane with hydrogen were 5, 10 and 20. Moreover, pilot injection phasing was varied on a wide range in order to cover early, conventional and late timings, while pilot injection pressure was varied on two levels. Finally, the engine was tested under naturally aspirated and supercharged conditions. The effect of all the above parameters was evaluated on combustion development, engine performance and gaseous emission levels.
The analysis of in-cylinder pressure and related heat release rate traces revealed that, in naturally aspirated conditions and high pilot injection pressure, combustion associated with early to conventional pilot injection timings is premixed-like. Lower H2 percentages are associated with shorter ignition delay, higher release rate and shorter combustion duration. The same conclusions can be drawn if pilot injection timing is delayed under the same conditions. Supercharging determines a reduction in heat release rate and consequently an increase in combustion duration with early pilot injection timings. However, delaying it, a diffusive-like combustion appears after a first premixed combustion phase for all gaseous mixtures. Pilot injection pressure does not play a significant role in combustion development.
In terms of indicated fuel conversion efficiency, a slight penalty is observed with the highest H2 percentages tested when the engine is operated in naturally aspirated conditions, while late SOI usually leads to the highest efficiency values; on the other hand, supercharging the engine, the highest H2 percentages tested are still associated with the lowest efficiency values, but delaying SOI determines a significant penalty as well.
Concerning NOx emissions, lowest levels are associated with late SOI in both naturally aspirated and supercharged conditions and for all methane substitution percentages with hydrogen. THC and CO levels assume low values with all H2 percentages and late SOI in naturally aspirated conditions, while in supercharged conditions a remarkable increase is observed, increasing H2 percentages and SOI delay.
HC and CO emissions vary greatly depending on whether the engine is operating in naturally aspirated or supercharged conditions. In the first case, low values are observed with early or late SOI, while, in the second case, high values are observed with both early and late SOI.
Summarizing, besides an obvious reduction in CO2 as H2 percentages increases, a variation in H2 percentages around 10% determines:
  • A slight penalty in terms of engine fuel conversion efficiency; this can be partially compensated using a late SOI strategy in naturally aspirated conditions, while in supercharging conditions late SOI further penalize it;
  • A reduction in NOx emissions; late SOI determine the lowest levels of NOx emissions in both naturally aspirated and supercharged conditions;
  • An increase in HC and CO emissions levels; this can be partially compensated using a late SOI in strategy in naturally aspirated conditions, while in supercharging conditions late SOI further penalize it.

Author Contributions

Conceptualization, A.P.C.; methodology, A.P.C. and L.S.; software, L.S.; validation, A.P.C., L.S. and A.F.; investigation, L.S.; resources, A.P.C. and A.F.; data curation, A.P.C. and L.S.; writing—original draft preparation, A.P.C.; writing—review and editing, A.P.C. and L.S.; visualization, A.P.C., L.S. and A.F.; supervision, A.P.C. and A.F.; project administration, A.P.C. and A.F.; funding acquisition, A.P.C. All authors have read and agreed to the published version of the manuscript.

Funding

This research was funded by Italian Ministry of University and Research, project PON “AIRE”, code ARS01_01245.

Data Availability Statement

The raw data supporting the conclusions of this article will be made available by the authors on request.

Acknowledgments

The authors thank Antonio Caricato and Cosimo Calcagni for their support during the experimental campaign and data post processing.

Conflicts of Interest

The authors declare no conflicts of interest.

Abbreviations

The following abbreviations are used in this manuscript:
ABDCAfter Bottom Dead Centre
ATDCAfter Top Dead Centre
BBDCBefore Bottom Dead Centre
BTDCBefore Top Dead Centre
CADCrank Angle Degrees
CoVCoefficient of Variance
DFDual-Fuel
HRRHeat Release Rate
ICEInternal Combustion Engine
IDIgnition Delay
ISCOIndicated Specific Carbon Monoxide
ISHCIndicated Specific Hydrocarbons
ISNOxIndicated Specific Nitric Oxides
IVCInlet Valve Closing
LTCLow Temperature Combustion
NANaturally Aspirated
PESPercentage Energy Substitution
PIPPilot Injection Pressure
SCSupercharging
SOIStart of Injection
TDCTop Dead Centre

References

  1. Algayyim, S.J.M.; Saleh, K.; Wandel, A.P.; Fattah, I.M.R.; Yusaf, T.; Alrazen, H.A. Influence of Natural Gas and Hydrogen Properties on Internal Combustion Engine Performance, Combustion, and Emissions: A Review. Fuel 2024, 362, 130844. [Google Scholar] [CrossRef]
  2. Gao, N.; Geng, Z.; Zhao, W.; Geng, L.; Dong, F.; Huang, D. Review on the Combustion and Emission Characteristics of Hydrogen Engine. Int. J. Hydrogen Energy 2025, 143, 121–146. [Google Scholar] [CrossRef]
  3. Hosseini, S.H.; Tsolakis, A.; Alagumalai, A.; Mahian, O.; Lam, S.S.; Pan, J.; Peng, W.; Tabatabaei, M.; Aghbashlo, M. Use of Hydrogen in Dual-Fuel Diesel Engines. Prog. Energy Combust. Sci. 2023, 98, 101100. [Google Scholar] [CrossRef]
  4. Yang, L.; Wang, R.; Qin, W.; Hunicz, J.; Zhang, J. Development and Simulation Application of a Reduced Diesel/Methane/Hydrogen Tri-Fuel Mechanism Based on Multi-Objective Optimization and Multi-Criteria Decision-Making. Int. J. Hydrogen Energy 2026, 200, 152475. [Google Scholar] [CrossRef]
  5. Sayani, J.K.S.; Wang, M.; Ma, Z.; Sharan, P.; Mehana, M.; Chen, B. Techno-Economic Analysis of Hydrogen Transport via Repurposed Natural Gas Pipelines: Flow Dynamics and Infrastructure Tradeoffs. Int. J. Hydrogen Energy 2025, 147, 150033. [Google Scholar] [CrossRef]
  6. Pellegrini, M.; Guzzini, A.; Saccani, C. A Preliminary Assessment of the Potential of Low Percentage Green Hydrogen Blending in the Italian Natural Gas Network. Energies 2020, 13, 5570. [Google Scholar] [CrossRef]
  7. Loyte, A.; Suryawanshi, J.; Bhiogade, G.; Devarajan, Y.; Thandavamoorthy, R.; Mishra, R.; Natrayan, L. Influence of injection strategies on ignition patterns of RCCI combustion engine fuelled with hydrogen enriched natural gas. Environ. Res. 2023, 234, 116537. [Google Scholar] [CrossRef] [PubMed]
  8. Zhou, W.; Wang, H.; Gao, J.; Zhou, S. Effects of using argon, hydrogen and syngas on performance and emissions of a heavy-duty natural gas/diesel RCCI engine at low load. Int. J. Hydrogen Energy 2024, 77, 958–974. [Google Scholar] [CrossRef]
  9. Pham, Q.; Park, S.; Agarwal, A.K.; Park, S. Review of dual-fuel combustion in the compression-ignition engine: Spray, combustion, and emission. Energy 2022, 250, 123778. [Google Scholar] [CrossRef]
  10. Ali, K.; Mohammedali, A.A.M.; Omara, A.A.M.; Ali, M.I.H. H2-CO-rich syngas in HCCI Engines: Combustion performance, challenges, and future prospects—A comprehensive review. Energy 2026, 342, 139658. [Google Scholar] [CrossRef]
  11. Sanli, A.; Yılmaz, I.T.; Gümüş, M. Assessment of Combustion and Exhaust Emissions in a Common-Rail Diesel Engine Fueled with Methane and Hydrogen/Methane Mixtures under Different Compression Ratio. Int. J. Hydrogen Energy 2020, 45, 3263–3283. [Google Scholar] [CrossRef]
  12. Paykani, A.; Kakaee, A.-H.; Rahnama, P.; Reitz, R.D. Effects of Diesel Injection Strategy on Natural Gas/Diesel Reactivity Controlled Compression Ignition Combustion. Energy 2015, 90, 814–826. [Google Scholar] [CrossRef]
  13. Park, H.; Shim, E.; Bae, C. Expansion of Low-Load Operating Range by Mixture Stratification in a Natural Gas-Diesel Dual-Fuel Premixed Charge Compression Ignition Engine. Energy Convers. Manag. 2019, 194, 186–198. [Google Scholar] [CrossRef]
  14. Park, H.; Shim, E.; Lee, J.; Oh, S.; Kim, C.; Lee, Y.; Kang, K. Large–Squish Piston Geometry and Early Pilot Injection for High Efficiency and Low Methane Emission in Natural Gas–Diesel Dual Fuel Engine at High–Load Operations. Fuel 2022, 308, 122015. [Google Scholar] [CrossRef]
  15. Carlucci, A.P.; Strafella, L.; Ficarella, A. Improving Late Pilot Injection Strategy in Dual-Fuel Diesel/Methane Engines through Supercharging and Hydrogen Enrichment. SAE Int. J. Engines 2025, 18, 941–958. [Google Scholar] [CrossRef]
  16. Kimura, S.; Ogawa, H.; Matsui, Y.; Enomoto, Y. An experimental analysis of Low-Temperature and Premixed Combustion for Simultaneous Reduction of NOx and Particulate Emissions in Direct Injection Diesel Engines. Int. J. Engine Res. 2002, 3, 249–259. [Google Scholar] [CrossRef]
  17. Carlucci, A.P.; Ficarella, A.; Laforgia, D.; Strafella, L. Improvement of Dual-Fuel Biodiesel-Producer Gas Engine Performance Acting on Biodiesel Injection Parameters and Strategy. Fuel 2017, 209, 754–768. [Google Scholar] [CrossRef]
  18. SAEJ1003; Diesel Engine Emission Measurement Procedure. SAE International: Warrendale, PA, USA, 2002.
  19. Choi, M.; Park, S. Effects of Intake Air Conditions and Micro-Pilot (MP) Injection Timing on Micro-Pilot Dual Fuel (MPDF) Combustion Characteristics in a Single Cylinder Optical Engine. Energy Convers. Manag. 2022, 254, 115281. [Google Scholar] [CrossRef]
  20. Xu, M.; Cheng, W.; Zhang, H.; An, T.; Zhang, S. Effect of Diesel Pre-Injection Timing on Combustion and Emission Characteristics of Compression Ignited Natural Gas Engine. Energy Convers. Manag. 2016, 117, 86–94. [Google Scholar] [CrossRef]
  21. Park, H.; Shim, E.; Lee, J.; Oh, S.; Kim, C.; Lee, Y.; Kang, K. Comparative Evaluation of Conventional Dual Fuel, Early Pilot, and Reactivity-Controlled Compression Ignition Modes in a Natural Gas-Diesel Dual-Fuel Engine. Energy 2023, 268, 126769. [Google Scholar] [CrossRef]
  22. Raihan, M.S.; Guerry, E.S.; Dwivedi, U.; Srinivasan, K.K.; Krishnan, S.R. Experimental Analysis of Diesel-Ignited Methane Dual-Fuel Low-Temperature Combustion in a Single-Cylinder Diesel Engine. J. Energy Eng. 2015, 141, C4014007. [Google Scholar] [CrossRef]
  23. Arslan, E.; Kahraman, N. The Effects of Hydrogen Enriched Natural Gas under Different Engine Loads in a Diesel Engine. Int. J. Hydrogen Energy 2022, 47, 12410–12420. [Google Scholar] [CrossRef]
  24. Tarabet, L.; Lounici, M.S.; Loubar, K.; Khiari, K.; Bouguessa, R.; Tazerout, M. Hydrogen Supplemented Natural Gas Effect on a DI Diesel Engine Operating under Dual Fuel Mode with a Biodiesel Pilot Fuel. Int. J. Hydrogen Energy 2018, 43, 5961–5971. [Google Scholar] [CrossRef]
  25. Benbellil, M.A.; Lounici, M.S.; Loubar, K.; Tazerout, M. Investigation of Natural Gas Enrichment with High Hydrogen Participation in Dual Fuel Diesel Engine. Energy 2022, 243, 122746. [Google Scholar] [CrossRef]
  26. Lounici, M.S.; Boussadi, A.; Loubar, K.; Tazerout, M. Experimental Investigation on NG Dual Fuel Engine Improvement by Hydrogen Enrichment. Int. J. Hydrogen Energy 2014, 39, 21297–21306. [Google Scholar] [CrossRef]
  27. Sjöberg, M.; Dec, J.E. An Investigation into Lowest Acceptable Combustion Temperatures for Hydrocarbon Fuels in HCCI Engines. Proc. Combust. Inst. 2005, 30, 2719–2726. [Google Scholar] [CrossRef]
  28. Kalsi, S.S.; Subramanian, K.A. Experimental Investigations of Effects of Hydrogen Blended CNG on Performance, Combustion and Emissions Characteristics of a Biodiesel Fueled Reactivity Controlled Compression Ignition Engine (RCCI). Int. J. Hydrogen Energy 2017, 42, 4548–4560. [Google Scholar] [CrossRef]
Figure 1. Experimental setup.
Energies 19 01909 g001
Figure 2. In-cylinder pressure traces and corresponding HRR traces with SOI = 35–10–0 CAD BTDC at two H2 percentage levels (5% and 20%) under NA conditions; PIP = 1000 bar.
Energies 19 01909 g002
Figure 3. In-cylinder pressure traces and corresponding HRR traces with SOI = 35–10–0 CAD BTDC at two H2 percentage levels (5% and 20%) under SC conditions; PIP = 1000 bar.
Energies 19 01909 g003
Figure 4. In-cylinder pressure traces and corresponding HRR traces with SOI = 35–10–0 CAD BTDC at two H2 percentage levels (5% and 20%) under SC conditions; PIP = 500 bar.
Energies 19 01909 g004
Figure 5. HRR peak and ID as a function of SOI: (a) comparison between 5% and 20% H2, under NA conditions, PIP = 1000 bar; (b) comparison between NA and SC conditions—5% H2, PIP = 1000 bar.
Energies 19 01909 g005
Figure 6. Maximum in-cylinder pressure and corresponding CAD as a function of SOI and for different H2 percentage levels: (a) NA conditions, PIP = 500 bar; (b) SC conditions, PIP = 1000 bar.
Energies 19 01909 g006
Figure 7. Fuel conversion efficiency as a function of SOI and for different H2 percentage values: (a) NA conditions, PIP = 500 bar; (b) NA conditions, PIP = 1000 bar; (c) SC conditions, PIP = 500 bar; (d) SC conditions, PIP = 1000 bar.
Energies 19 01909 g007
Figure 8. In-cylinder charge maximum temperature and angular duration in which the bulk temperature exceeds 1500 K as a function of SOI and for different H2 percentages: (a) NA conditions, PIP = 500 bar; (b) NA conditions, PIP = 1000 bar; (c) SC conditions, PIP = 500 bar; (d) SC conditions, PIP = 1000 bar.
Energies 19 01909 g008
Figure 9. NOx emission levels as a function of SOI and for different H2 percentages: (a) NA conditions, PIP = 500 bar; (b) NA conditions, PIP = 1000 bar; (c) SC conditions, PIP = 500 bar; (d) SC conditions, PIP = 1000 bar.
Energies 19 01909 g009aEnergies 19 01909 g009b
Figure 10. THC emission levels as a function of SOI and for different H2 percentages: (a) NA conditions, PIP = 1000 bar; (b) SC conditions, PIP = 1000 bar.
Energies 19 01909 g010
Figure 11. CO emission levels as a function of SOI and for different H2 percentages: (a) NA conditions, PIP = 1000 bar; (b) SC conditions, PIP = 1000 bar.
Energies 19 01909 g011
Table 1. Technical characteristics of the test engine and operating parameters adopted during the experimental campaign.
Item Specification
Engine configurationSingle-cylinder diesel engine equipped with common-rail injection
Rated power output18 kW
Cylinder bore × stroke 82 mm × 90 mm
Geometric compression ratio17.1:1
Combustion chamber design Bowl-in-piston geometry with flat cylinder head and valve pockets
Maximum rail pressureCommon-rail
Valve actuation timing
Intake valve opening13.5 CAD BTDC
Intake valve closing46.5 CAD ABDC
Exhaust valve opening51.5 CAD BBDC
Exhaust valve closing16.5 CADATDC
Baseline engine operating conditions
Engine speed1500 rpm
Pilot diesel mass per cycle8 mm3/cycle
Pilot injection timing range−2.5 to 90 CAD BTDC
Pilot injection pressure range500–1000 bar
Intake conditions
Naturally aspirated mode (NA conditions)Boost pressure 1.1 bar, λ = 1, intake temperature 303 K
Supercharged mode (SC conditions)Boost pressure 1.6 bar, λ = 1.25, intake temperature 303 K
Gaseous fuel blends investigated
Blend ACH4 (95%)–H2 (5%)—(Hi,gf = 50.7 MJ/kg)
Blend BCH4 (90%)–H2 (10%)—(Hi,gf = 51.4 MJ/kg)
Blend CCH4 (80%)–H2 (20%)—(Hi,gf = 52.8 MJ/kg)
Table 2. Accuracy of the experimental device.
Measured QuantityMeasuring RangeAccuracy
Dynamometer0–100 kW±0.25%
Cylinder pressure sensor0–250 bar±0.1%
Fuel line pressure0–2000 bar±0.8% FSO
Fuel flow metre0–2 kg±0.12%
Air flow metre8–480 kg/h±4% measured value
Gas flow metre0–30 L/min±1% FSO
Total Hydrocarbon (THC)0–10,000 ppm C3±1% FSO
Nitrogen Oxide (NOx)0–10,000 ppm±1% FSO
Carbon Monoxide (CO)0–3%±1% FSO
Disclaimer/Publisher’s Note: The statements, opinions and data contained in all publications are solely those of the individual author(s) and contributor(s) and not of MDPI and/or the editor(s). MDPI and/or the editor(s) disclaim responsibility for any injury to people or property resulting from any ideas, methods, instructions or products referred to in the content.