1. Introduction
To implement the national “dual-carbon” strategy, the installed capacity of new energy generation, particularly distributed photovoltaic (PV) power, has expanded rapidly. By November 2024, China’s cumulative PV installation had reached approximately 790 GW. The large-scale integration of renewable energy and its increasing penetration have substantially intensified the uncertainty and complexity of power system operation [
1,
2]. Meanwhile, power grids are exposed to additional shocks from extreme weather events. For instance, in June 2023, Vietnam experienced a severe power shortage triggered by extreme heat, heavily affecting residential life and industrial production; in July 2023, Typhoon Doksuri struck Fujian Province, causing thousands of line outages and widespread blackouts. Such factors collectively exacerbate the vulnerability of distribution networks and increase operational risks. As a key component of the emerging power system, energy storage systems (ESSs) offer cross-temporal energy-shifting capability, which can enhance renewable energy utilization, suppress voltage fluctuations, and improve power quality. Moreover, due to their flexible deployment and fast response, ESSs can serve as an emergency supply source during extreme events to secure critical loads. Therefore, identifying network weak points and rationally planning and allocating energy storage systems are of great significance for enhancing system resilience.
At present, the optimal allocation of energy storage systems (ESSs) is mainly applied in three scenarios, the generation side, the grid side, and the user side, with most studies focusing on achieving system-level or storage-related economic benefits. On the generation side, ESSs can effectively mitigate the output fluctuations of renewable energy, enhance grid hosting capacity, and participate in frequency regulation. Ref. [
3] minimizes wind and PV curtailment and total system cost, and improves the particle swarm optimization algorithm using congestion sorting to determine the optimal storage capacity based on an entropy-weighted evaluation. However, single-type storage is often unable to meet the requirements of large capacity and fast response. To address this issue, Ref. [
4] proposes a hybrid ESS that combines electrochemical batteries, supercapacitors, and hydrogen storage according to their operating frequency characteristics, significantly improving renewable energy utilization. Building upon this, Ref. [
5] integrates fluctuation suppression and frequency regulation by reconstructing typical wind power and regulation signals using ensemble empirical mode decomposition, and establishes a hybrid storage power allocation model. An adaptive particle swarm optimization method is used to obtain the optimal configuration of hybrid storage. On the grid side, ESSs can participate in peak shaving, provide reserve capacity, and alleviate network congestion. Ref. [
6] considers peak–valley characteristics and minimizes load variance while accounting for economic performance, using a quantum genetic algorithm to determine storage capacity. Ref. [
7], considering newly emerging flexible loads, develops a comprehensive evaluation model consisting of source–load matching, load curve smoothness, and user comfort. The results show that the coordinated participation of flexible loads and ESSs not only improves economic and environmental benefits but also provides effective peak shaving and grid pressure mitigation while maintaining user satisfaction. On the user side, properly planned ESSs can effectively address power quality issues associated with high renewable penetration, such as voltage fluctuations [
8,
9], voltage limit violations [
10], voltage deviations [
11,
12], and flicker problems [
13]. However, most of the above studies adopt single-objective optimization, which limits the comprehensiveness of the results.
To address voltage fluctuations and operational economics in distribution networks with high renewable penetration, multi-objective optimization algorithms such as the Non-dominated Sorting Genetic Algorithm III (NSGA-III) [
14], Multi-Objective Particle Swarm Optimization (MOPSO) [
2,
15], and Multi-Objective Evolutionary Algorithm based on Decomposition (MOEA/D) [
16] have been widely adopted for ESS planning, effectively balancing multiple conflicting objectives. Building upon these algorithmic foundations, recent studies have developed various ESS optimization frameworks. For instance, Ref. [
17] formulates a multi-objective siting and sizing model that simultaneously minimizes system cost, voltage deviations, and load fluctuations, solved using an improved mayfly optimization algorithm. Ref. [
18] proposes a voltage sensitivity-based preselection method to enhance computational efficiency, reducing the candidate siting set by identifying nodes with poor voltage stability before optimizing storage planning based on economic performance and loss minimization. Beyond power quality improvements, user-side ESSs can also function as emergency backup power, ensuring critical load supply and enhancing overall grid reliability. Refs. [
19,
20] incorporate reliability indices such as system average interruption duration and load curtailment into their storage optimization models, demonstrating that strategically deployed ESSs can effectively mitigate the impacts of grid faults and supply interruptions.
Reliability and resilience are fundamental requirements for the secure and continuous operation of distribution networks under both normal and extreme conditions [
21,
22]. Reliability primarily focuses on ensuring uninterrupted power supply to end users during routine operations and typical failure scenarios, while resilience emphasizes the grid’s ability to withstand, adapt to, and rapidly recover from high-impact low-probability events such as extreme weather, natural disasters, and cascading failures [
23,
24]. From a risk-oriented perspective, vulnerability characterizes how sensitive the network structure and operating state are to external disturbances and how easily the supply capability can be degraded, and thus can be regarded as a useful extension of traditional reliability assessment that bridges the concepts of reliability and resilience. Vulnerability assessment methods based on complex network theory have developed rapidly since they were introduced into power systems in the early 2000s. Appropriately planned and deployed energy storage systems can reduce network vulnerability by reshaping power flows and buffering power fluctuations, thereby enhancing both the reliability and resilience of the grid. In this context, Refs. [
25,
26] use network vulnerability indices based on complex network theory to identify weak nodes and determine optimal storage placement for system reinforcement. However, these studies mainly describe vulnerability through power quality indicators such as voltage deviation or load balancing and do not fully account for the influence of network topology on vulnerability. Ref. [
27] incorporates structural vulnerability into the assessment framework and shows, by analyzing voltage variation rates before and after ESS integration, that appropriate storage deployment can effectively mitigate distribution network vulnerability, but it still does not examine whether such configurations can significantly improve the supply capability of the grid under extreme events.
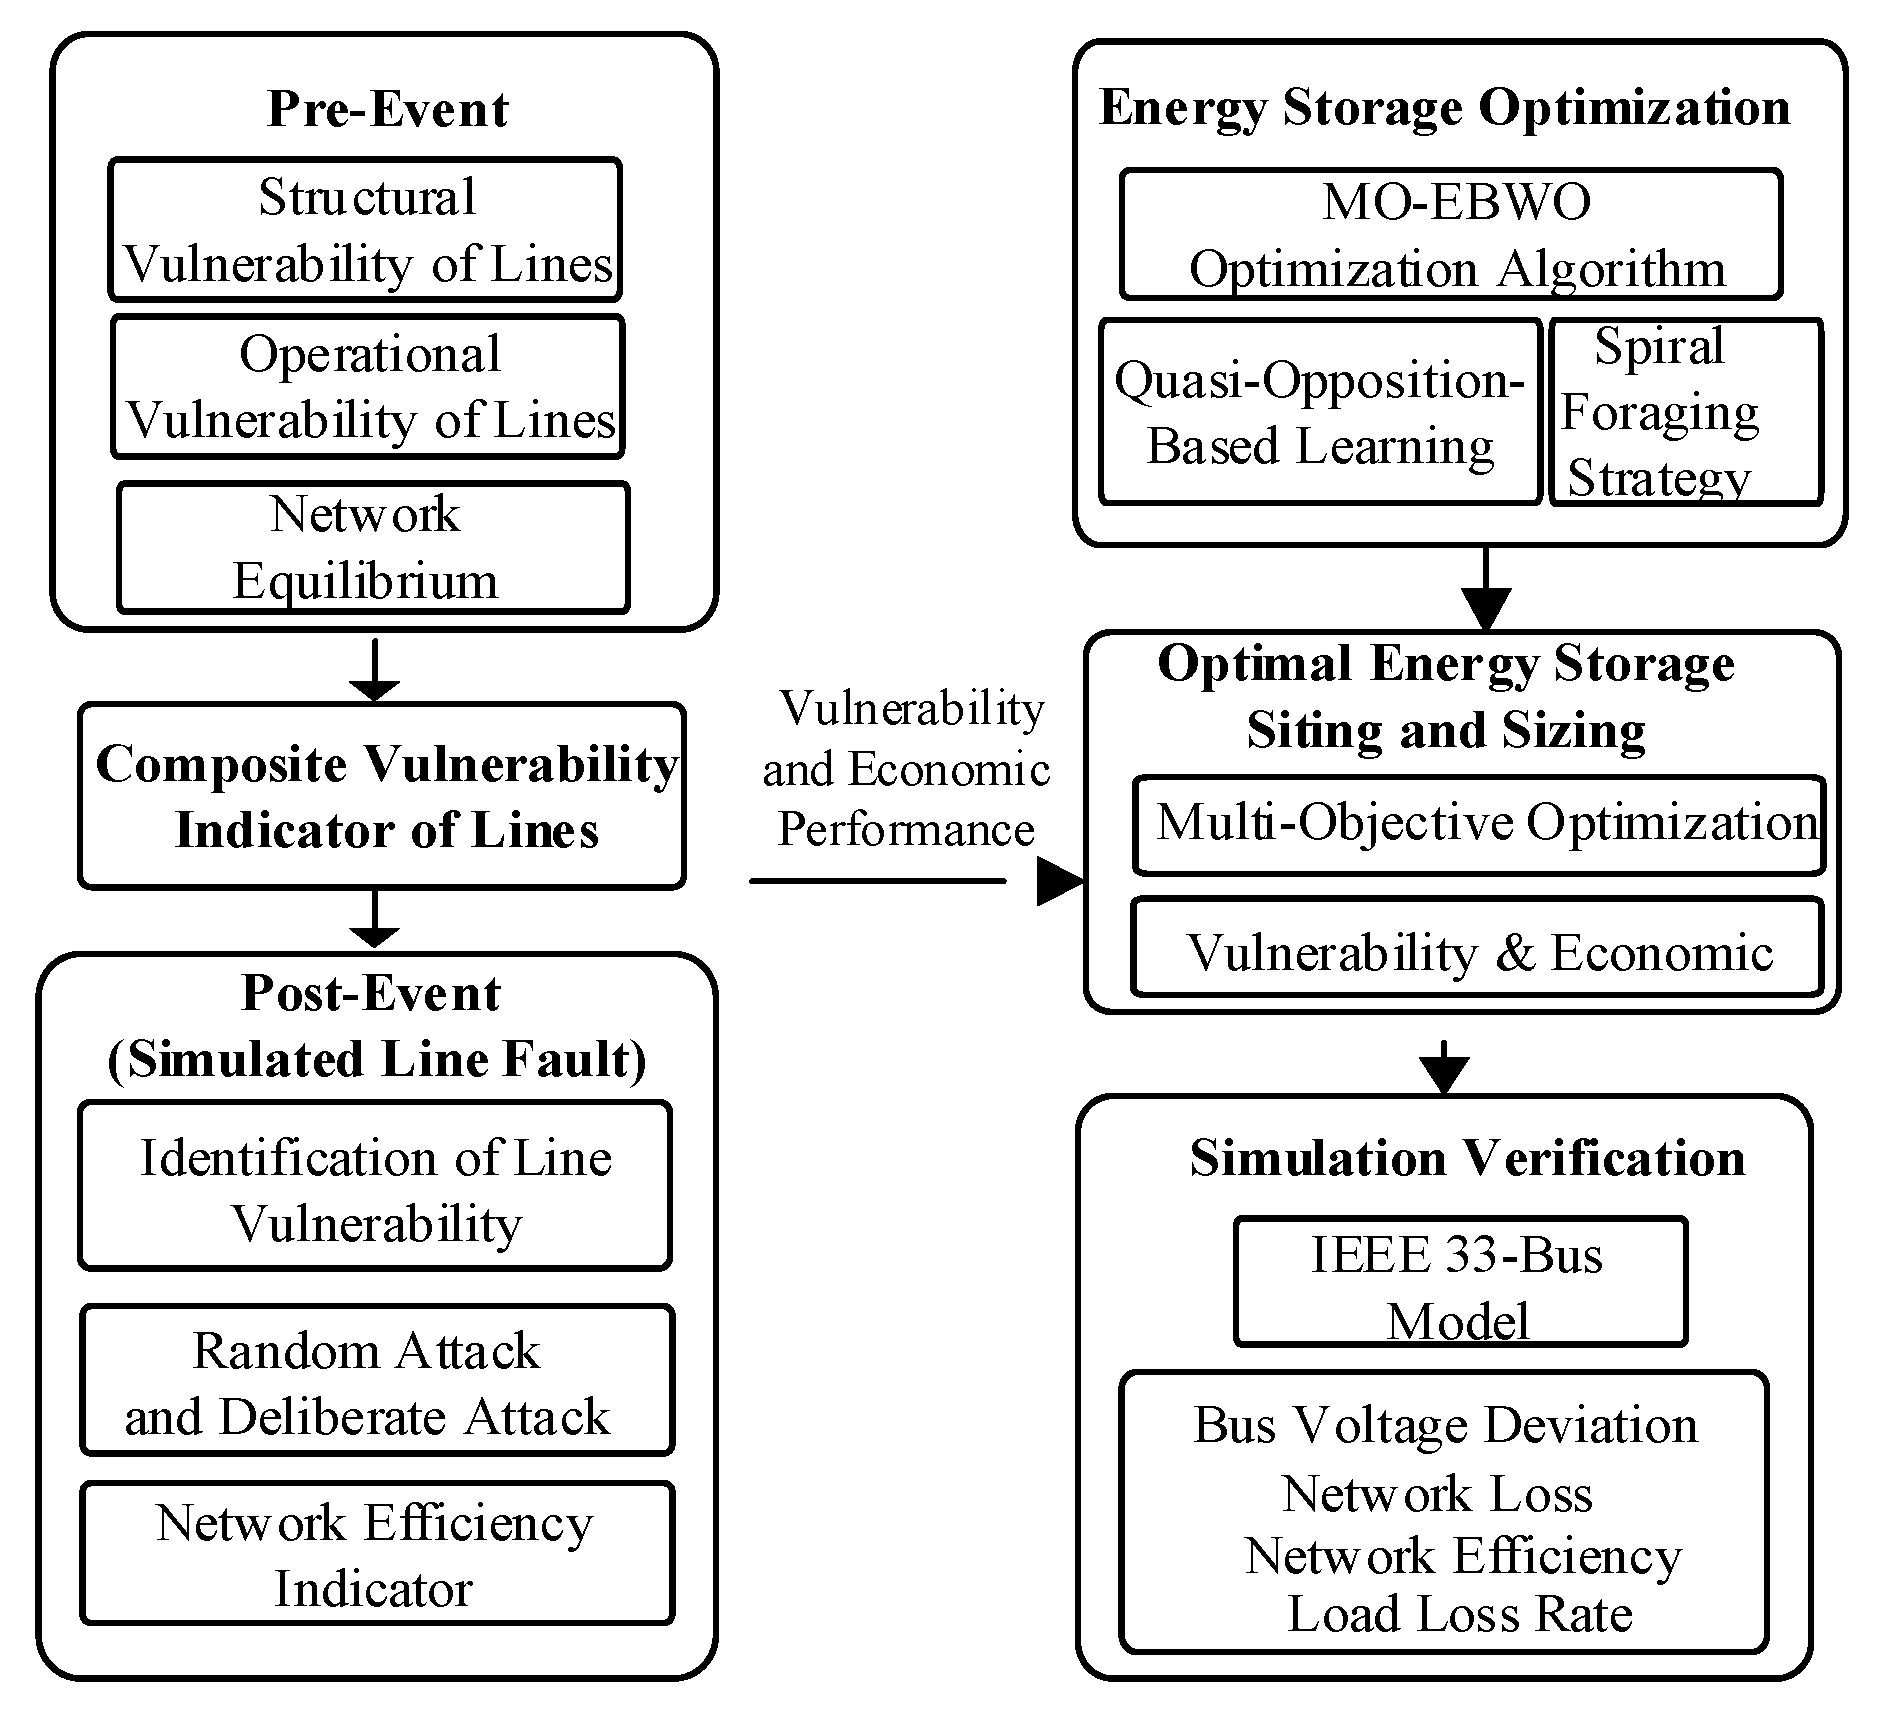
To enhance the ability of distribution networks to withstand extreme events and improve their post-disaster recovery capability, this paper proposes a vulnerability-oriented multi-objective energy storage planning method that simultaneously considers economic performance and comprehensive vulnerability. First, a two-stage vulnerability assessment framework is developed from pre-event and post-event perspectives to identify weak lines and nodes, based on which random fault and worst-case fault scenarios are constructed to emulate extreme disturbances. Second, a multi-objective optimization model is formulated using economic cost and comprehensive vulnerability as objective functions, enabling coordinated consideration of normal operation benefits and resilience under extreme events. To efficiently obtain high-quality Pareto solutions, an Enhanced Beluga Whale Optimization (EBWO) algorithm is designed by incorporating quasi-oppositional learning, spiral foraging, and adaptive exploration–exploitation strategies. Finally, case studies on an improved IEEE 33-bus distribution system are conducted, where random attacks and deliberate attacks are used to simulate realistic uncertainties and worst-case scenarios. The simulation results demonstrate that the proposed method can significantly enhance the supply capability and disaster resilience of distribution networks, confirming the effectiveness of the vulnerability-oriented ESS planning framework. In addition,
Table 1 summarizes and compares representative ESS planning studies in terms of optimization objectives, solution algorithms, vulnerability characterization, and extreme-event considerations, as shown below.
3. Bi-Level Optimization Model for Energy Storage Allocation
3.1. Energy Storage Capacity Optimization Model
The capacity of the energy storage system is modeled based on its state of charge (SOC) and the corresponding charging and discharging periods. The state of charge of the storage device varies at each time depending on whether it is charging or discharging. Specifically, the following occurs:
- (1)
When the energy storage system is charging
- (2)
When the energy storage system is discharging
In the equation,
represents the state of charge of the energy storage system at time
;
denotes the self-discharge rate of the storage battery;
and
are the charging and discharging power of the storage system at time
, respectively.
and
represent the charging and discharging efficiencies. The energy storage capacity can be obtained from (15) as follows:
In the equation, denotes the energy storage capacity, which represents the total amount of energy required for charging and discharging while accounting for the self-discharge effect of the storage system over the entire time horizon.
3.2. Objective Function
Given the high installation and operation–maintenance costs associated with energy storage systems, it is essential to fully consider both the cost factors and the benefits they bring to the distribution network when planning storage deployment. To ensure the safety and economic efficiency of distribution network operation, this study adopts a multi-objective optimization framework using two evaluation indicators. The overall economic performance of the distribution network is defined as
, and the comprehensive line vulnerability is defined as
. Accordingly, the objective function
is formulated as follows:
In the equation, represents the minimum value within the optimization space constructed by the two objectives and ; denotes the feasible solution of the decision variables. The functions and correspond to the equality and inequality constraints that the model must satisfy, which together define the feasible region of the optimization problem.
3.2.1. Overall Economic Cost of the Distribution Network
The overall economic cost of system operation includes the full life-cycle cost of the energy storage configuration, network power loss cost, and the electricity purchase cost from the main grid:
In the equation, represents the comprehensive economic cost of the energy storage system; denotes the network power loss cost; and is the electricity purchase cost from the main grid.
- (1)
Comprehensive Economic Cost of the Energy Storage System
Referring to the full life-cycle cost model of energy storage systems, the comprehensive economic cost consists of the initial fixed investment cost, operating cost, operation and maintenance (O&M) cost, and government subsidy mechanisms. These components are formulated in (18):
The initial investment cost of ESS is determined by the number of installed units, the capacity, and the power rating of each unit:
where
denotes the number of installed ESS units;
and
represent the installed capacity (kWh) and power rating (kW) of the
-th battery unit, respectively; and
and
denote the unit capacity cost and unit power cost of
, respectively. Lithium-ion batteries with high comprehensive performance are selected as the ESS components, with cost parameters set as follows:
170/kWh and
USD 113/kW.
The operating cost of ESSs is related to the electricity price during charging and discharging periods:
where
and
represent the charging and discharging power of the
-th ESS unit at time
, respectively; and
and
denote the electricity purchase and selling prices at time
, respectively.
The O&M cost
is calculated as 5% of the initial investment cost:
The revenue from government subsidies for ESS electricity generation is given by
where
is the total government subsidy;
denotes the government subsidy per kWh of electricity generation, typically set at USD 0.017/kWh; and
is the time interval.
- (2)
Network Power Loss Cost of the Distribution System
The power loss in the distribution network can be obtained through system power flow calculation, as expressed in (23):
In the equation, denotes the economic cost associated with network power losses; represents the power loss of the distribution system at time ; e(t) is the electricity price at time ; denotes the conductance between nodes and ; and , , and are the voltage magnitudes of nodes and and their phase angle difference at time , respectively.
- (3)
Electricity Purchase Cost from the Main Grid
The electricity purchase cost from the main grid is determined by the electricity price and the power exchanged between the main grid and the distribution network, as expressed in (24):
In the equation, represents the electricity purchase cost of the distribution network from the main grid, and denotes the power injected from the main grid into the distribution network at time .
3.2.2. Comprehensive Vulnerability of the Distribution Network
The comprehensive vulnerability of the distribution network is jointly determined by its structural vulnerability, operational vulnerability, and network equilibrium. It is obtained from (10) as follows:
3.3. Constraints
- (1)
Voltage Constraints
In the equation, and denote the lower and upper voltage limits of node , respectively.
- (2)
Power Balance Constraint
In the equation, denotes the number of installed photovoltaic (PV) units; represents the active power output of the -th PV unit at time ; and is the total load demand at time .
- (3)
Line Power Flow Constraints
In the equation, and represent the active and reactive power injected at node at time , respectively.
- (4)
Constraints on the Total Active and Reactive Power Injected from the Upstream Grid into the Distribution Network
In the equation, , , , and represent the lower and upper limits of the active and reactive power exchanged through the tie line between the upstream grid and the distribution network.
- (5)
Constraints Related to the Energy Storage System. This includes the charging and discharging power limits and the SOC constraints.
In the equation, represents the state of charge of the -th energy storage unit.
4. Algorithmic Framework of the Proposed Model
The traditional Beluga Whale Optimization (BWO) algorithm is a recently developed swarm intelligence method that simulates the foraging and survival behaviors of beluga whale groups. It conducts global optimization through three key operators: exploration, exploitation, and whale-fall behavior. However, when addressing complex multi-objective optimization problems, the classical BWO still suffers from several limitations, including low-quality initial population, a tendency to fall into local optima, and insufficient balance between exploration and exploitation. These issues generally lead to slow convergence and suboptimal solution quality.
To overcome these drawbacks, this study proposes an Enhanced Beluga Whale Optimization algorithm (EBWO). The algorithm incorporates a quasi-oppositional learning strategy to improve the distribution quality of the initial population, introduces a spiral foraging mechanism to strengthen global search capability, and designs an adaptive exploration–exploitation switching mechanism to maintain a better balance during the search process. In addition, improved Lévy flight and whale-fall operators are integrated to enhance local refinement ability and increase the probability of escaping local optima.
4.1. Quasi-Opposition-Based Learning (QOBL) Initialization Strategy
To enhance the distribution of the initial population and improve both the quality and diversity of the initial solutions, the quasi-oppositional based learning (QOBL) strategy is incorporated. For each individual
, its opposite solution and quasi-opposite solution are computed as follows:
In the equation,
denotes the center of the search interval in the
-th dimension, and
represents the complete opposite solution of
. The quasi-oppositional learning position is then updated as follows:
By comparing the fitness values of the original solution and its quasi-opposite counterpart, the better one is retained in the population. This strategy applies a “mirroring and stretching” operation to the current solutions in each generation, thereby increasing the likelihood of escaping from local optima.
4.2. Spiral Foraging Strategy
After applying the QOBL strategy, a spiral foraging mechanism inspired by manta ray hunting behavior is introduced to further enhance the global exploration capability in each iteration. Let
denote the current global best solution. The spiral factor in generation
is defined as follows:
For the
-th individual, its position is updated according to the following equation:
In the equation, . If , the updated position is directly accepted. This strategy enables each individual to move toward global optimum while simultaneously forming a spiral search trajectory along a “chain-like path,” thereby enhancing its fine-grained exploitation capability in the vicinity of the global best solution.
4.3. Multi-Objective EBWO Procedure
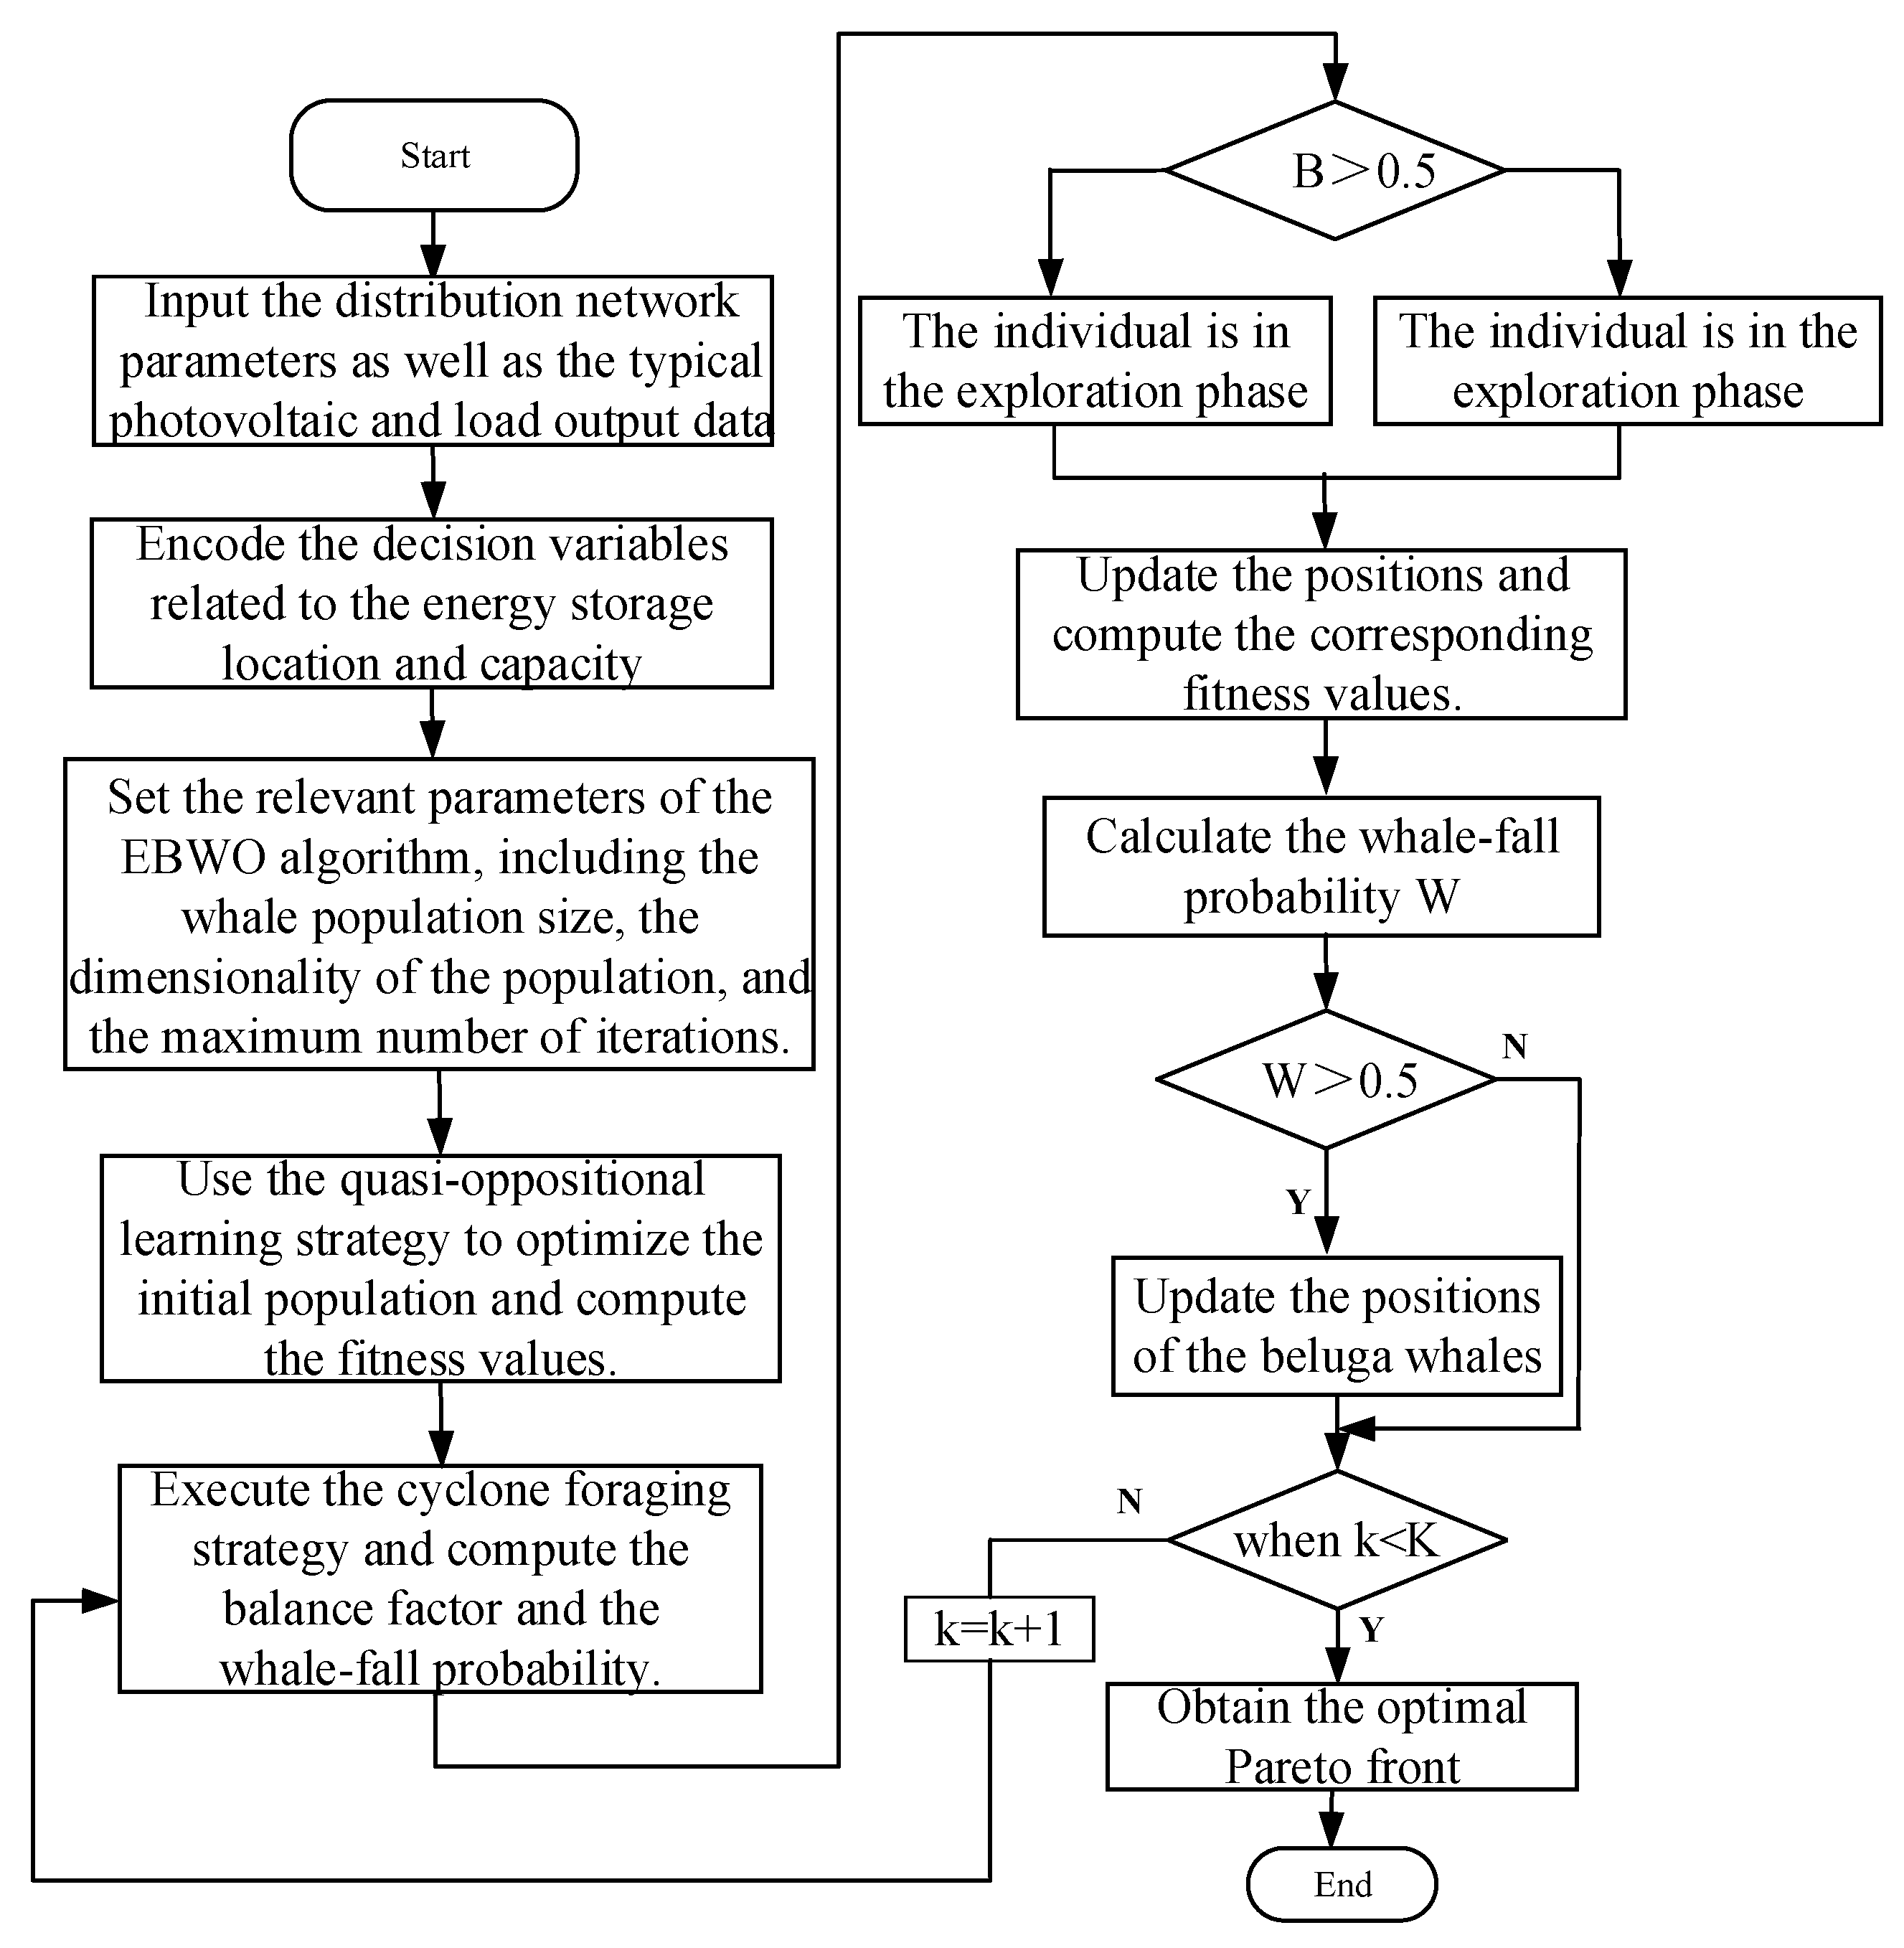
To efficiently solve the proposed bi-objective energy storage planning model, an enhanced multi-objective EBWO framework is developed. The algorithm begins by generating a high-quality initial population through the QOBL initialization strategy. During each iteration, spiral foraging, adaptive exploration–exploitation switching, Lévy flight perturbation, and whale-fall operators are sequentially applied to maintain population diversity and strengthen the approximation capability toward the Pareto front. Throughout the optimization process, an external elite archive is employed to store and update all non-dominated solutions, ensuring that only high-quality candidates are preserved according to dominance relations.
After convergence, the objective values of all archived solutions are normalized and processed with entropy weight calculation to determine the relative importance of each objective. Two decision-making approaches—entropy-weighted TOPSIS and entropy-weighted Euclidean distance—are subsequently adopted to assess the comprehensive performance of candidate solutions and to identify representative compromise solutions for energy storage allocation and operational analysis. Through this process, the enhanced EBWO achieves balanced improvements in global exploration, convergence speed, and solution diversity, providing an effective and robust tool for bi-objective planning. The detailed flowchart of the proposed approach is illustrated in
Figure 3.
4.4. Algorithm Performance Evaluation
To further verify the effectiveness of the proposed EBWO algorithm and examine its adaptability to different types of Pareto fronts, three standard multi-objective benchmark functions, ZDT1, ZDT2, and ZDT3, are selected for comparative experiments. ZDT1 corresponds to a continuous convex front, ZDT2 to a concave front, and ZDT3 to a complex, discontinuous front composed of several disconnected segments. These benchmarks jointly provide a comprehensive test of the algorithm’s performance under different front geometries.
In all tests, the decision dimension is set to 10. The population size and maximum number of iterations of all algorithms are kept identical so that the total number of function evaluations (population size × iterations) is the same. Each setting is independently run 10 times. The Inverted Generational Distance (IGD) is adopted as the performance metric, and the IGD–iteration curves are recorded together with the mean IGD at the final iteration. A smaller IGD indicates that the obtained non-dominated set is closer to the analytical Pareto front, implying better overall performance in terms of convergence and diversity.
- (1)
Analysis of IGD Convergence Behavior
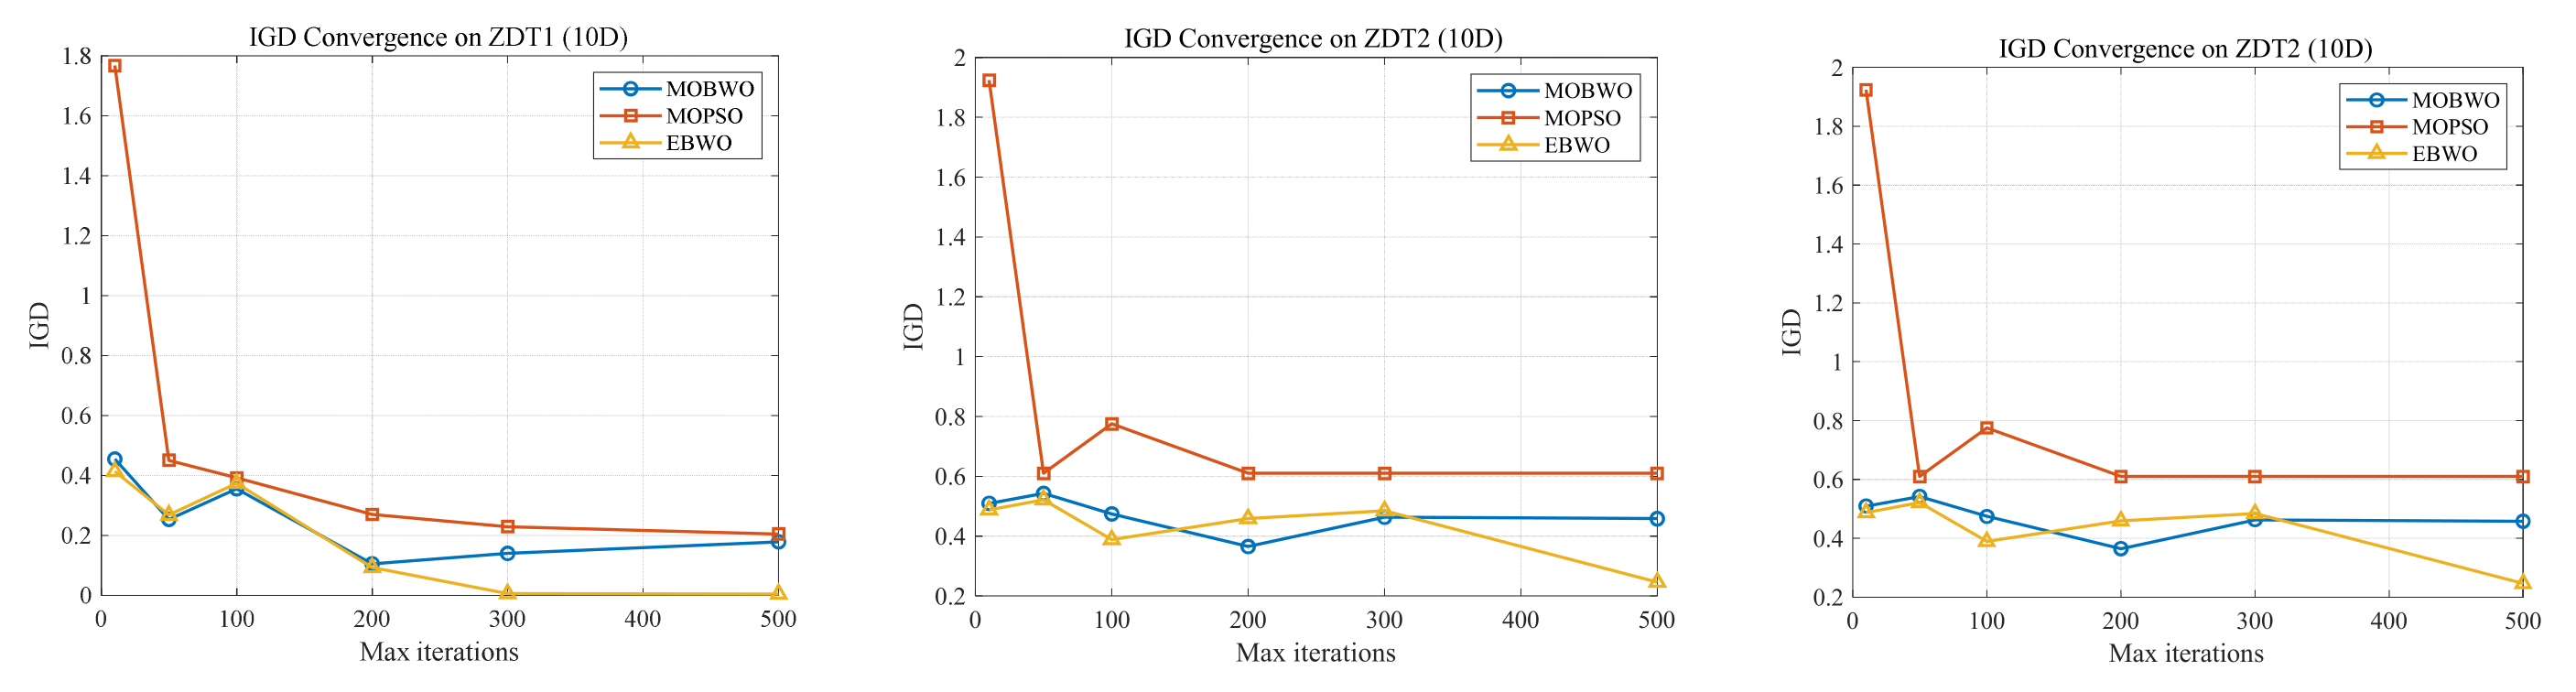
As shown in
Figure 4, which depicts the IGD convergence curves of the three algorithms on ZDT1–ZDT3, the following observations can be made:
For all three benchmark problems, the IGD values of MOBWO, MOPSO, and EBWO decrease with the increase in iteration number, indicating that all three algorithms possess basic convergence capability.
Concerning ZDT1, the IGD of EBWO drops much faster than those of the other two algorithms. EBWO reduces IGD to a low level within a relatively small number of iterations (about 100–200 generations), whereas MOBWO and MOPSO still remain at much higher IGD levels under the same number of iterations and converge more slowly in the later stages. Regarding ZDT2, EBWO consistently achieves the lowest IGD among the three algorithms at all iteration stages, demonstrating a stronger capability of approximating concave Pareto fronts. MOPSO yields the highest IGD throughout the run and exhibits a clear plateau in the middle and late iterations, suggesting weaker convergence and diversity on this type of problem. The performance of MOBWO lies between EBWO and MOPSO. For ZDT3, all three algorithms show a gradually decreasing IGD, but the final IGD differences are relatively smaller. Under the current parameter settings, MOBWO attains the smallest final IGD, while the final IGD values of EBWO and MOPSO are slightly higher but of the same order of magnitude. This indicates that for complex problems with multiple disconnected front segments, EBWO and MOBWO exhibit comparable overall performance, with MOPSO being slightly inferior.
In summary, the numerical experiments on the ZDT1–ZDT3 benchmark functions show that, under the same number of function evaluations, EBWO generally outperforms MOBWO and MOPSO in terms of convergence speed, approximation accuracy and, in most cases, the quality of the obtained Pareto fronts, while achieving performance comparable to MOBWO on the discontinuous ZDT3 problem. These benchmark results confirm the effectiveness and robustness of the proposed algorithm and provide a solid algorithmic basis for its subsequent application to energy storage planning. The population size, maximum number of iterations, and main control parameters of EBWO are chosen following the settings in [
29], in order to ensure consistency and comparability with existing studies on improved BWO algorithms.
5. Case Studies
5.1. Basic Parameters of the Test System
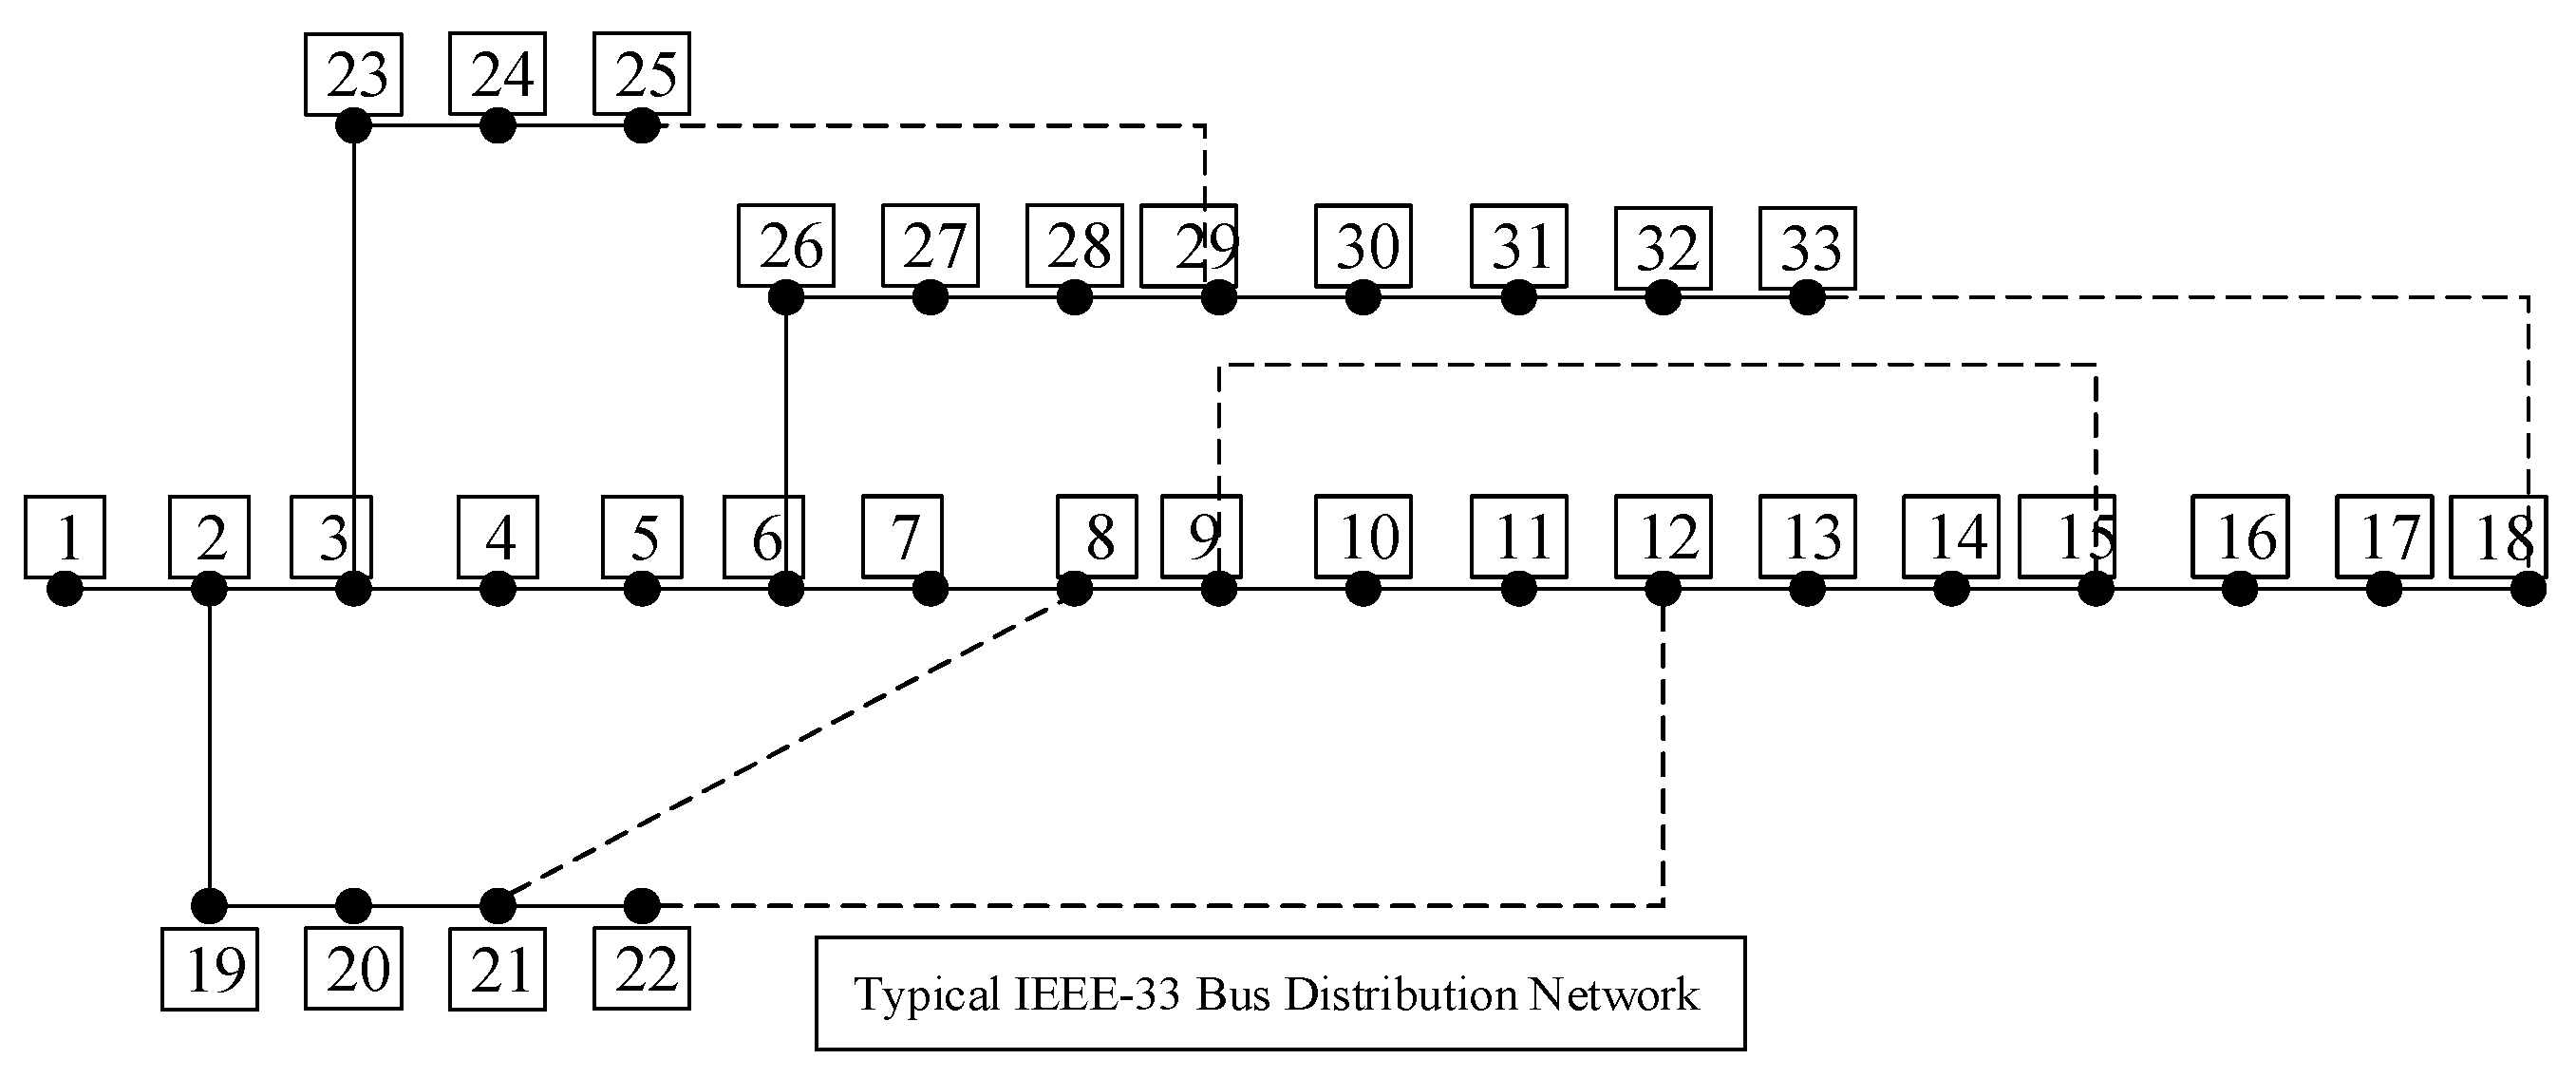
Simulation studies are conducted on a modified IEEE-33 bus distribution network incorporating distributed photovoltaic (PV) units to verify the effectiveness of the proposed vulnerability identification method and the energy storage optimization strategy. The topology of the test system is shown in
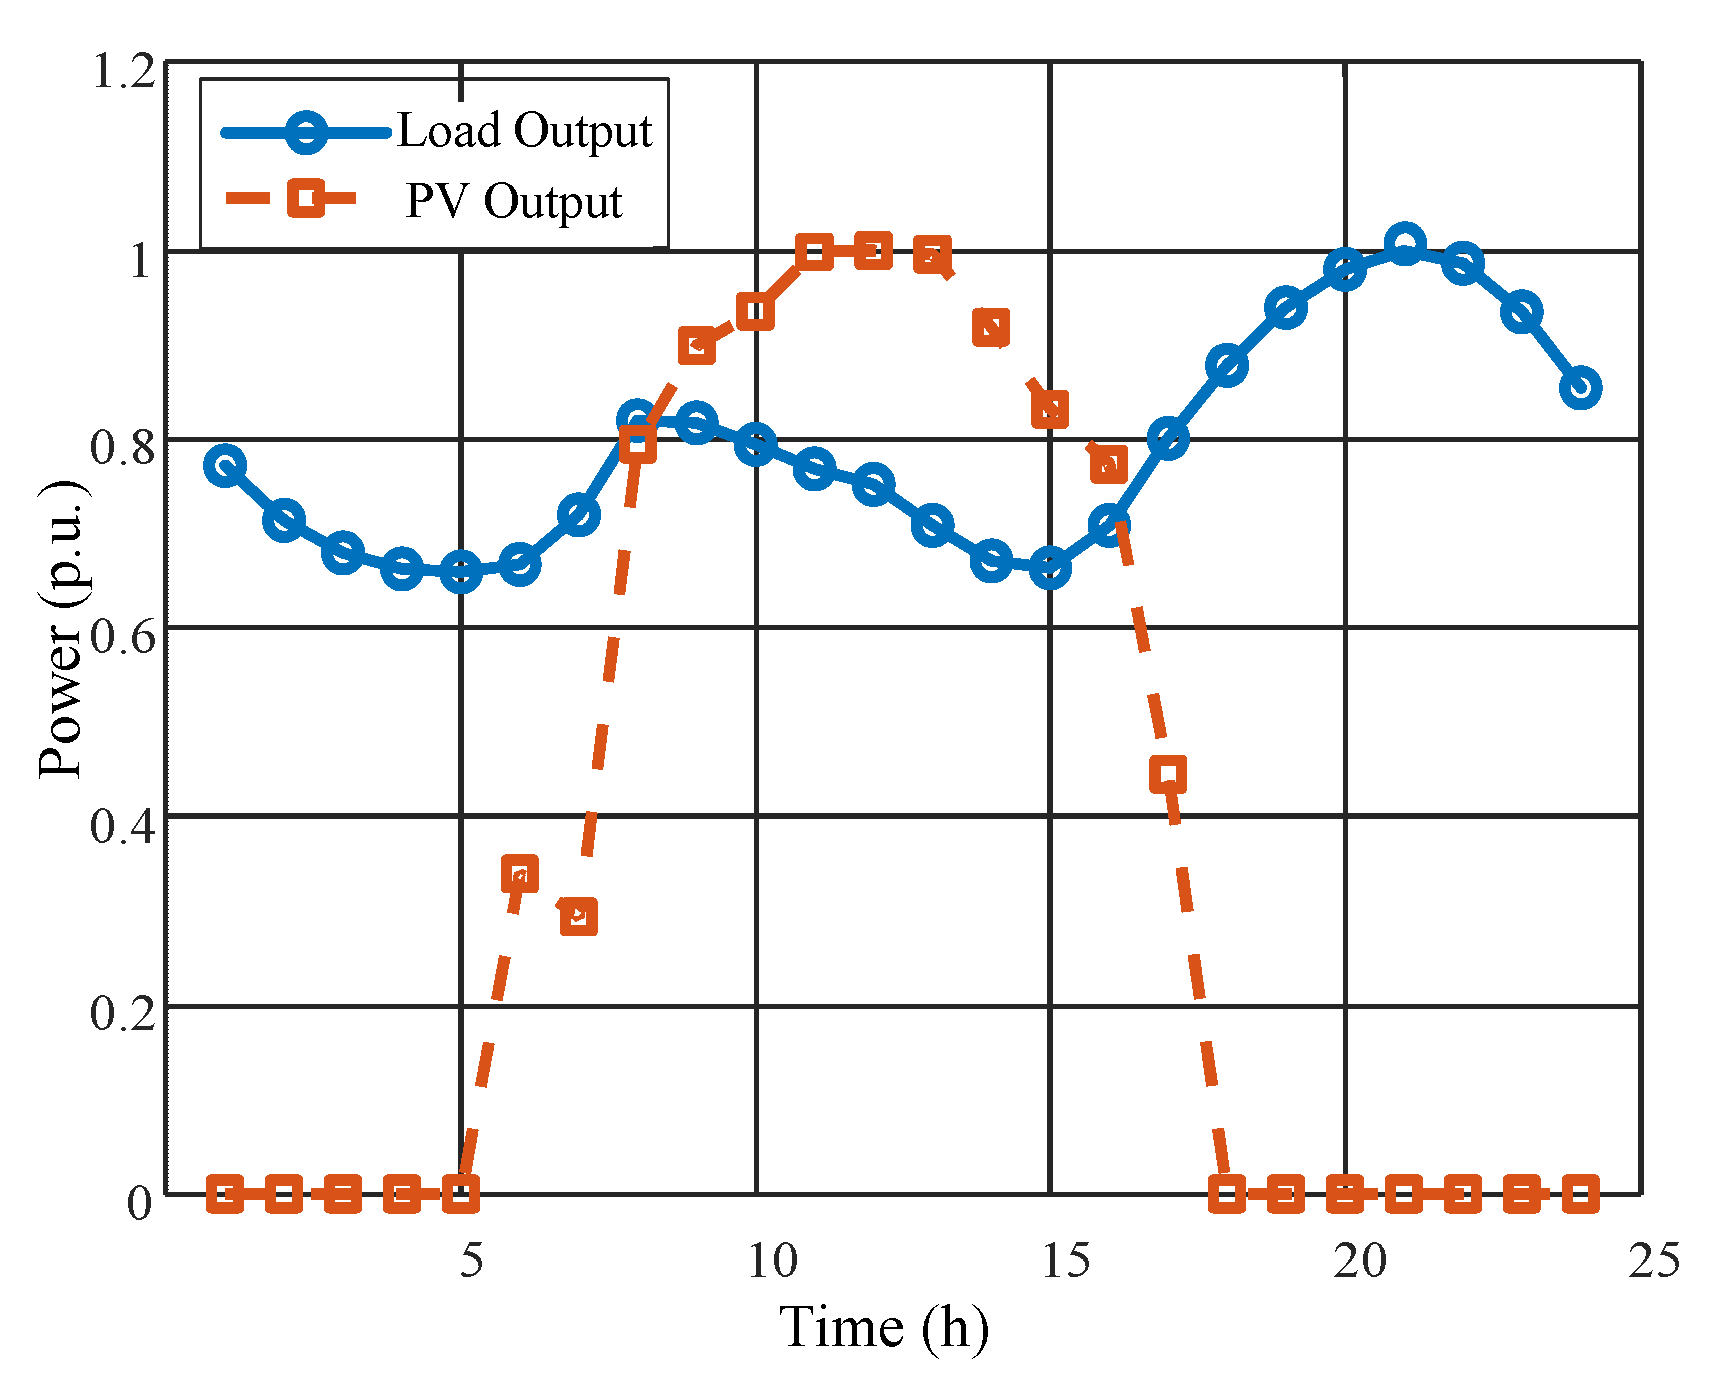
Figure 5. The total system load is 3715 kW + j2300 kvar, the base power is 10 MVA, and the nominal line-to-line voltage is 12.66 kV. The allowable voltage range for all nodes is 0.95–1.05 pu. Distributed PV units are connected at buses 10, 15, and 30. The system load profiles and wind/PV output data are obtained from normalized field-measured data from a region in Northwest China, as shown in
Figure 6.
5.2. Identification Results of Distribution Network Weak Points
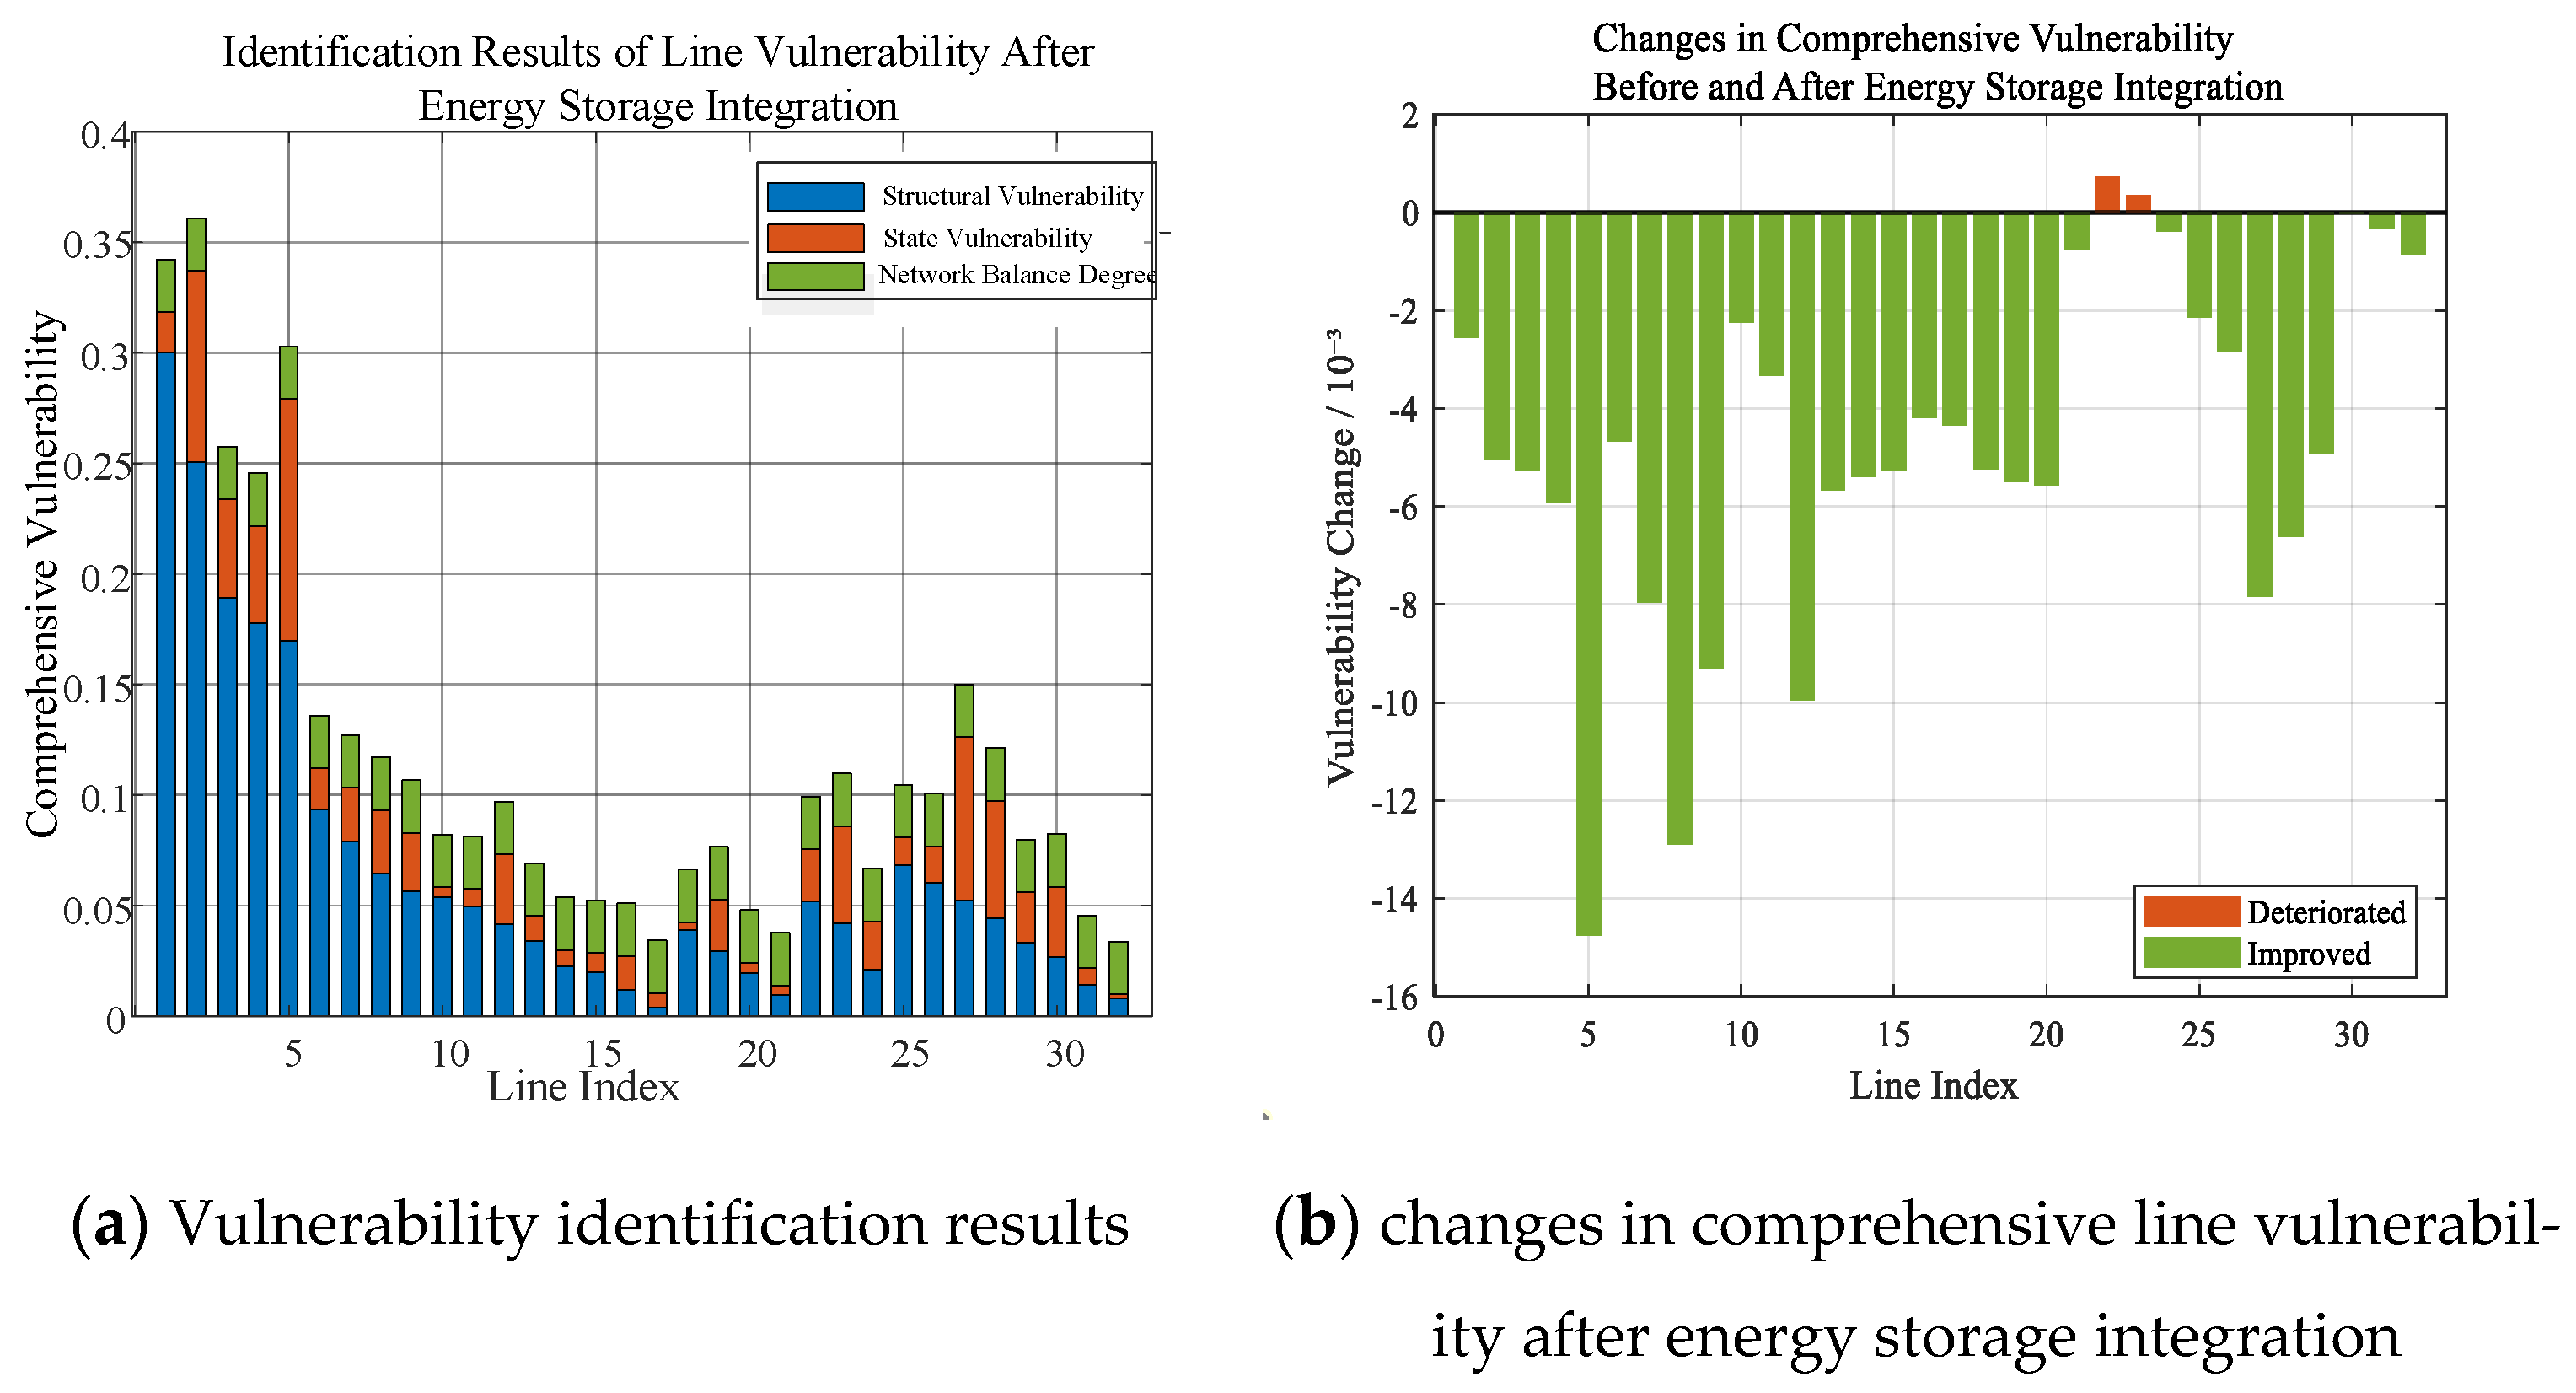
Based on Equations (1)–(9), the normalized values of the comprehensive vulnerability index for each distribution line are obtained, as shown in
Figure 7a. As illustrated in
Figure 5, due to the radial structure of the distribution system, lines closer to the source node exhibit larger modified electrical betweenness values.
Figure 7b presents the comparison of the comprehensive network vulnerability before and after the integration of energy storage. It can be observed that, after energy storage access, only Line 22 and Line 23 experience a slight increase in vulnerability, while the vulnerability of all remaining lines is improved. This indicates that selecting appropriate energy storage locations together with optimized charging–discharging strategies can effectively reduce network vulnerability and enhance the overall stability of the distribution system.
Table 2 presents the ranking results of line vulnerability in the IEEE-33 distribution system based on the comprehensive vulnerability index proposed in this study. The top ten most vulnerable lines are identified as Lines 1, 5, 3, 4, 27, 6, 7, 28, and 8. As shown in
Table 3, compared with the results reported in [
30,
31], Lines 1, 2, 3, 4, 5, 7, and 8 consistently appear in the vulnerable line sets identified in both references. Lines 27 and 28 exhibit slight ranking discrepancies due to their closely valued vulnerability indices. Overall, more than 50% of the top ten ranked lines overlap with the results of the two references, which further validates the effectiveness of the proposed vulnerability identification method.
5.3. Energy Storage Optimization Results
To verify the effectiveness of the proposed energy storage optimization model and the enhanced optimization algorithm, three deterministic test scenarios are designed:
Scheme 1: No energy storage is integrated, and the system is evaluated based on the original distribution network parameters.
Scheme 2: Energy storage is configured according to the vulnerability-based method proposed in Ref. [
25].
Scheme 3: Energy storage is configured using the proposed method that jointly considers comprehensive vulnerability and economic performance.
The optimal solution set is selected using the improved EBWO algorithm and the entropy-weighted TOPSIS method. The results of the three schemes are summarized in
Table 4.
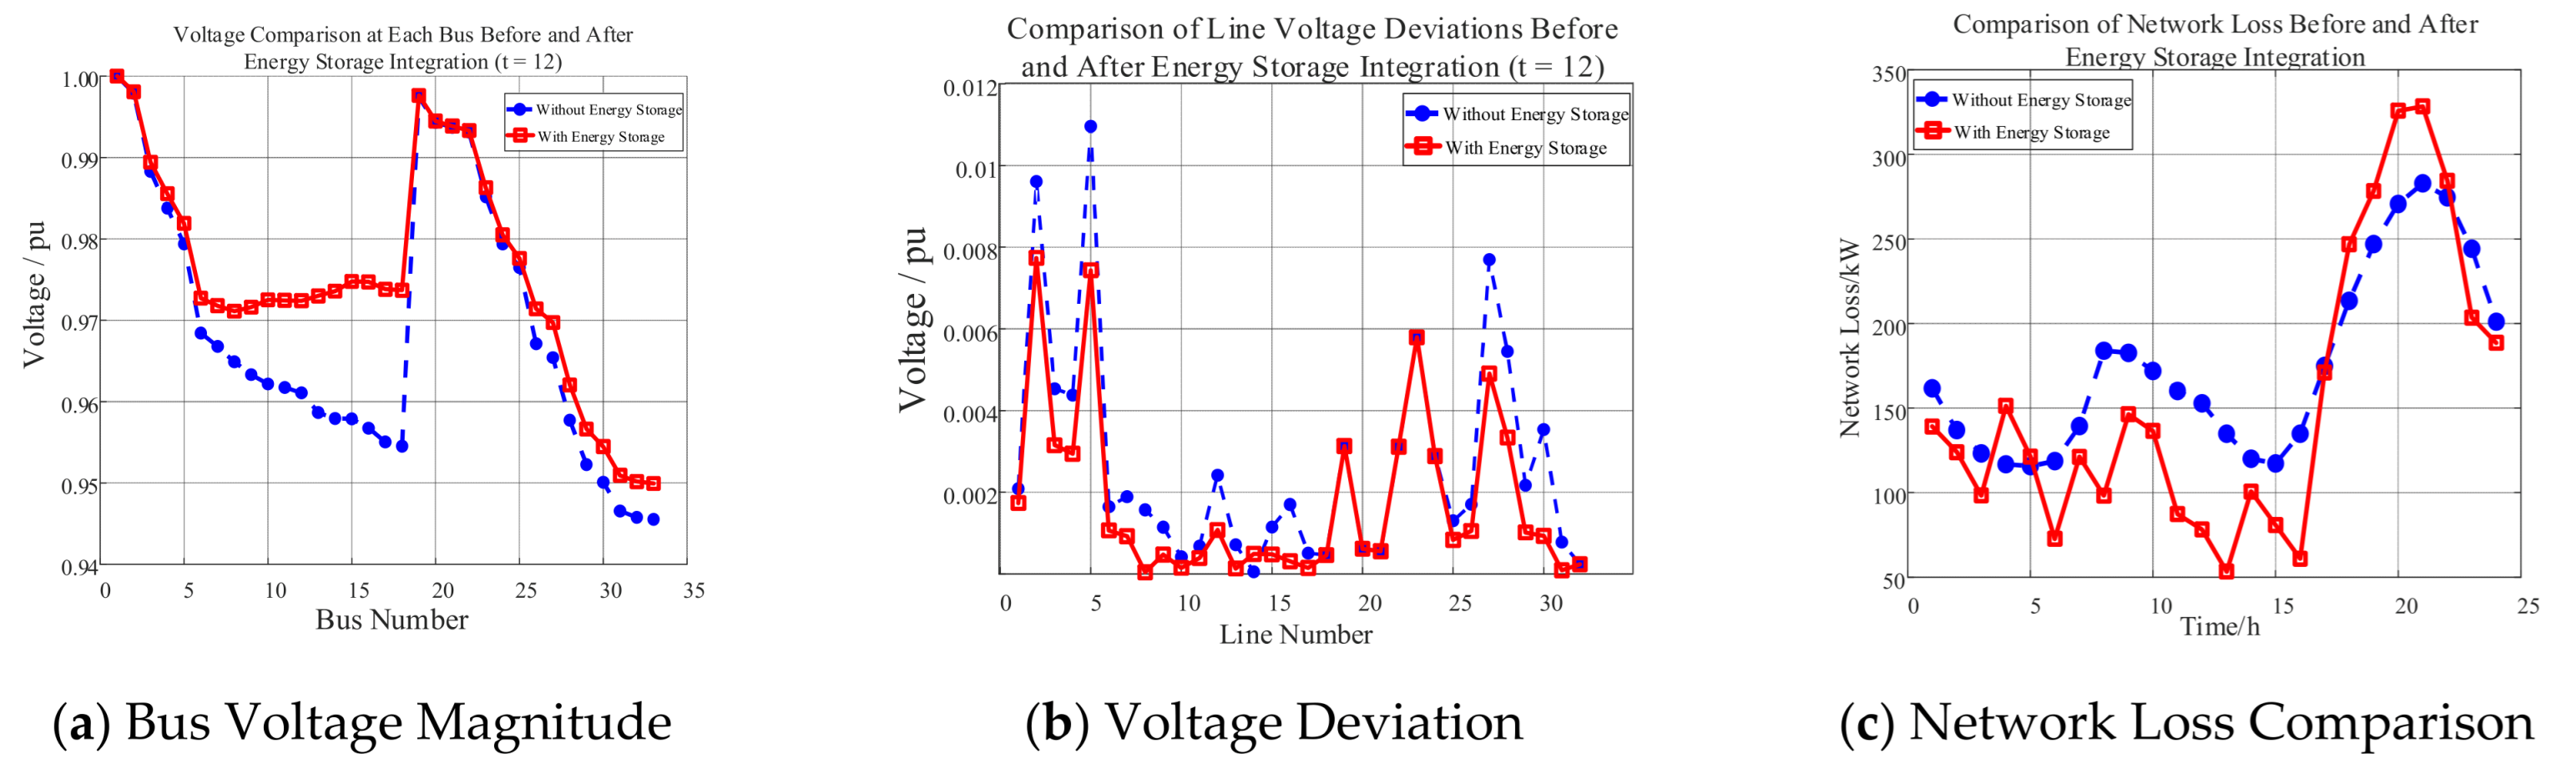
Figure 8a,b illustrate the voltage magnitude and voltage deviation of all buses at
t = 12 s before and after energy storage integration under the optimal configuration of Scheme 3.
Figure 8c shows the improvement in network power loss after the integration of energy storage.
Based on the results in
Table 4, for the improved IEEE 33-bus distribution system, when ESSs are configured according to Scheme 3 (installed at buses 24, 26, and 11 with capacities of 2038.22 kWh, 3544.56 kWh, and 2304.31 kWh, respectively), the network loss cost is reduced by about 66.44%, the average voltage deviation decreases by about 22.05%, and the comprehensive vulnerability index drops by approximately 10.0% compared with the no-ESS Scheme 1. Compared with Scheme 2, Scheme 3 also yields a lower ESS investment cost while maintaining better voltage profiles during normal operation.
Compared with Scheme 2, the ESS investment cost under Scheme 3 is reduced by 23.49%, and the average voltage deviation is also slightly improved. These results indicate that the proposed ESS allocation method achieves superior economic performance and voltage deviation mitigation during normal operation.
Compared with Scheme 2, the ESS investment cost under Scheme 3 is reduced by 23.49%, and the average voltage deviation is also slightly improved. These results indicate that the proposed ESS allocation method achieves better economic performance and voltage deviation mitigation during normal operation in the improved IEEE 33-bus test system.
5.4. Verification of Supply Restoration Capability Based on Network Supply Effectiveness
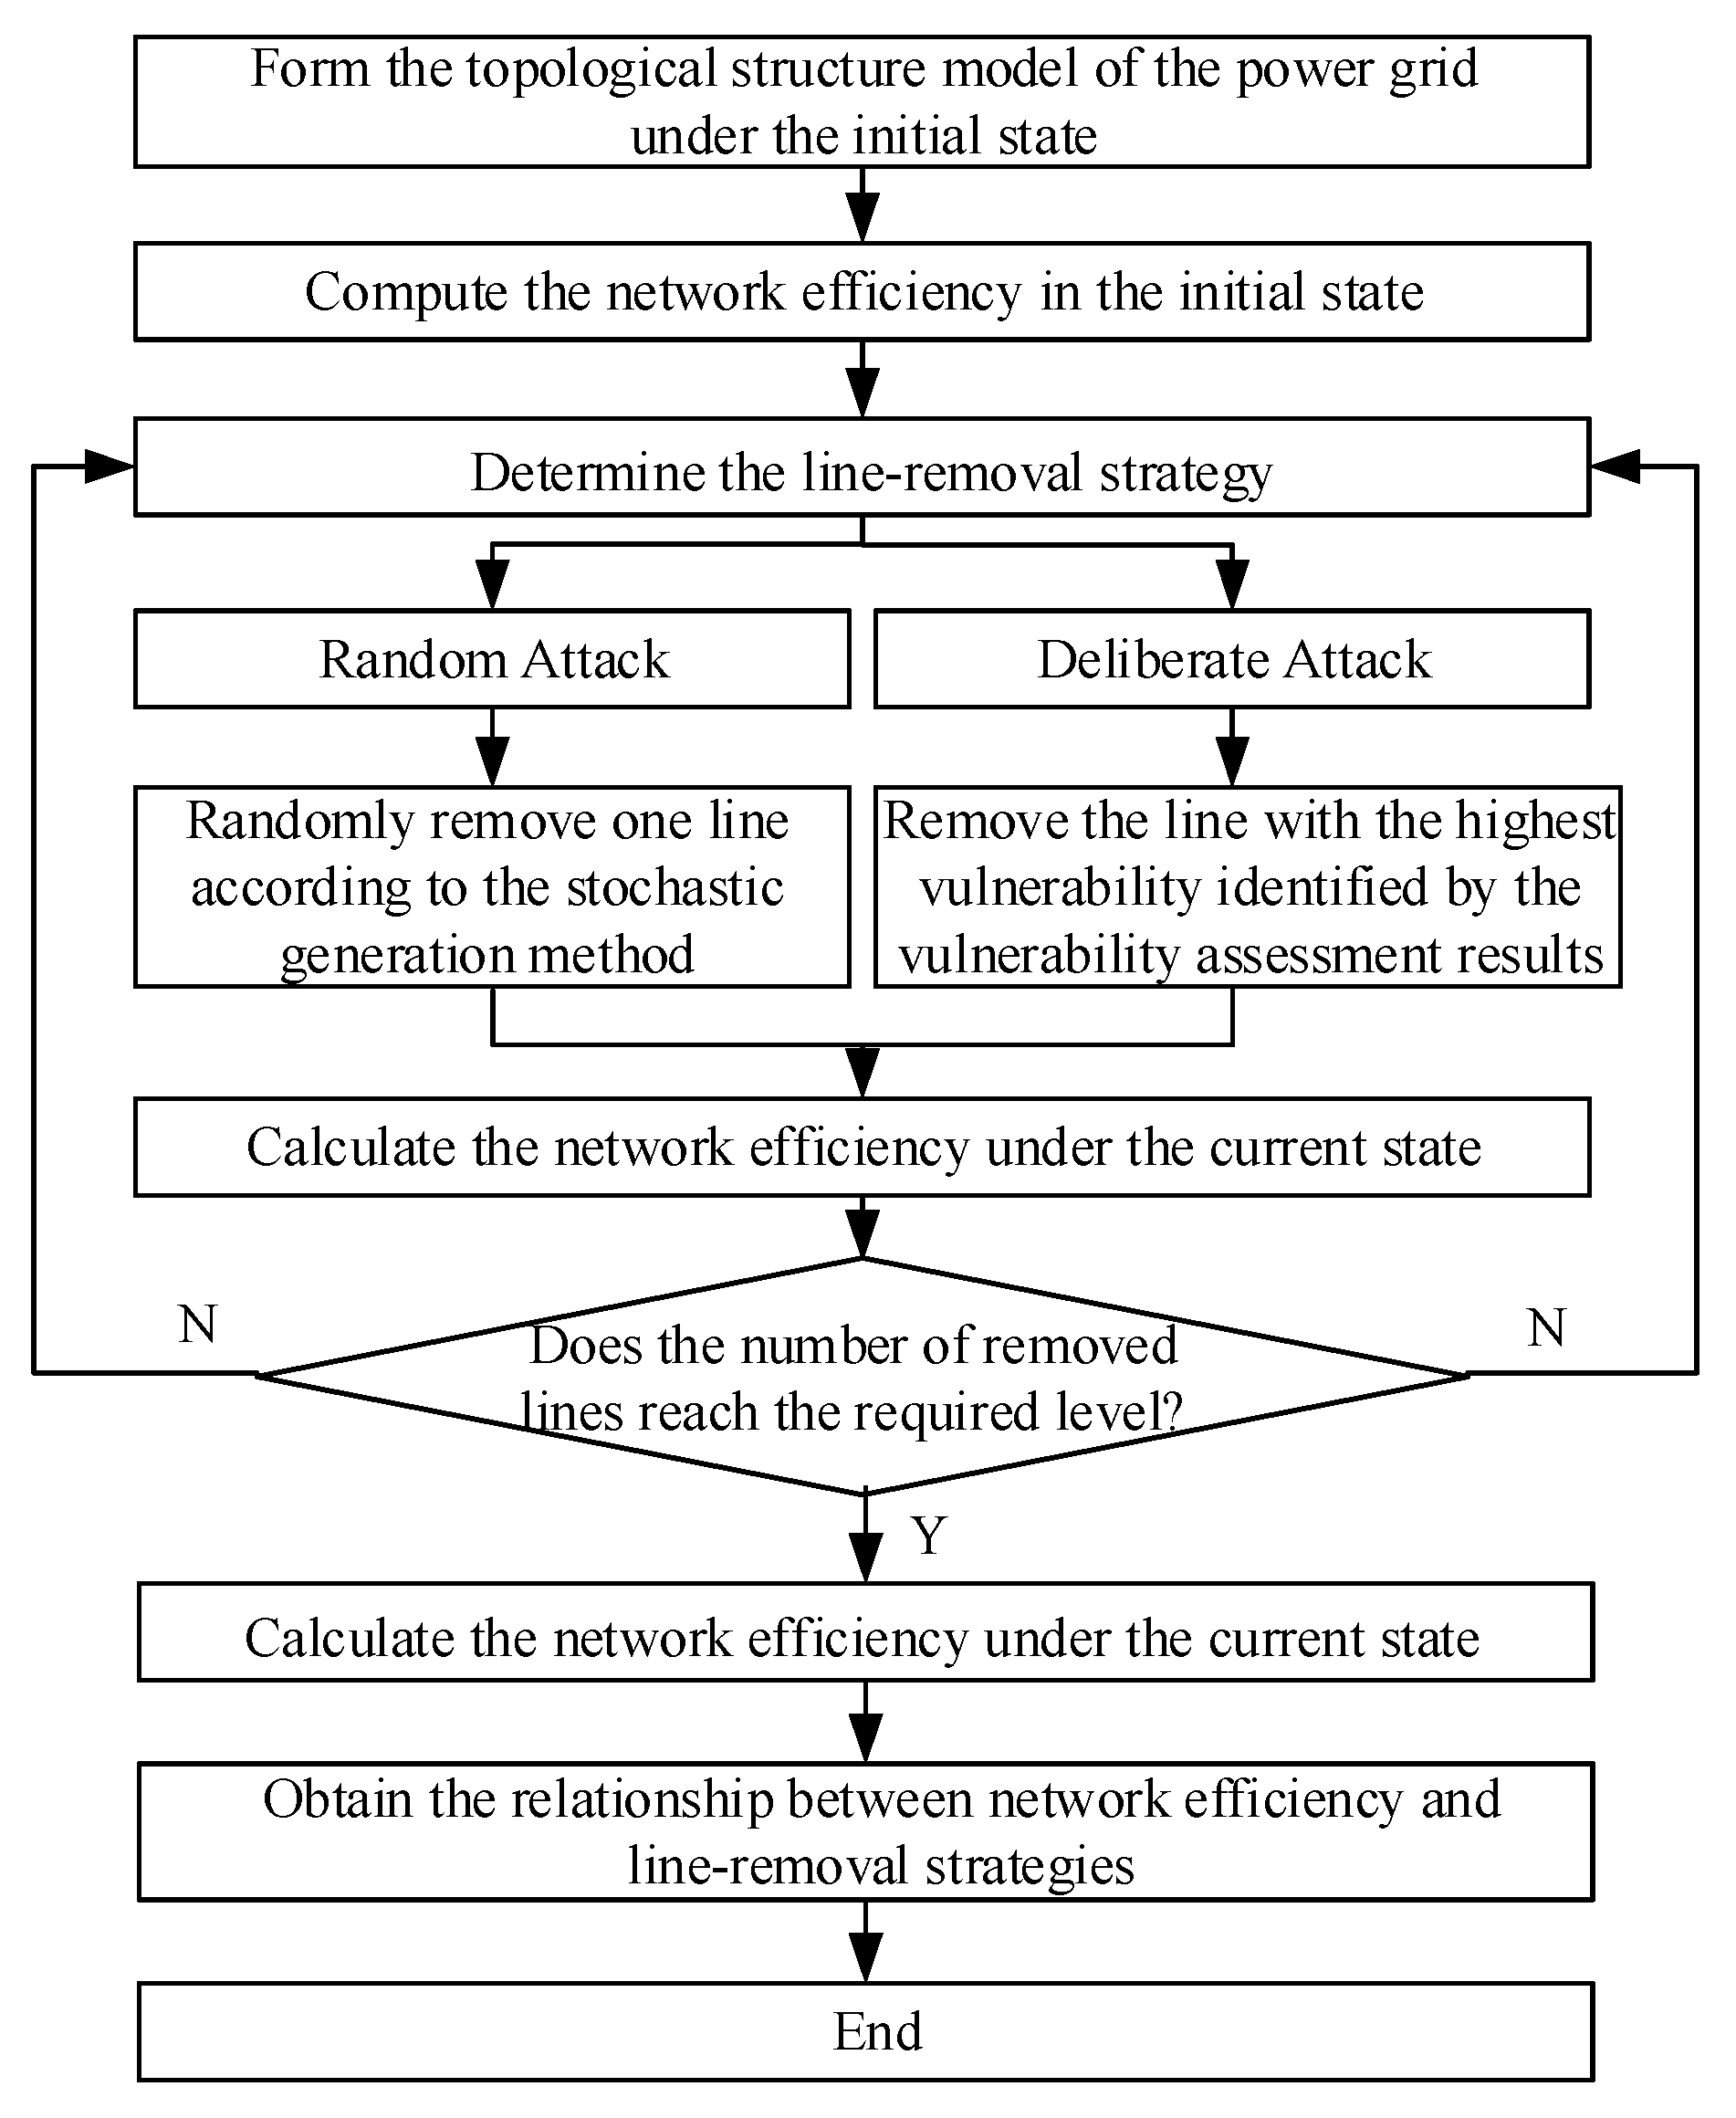
To further verify the supply restoration capability of the distribution network with ESS integration under post-fault conditions, two types of outage scenarios are constructed to emulate both random disasters and worst-case attacks. In the random attack scenario, lines in the network are randomly disconnected and 100 Monte Carlo trials are performed to capture the uncertainty of fault locations and combinations. In the intentional attack scenario, the lines are sequentially disconnected according to the comprehensive vulnerability ranking obtained in
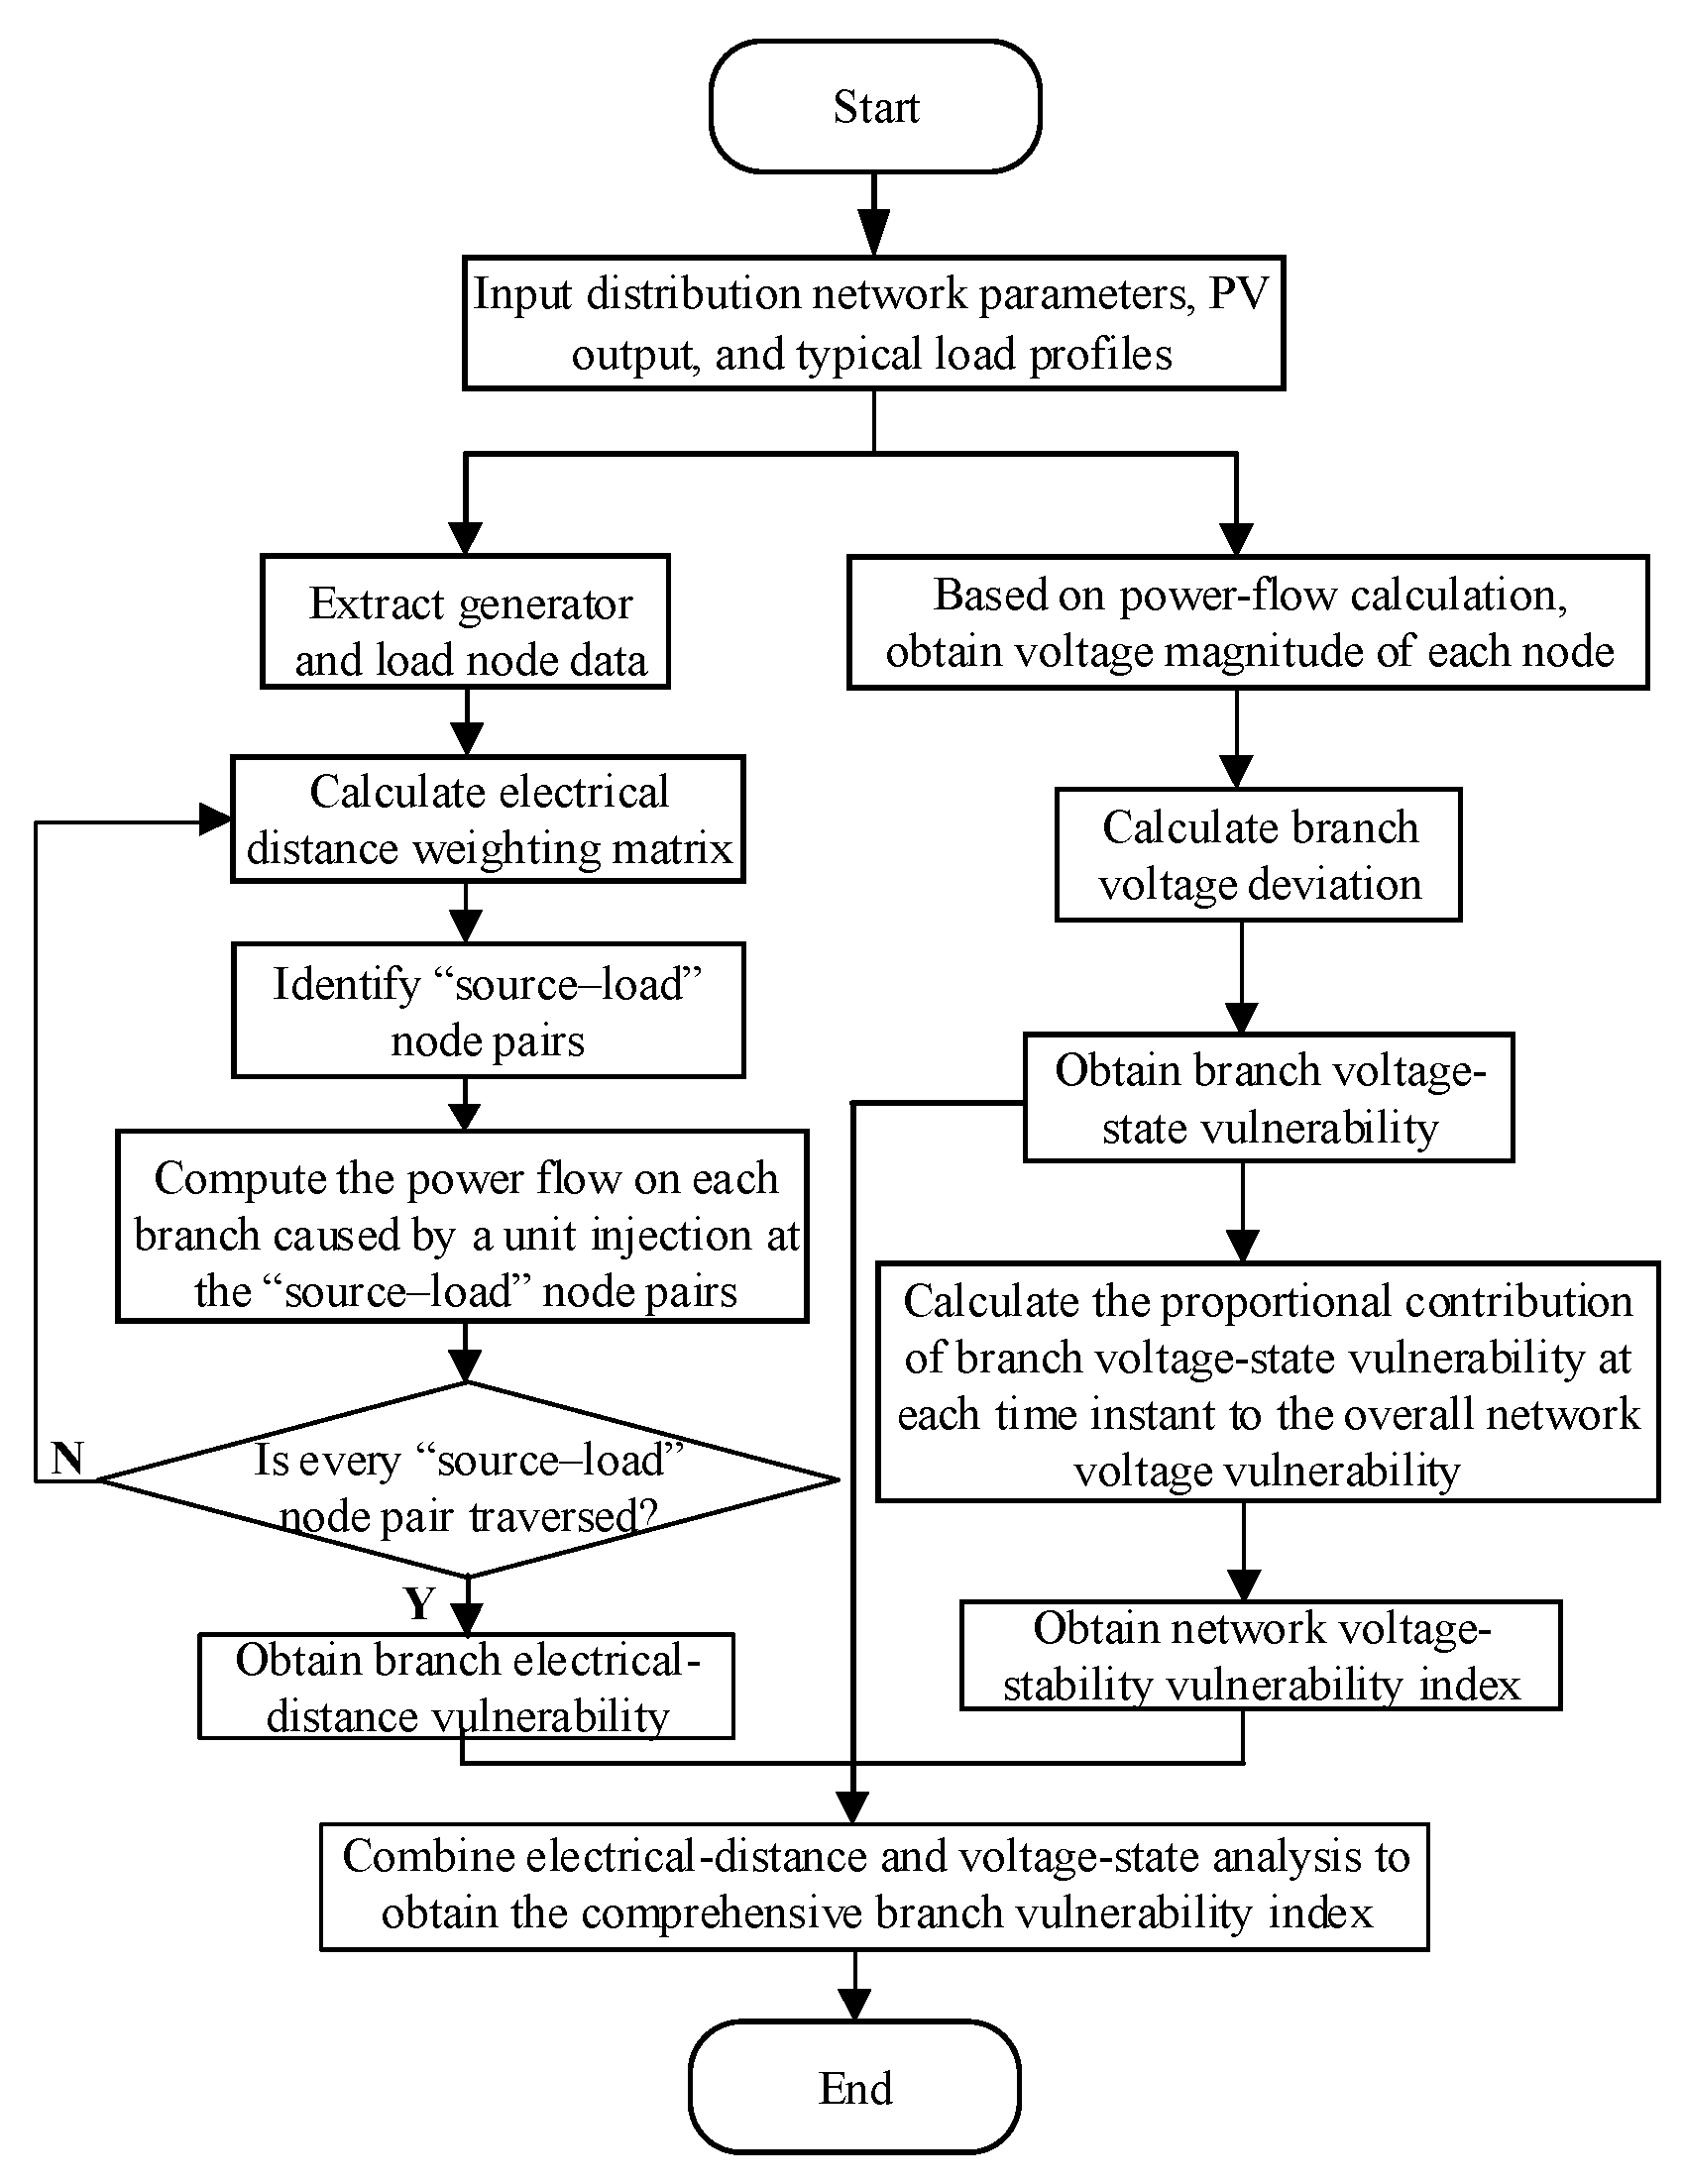
Section 4.2, where the most vulnerable lines identified in the planning stage are treated as deliberate attack targets. In this way, the post-event simulations are coherently linked to the pre-event vulnerability assessment and provide a practical means to validate the robustness of the ESS deployment schemes derived from the multi-objective planning model. The specific workflow is illustrated in
Figure 9.
The evolution of network performance during the progressive line outage process is evaluated using the network supply effectiveness index, which quantifies the proportion of load that can still be supplied after each outage state. To comprehensively compare the different schemes obtained in
Section 5.3, three robustness metrics are calculated from the network effectiveness curves, the area under curve (AUC), the mean effectiveness μ, and the standard deviation ϕ, as defined in (36)–(38). AUC reflects the overall supply–performance level throughout the fault process, μ characterizes the average supply capability, and ϕ measures the volatility of performance under random faults. These indicators enable a clear comparison of how the proposed vulnerability-driven ESS allocation and the baseline schemes differ in terms of post-fault restoration capability and robustness.
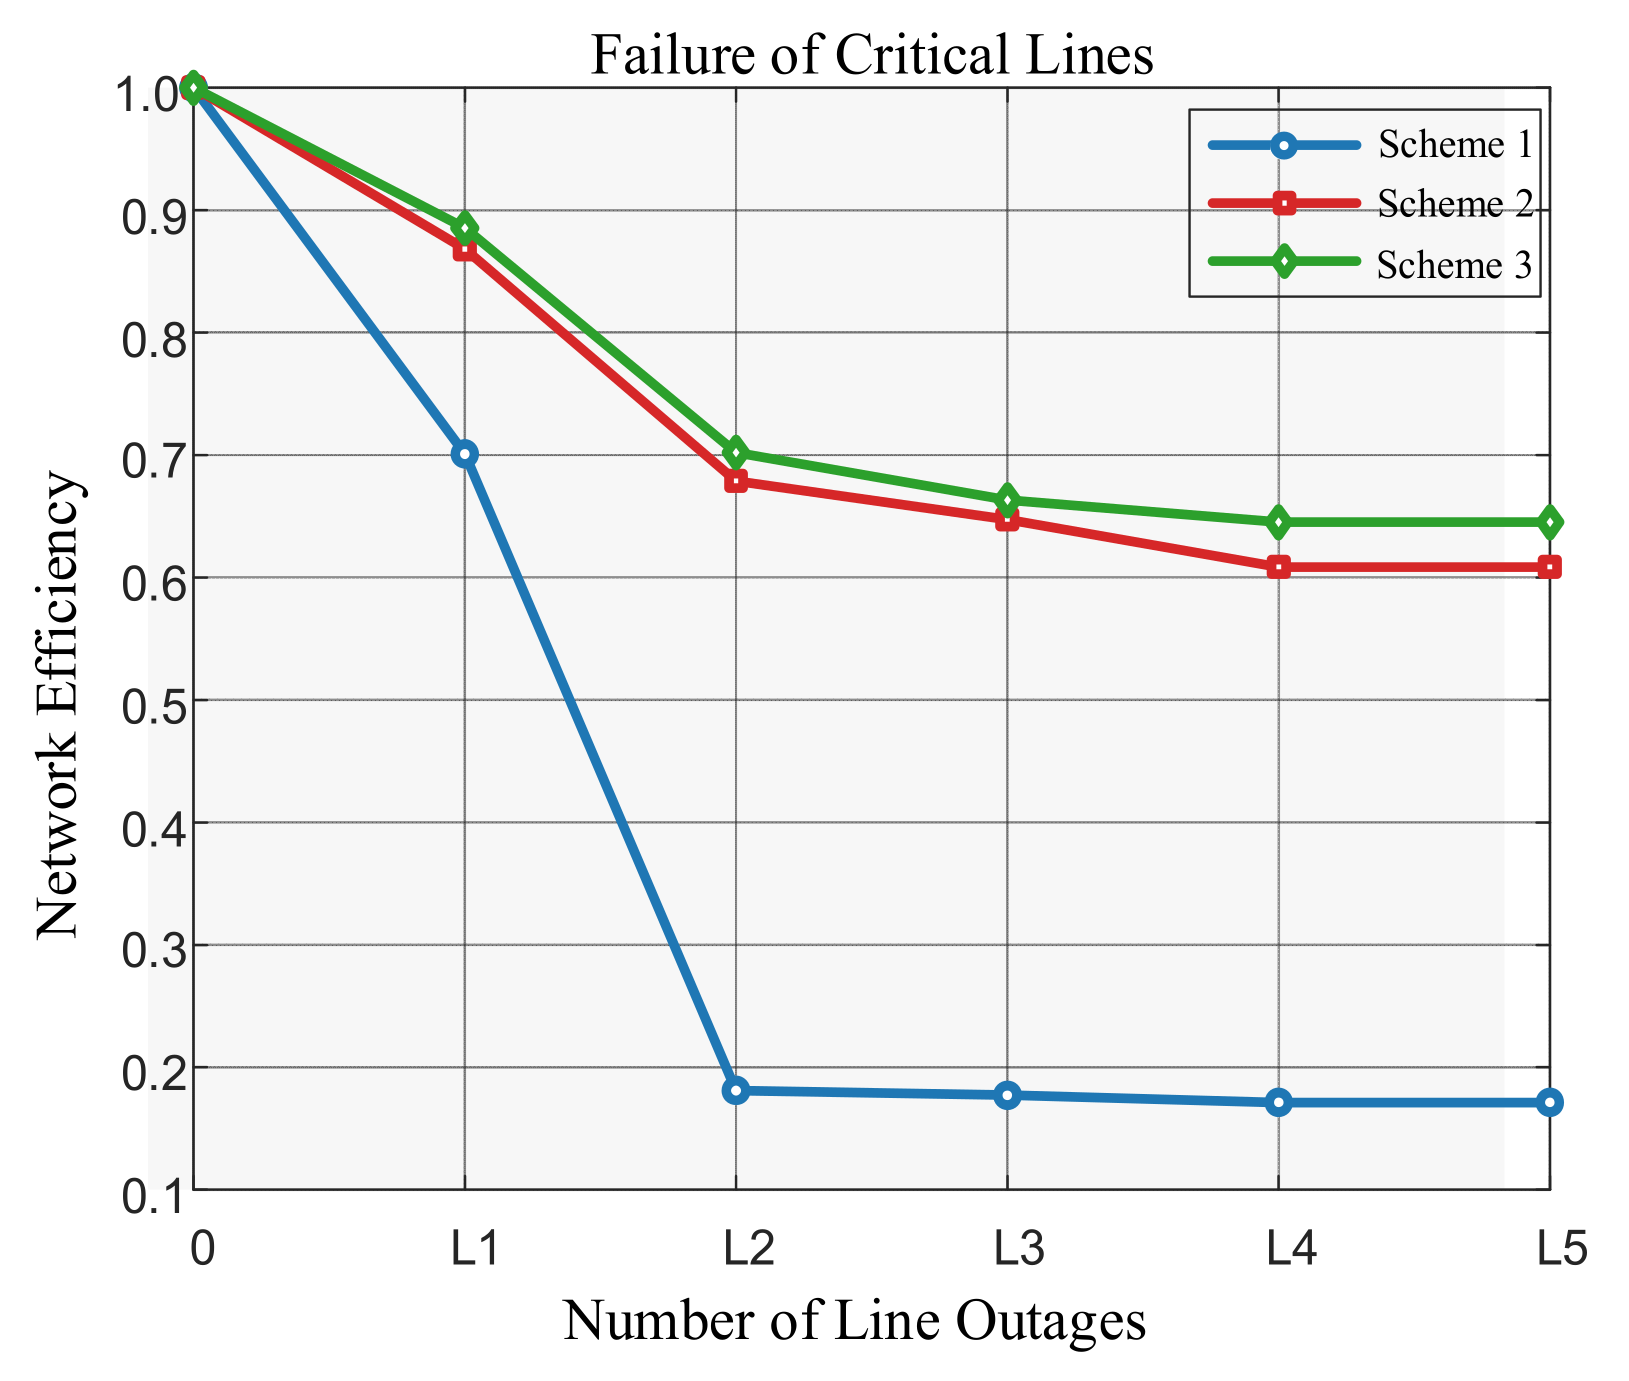
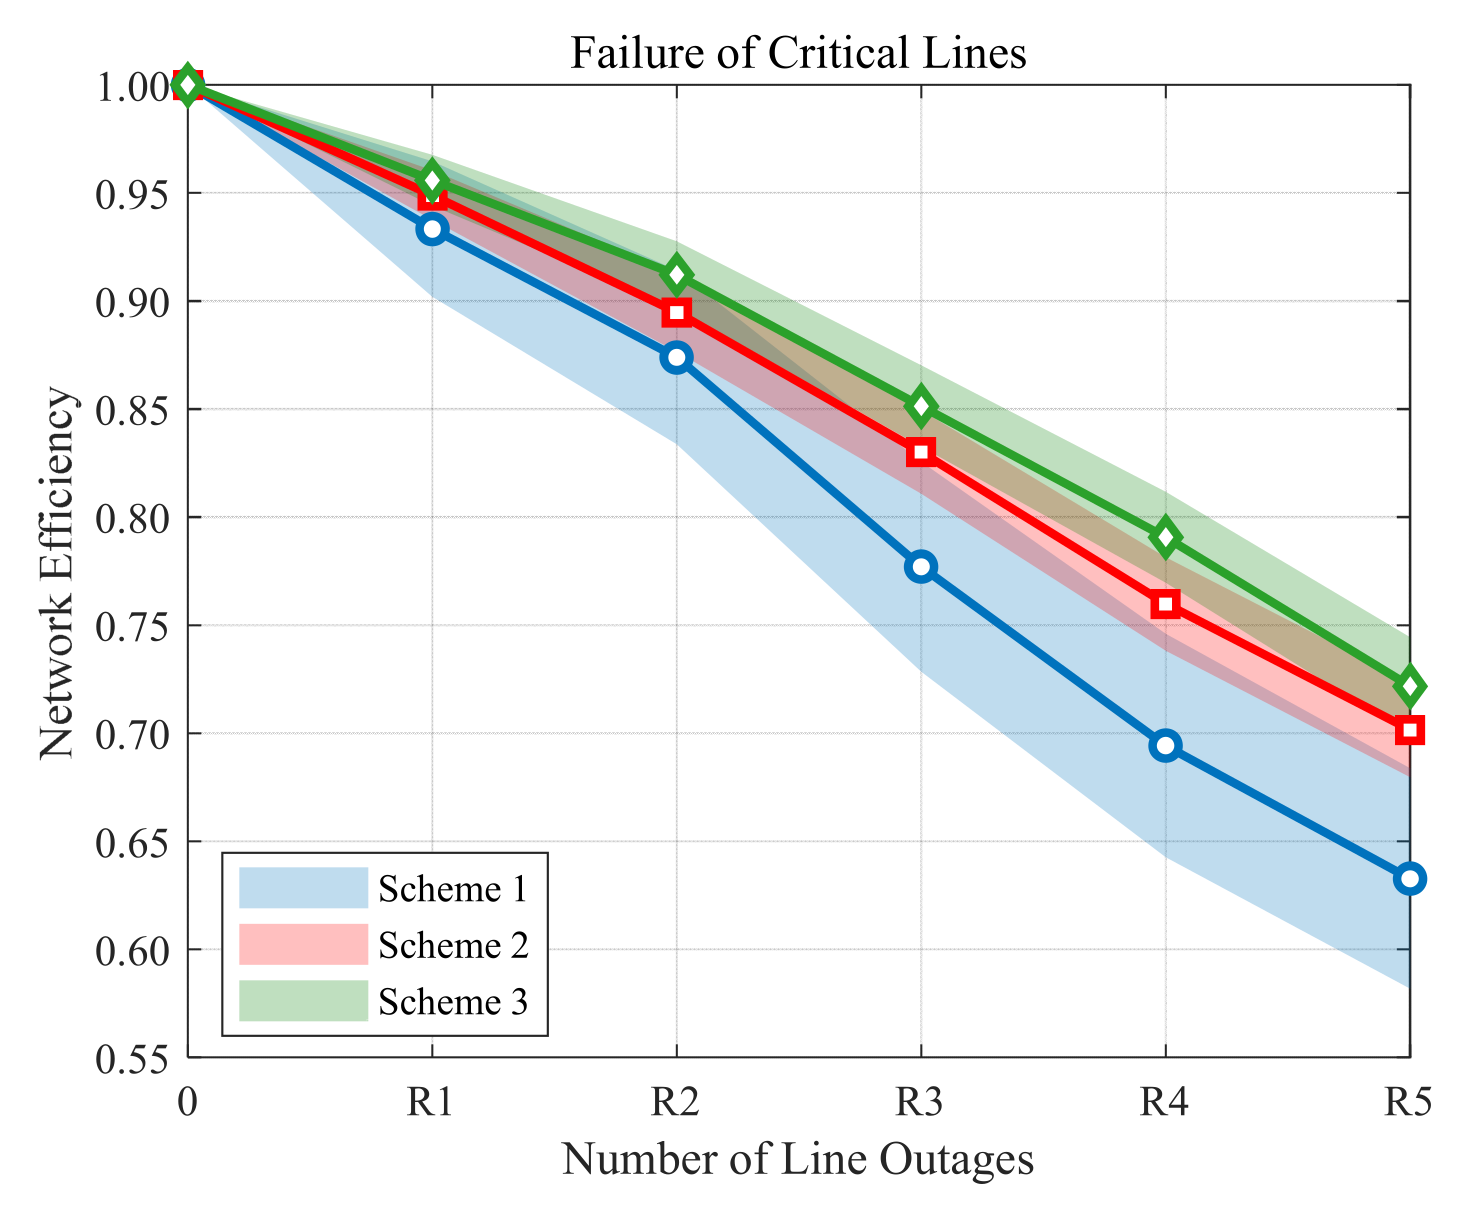
Figure 10 and
Figure 11, respectively, illustrate the variation trends of the network supply effectiveness after sequentially disconnecting the top five lines identified by the comprehensive vulnerability index, and after randomly disconnecting five lines.
Figure 10 shows that configuring energy storage based on the vulnerability-driven strategy can significantly enhance the grid’s damage resistance capability. Because the IEEE-33 node system is a radial network, the disconnection of the first critical line immediately causes a large portion of downstream loads to lose supply. With ESS integration, however, the network effectiveness can still be improved by approximately 20%.
As more lines are disconnected sequentially, the supply effectiveness continues to decline. Nevertheless, Scheme 3 consistently maintains higher network effectiveness than Scheme 2, indicating that the proposed ESS allocation strategy achieves superior performance under intentional attacks.
Figure 11 demonstrates that, compared to sequentially disconnecting critical lines, the system exhibits better damage resistance against random attacks. The curves in the figure represent the average network supply effectiveness for each scheme under random line failure scenarios. The shaded intervals indicate the 95% confidence intervals derived from Monte Carlo simulations, reflecting the stability performance under different schemes.
To facilitate a better comparison of the three schemes shown in
Figure 10, quantitative analysis is performed using three metrics: area under the curve (AUC), average network effectiveness (μ), and average standard deviation (ϕ). The calculation formulas for these metrics are provided in Equations (33)–(35).
In the equations, S represents the number of simulated line outages, while eg(s) denotes the network effectiveness under the s-th state of each simulation. Nr refers to the number of Monte Carlo simulations, which is set to 100 in this study. The calculation results are presented in
Table 5.
By combining the results of
Figure 11 and
Table 4, it can be observed that Scheme 3 achieves the best overall performance under random failure scenarios. Its average network effectiveness (μ) remains consistently higher than that of the other schemes, while it also exhibits the narrowest 95% confidence interval and the smallest average standard deviation (ϕ). These characteristics indicate that Scheme 3 not only provides the highest expected supply capability but is also the least sensitive to random line outage locations, demonstrating the lowest performance volatility.
Such performance advantages, observed in the improved IEEE 33-bus case study, support the effectiveness of the proposed vulnerability-driven ESS planning method and suggest that ESS integration can enhance the disturbance tolerance and stability of the test system under fault conditions.