Abstract
Methanol reforming is considered to be one of the most promising hydrogen production technologies for hydrogen fuel cells. It is expected to solve the problem of hydrogen storage and transportation because of its high hydrogen production rate, low cost, and good safety. However, the strong nonlinearity and slow response of the pressure and temperature subsystems pose challenges to the tracking control of the methanol reforming hydrogen production system. In this paper, two internal model-based temperature and pressure controllers are proposed, in which the temperature is adjusted by controlling the air flow and the pressure is adjusted by controlling the opening of the back-pressure valve. Firstly, a lumped parameter model of the methanol reforming hydrogen production system is constructed using MATLAB/Simulink® (produced by MathWorks in Natick, Massachusetts, USA). In addition, the transfer function model of the system is obtained by system identification at the equilibrium point, and the internal model controller is further designed. The simulation results show that the control method achieves the robustness of the system, and the temperature and pressure of the reforming reactor can quickly and accurately track the target value when the load changes. Small-load step tests indicate stable tracking of the temperature and pressure for the reforming reactor, without steady-state errors. Under large-temperature step signal testing, the response time for the reforming temperature is about 148 s, while the large-pressure step signal test shows that the response time for the reforming pressure is about 8 s. Compared to the PID controller, the internal model controller exhibits faster response, zero steady-state error, and no overshoot. The results show that the internal model control method has strong robustness and dynamic characteristics.
1. Introduction
In recent years, with the continuous growth in the number of automobiles on the roads, the environmental impact of automotive exhaust emissions has become increasingly prominent [1,2,3]. Hydrogen fuel cell vehicles, characterized by rapid refueling times and high energy efficiency, have emerged as a global research hotspot [4]. However, as the fuel for fuel cell vehicles, hydrogen’s flow rate and temperature play a crucial role in the operation of fuel cells. Fuel cells carrying hydrogen are a very intuitive way to supply hydrogen. Due to its very small density, hydrogen storage needs to be carried out by liquefaction, adsorption, etc. However, hydrogen is a gas that is poorly soluble in water and difficult to liquefy. At the same time, hydrogen leaks easily, which also makes it difficult to store hydrogen in containers made of general materials. In addition to this, hydrogen is a flammable gas with a wide range of explosion limits. These characteristics of hydrogen bring many difficulties and high costs to the storage and transportation of hydrogen. Considering all aspects such as storage, transportation, and safety, fuel cells carrying hydrogen directly are not a very good option [5,6,7]. Unlike hydrogen, which is highly flammable and presents safety challenges, researchers have been exploring liquid-phase alcohols and hydrocarbons due to their convenience in storage and transportation and higher safety performance [8]. Producing hydrogen through on-site reforming technology using liquid raw material for fuel cell vehicles is more feasible than carrying hydrogen directly [9]. Therefore, integrating hydrogen production into fuel cells is an effective solution [10,11]. There are four main methods for hydrogen production from methanol, including hydrogen production by methanol decomposition, hydrogen production by partial oxidation of methanol, hydrogen production by methanol steam reforming, and hydrogen production by methanol autothermal reforming. The carbon monoxide content in the product gas produced by the decomposition of methanol to produce hydrogen is as high as 30%, which can damage the fuel cell. The reaction speed of partial oxidation of methanol to hydrogen production is fast, but it is violently exothermic, which can easily damage the catalyst, and the hydrogen content in the product gas is low. Methanol auto-reforming hydrogen production does not require external heating. However, methanol steam reforming for hydrogen production has the advantages of easy-to-achieve reaction conditions and low energy consumption. However, methanol steam reforming has the advantages of low energy consumption due to its low cost and easy implementation of the required reaction conditions. Methanol reforming has the advantages of easy-to-implement reaction conditions and low energy consumption [12,13,14]. In addition, methanol can be made from a variety of raw materials such as coal and natural gas and has the characteristics of high hydrogen content and easy storage and transportation, making it an ideal raw material for automotive hydrogen production systems [15,16]. In summary, methanol is suitable for the immediate supply of hydrogen to onboard fuel cell systems. In this context, it is undoubtedly of great significance to conduct in-depth research on the control technology of methanol reforming hydrogen production system.
Presently, there is limited research on the modeling and control design of methanol-reforming hydrogen production systems. Wu Wei et al. [17] investigated a proton exchange membrane fuel cell system integrated into a methanol reforming unit. They proposed a fuzzy incremental control scheme under a multi-loop feedback control framework to achieve stable operation of the system. By using an alternative fuzzy rule library, the temperature can be adjusted by controlling the flow of water, improving the output regulation of the temperature, but the pressure is very sensitive to load changes. When the methanol inlet flow rate changes from 1 to 3 mol/s, the pressure adjustment time is about 12 s. Yongyou Hu et al. [18] conducted a reduction of the mathematical model for gasoline autothermal reforming originally established by Dennis Papadias et al. [19]. This reduction retained most of the nonlinear characteristics of the original system. Simulation results demonstrated that the reduced dynamic model possessed sufficient speed and accuracy to meet the online computational demands of a predictive controller, leading to the development of a controllable model. The authors designed a feedback controller that regulated the reforming temperature by controlling the air flow rate. Simulation results indicated that while the feedback control method sufficiently suppressed disturbances under steady operating conditions, its performance was suboptimal during rapid startup and load changes, a significant drop in reactor temperature (about 150 °C) was observed and the reactor was even extinguished, and the hydrogen transition took longer (about 100 s). The performance improved with the addition of feedforward control, but the feedforward controller was found to be highly sensitive to model mismatches and disturbance characteristics. For slow steam injection, the hydrogen yield would respond slowly (about 150 s) [20]. Lu Jiangang et al. [21] proposed an overarching control strategy for a methanol-reforming hydrogen production system. This strategy utilized a sliding mode controller or adaptive controller to regulate the flow of methanol and water. A variable ratio controller constrained by the reforming temperature was employed to control the airflow entering the combustion chamber. For state variables in the sliding mode controller that were unmeasurable, a high-gain observer was designed to estimate these variables, enabling feedback control. The feasibility of this control strategy was validated through experimental verification. The hydrogen production response time was approximately 45 s. However, when the model parameters varied widely, the fixed parameters of the sliding mode controller made it challenging for the system to achieve optimal performance. Andreasen, Søren Juhl et al. [22] proposed a control strategy to control the temperature of the methanol reformer in a 350 W high-temperature polymer electrolyte membrane fuel cell system and used a cascade control structure to ensure the reliable operation of the system. As the pump flow rate increased, the reforming temperature also increased, with a rise time of about 345 s. Ipsakis, Dimitris et al. [23] developed a rigorously dynamic and control-oriented model to accurately describe the autonomous operation of the methanol-reforming fuel cell power system, proposing a control structure implemented by a PI controller to control the feed and outlet temperatures of the reformer through methanol combustion and the feed flow rate of the reformer chamber, respectively, and the reforming chamber takes more than 200 s to reach a predetermined temperature level.
Based on these studies, this paper proposes an internal model control strategy to realize precise tracking control of temperature and pressure. This control strategy exhibits excellent robustness and dynamic performance. The remainder of this paper is organized as follows: In Section 2, a dynamic model of the methanol-reforming hydrogen production system has been established on the MATLAB/Simulink platform. In Section 3, the internal model control structure is proposed. In Section 4, simulations based on MATLAB/Simulink are implemented. Finally, the last section summarizes some conclusions.
2. Model
A dynamic model of the methanol-reforming hydrogen production system was established using MATLAB/Simulink. The proposed structure of this system is depicted in Figure 1. The methanol–water mixture sequentially passes through a pump, heat exchanger, and evaporation chamber, where it is heated and vaporized. The vaporized methanol vapor and water vapor then move into the reforming chamber, where they undergo three essential reactions: steam reforming, self-decomposition, and water–gas shifting, resulting in the generation of hydrogen-rich gas. Purification of hydrogen is achieved through a palladium membrane. In particular, the purified hydrogen is first routed through the heat exchanger to preheat the methanol–water mixture. The reforming exhaust gas is channeled into the combustion chamber for catalytic combustion, thereby increasing the thermal energy required by the system.
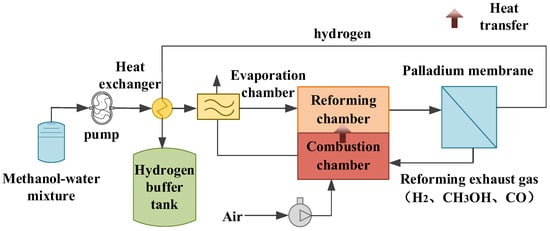
Figure 1.
Structure of the methanol-reforming hydrogen production system.
2.1. Evaporator Chamber
To facilitate the construction of the evaporator chamber model, the heat exchange between the methanol–water mixture and facilitate the construction of the evaporation chamber model, the heat exchanger between the methanol–water mixture and the high-temperature gas mixture from the combustion chamber is subdivided into three stages. In the first stage, liquid methanol with water is heated by ambient temperature to its boiling point temperature, but no vaporization occurs in the process. In the second stage, methanol and water are only vaporized, but the temperature does not change, and the heat exchange process in this stage is only to meet the heat demand of the latent heat of material vaporization. In the third stage, gaseous methanol, water, and air are heated to the desired temperature to enter the reformer chamber. The following energy conservation ordinary differential equations can be derived [24]:
The naming conventions for physical symbols in this article are shown in Appendix A. where is the evaporator chamber mass [], is the evaporator chamber mass enthalpy change capacity of evaporator chamber [], is the evaporator chamber temperature [], and and are the heat at the inlet and outlet of the evaporator chamber, respectively.
During the first stage, the high-temperature mixed gas from the combustion chamber heats the liquid methanol and water from to their boiling points and . In this process, no vaporization occurs, and the absorbed heat is
In the second phase, methanol and water vaporize from liquid to gas. During this process, the temperature remains constant. The heat of vaporization can be calculated based on the molar flow rate of methanol and water and their latent heat of vaporization:
In the third phase, the gaseous methanol and water continue to be heated until they reach the reactor temperature . The heat absorbed during this process is calculated as follows:
According to Newton’s law of cooling, the convection heat is
According to heat transfer theory, thermal radiation can be calculated using the following equation:
where and denote the molar flow rates of water and methanol in the evaporation chamber, respectively, and are the molar heat capacity of liquid water and gaseous water, respectively [], and are the molar heat capacity of liquid methanol and gaseous methanol, respectively [], is the boiling point of water, is the boiling point of methanol, , and is the latent heat of vaporization for water and methanol, respectively, is the heat transfer coefficient, is the heat transfer area, is the emissivity, is the Stefan–Boltzmann constant [], and is the radiative surface area.
2.2. Reforming Chamber
The reforming reaction mechanism is shown in Table 1. The enthalpy of the methanol–steam reforming reaction and the methanol decomposition reaction is the enthalpy change of one mole of methanol when it is completely reacted under standard conditions, and the enthalpy of reaction of water vapor displacement reaction is the enthalpy change of one mole of carbon monoxide when it is completely reacted under standard conditions.

Table 1.
Reactions occurring in the reforming chamber.
The methanol-reforming kinetic model presented in this paper was obtained by Peppley B.A. et al. [25], as shown in Table 2.

Table 2.
Reaction kinetics in the reforming chamber.
The equation contains equilibrium constants and rate constants. The temperature dependence of these constants can be expressed by Arrhenius expressions or Van Hoof expressions, and the expressions for these constants and the values for each parameter are given in Table 3.

Table 3.
Rate constants and equilibrium constants.
The following mass conservation ordinary differential equations can be listed:
where denotes the amount of substance of species [], , and are the molar flow rate of species at the entrance and exit of the reforming chamber, respectively, is the rate of generation for species , and is , , , , or .
The following energy conservation ordinary differential equations can be listed:
where denotes the reforming chamber mass [], is the reforming chamber mass heat capacity [], is the reforming chamber temperature [], and are the heat at the entrance and exit of the reforming chamber, respectively, is the enthalpy change conduction between the reforming chamber and the combustion chamber, is the reaction heat, is the thermal radiation, is the molar flow rate of species at the exit of the reforming chamber, and are the molar specific heat of species at the entrance and exit of the reforming chamber, respectively, and , , and are the reaction enthalpy change of methanol–steam reforming, methanol decomposition, and matter–gas shift, respectively.
2.3. Combustion Chamber
Methanol, hydrogen, and carbon monoxide undergo catalytic combustion reactions in the combustion chamber:
Based on the law of mass conservation in chemical processes, the calculation of the molar flow rate of each gas component in the combustion chamber is as follows:
where and denotes the molar flow rates of species at the entrance and exit of the combustion chamber, respectively, is the molar flow rate of species participating in the reaction, is , , , , or , and is , , or .
An insulating layer was pasted on the inner wall of the combustion chamber casing; thus, the radiant heat exchange between the combustion chamber and the environment is not considered. The following energy conservation equation can be listed:
where denotes the combustion chamber mass [], is the combustion chamber mass heat capacity [], is the combustion chamber temperature [], and are the enthalpy change of air and reforming exhaust gas at the entrance of the combustion chamber, respectively, is the enthalpy change at the exit of the combustion chamber, and is the heat conduction between the combustion chamber and the reaction chamber.
The enthalpy change of combustion can be calculated using the following equation:
where is the enthalpy change released by the complete combustion of one mole of the species .
2.4. Palladium Membrane Purification Chamber
The principle of the metal palladium membrane separation technology is that only hydrogen can pass through the palladium membrane, resulting in high-purity hydrogen [25,26]. The permeation flux can be represented by the Richardson equation [27]:
The parameters of the palladium membrane are shown in Table 4.

Table 4.
Parameters of the palladium membrane.
2.5. Model Validation
To validate the accuracy of the methanol-reforming hydrogen production model, the simulated methanol conversion rate and carbon monoxide molar fraction were compared with the experimental data reported by Zhang, S.B. et al. [28]. The fuel supply flow rate was 0.003 kg/s, and the water-to-methanol ratio was 1.1. As shown in the Figure 2, both the simulated and experimental methanol conversion rates showed an increasing trend with rising temperature. This is because the methanol steam reforming reaction is endothermic, and as the temperature increases, the reaction proceeds in the forward direction, with methanol reacting with water to produce hydrogen. Additionally, the model used in this study differs in scale from the one proposed by Zhang, S.B et al., which contributes to discrepancies between the simulation results and the experimental data.
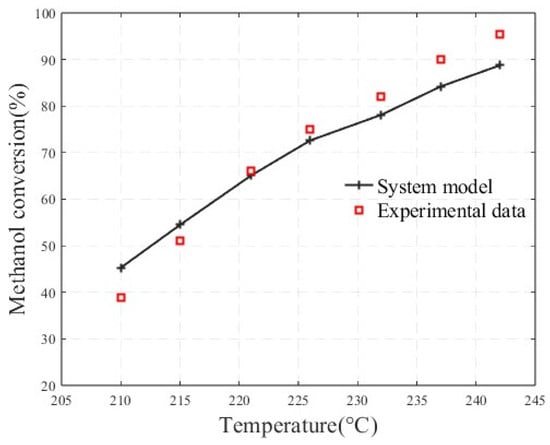
Figure 2.
Comparison between the simulated methanol conversion rate and experimental data.
Figure 3 shows a comparison between the simulated carbon monoxide molar fraction in the reforming gas mixture and the experimental data reported by Zhang, S.B et al. under the same operating conditions as in the literature, with a temperature of 240 °C. As seen from the figure, the simulation curve closely matches the experimental data. With an increase in the water-to-methanol ratio, the carbon monoxide molar fraction gradually decreased. On the one hand, this is due to the increase in the total molar amount of the gas mixture as the water-to-methanol ratio increased; on the other hand, the higher water content shifted the reaction equilibrium towards the production of carbon dioxide and hydrogen. Although at a water-to-methanol ratio of 1, the simulation significantly underestimates the carbon monoxide molar fraction compared to the experimental data, due to inaccuracies in the description of the chemical reaction rates, the overall accuracy of the methanol-reforming hydrogen production model has been validated.
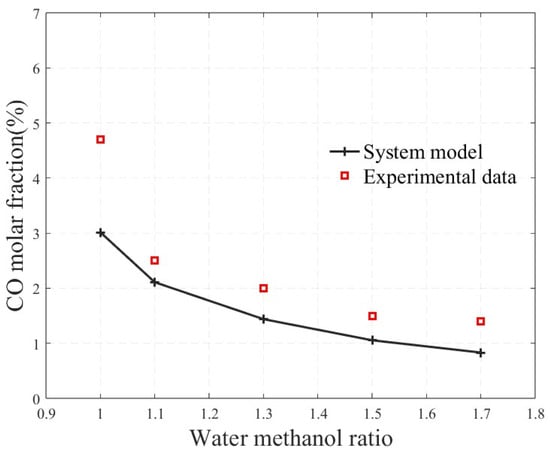
Figure 3.
Comparison between the simulated carbon monoxide molar fraction and experimental data.
2.6. System Identification
In order to obtain the dynamic characteristics of the methanol-reforming hydrogen production system and design the internal model control algorithm, system identification of the methanol-reforming hydrogen production system is required. Table 5 shows the operating points used for system identification of the methanol-reforming hydrogen production system, where is the water-to-methanol ratio, is the fuel flow rate [], is the steady-state reforming temperature [], is the steady-state reforming pressure [], is the steady-state back-pressure valve opening, is the steady-state fan speed [], is the steady-state hydrogen flow rate [], and is the steady-state air flow rate [].

Table 5.
Operating points used for system identification.
System identification requires an appropriate input sequence to excite the system spectral characteristics. In this study, an M-sequence is used as the identification sequence. The determination of the M-sequence depends on four parameters: sampling time , symbol duration , sequence length , and sequence amplitude . There is considerable literature on the selection of M-sequences. In this research, the M-sequence parameters were designed based on the methods outlined in the referenced literature, with targeted parameter values. The parameter design results are shown in Table 6.

Table 6.
M-sequence parameters.
The system identification block diagram is shown in Figure 4, where and represent the designed M-sequences, which are, respectively, superimposed onto the steady-state fan speed and steady-state back-pressure valve opening , resulting in the dynamic fan speed and dynamic back-pressure valve opening . During the M-sequence excitation, the reforming temperature and reforming pressure are collected, and the steady-state values and are subtracted, yielding the output sequences for system identification and . Using the System Identification Toolbox in MATLAB, with and as input sequences and and as output sequences, the transfer function of the methanol-reforming hydrogen production system can be obtained.
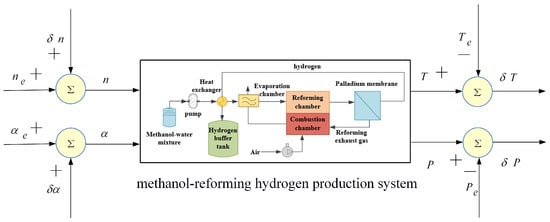
Figure 4.
Schematic diagram of the system identification framework.
The transfer function identified at the equilibrium point using the M-sequence identification method is shown in Equation (23). To verify the accuracy of the identified model, the identification sequence is introduced as an input to the identified model, and its output is compared with the output of the system under identification. The comparison results are shown in Figure 5. Under the M-sequence excitation shown in Figure 5(a1,b1), the reforming temperature (Figure 5(a2)) and reforming pressure (Figure 5(b2)) of both the identified model and the system under identification, as well as the deviations from the identified operating points, vary over time. The results show that the relative errors between the outputs of the identified model and the nonlinear system being identified are less than 1%. Therefore, the identified model accurately reflects the dynamic and static performance characteristics of the nonlinear system under identification and can be used for the characteristic analysis and controller design of the methanol-reforming hydrogen production system.
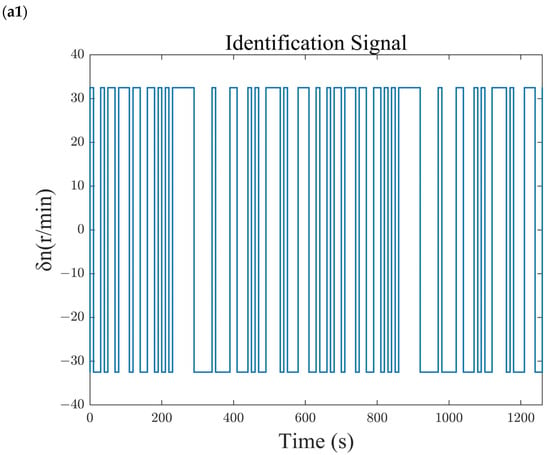
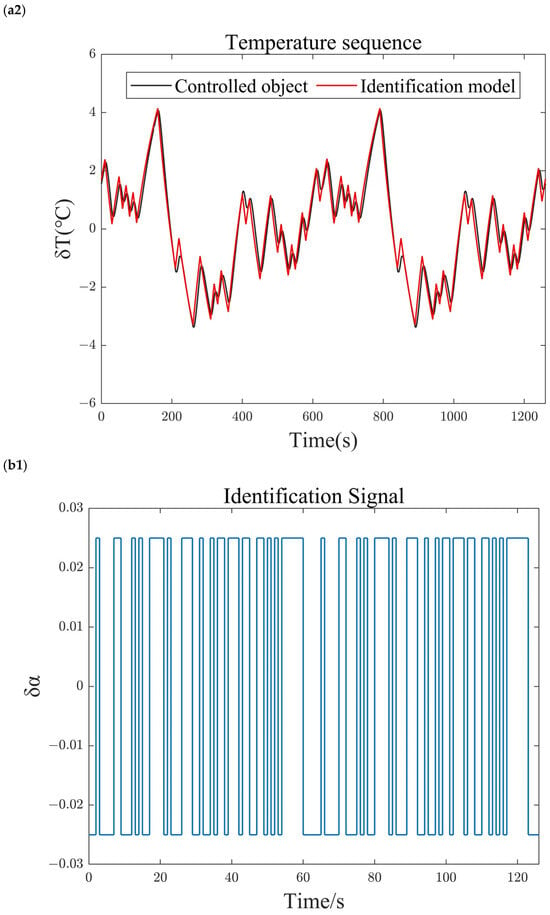
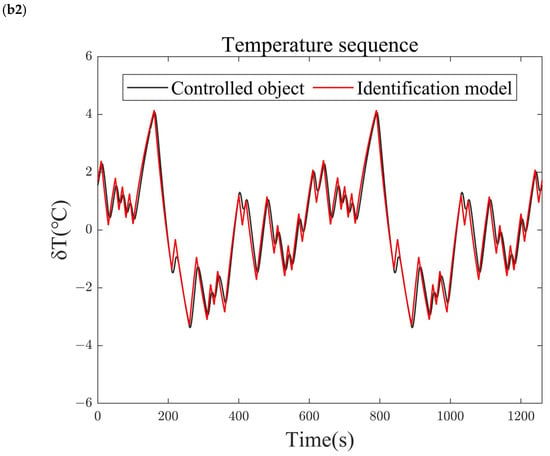
Figure 5.
Comparison of identification results. (a1) Blower speed sequence. (a2) Reforming temperature sequence. (b1) Back-pressure valve opening sequence. (b2) Reforming pressure sequence.
3. Controller Design
3.1. Internal Model Control
The core idea of internal model control (IMC) is to establish a mathematical model of the actual controlled object within the controller and to construct a feedback system using this model. Meanwhile, introducing a filter achieves a balance between robustness and rapid response. The structure of the internal model control system is shown in Figure 6. is the process transfer function matrix, is the internal model transfer function matrix, is the internal model controller transfer function matrix, is the reference signal, is the control input, is the actual system output, is the internal model output, is the external disturbance, and is the feedback signal.
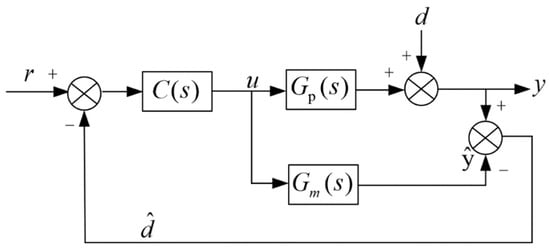
Figure 6.
Structure of the internal model control system.
The Laplace domain of the closed-loop output of the internal model controller is [29]
where denotes the Laplace domain of the actual system output, is the Laplace domain of the reference signal, and is the Laplace domain of the external disturbance.
When the internal model accurately describes the actual system, and there is no external disturbance, that is, and , then the system output is
If we take , then it follows that
Thus, the internal model controller is an ideal controller, capable of tracking the reference signal without error and completely resisting interference.
3.2. Internal Model Controller Structure
The design process of the internal model controller can be divided into two steps:
- Separate the pure delay and unstable zero parts from the internal model:where is the minimum phase part of the model, is the part of the model containing zeros in the right half-plane and on the imaginary axis, and denotes the time delay.
- To ensure system stability and robustness, a filter is incorporated when designing the controller; hence, the internal model controller can be represented aswhere is the introduced r-order filter, which can be represented aswhere , the time constant of the filter, directly affects the control performance of the closed-loop system, and the selection of r should ensure the physical realizability of the controller, meaning that the relative degree of should be less than or equal to 0.
Equation (23) shows the transfer function model of the methanol-reforming hydrogen production system. In general, for a dual-input, dual-output system, the static gain coefficient matrix is
Using the transfer function model identified by the system, the relative gain coefficient matrix can be obtained as follows:
Here, the relative gain coefficient of the blower speed and the reforming temperature channel are used to describe the coupling relationship between the reforming temperature and the reforming pressure. This relationship is mainly analyzed in the following situations:
- (1)
- : the variable channel pairing is correct, the coupling degree is weak, the temperature of the reforming reaction chamber is greatly affected by the speed of the blower, and the pressure of the reforming reaction chamber is greatly affected by the opening of the back-pressure valve, and the closer to 1, the weaker the coupling degree.
- (2)
- : the variable channel pairing is correct, the coupling degree is strong, the temperature of the reforming reaction chamber is greatly affected by the speed of the blower, and the pressure of the reforming reaction chamber is greatly affected by the opening of the back-pressure valve, and the closer to 0.5, the stronger the coupling degree. In this case, decoupling control is generally necessary to weaken the coupling of temperature and pressure.
- (3)
- : the variable channel pairing is incorrect, the coupling degree is weak, the temperature of the reforming reaction chamber is greatly affected by the opening of the back-pressure valve, and the pressure of the reforming reaction chamber is greatly affected by the speed of the blower, and the closer to 0, the weaker the coupling degree.
- (4)
- : the variable channel pairing is incorrect, the coupling degree is stronger, and the closer to 0.5, the coupling degree of temperature and pressure is stronger, and decoupling control must be generally adopted at this moment, so as to weaken the coupling degree of temperature and pressure.
The relative gain coefficient of the blower speed and reforming temperature channel describes the coupling relationship between reforming temperature and reforming pressure. The value of is 0.997, which is close to 1. This indicates a correct pairing of the variable channels and suggests that the coupling degree of the methanol-reforming system for hydrogen production is feeble. Consequently, this study has designed two controllers based on internal models for pressure and temperature control, respectively. The reforming temperature is regulated by adjusting the speed of the blower, while the reforming pressure is controlled by modulating the opening of the back-pressure valve. The structure of the internal model controller for the methanol-reforming system is depicted in Figure 7.
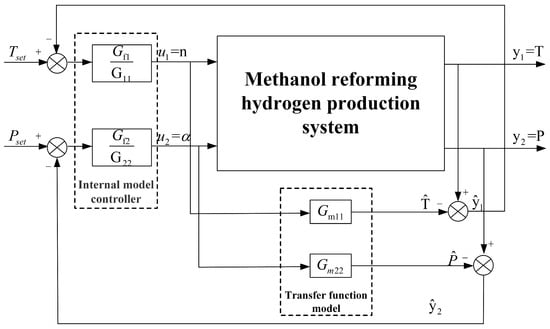
Figure 7.
Structure of the internal model controller.
3.3. PID Control
PID control is one of the most widely used control methods in engineering practice. Controllers designed based on this method can generally achieve zero steady-state error while maintaining high system stability. The dynamic performance of the control system can also be improved by adjusting the PID parameters. Since the parameters of the controller can be independently tuned, the trial-and-error method for parameter tuning is relatively convenient, making it widely applied in industrial production. The control law for the PID controller is given by
The corresponding transfer function of the PID controller is
where is the proportional gain, is the integral time constant, is the derivative time constant, is the controller output signal, and is the error signal (the difference between the desired and actual values of the controlled variable).
The PID adjustment process involves the adjustment of proportional (P), integral (I), and differential (D), and the PI adjustment is used in this paper, that is, proportional-integral adjustment, which can gradually eliminate the steady-state error and improve the stability and accuracy of the system while maintaining the response speed of the system. Proportional gain and integration time constant are two key parameters in the PI adjustment process. The proportional gain determines the strength of the proportional adjustment, while the integration time constant determines the accumulation rate of the integration adjustment.
First of all, the proportional adjustment is carried out according to the deviation between the actual output of the system and the set value, and the proportional adjustment amount is proportional to the deviation, which can quickly reduce the deviation. Proportional adjustment has a fast response time, but steady-state errors may not be completely eliminated when used alone. Further, the integral adjustment part is introduced to solve this problem. The amount of integration adjustment is proportional to the integral value of the deviation, which gradually eliminates the steady-state error, allowing the system to maintain a stable output over a long period of time, but it can also cause the system to respond more slowly.
Specifically, when the system needs to respond quickly, the proportional gain can be increased appropriately; When the system needs higher steady-state accuracy, the integration time constant needs to be increased to enhance the integration regulation. However, too large proportional gain can lead to system instability, while too large integration time constants can slow down system response. Therefore, this paper finds the most suitable combination of PI parameters for the system by continuous adjustment, so as to achieve the optimal PI control effect.
3.4. PID Controller Structure
In the methanol-reforming hydrogen production system, the blower is the core device for air supply. By controlling its speed, the oxygen required for the catalytic combustion reaction is supplied to the combustion chamber. Adjusting the back-pressure valve opening alters the system’s flow resistance characteristics. Therefore, the blower speed and back-pressure valve opening are selected as manipulated variables, while the temperature and pressure of the reforming reaction chamber are chosen as controlled variables to construct the PID closed-loop control system, as shown in Figure 8.
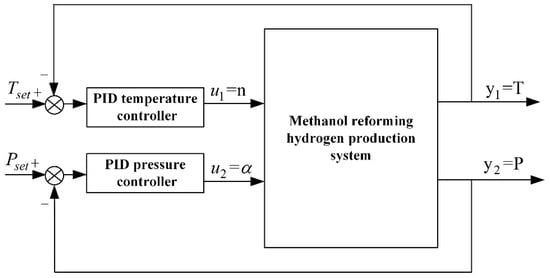
Figure 8.
Structure of the PID Controller.
The input to the PID temperature controller is the temperature deviation (i.e., the difference between the target temperature and the actual temperature). After PID computation and adjustment, the output is the target fan speed, which is sent to the fan speed closed-loop control system of the methanol-reforming hydrogen production system. The fan speed closed-loop control system then uses the target fan speed as the input to regulate the fan speed, thereby achieving temperature control. The input to the PID pressure controller is the pressure deviation (i.e., the difference between the target pressure and the actual pressure), and the output is the target bypass valve opening. The opening closed-loop control system then uses the target bypass valve opening as the input to regulate the bypass valve opening, thereby achieving pressure control. In MATLAB/Simulink, a methanol-reforming hydrogen production model and the corresponding controllers are built. In this study, proportional-integral (PI) control is applied.
4. Simulation
The simulation is conducted on the MATLAB/Simulink platform. To comprehensively demonstrate the effectiveness of the designed internal model controller, operating conditions, as shown in Figure 9, Figure 10 and Figure 11, are designed to display the performance of the internal controller. Figure 12 compares the control performance of the internal model controller and the PID controller. In order to better compare the internal model controller and the PID controller, the initial state of the system used by the two controllers in this paper is the same, the initial temperature is the ambient temperature of 20 °C, the initial pressure is atmospheric pressure, which is 1 bar, and the initial water–alcohol ratio is 1.3.
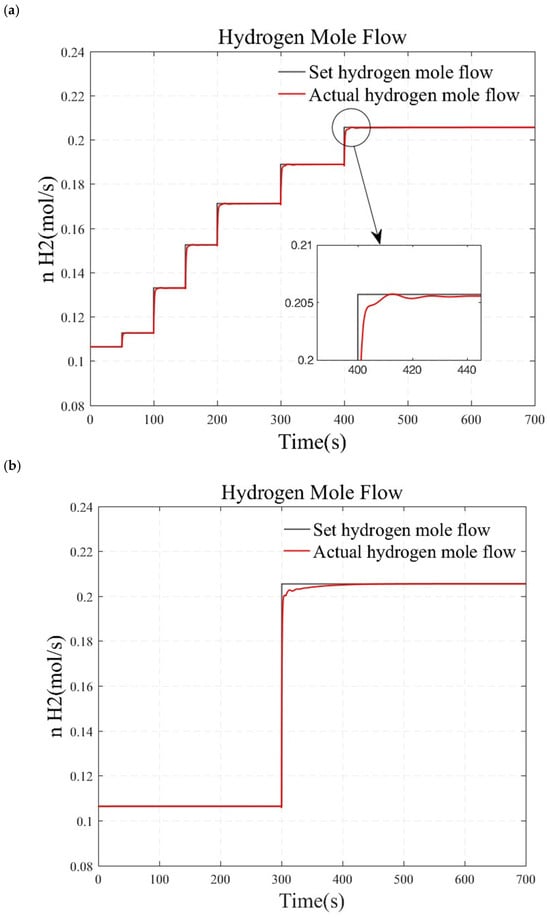
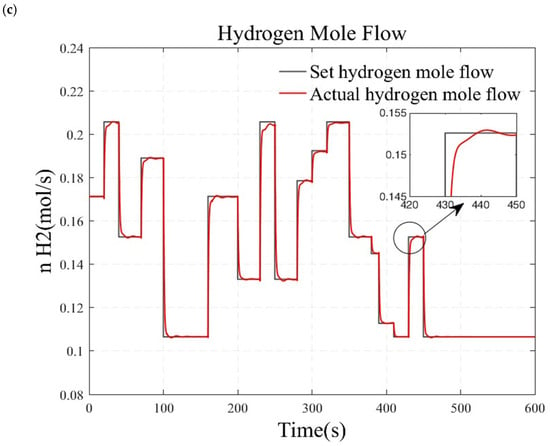
Figure 9.
Simulation results under load step conditions. (a) small load step conditions. (b) large and rapid load step conditions. (c) randomly varying conditions.
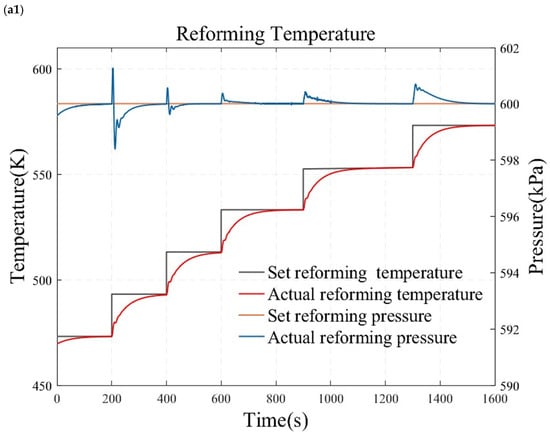
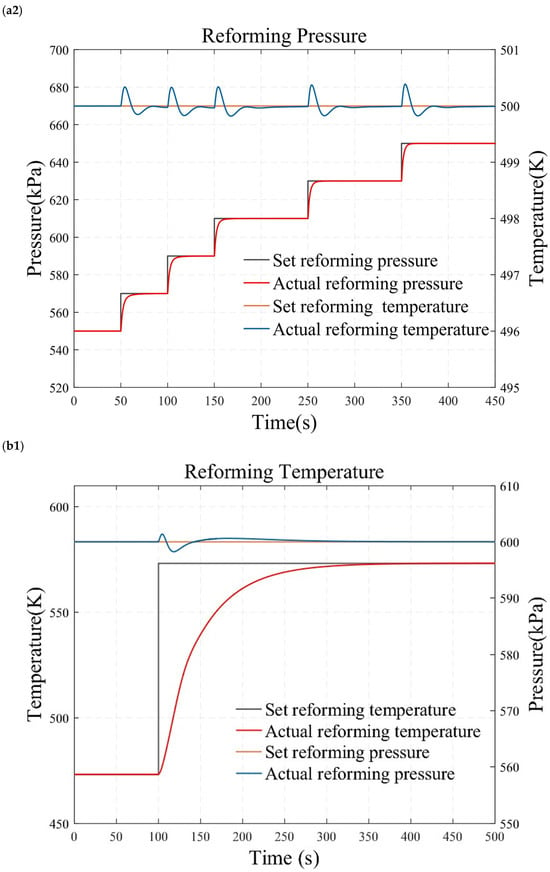
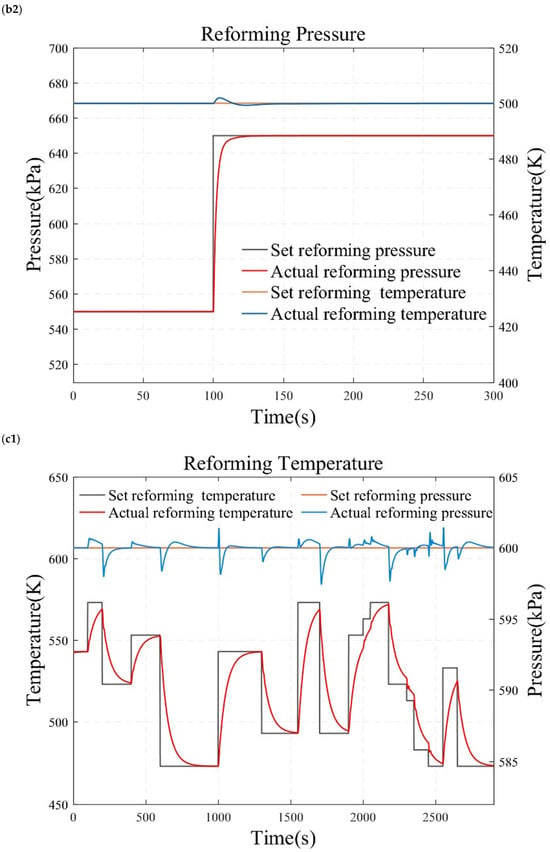
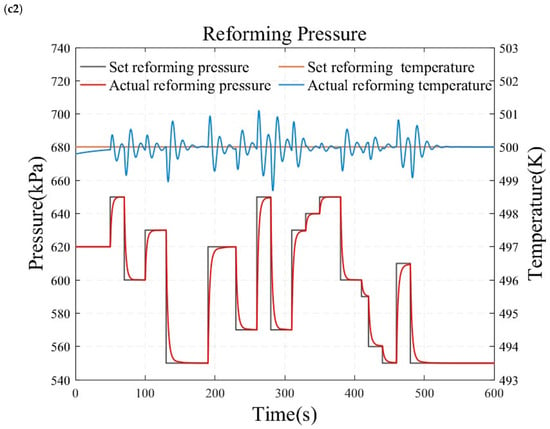
Figure 10.
Simulation results under temperature and pressure step conditions. (a1) reforming temperature simulation results under small load step conditions. (a2) reforming pressure simulation results under small load step conditions. (b1) reforming temperature simulation results under large and rapid load step conditions. (b2) reforming pressure simulation results under large and rapid load step conditions. (c1) reforming temperature simulation results under randomly varying conditions. (c2) reforming pressure simulation results under randomly varying conditions.
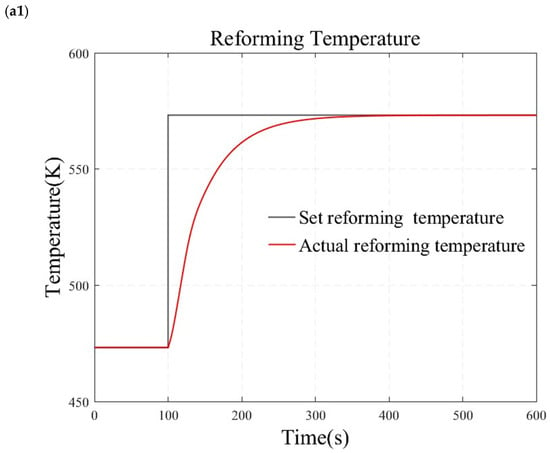
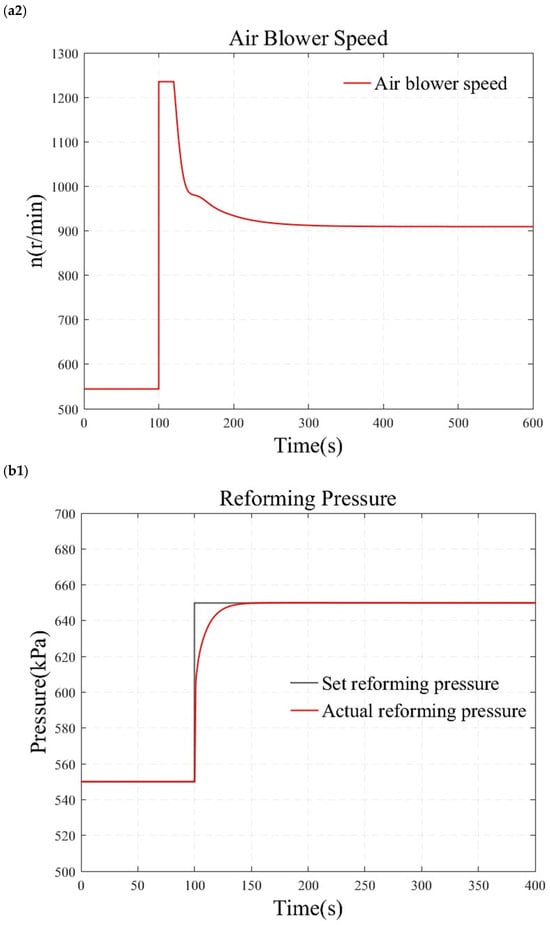
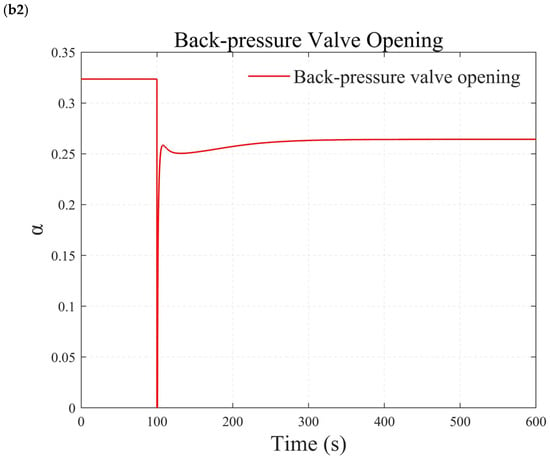
Figure 11.
Simulation results under simultaneous large step changes in temperature and pressure. (a1) reforming temperature simulation results. (a2) air blower speed simulation results. (b1) reforming pressure simulation results. (b2) back-pressure valve opening simulation results.
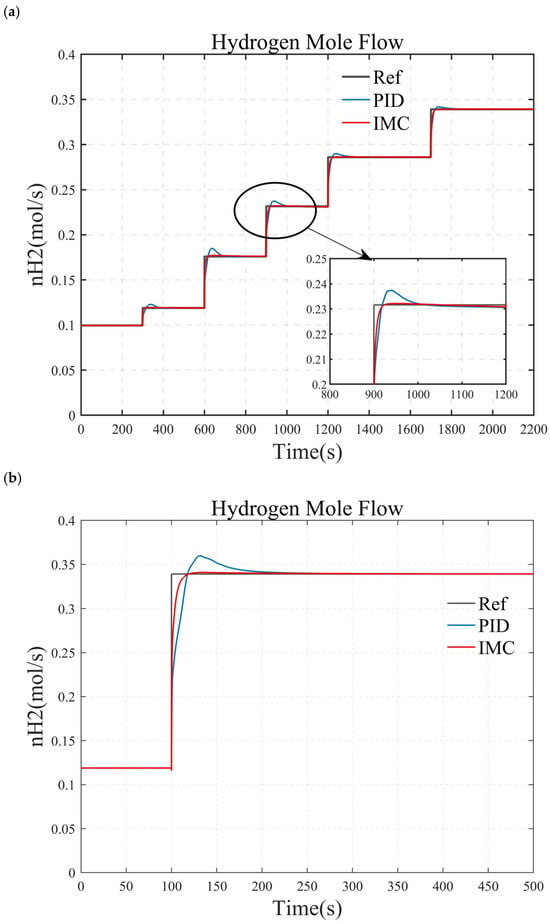
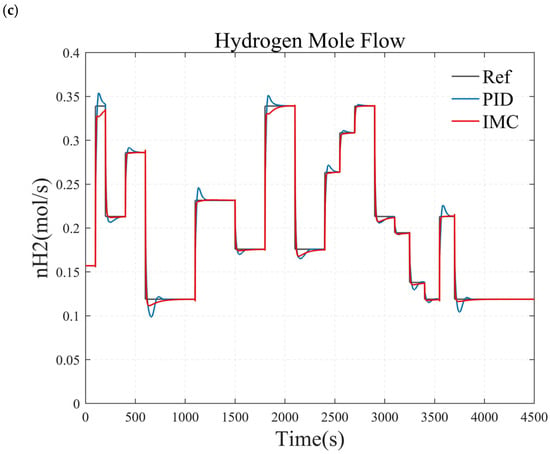
Figure 12.
Comparison of simulation results between the internal model control and PID control. (a) small load step conditions. (b) large and rapid load step conditions. (c) randomly varying conditions.
4.1. Robustness of the System
In this section, a series of small load step conditions, large and rapid load step conditions, and randomly varying conditions are designed to test the stability and robustness of the system. The simulation results obtained by changing the load after the reforming temperature and pressure have stabilized at the target values for over a minute are presented in Figure 9. Figure 9a illustrates the gradual increase of the hydrogen gas flow from 0.105 mol/s to 0.205 mol/s. The result indicates that the actual system output of hydrogen flow rate can quickly and accurately track the desired hydrogen flow rate, achieving zero steady-state error at each operating point. However, small step signals only reflect the system’s characteristics within a local range. In Figure 9b, the hydrogen flow rate is directly stepped from 0.105 mol/s to 0.205 mol/s to validate the system’s dynamic characteristics under wide range variation. The results show an adjustment time of 32 s for the system, with no overshoot, demonstrating that the designed controller exhibits rapidity and accuracy even under substantial load variations. Considering that vehicular hydrogen production systems inevitably encounter complex and variable load changes, a set of randomly varying load conditions are designed to verify the controller’s performance in practical applications, as shown in Figure 9c. The simulation results indicate that the actual hydrogen flow rate can track the changes in the target hydrogen flow rate more quickly. The system did not diverge during this process, and the overshoot is minimal. Thus, the system maintains high robustness under varying load conditions.
4.2. Control Effects on Reformer Temperature and Pressure
Figure 10 presents the results of the reformer temperature tracking control under constant reforming pressure. The reforming pressure is set at 600 kPa, and after the pressure reaches and stabilizes at the desired value for one minute, the temperature is adjusted for step testing. As shown in Figure 10a, the set temperature is sequentially adjusted to 473.15 K, 493.15 K, 513.15 K, 533.15 K, 553.15 K, and 573.15 K to conduct a series of small-range step tests. This study also employs a temperature increase from 473.15 K directly to 573.15 K to obtain the characteristics of a wide range of operating conditions, as illustrated in Figure 10b. Figure 10 displays the temperature control results under randomly varying temperature conditions. The simulation results demonstrate that the reforming temperature can track the desired value without steady-state error and overshooting. This indicates that the reformer temperature tracking control based on the internal model principle possesses superior dynamic and static characteristics.
Figure 11a illustrates the control results of reforming pressure tracking under constant reforming temperature. The reforming temperature is set to 500 K. Once the temperature stabilizes, the pressure is adjusted within a range of 500–600 kPa. The system is subjected to testing under various conditions, including small-range pressure step changes, large and rapid pressure step changes, and randomly varying conditions. The simulation results indicate that the reforming pressure can rapidly and accurately track the desired values without overshooting. This demonstrates that the reforming pressure tracking control, based on the internal model principle, exhibits high dynamic and static characteristics.
Figure 11b demonstrates the test results when temperature and pressure simultaneously undergo significant step changes. At 100 s, the temperature is adjusted directly from 473.15 K to 573.15 K, while the pressure is increased from 500 kPa to 600 kPa. The results indicate that the reforming temperature and pressure can achieve zero steady-state error tracking of the step signal without overshooting. The actions of the back-pressure valve and the blower are smooth. This indicates that the reformer temperature and pressure control methods based on the internal model principle also exhibit good robustness under transient conditions.
4.3. Comparison Between IMC and the PID Control
Figure 12 compares the simulation results of the internal model controller (IMC) and the PID controller. As shown in Figure 12b, when the target hydrogen flow rate steps from 0.12 mol/s to 0.34 mol/s at t = 100 s, both the IMC and PID controller respond rapidly, with an approximately 12 s rise time. The key difference is that the IMC achieves zero steady-state error with no overshoot, while the PID controller has an adjustment time of approximately 31 s, with an overshoot of about 6%. The control performance of both controllers is similar under both small step conditions (Figure 12a) and complex operating conditions (Figure 12c). Therefore, compared to the PID controller, the IMC demonstrates superior dynamic and steady-state performance.
To verify the stability of the PI controller, this paper investigates the hydrogen flow rate response of a methanol-reforming hydrogen production system by increasing and decreasing the I value of the PI controller by a factor of 5. The results are illustrated in Figure 13. Specifically, Figure 13a demonstrates the hydrogen flow rate response when the temperature controller remains unchanged, and the I value of the pressure controller is varied from 0.2 × 10⁻⁸ to 1 × 10⁻⁸ and then to 5 × 10⁻⁸. Figure 13b presents the hydrogen flow rate response when the pressure controller remains constant, and the I value of the temperature controller is changed from 0.004 to 0.02 and then to 1.
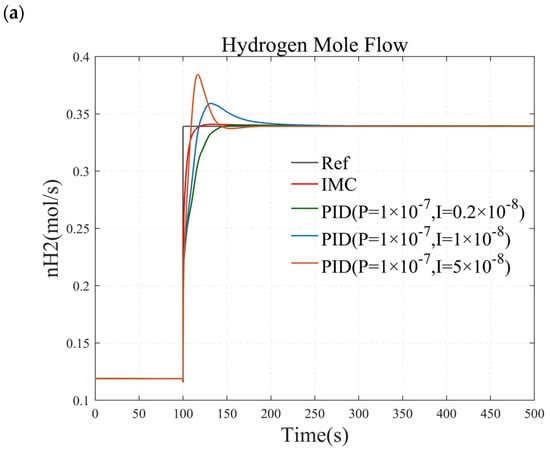
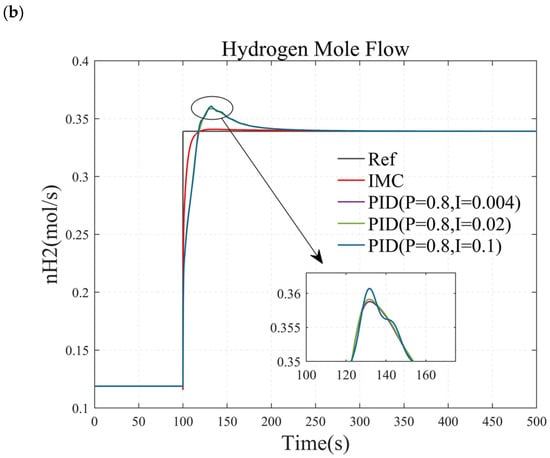
Figure 13.
The control effects under different PI values. (a) simulation results when adjusting the I value of the pressure controller. (b)simulation results when adjusting the I value of the temperature controller.
5. Conclusions
This paper introduces an IMC method to address the temperature and pressure control challenges in methanol-reforming hydrogen production system. Initially, a dynamic model of the methanol-reforming hydrogen system is established using MATLAB/Simulink®. This model includes the description of three reaction rates in the reformer, differential equations simulating the evaporator and combustion chamber, and a mechanistic model of the palladium membrane. Two temperature and pressure controllers based on the internal model are designed using the transfer function model obtained through identification to overcome the issues of strong nonlinearity and slow response in the model. The simulation results demonstrate that the controllers exhibit rapidity, accuracy, and robustness under various operating conditions. During tests with small load step changes, large load step changes, and random load changes, the hydrogen flow rate load consistently achieved zero steady-state error tracking of the step signal without overshooting. The response time for the large temperature step test is around 148 s, and for the large pressure step test, it is about 8 s. Compared to the PID controller, the internal model controller exhibits faster response, zero steady-state error, and no overshoot. The results show that the internal model control method has strong robustness and dynamic characteristics.
Author Contributions
Conceptualization, Y.D. and F.C.; methodology, Y.D.; software, Y.D. and B.Z.; validation, Y.D.; formal analysis, Y.D. and F.C.; investigation, Y.D.; resources, F.C.; data curation, F.C.; writing—original draft preparation, Y.D.; writing—review and editing, Y.D., Y.P. and F.C.; visualization, Y.D.; supervision, F.C.; project administration, Y.D. and F.C.; funding acquisition, F.C. All authors have read and agreed to the published version of the manuscript.
Funding
This research received no external funding.
Data Availability Statement
The raw data supporting the conclusions of this article will be made available by the authors on request.
Acknowledgments
The simulation was carried out at the School of Automotive at Tongji University in Shanghai, China.
Conflicts of Interest
The authors declare no conflicts of interest.
Appendix A. Naming Conventions
Unless otherwise specified, the symbols involved in this book are named according to the following rules:
Physical quantity + component (subscript) + component and area (superscript) + input/output relationship (superscript).
For example,
where
—Abbreviations for physical quantities: mass flow;
—Ingredient abbreviation: hydrogen;
—Part and area names: palladium;
—Input–output relationship: output.
The physical quantity symbols are shown in Table A1, the component symbols are shown in Table A2, the component and region symbols are shown in Table A3, and the input–output relationship symbols are shown in Table A4.

Table A1.
Physical quantity symbol table.
Table A1.
Physical quantity symbol table.
| Serial Number | Symbol | English Name | Unit |
|---|---|---|---|
| 1 | Area | ||
| 2 | Molar specific heat capacity | ||
| 3 | Gravitational acceleration | ||
| 4 | Enthalpy change | ||
| 5 | Head | ||
| 6 | Flow resistance coefficient | - | |
| 7 | Low calorific value | ||
| 8 | Mass | ||
| 9 | Molar flow | ||
| 10 | Molar mass | ||
| 11 | Mass specific heat capacity | ||
| 12 | Revolution | ||
| 13 | Mole | ||
| 14 | Mole flow | ||
| 15 | Heat | ||
| 16 | Pressure | ||
| 17 | Differential pressure | ||
| 18 | Volumetric flow | ||
| 19 | Molar ratio of methanol to water | ||
| 20 | Molar rate | ||
| 21 | Surface area per unit mass | - | |
| 22 | Temperature | ||
| 23 | Molar component | - | |
| 24 | Alpha | - | |
| 25 | Thickness (delta) | ||
| 26 | Density (rho) | ||
| 27 | Efficiency | ||
| 28 | Latent heat of vaporization |

Table A2.
Table of ingredient symbols.
Table A2.
Table of ingredient symbols.
| Serial Number | Symbol | English Name |
|---|---|---|
| 1 | Air | |
| 2 | Ambient | |
| 3 | Catalyst | |
| 4 | Methanol | |
| 5 | Carbon dioxide | |
| 6 | Carbon monoxide | |
| 7 | Hydrogen | |
| 8 | Water | |
| 9 | Mixture of methanol and water | |
| 10 | Nitrogen | |
| 11 | Oxygen |

Table A3.
Table of components and area symbols.
Table A3.
Table of components and area symbols.
| Serial Number | Symbol | English Name |
|---|---|---|
| 1 | Back-pressure valve | |
| 2 | Blower | |
| 3 | Combustion chamber | |
| 4 | Hot end of the heat exchanger | |
| 5 | Cold end of the heat exchanger | |
| 6 | Heat exchanger | |
| 7 | Water pump | |
| 8 | Palladium | |
| 9 | Evaporation chamber |

Table A4.
Input–output relationship symbols.
Table A4.
Input–output relationship symbols.
| Serial Number | Symbol | English Name |
|---|---|---|
| 1 | Exit | |
| 2 | Thermal radiation | |
| 3 | Input | |
| 4 | React | |
| 5 | Reference |
References
- Mei, D.; Qiu, X.; Liu, H.; Wu, Q.; Yu, S.; Xu, L.; Zuo, T.; Wang, Y. Progress on methanol reforming technologies for highly efficient hydrogen production and applications. Int. J. Hydrogen Energy 2022, 47, 35757–35777. [Google Scholar] [CrossRef]
- Nair, B.K.R.; Harold, M.P. Hydrogen generation in a Pd membrane fuel processor: Productivity effects during methanol steam reforming. Chem. Eng. Sci. 2006, 61, 6616–6636. [Google Scholar] [CrossRef]
- Wu, H.W.; Hsu, T.T.; Fan, C.M.; He, P.H. Reduction of smoke, PM2.5, and NOX of a diesel engine integrated with methanol steam reformer recovering waste heat and cooled EGR. Energy Convers. Manag. 2018, 172, 567–578. [Google Scholar] [CrossRef]
- Sharaf, O.Z.; Orhan, M.F. An overview of fuel cell technology: Fundamentals and applications. Renew. Sustain. Energy Rev. 2014, 32, 810–853. [Google Scholar] [CrossRef]
- Pei, Y.; Chen, F.; Jiao, J.; Liu, S. Analysis and control strategy design for PEMFC purging process. Energy 2024, 290, 130233. [Google Scholar] [CrossRef]
- Chen, F.; Pei, Y.; Jiao, J.; Chi, X.; Hou, Z. Energy flow and thermal voltage analysis of water-cooled PEMFC stack under normal operating conditions. Energy 2023, 275, 127254. [Google Scholar] [CrossRef]
- Prakash, G.K.S.; Olah, G.; Goeppert, A. Beyond oil and gas: The methanol economy. ECS Trans. 2011, 35, 31–40. [Google Scholar] [CrossRef]
- Israni, S.H.; Harold, M.P. Methanol steam reforming in single-fiber packed bed Pd–Ag membrane reactor: Experiments and modeling. J. Membr. Sci. 2010, 369, 375–387. [Google Scholar] [CrossRef]
- Pan, C.; He, R.; Li, Q.; Jensen, J.O.; Bjerrum, N.J.; Hjulmand, H.A.; Jensen, A.B. Integration of high temperature PEM fuel cells with a methanol reformer. J. Power Sources 2005, 145, 392–398. [Google Scholar] [CrossRef]
- Lindstroem, B.; Pettersson, L.J. Development of a methanol fuelled reformer for fuel cell applications. J. Power Sources 2003, 118, 71–78. [Google Scholar] [CrossRef]
- Kumar, S.; Kumar, S.; Katiyar, N. Polymer electrolyte membrane fuel cell grade hydrogen production by methanol steam reforming: A comparative multiple reactor modeling study. J. Power Sources 2013, 243, 381–391. [Google Scholar]
- Chen, W.-H.; Su, Y.-Q.; Lin, B.-J.; Kuo, J.-K.; Kuo, P.-C. Hydrogen production from partial oxidation and autothermal reforming of methanol from a cold start in sprays. Fuel 2021, 287, 119638. [Google Scholar] [CrossRef]
- Peppley, B.A.; Amphlett, J.C. Methanol– steam reforming on Cu/ZnO/Al2O3 catalysts. Part 2. A comprehensive kinetic model. Appl. Catal. A Gen. 1999, 179, 31–49. [Google Scholar]
- Lindstrom, B.; Pettersson, L.J. Hydrogen generation by steam reforming of methanol over copper-based catalysts from fuel cell applications. Int. J. Hydrogen Energy 2001, 26, 923. [Google Scholar] [CrossRef]
- Palo, D.R.; Dagle, R.A.; Holladay, J.D. Methanol steam reforming for hydrogen production. Chem. Rev. 2007, 107, 3992–4021. [Google Scholar] [CrossRef] [PubMed]
- Chen, W.H.; Syu, Y.J. Thermal behavior and hydrogen production of methanol steam reforming and autothermal reforming with spiral preheating. Int. J. Hydrogen Energy 2010, 36, 3397–3408. [Google Scholar] [CrossRef]
- Wu, W.; Pai, C.C. Control of a heat-integrated proton exchange membrane fuel cell system with methanol reforming. J. Power Sources 2009, 194, 920–930. [Google Scholar] [CrossRef]
- Hu, Y.; Chmielewski, D.J.; Papadias, D. Autothermal Reforming of Gasoline for Fuel Cell Applications: A Control-Oriented Dynamic Model. Ind. Eng. Chem. Res. 2008, 47, 9437–9446. [Google Scholar] [CrossRef]
- Papadias, D.; Lee, S.H.D.; Chmielewski, D.J. Autothermal Reforming of Gasoline for Fuel Cell Applications: A Transient Reactor Model. Ind. Eng. Chem. Res. 2006, 45, 5841–5858. [Google Scholar] [CrossRef]
- Hu, Y.; Chmielewski, D.J.; Papadias, D. Autothermal reforming of gasoline for fuel cell applications: Controller design and analysis. J. Power Sources 2008, 182, 298–306. [Google Scholar] [CrossRef]
- Lu, J.G.; Zhuang, H.; Yang, Q.M.; Wang, X.F.; Zheng, J.F.; Chen, J.S.; Sun, Y.X. Controller design and experiment for autothermal reforming of methanol in miniature reactor. ISA Trans. 2014, 53, 1470–1475. [Google Scholar] [CrossRef] [PubMed]
- Søren Juhl, A.; Søren Knudsen, K.; Simon, S. Control and experimental characterization of a methanol reformer for a 350 W high temperature polymer electrolyte membrane fuel cell system. Int. J. Hydrogen Energy 2013, 38, 1676–1684. [Google Scholar]
- Dimitris, I.; Martha, O.; Simira, P.; Panos, S.; Spyros, V. Dynamic modeling and control analysis of a methanol autothermal reforming and PEM fuel cell power system. Appl. Energy 2017, 208, 703–718. [Google Scholar]
- Pei, Y.; Chen, F.; Jiao, J.; Mo, T.; Li, Y. Inlet Gas Temperature Control Technology for PEMFC Stack Test Benches. In SAE Technical Paper Series 2023; SAE International: Warrendale, PA, USA, 2003. [Google Scholar] [CrossRef]
- Peppley, B.A.; Amphlett, J.C.; Kearns, L.M.; Mann, R.F. Methanol-steam reforming on Cu/ZnO/Al2O3. Part 1: The reaction network. Appl. Catalysis. A Gen. 1999, 179, 21–29. [Google Scholar] [CrossRef]
- Zhou, Y.; Wang, L.; Deng, B.; Li, Q.; Lin, Z. The parametric study of a novel methanol steam reforming system combining Pd membrane purification and purification retentate combustion. In Proceedings of the IOP Conference: Earth and Environmental Science, Banda Aceh, Indonesia, 15–16 September 2021; IOP Publishing: Bristol, UK, 2021; Volume 675, p. 012213. [Google Scholar]
- Adolfo, I.; Tiziana, L.; Angelo, B. Methanol steam reforming in a dense Pd-Ag membrane reactor: The pressure and WHSV effects on CO-free H2 production. J. Membr. Sci. 2008, 323, 235–240. [Google Scholar]
- Zhang, S.B.; Zhang, Y.F.; Chen, J.Y.; Yin, C.W.; Liu, X.W. Design, fabrication and performance evaluation of an integrated reformed methanol fuel cell for portable use. J. Power Sources 2018, 389, 37–49. [Google Scholar] [CrossRef]
- Nawadee, S.; Chananchai, W. Internal Model Control of Autothermal Reformer: Effect of Change in Reactant Amount. Key Eng. Mater. 2016, 689, 121–125. [Google Scholar]
Disclaimer/Publisher’s Note: The statements, opinions and data contained in all publications are solely those of the individual author(s) and contributor(s) and not of MDPI and/or the editor(s). MDPI and/or the editor(s) disclaim responsibility for any injury to people or property resulting from any ideas, methods, instructions or products referred to in the content. |
© 2025 by the authors. Licensee MDPI, Basel, Switzerland. This article is an open access article distributed under the terms and conditions of the Creative Commons Attribution (CC BY) license (https://creativecommons.org/licenses/by/4.0/).