1. Introduction
In recent decades, the scientific community has increasingly focused on addressing significant climate change. A key priority has been to face the issue of anthropogenic greenhouse gas emissions to mitigate global warming. The most viable long-term solution for this is the transition from fossil fuels to renewable energy sources. However, the inherent variability and intermittency of solar and wind energy necessitate the development of effective storage systems. One viable option is electric energy storage using batteries, though this approach presents challenges such as high energy requirements for manufacturing and disposal, as well as the scarcity of raw materials. Studies by Shu et al. [
1] have examined the environmental impact of batteries used in electric vehicles. Another promising solution for renewable energy storage is hydrogen production through water electrolysis. Gado et al. [
2] have studied hydrogen production by means of photovoltaic and wind energy. Hydrogen, when burned under appropriate conditions, only produces water, making it a strong contender to replace traditional fossil fuels. In recent years, there has been extensive research into using hydrogen fuel in spark ignition engines, both in conventional and hybrid vehicles. White et al. [
3] provided a review of hydrogen-fueled engines, while Verhelst et al. [
4] outlined recent advancements in this area. Sopena et al. [
5] compared the performance of commercial engines fueled by gasoline and hydrogen. Additionally, there has been exploration into integrating hydrogen into hybrid electric vehicles (HEVs), as demonstrated by studies conducted by Keller et al. [
6] and Wang et al. [
7]. Arat [
8] tested an HEV engine fueled with a mix of hydrogen and conventional fuel, while He et al. [
9] and Beccari [
10] conducted experimental and theoretical research on hydrogen-fueled HEVs. Green hydrogen offers several advantages over conventional fuels when used in spark ignition engines. Its high laminar flame speed, as noted by Dahoe [
11], leads to shorter combustion durations compared to hydrocarbon fuels like gasoline or methane, thus improving engine thermodynamic efficiency. Although hydrogen has a lower standard density than traditional hydrocarbons, its volumetric power density is comparable to other gaseous fuels like methane or propane because of its significantly higher heating value per unit mass.
Table 1 summarizes some hydrogen properties and also some hydrogen–air mixtures’ properties; there is also a comparison between hydrogen, isooctane, and methane.
In
Table 1, λ is the ratio between actual air/fuel (A/F) ratio and stoichiometric A/F ratio.
Issues related to using hydrogen as fuel for spark ignition engines include its high reactivity, which often leads to pre-ignition or auto-ignition phenomena, particularly for near-stoichiometric mixtures, resulting in knocking. Additionally, the short quenching distance and high flame temperature contribute to increasing the heat loss through the combustion chamber walls [
12], reducing engine efficiency. Additionally, the high temperatures reached during combustion lead to increased NOx emissions, which is the only pollutant produced by hydrogen-fueled engines. The mentioned issues can potentially be addressed by using very lean mixtures, as allowed by the wide flammability limits of hydrogen, reducing NOx emissions, heat transfer, and knocking. This, in turn, enables the implementation of high engine volumetric compression ratios, leading to improved engine efficiency. However, a lean air/hydrogen mixture produces a small power density (i.e., the engine power per unit volume) which can be mitigated by turbocharging. Nagalingam et al. [
13], Berckmüller et al. [
14], and Natkin et al. [
15] have investigated the performance and NOx emissions of boosted hydrogen-fueled internal combustion engines. Understanding combustion is crucial in internal combustion engines as it significantly influences engine performance and efficiency. Salvi et al. [
16] examined the influence of various factors on combustion duration in a hydrogen-fueled spark ignition (SI) engine, identifying two distinct phases: the combustion start and rapid combustion. Beccari et al. [
17] found a relationship between the volumetric compression ratio of the engine and the knock-free air/fuel ratio (i.e., the minimum air/fuel ratio that does not produce knocking).
In recent years, many authors, in addition to those mentioned above, have studied various aspects related to hydrogen implementation in SI engines, such as cycle-by-cycle variations [
18], energy and exergy analyses [
19], and engine performance and emissions [
20], but only a few of them have focused on the parameters that influence heat loss through the combustion chamber walls [
21,
22], the ways to reduce heat loss [
23], and the difficulty of simulating it by means of the traditional heat transfer models [
24]. This paper fits into this line of research, providing an innovative heat transfer model properly calibrated with a set of experimental data obtained in a very wide range of operating conditions previously unreleased by other authors; the scope of this work is to expand the current knowledge on the specific topic of heat transfer modeling. In particular, the authors conducted experimental tests on a CFR engine to study characteristics of hydrogen combustion such as its duration and thermal efficiency of the engine with particular reference to the wall heat transfer. The experimental tests were conducted by varying the volumetric compression ratio of the engine and the air/fuel ratio of the mixture in order to analyze the effect of these parameters on both combustion duration and efficiency and also on the heat exchanged with the combustion chamber walls. The experimental data were used to calibrate a zero-dimensional thermodynamic model in order to predict the hydrogen-fueled engine thermal efficiency in a wide range of operating conditions. Moreover, the numerical model allowed us to analyze the different phenomena involved in engine efficiency, namely the combustion phase and duration, the amount of unburned fuel (combustion efficiency), and the heat transferred to the walls, and to separately evaluate their influence. The engine was also fueled with methane and isooctane (two primary reference fuels) in order to compare the three fuels in terms of combustion duration and efficiency, amount of heat loss, and engine efficiency.
It is worth mentioning that the present work is a further development of a previous paper [
17] of the same authors; in [
17], the topic of laminar and turbulent combustion phases and the influence of engine compression ratio and air/fuel ratio is covered, comparing hydrogen and gasoline. The present work, instead, mainly analyzes the heat exchange with combustion chamber walls; the effects of this phenomenon have been isolated thanks to the implementation of a properly calibrated numerical simulation, which allowed us to evaluate the effects of non-isochoric combustion, and also thanks to the experimental evaluation of combustion efficiency. Furthermore, in the present work, the calibrated numerical simulation was used to evaluate the heat exchange with chamber walls in the optimal operating conditions (maximum engine efficiency).
The main novelty of the present work, with respect to the existing literature, lies in the implementation of a modified heat exchange model, in the numerical simulation, that allowed us to take into account the effects of the thinner thermal boundary layer in hydrogen combustion, compared to traditional fuels, which in turn produces higher heat exchanges.
In the following paragraph, there is a description of the experimental setup and test execution.
2. Experimental Setup
The engine utilized in the present study was a standard CFR engine [
25] employed for determining the octane rating of liquid fuels. As the engine configuration and measurement apparatus have been extensively detailed in prior publications of the same authors [
26,
27,
28], only a short overview will be provided in this paragraph. The CFR engine is a single-cylinder, two-valve, variable-compression-ratio (CR), four-stroke SI engine. Its primary characteristics are outlined in
Table 2.
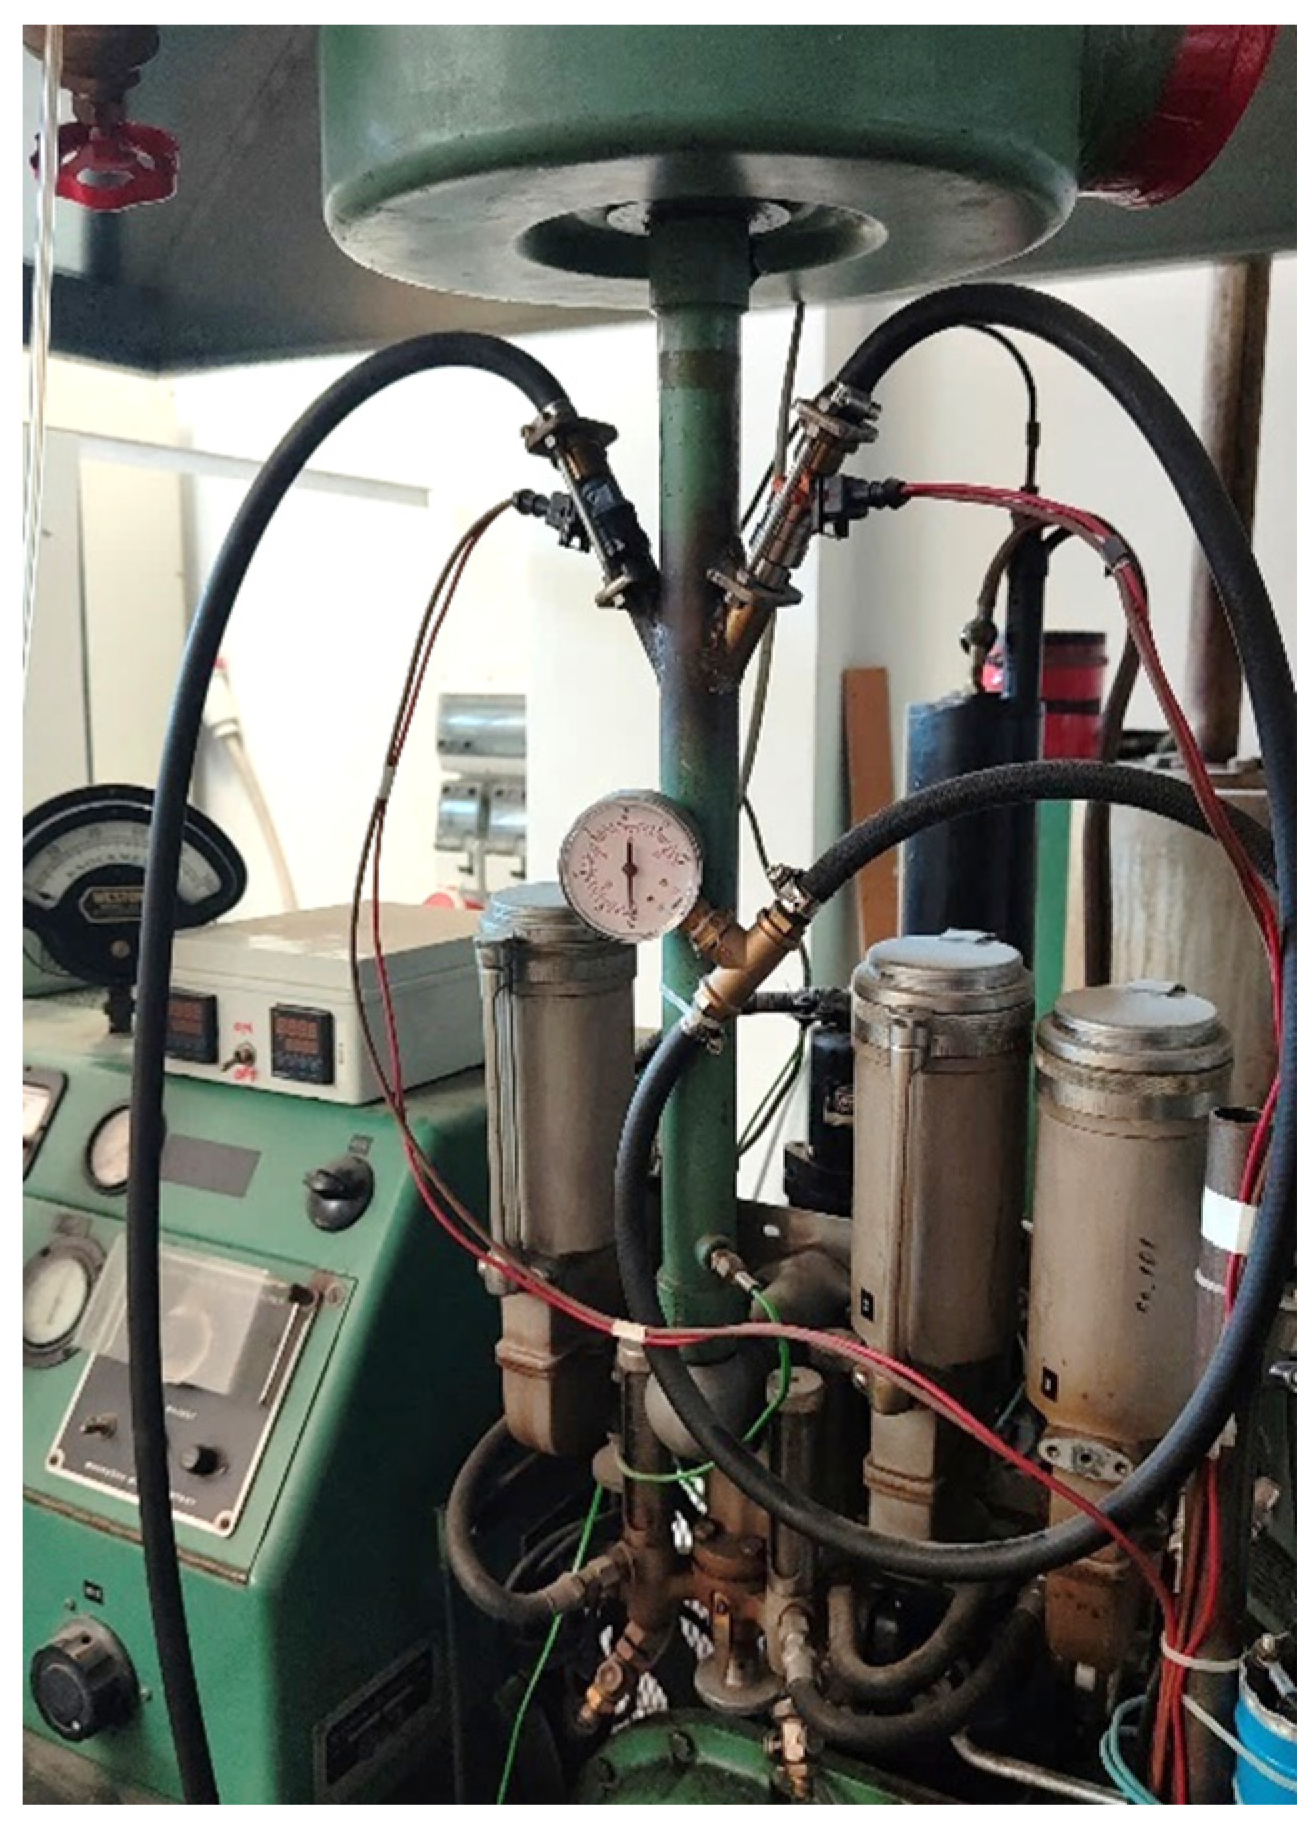
The engine’s CR can be modified across a large range by shifting the cylinder head. To enable control over the quantity of injected gaseous fuel or gasoline and to produce air/fuel mixtures with several ratios, the original engine was adapted by integrating two distinct electronic injection systems (illustrated in
Figure 1).
During testing, both fuel and air were determined using appropriate mass flow meters. In-cylinder pressure was monitored using a piezoelectric sensor flush mounted within the combustion chamber, while piston position was determined using an optical encoder linked to the engine crankshaft. The in-cylinder pressure sensor also served to detect knocking, as explained in [
26].
The NOx (ppm), total unburned hydrocarbons (THCs; ppm), carbon monoxide (CO; %vol.) and dioxide (CO2; %vol.), and oxygen (O2; %vol.) were measured by means of a proper exhaust gas analyzer.
Table 3 reports the accuracies of the measurement equipment used in the tests.
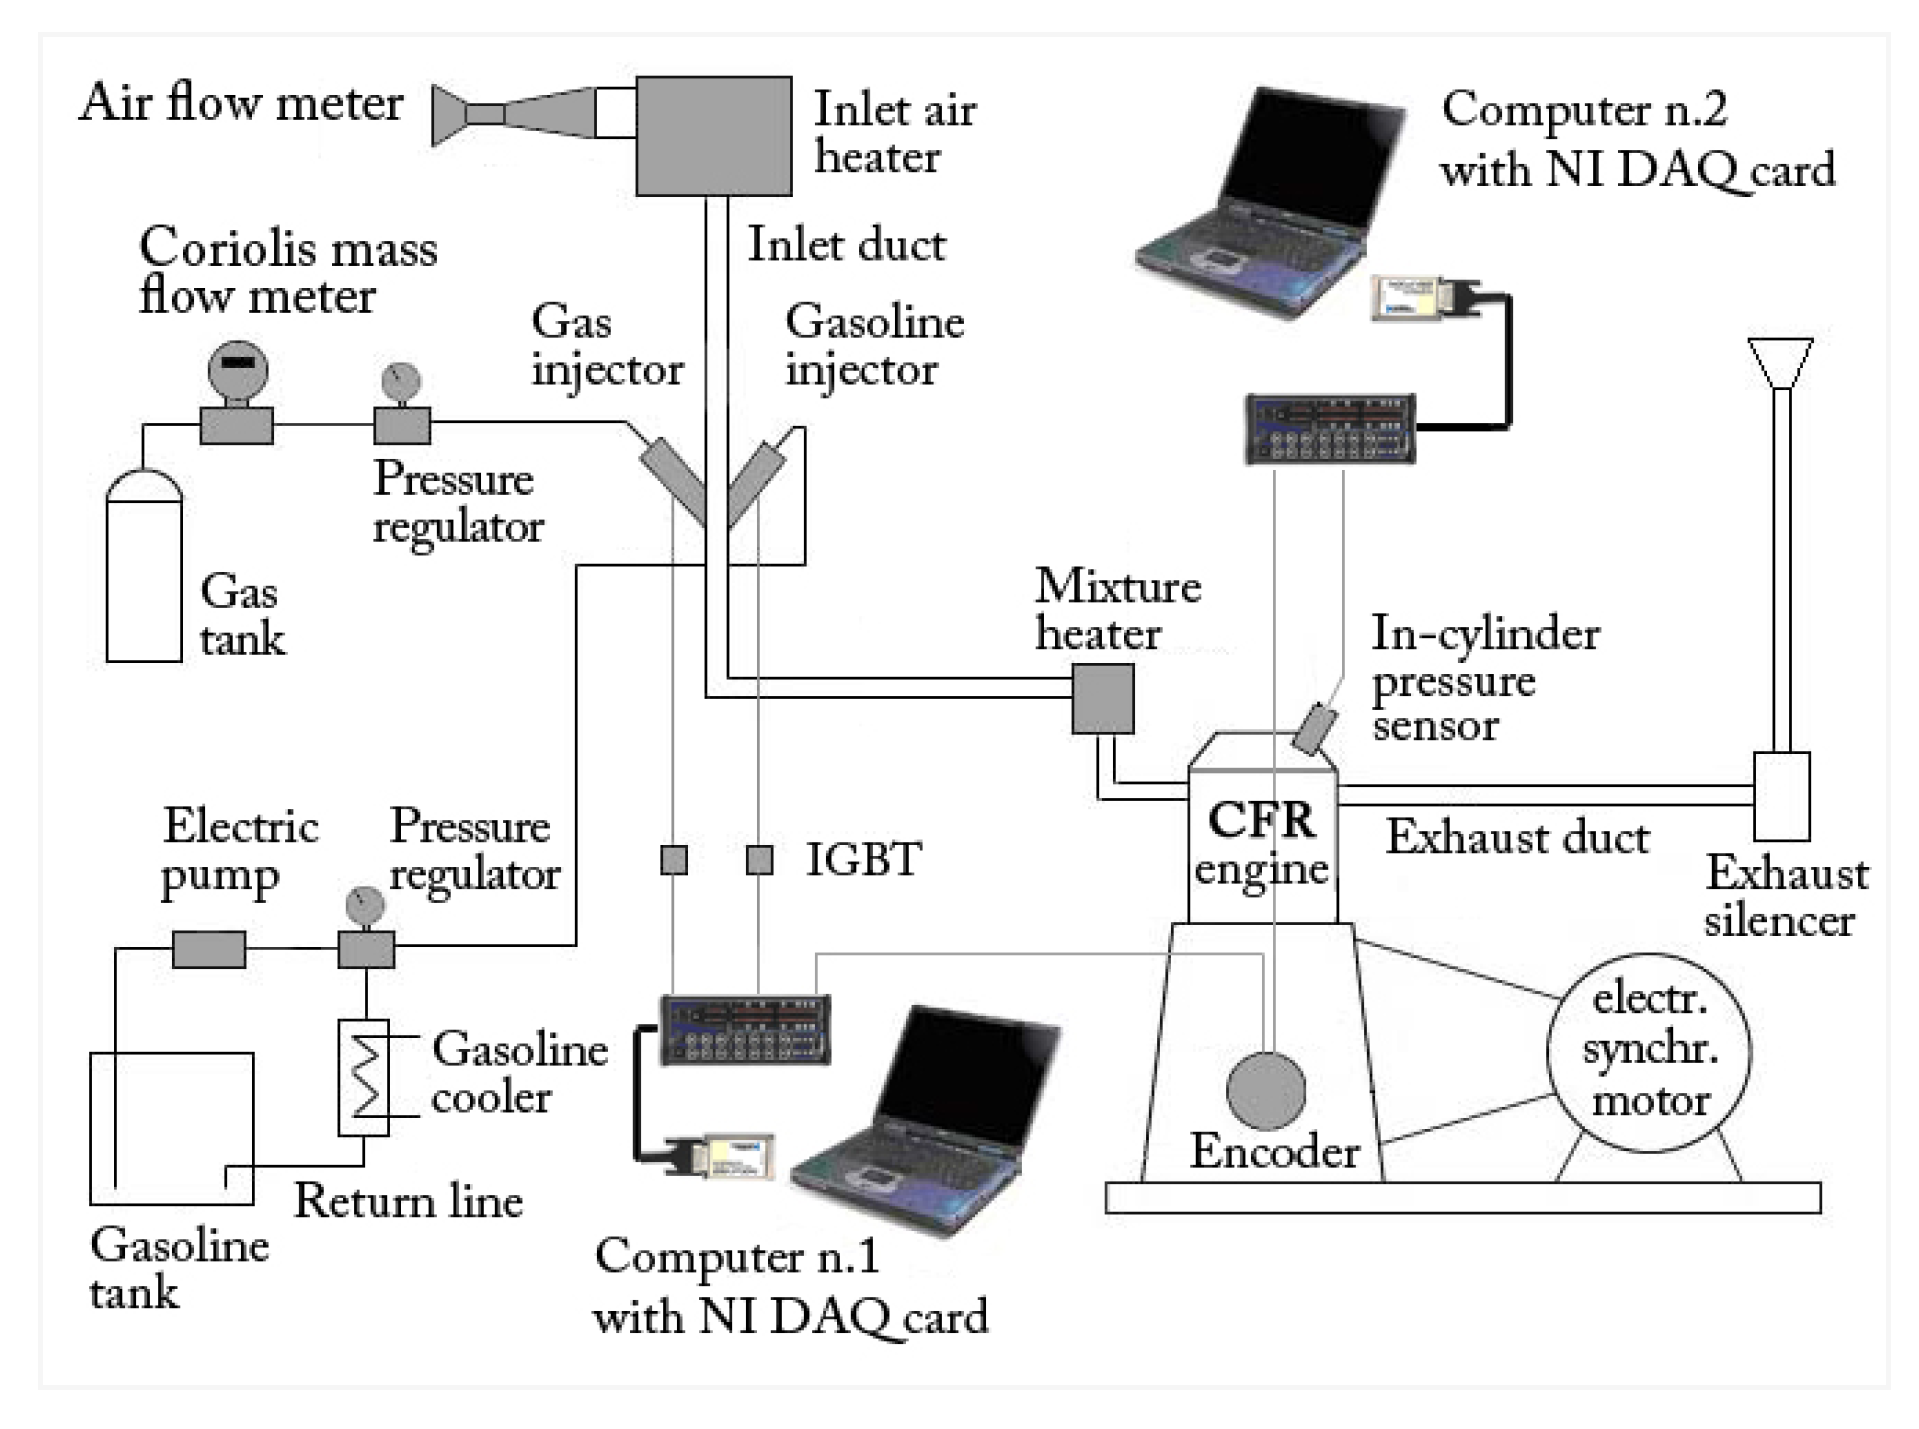
Figure 2 shows a sketch of the experimental layout.
The engine was equipped with two electric heaters which were connected to two independent PID control systems in order to maintain air/fuel mixture temperature at a fixed value of 40 °C during the tests. As shown in
Figure 2, the gaseous fuel (methane or hydrogen) stored in a reservoir tank passed through a Coriolis-effect mass flow meter and hence through a pressure regulator, used to maintain the injector feed pressure of 3 bar. A personal computer was used to manage the injection system and perform data acquisition, by means of expressly designed software developed by the authors in a LabVIEW environment. A properly developed electrical circuit was employed for the activation of the fuel injector, mainly composed of the power supply, the injector solenoid, and transistors specifically designed for automotive injection/ignition application. A National Instruments DAQCard 6062E (National Instruments Corp., 11500 N Mopac Expwy, Austin, TX, USA) programmed in a LabVIEW environment was used to generate the injection digital pulses, whose high level duration was exactly the injection time; the modulation of this high level width therefore allowed for the precise control of the amount of fuel injected. All the relevant quantities (intake duct pressure, fuel and inlet air mass flows, air/fuel mixture temperatures) were acquired by means of the mentioned National Instruments DAQCard 6062E to trigger and clock the pulses generated by a 360 ppr incremental optical encoder connected to the engine crankshaft. A second personal computer was used to process the in-cylinder pressure signal acquired at 360 Hz sampling frequency (one sample per crank angle degree) by means of a second National Instruments DAQCard 6062E and the encoder was used to trigger and clock the acquisition (
Figure 2). The intake duct pressure was measured by means of a piezoresistive pressure sensor and was employed to compensate the acquired pressure cycles. For each operating condition tested, 100 consecutive pressure cycles were sampled and averaged to minimize the effects of cycle-by-cycle variation.
3. Test Execution and Data Analysis
The CFR engine described above, fueled with hydrogen, methane, and isooctane, was utilized for a set of experimental tests; the engine’s CR and A/F ratio were adjusted across a large range and the corresponding pressure curves were recorded. The cylinder pressure was employed to calculate the experimental mass fraction burned (MFB) curve using the Rassweiler and Withrow method [
29], aiming to distinguish between different combustion phases (laminar and turbulent).
Additionally, the in-cylinder measured pressure was utilized to calculate the engine’s indicated thermal efficiency (
ITE) using the following formula:
where
PIND represents the indicated power,
LHV stands for the lower heating value of the fuel, and
GF denotes the measured fuel mass flow. The indicated power was determined using engine speed
n, displacement
V, and indicated mean effective pressure (
IMEP) as follows:
The
IMEP was calculated by integrating the measured pressure over the in-cylinder volume using the following formula:
As is known,
ITE can be seen as the product of various efficiencies that consider various energy loss phenomena. The first one is the ideal thermodynamic cycle efficiency, which, for SI engines, corresponds to the Otto cycle and depends only on the engine volumetric compression ratio. The other energy loss phenomena are incomplete combustion, non-isochoric combustion, heat loss through combustion chamber walls, and gas leaks (whose effect was included in heat exchanges). The first one is identified by the combustion efficiency (
CE):
where
Qb is the actual thermal power, generated by the combustion, while
GF·LHV is the theoretical one.
CE can be evaluated by measuring the oxygen content in the exhaust gas and by comparing it with the theoretical oxygen content of complete combustion. For a given generic hydrocarbon
CnHm, a given
CE and a given
λ, the combustion reaction brings the following:
And the
O2 content (%vol.) in the exhaust gas can be evaluated with the following:
This formula allows one to evaluate the CE of combustion that produces a given (measured) O2 content in the exhaust emissions.
The amount of heat transferred to the combustion chamber walls can be identified by the following parameter called heat loss efficiency (
HLE):
where
Ql is the heat flux to the combustion chamber walls.
Ql could be evaluated by measuring the wall and gas local temperatures, the cooling water mass flow, and local temperatures, but this is quite a complicated procedure. An easier way to estimate the heat loss is to perform a thermodynamic simulation that, if properly calibrated with experimental data, is able to assess the heat loss in the actual (experimental) operating condition and to predict it under different operating conditions. The simulation is also able to take into account the non-isochoric combustion effects. For this purpose, a zero-dimensional (0-D) thermodynamic simulation, thoroughly described in [
30], was calibrated with pressure curves measured in the 73 operating conditions described in
Table 4. The CFR engine was fueled with hydrogen, methane, and isooctane in order to compare the experimental results, in terms of combustion duration and ITE, and the numerical results in terms of heat losses. Both methane and isooctane were fueled in stoichiometric proportions with air, in order to set a reference condition, while for hydrogen the λ value was varied from 1.3 to 3 (λ values lower than 1.3 would produce knocking as reported in [
17]); the engine CR was varied from 4.75 to 14.51 in order to properly calibrate the numerical simulation with a great number of operating conditions.
In
Table 4, “SA” stands for spark advance and is measured in crank angle degree before top dead center (CAD BTDC).
The SA was set to the minimum value between the knock-limited SA and the value that produces a location of pressure peak (LPP) next to 15 CAD after TDC, which is a universally used indicator of the best combustion phase, as stated by Heywood [
31].
The numerical MFB curve was simulated by means of a Wiebe function calibrated with the experimental data of
Table 4, as described in [
30].
The heat flux
Ql exchanged with the combustion chamber walls in [
30] was evaluated by the following:
Tw is the wall temperature, h is the convective heat transfer coefficient, S is the surface of the combustion chamber, and T is the gas temperature.
The Woschni model [
32] was used to evaluate the convective coefficient:
D is the cylinder diameter,
p is the gas pressure, and
Cw represents the average velocity of the gas calculated by the following:
where
vp is the average speed of the piston and
C1 = 6.18 during the intake and exhaust phases and 2.28 during the other phases.
C2 = 0 during the intake, compression, and exhaust phases and 3.24 × 10⁻³ [m/(s·K)] during the combustion and expansion phases; pIVC, TIVC, and VIVC are the gas pressure and temperature and the cylinder volume at inlet valve closure; p is the gas pressure; pm is the gas pressure of the motored engine (i.e., when there is no combustion); and V is the displacement of the engine.
The short quenching distance of the hydrogen flame is correlated with a thin thermal boundary layer and, in turn, with higher heat transfer compared with traditional fuels such as gasoline or methane. In order to take into account the effects of quenching distance, in the present work, the term
Cw of the Woschni model was modified as follows:
where the coefficient
C3, which is different from zero only during combustion, was properly calibrated using the experimental pressure curves obtained with hydrogen, methane, and isooctane. In the authors’ opinion, this modified version of the Woschni model describes with greater accuracy the heat transfer phenomenon and represents the most innovative part of the present work.
Furthermore, the experimentally measured air and fuel mass flows, the spark advance, the combustion duration and evolution (MFB curve), and the oxygen content in the exhaust gas (combustion efficiency) were used as inputs for the 0-D simulation which, once calibrated with the proper values of the
C3 parameter, was able to reproduce with great accuracy the engine IMEP and ITE in all of the operating conditions of
Table 4; this procedure allowed us to obtain and compare the HLE values for the three fuels tested, as will be shown in the following section.
4. Results and Discussion
The measured pressure curves, taken under the operating conditions of
Table 4, were used to obtain the MFB curves which in turn allowed us to identify two combustion phases: the combustion start, mainly characterized by laminar propagation speed, and rapid combustion, characterized by turbulent propagation speed as thoroughly explained in [
17]. The combustion start ranges between spark timing and 5% of the MFB while rapid combustion lies between 5% and 90% of the MFB [
17] and consequently has the greater influence on thermodynamic efficiency.
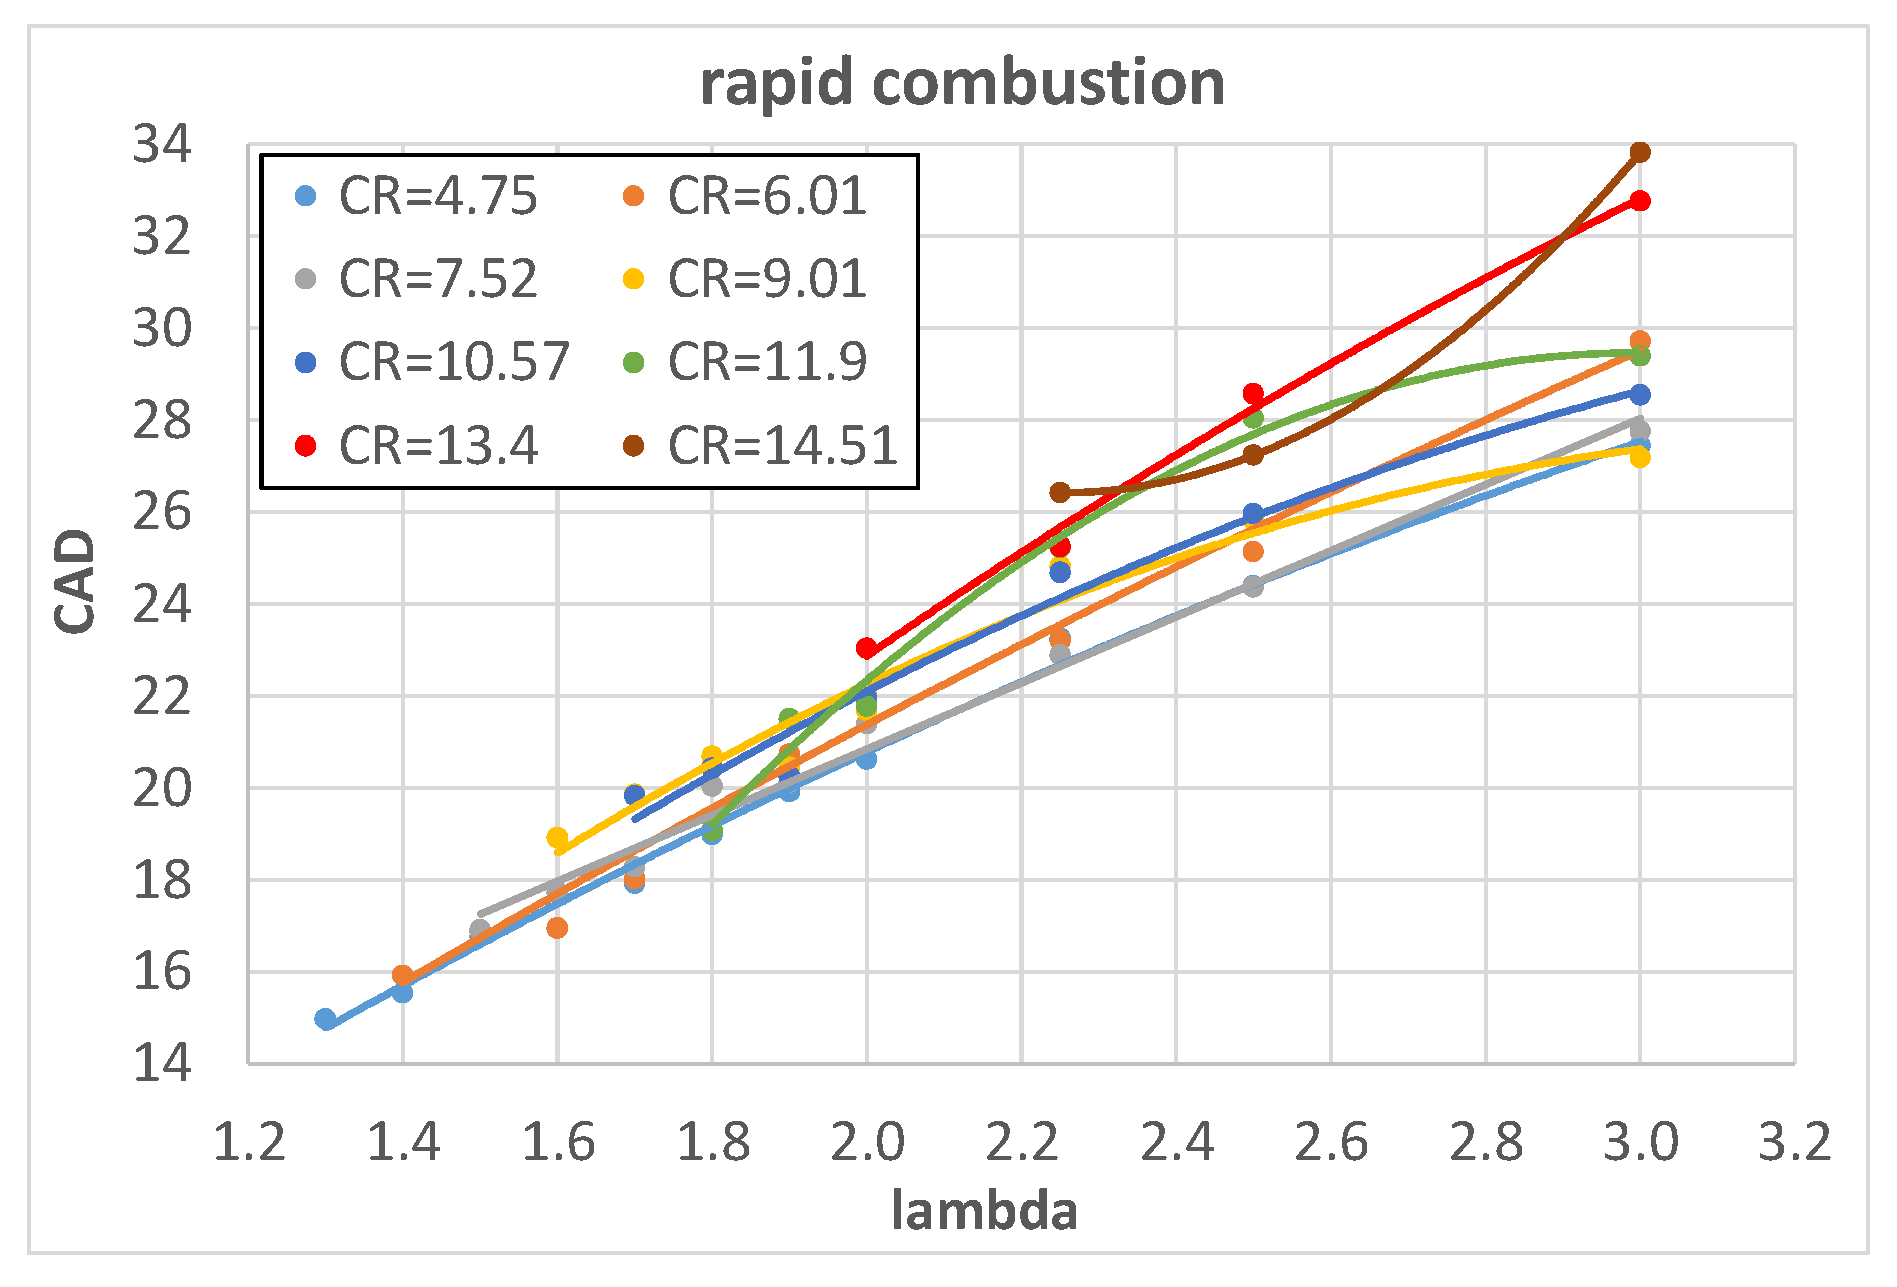
Figure 3 and
Figure 4 show the influence of λ on the combustion start and rapid combustion phase of hydrogen, expressed in CAD, with fixed values of engine CR.
Both combustion start and rapid combustion increase almost linearly with λ; this is expected because a reduction in fuel content in the A/F mixture (increase in λ) reduces the heat input. As a consequence, both temperature and pressure decrease and this reduces the laminar flame speed [
11] and in turn slows down the combustion.
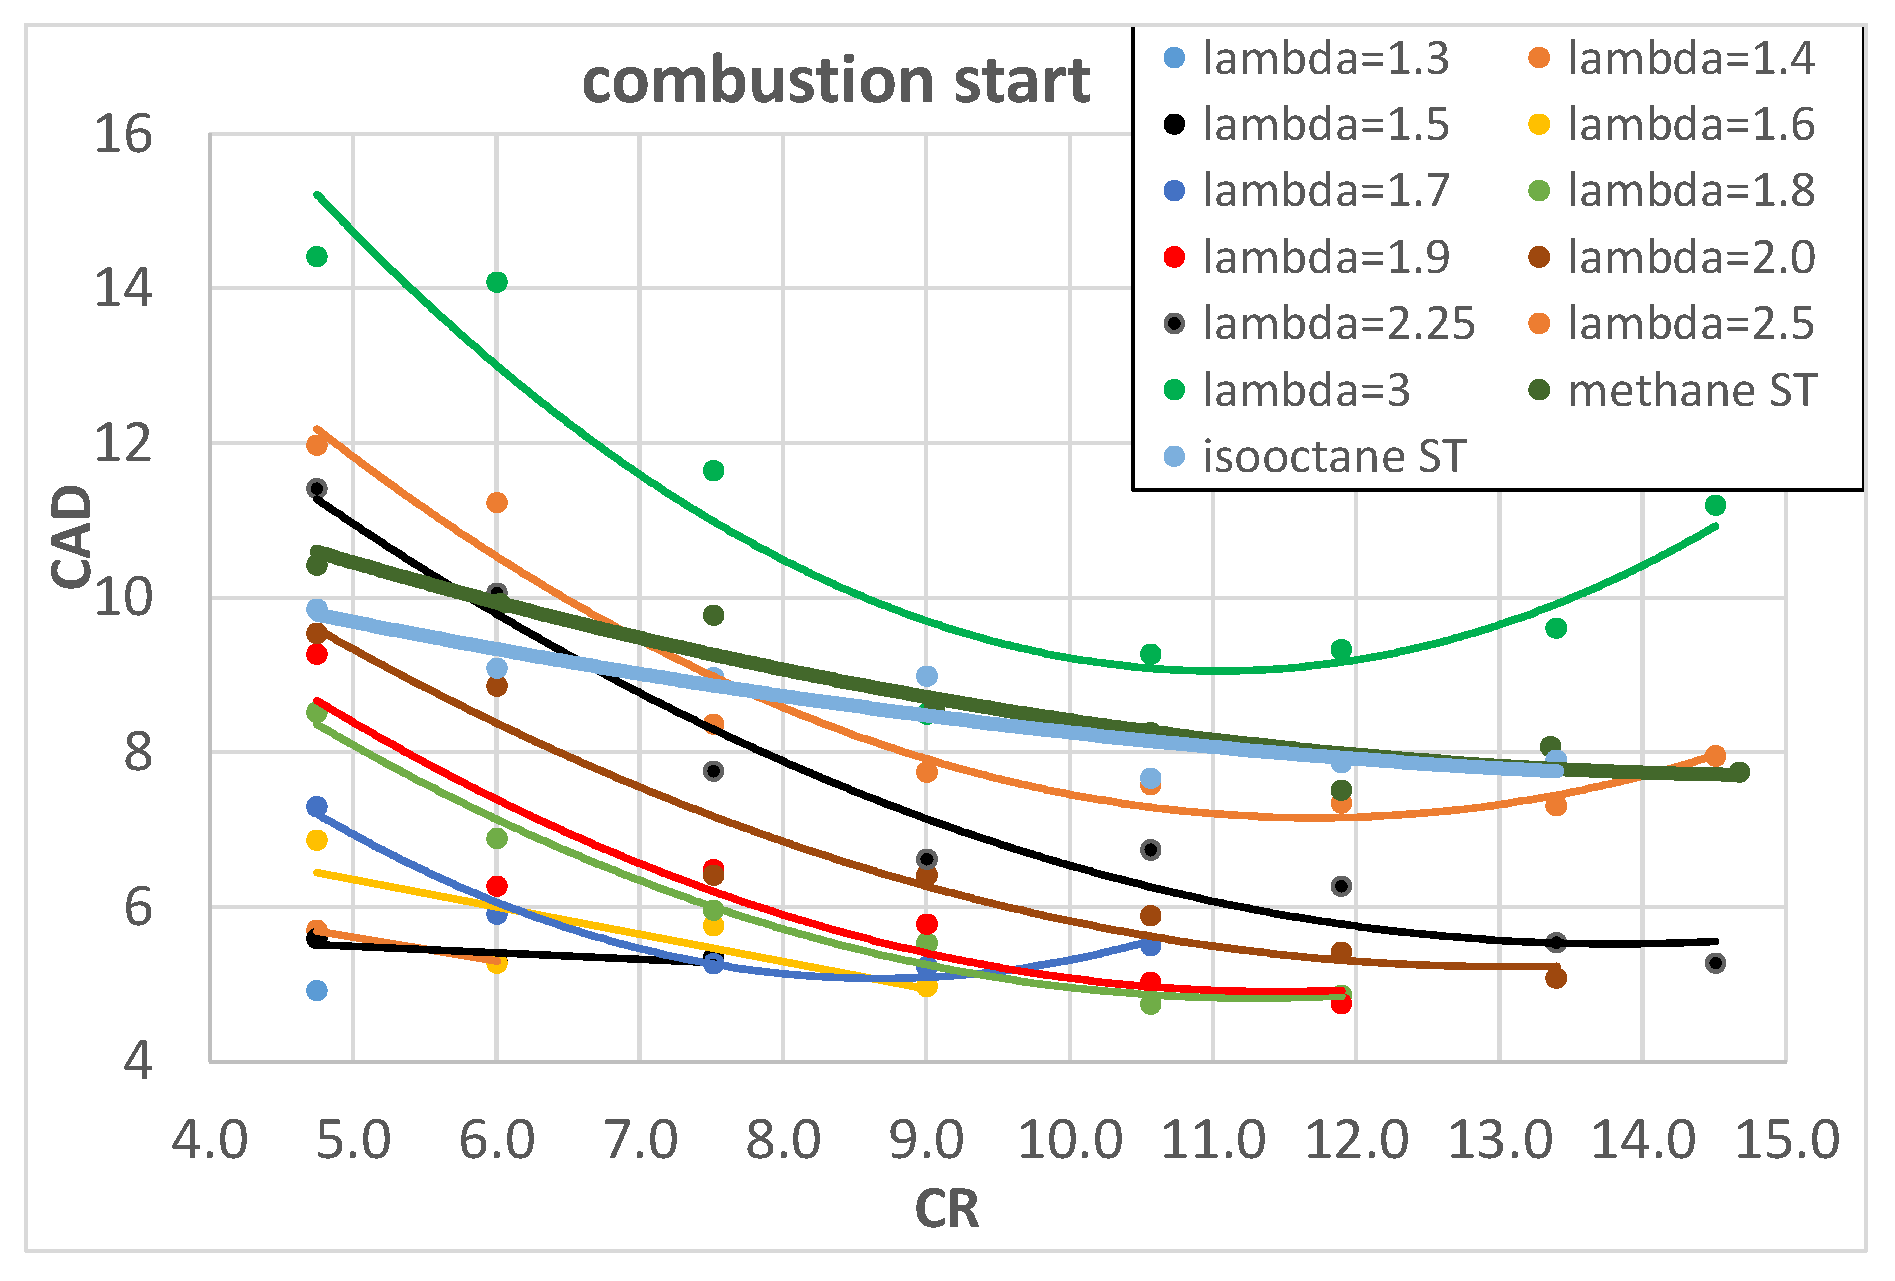
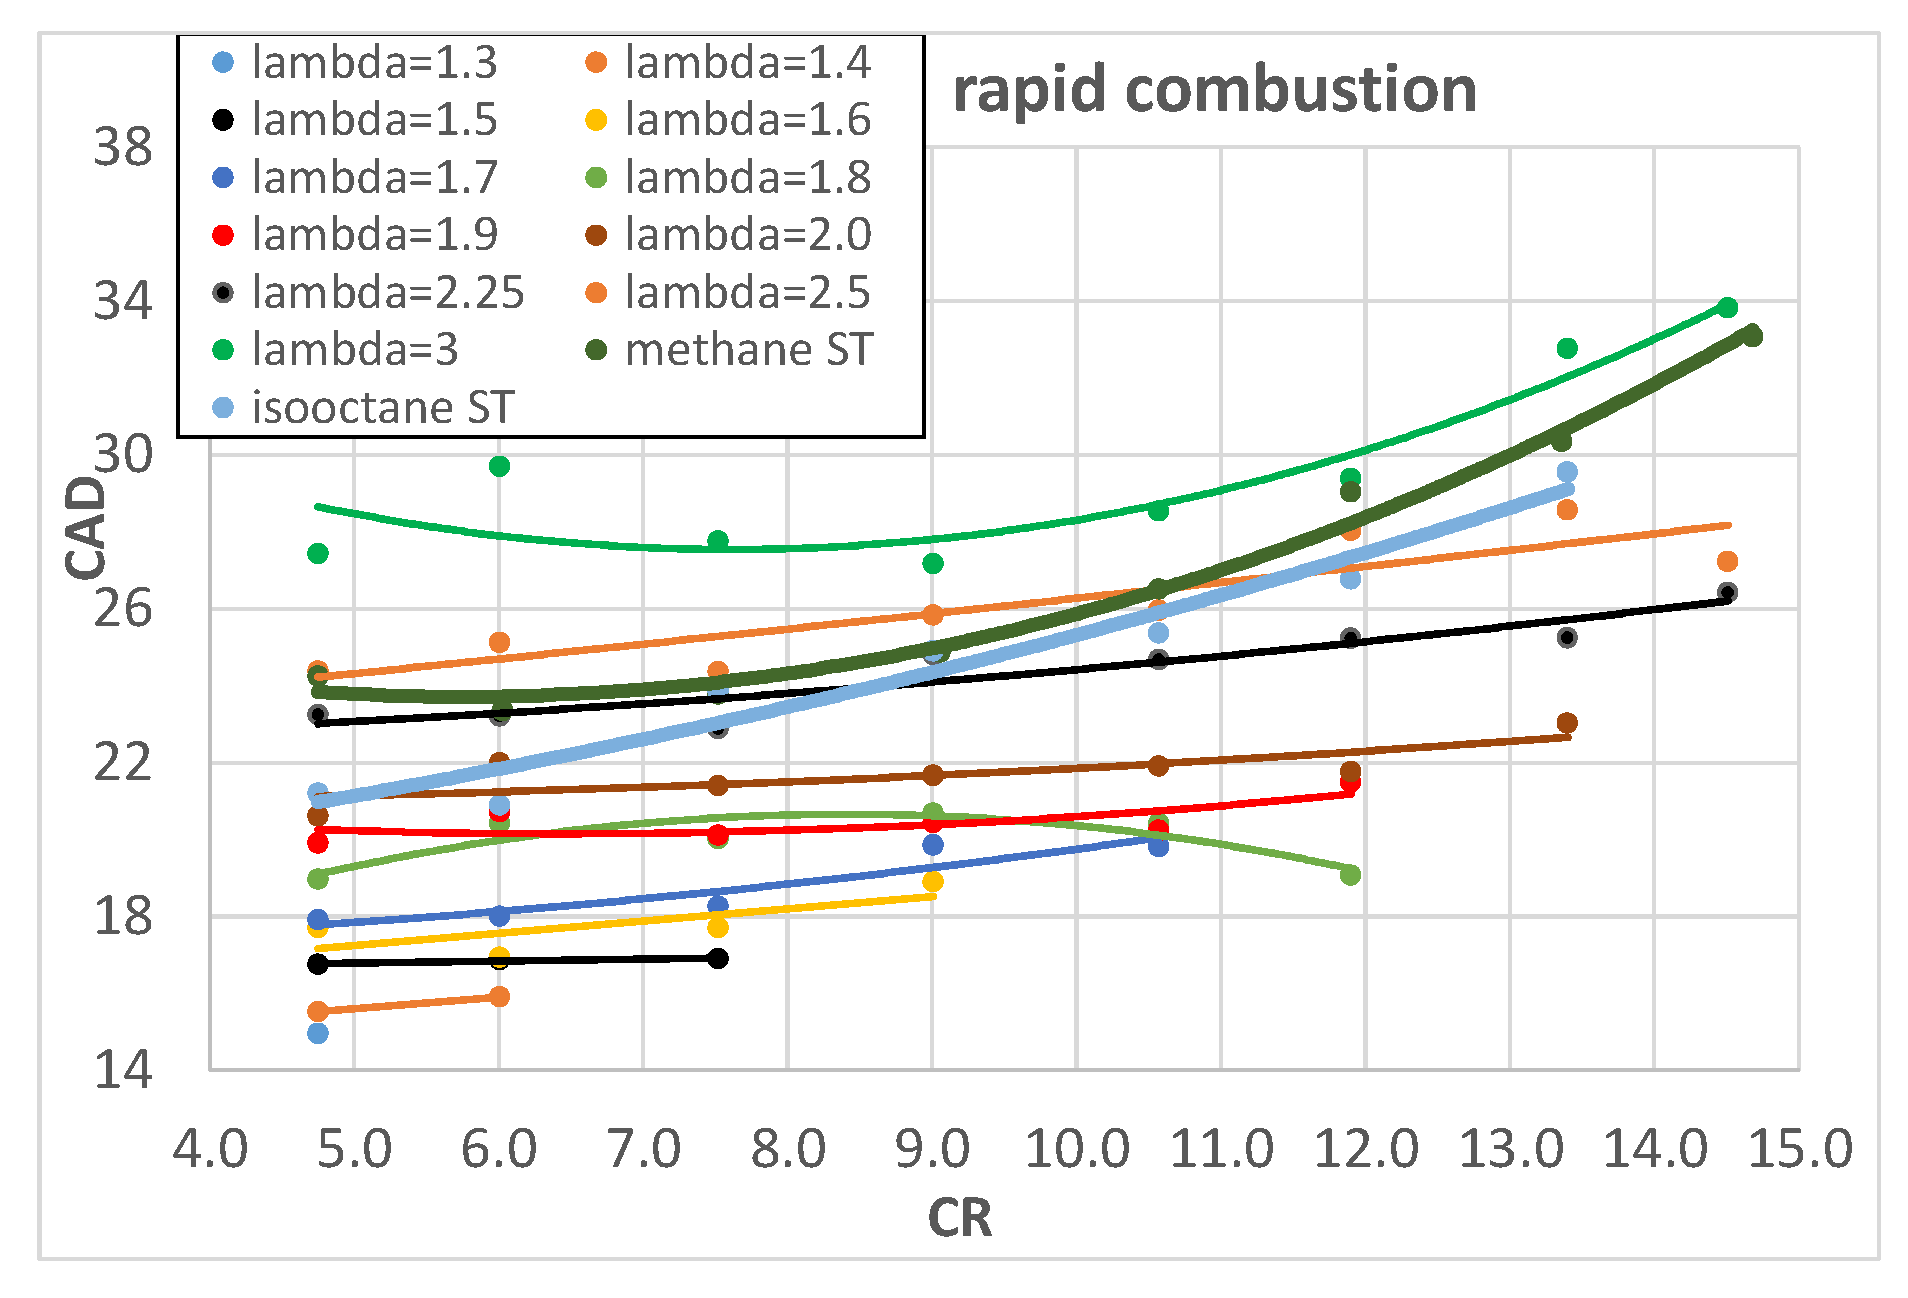
Figure 5 and
Figure 6 show the influence of CR on the combustion start and rapid combustion phase of hydrogen, expressed in CAD, with fixed values of λ; there is also a comparison with methane and isooctane stoichiometric (ST) mixtures.
An increase in CR brings higher pressure and temperature and this increases the laminar flame speed [
11] and in turn reduces the combustion start duration. The rapid combustion phase, on the contrary, is slightly influenced by CR; it is almost constant for lower values of λ and it slightly increases for higher λ values. This could be explained by two opposite effects: on the one hand, the increased CR tends to increase the combustion pressure and temperature which would increase the laminar flame speed and in turn the combustion speed but, on the other hand, the increased CR forces a reduction in the SA, as reported in
Table 4, to avoid knocking; this tends to reduce the pressure and temperature during combustion. The two effects most likely compensate each other, producing an almost constant rapid combustion duration. The above-mentioned results confirm and widely integrate the preliminary results found from the same authors in [
17]. The comparison with methane and isooctane is very interesting because the higher combustion speed of hydrogen mixtures is quite evident, in particular in the early stage of combustion and for lower values of λ; when λ reaches values around 2.2–2.5, the combustion speed of hydrogen is almost equal to that of both methane and isooctane stoichiometric mixtures. This is in agreement with the higher laminar flame speed of hydrogen with respect to methane and isooctane [
11]. The shorter combustion duration of hydrogen, with respect to conventional fuels, tends to increase engine efficiency because it brings it closer to isochoric conditions.
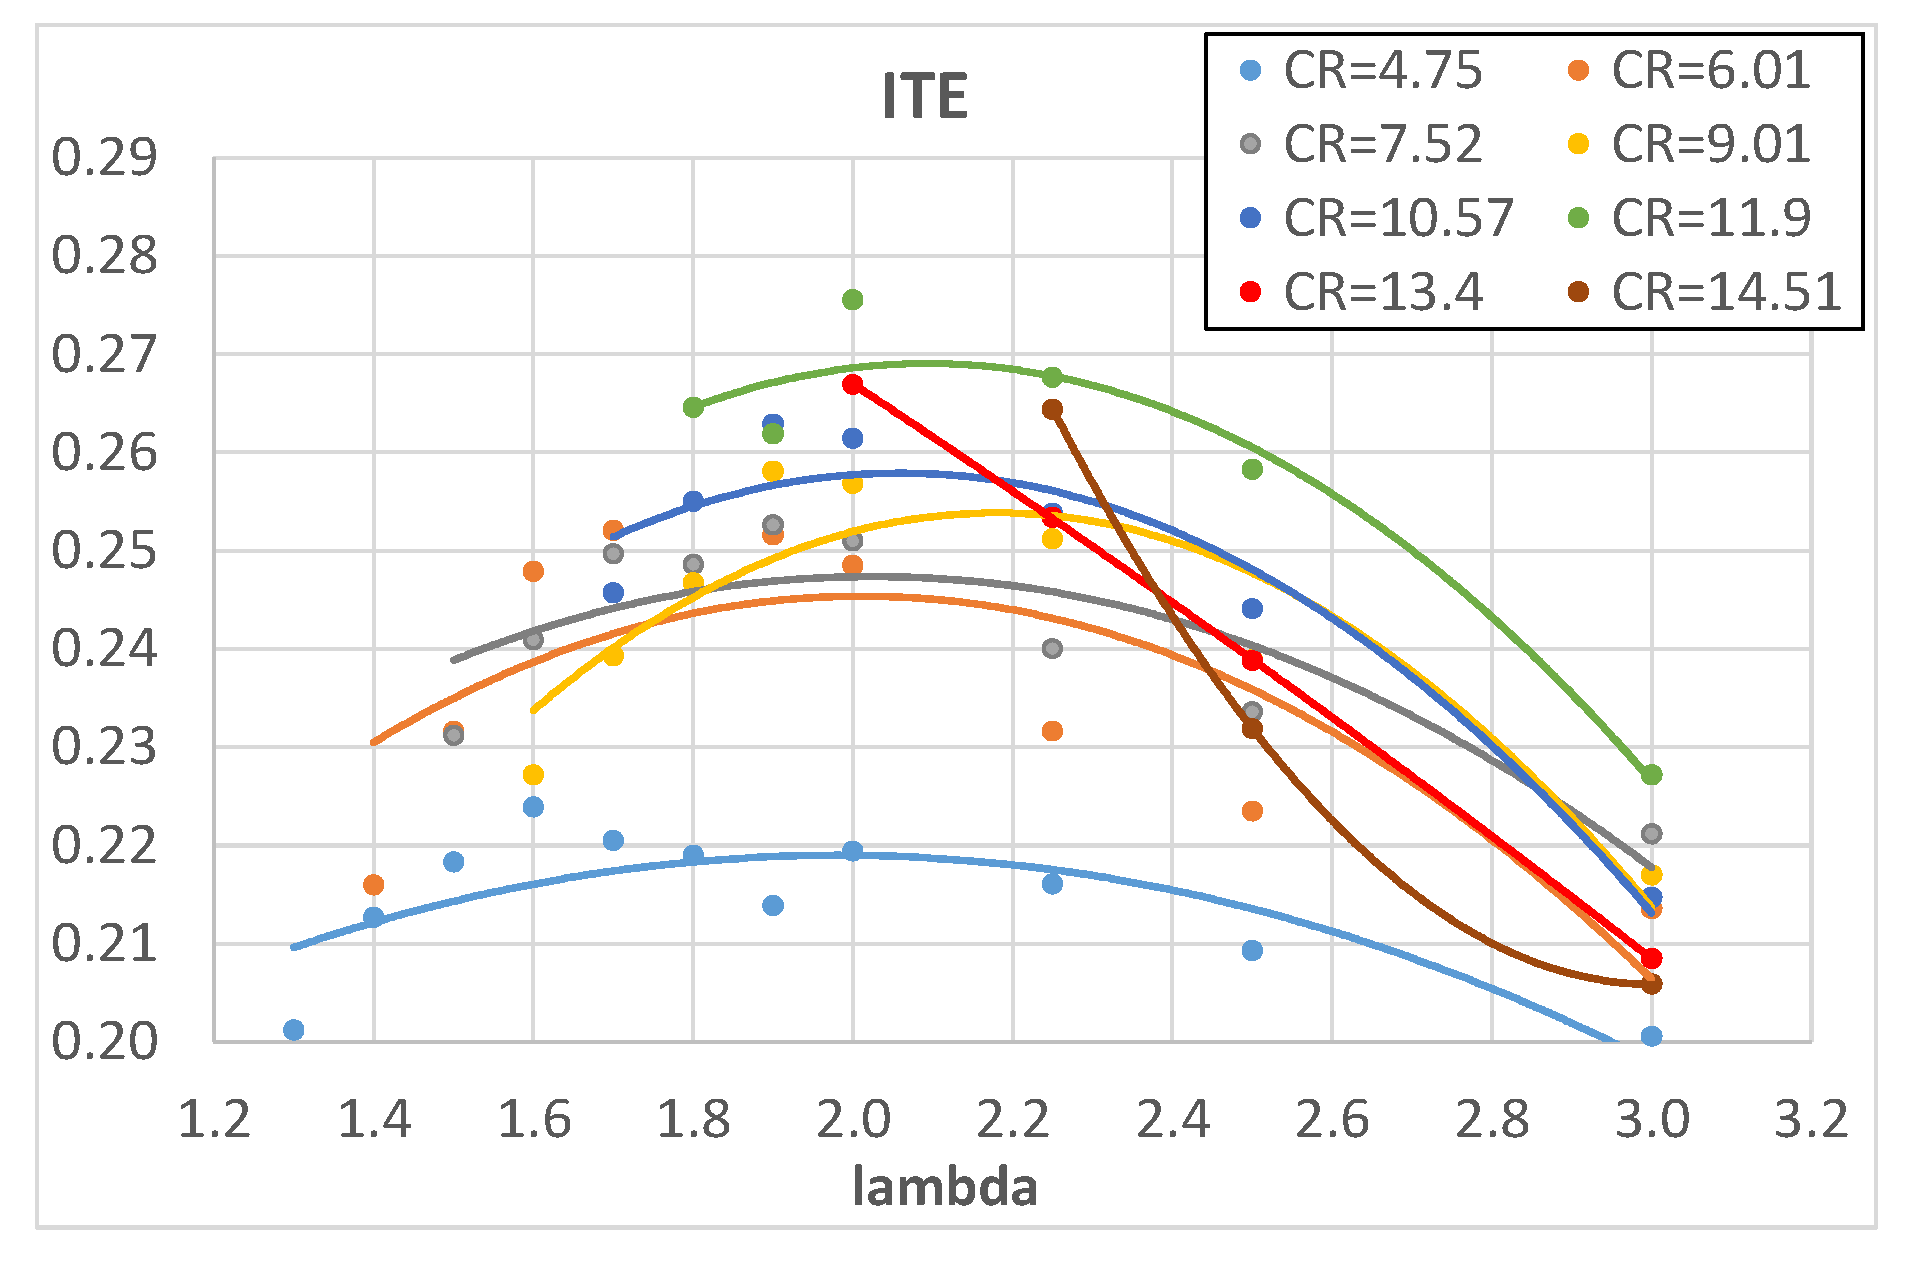
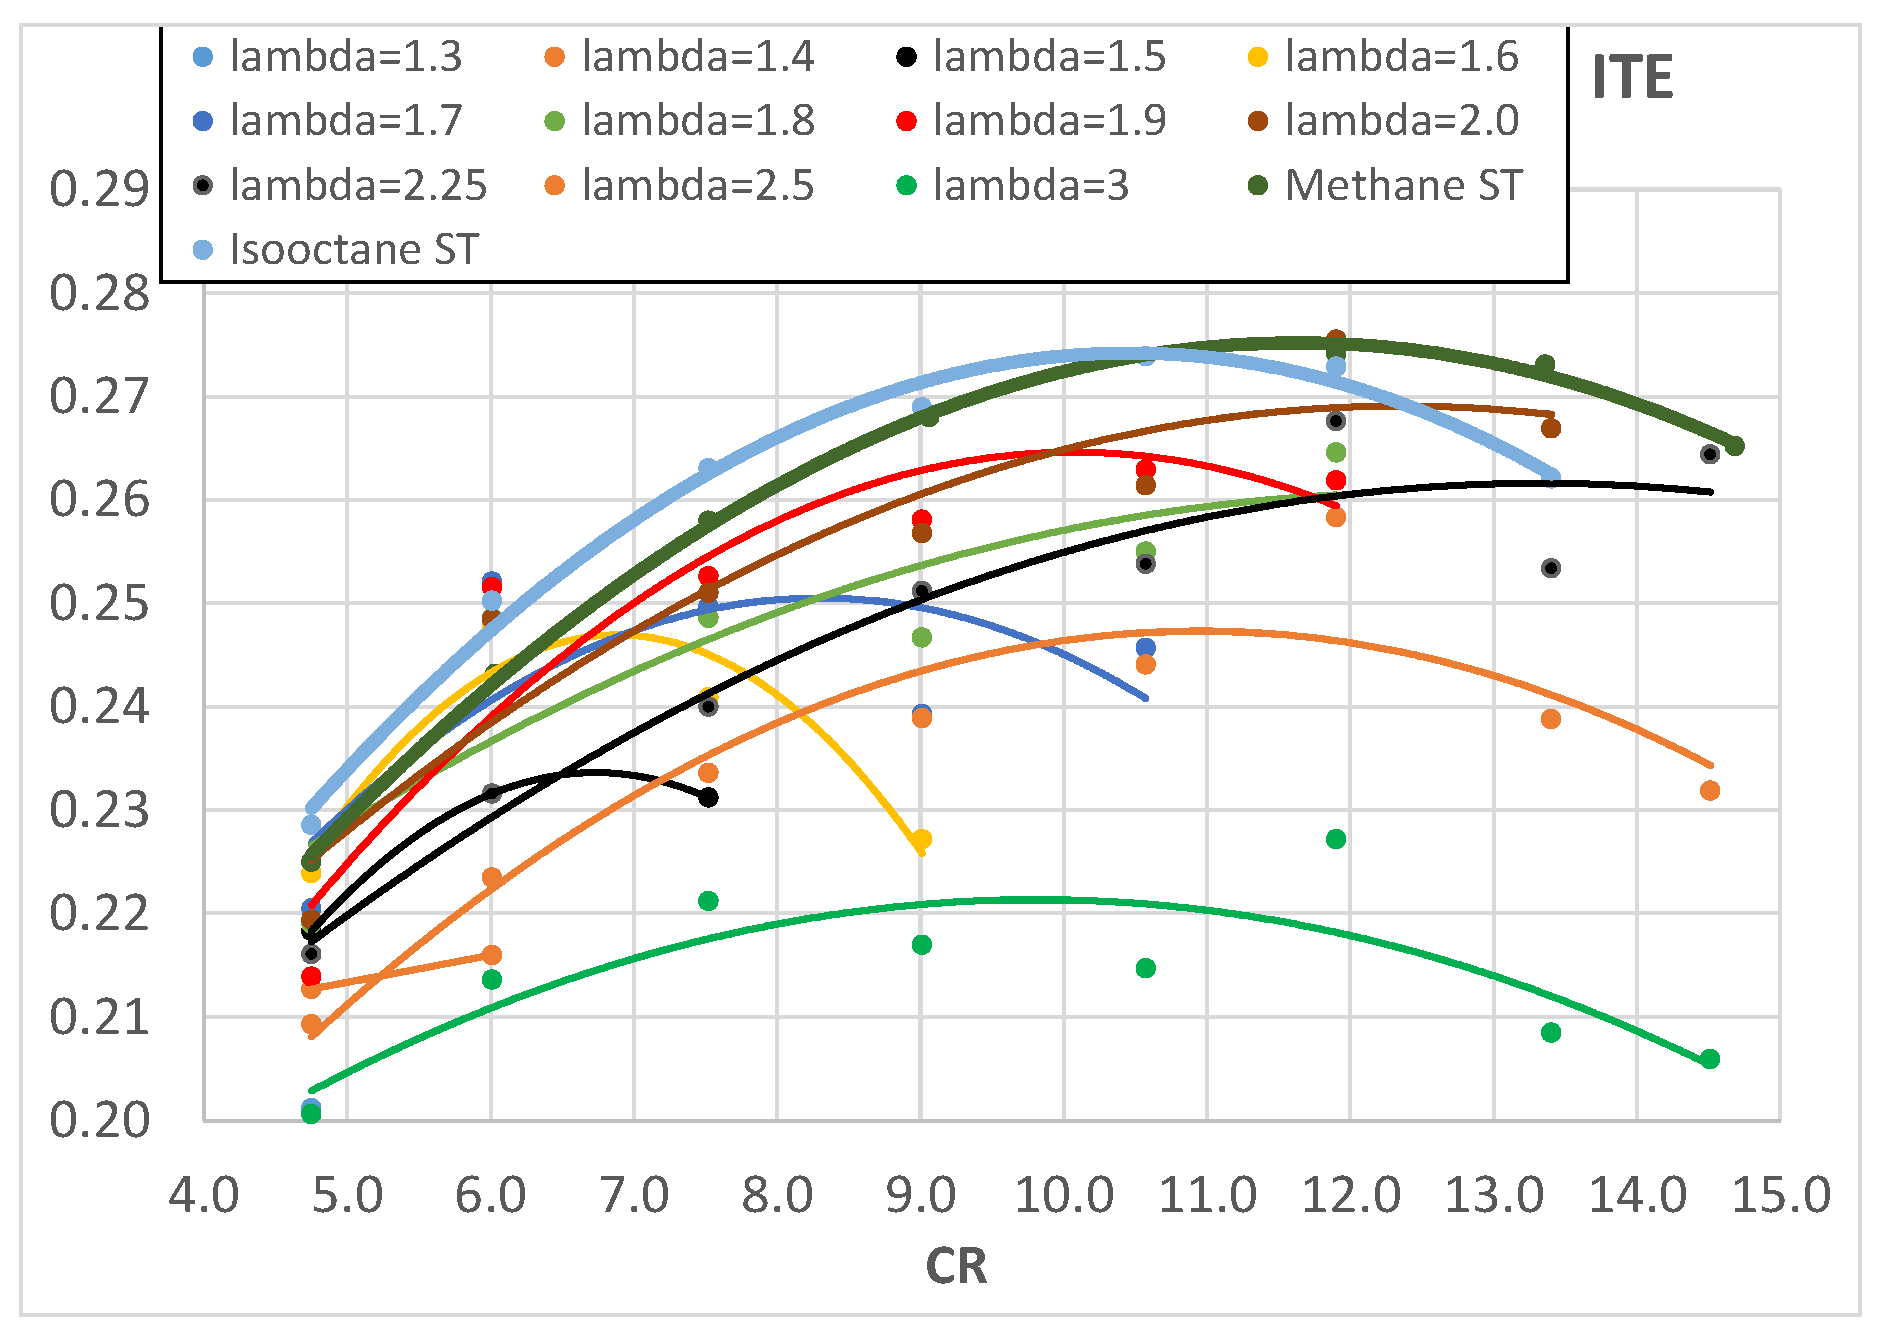
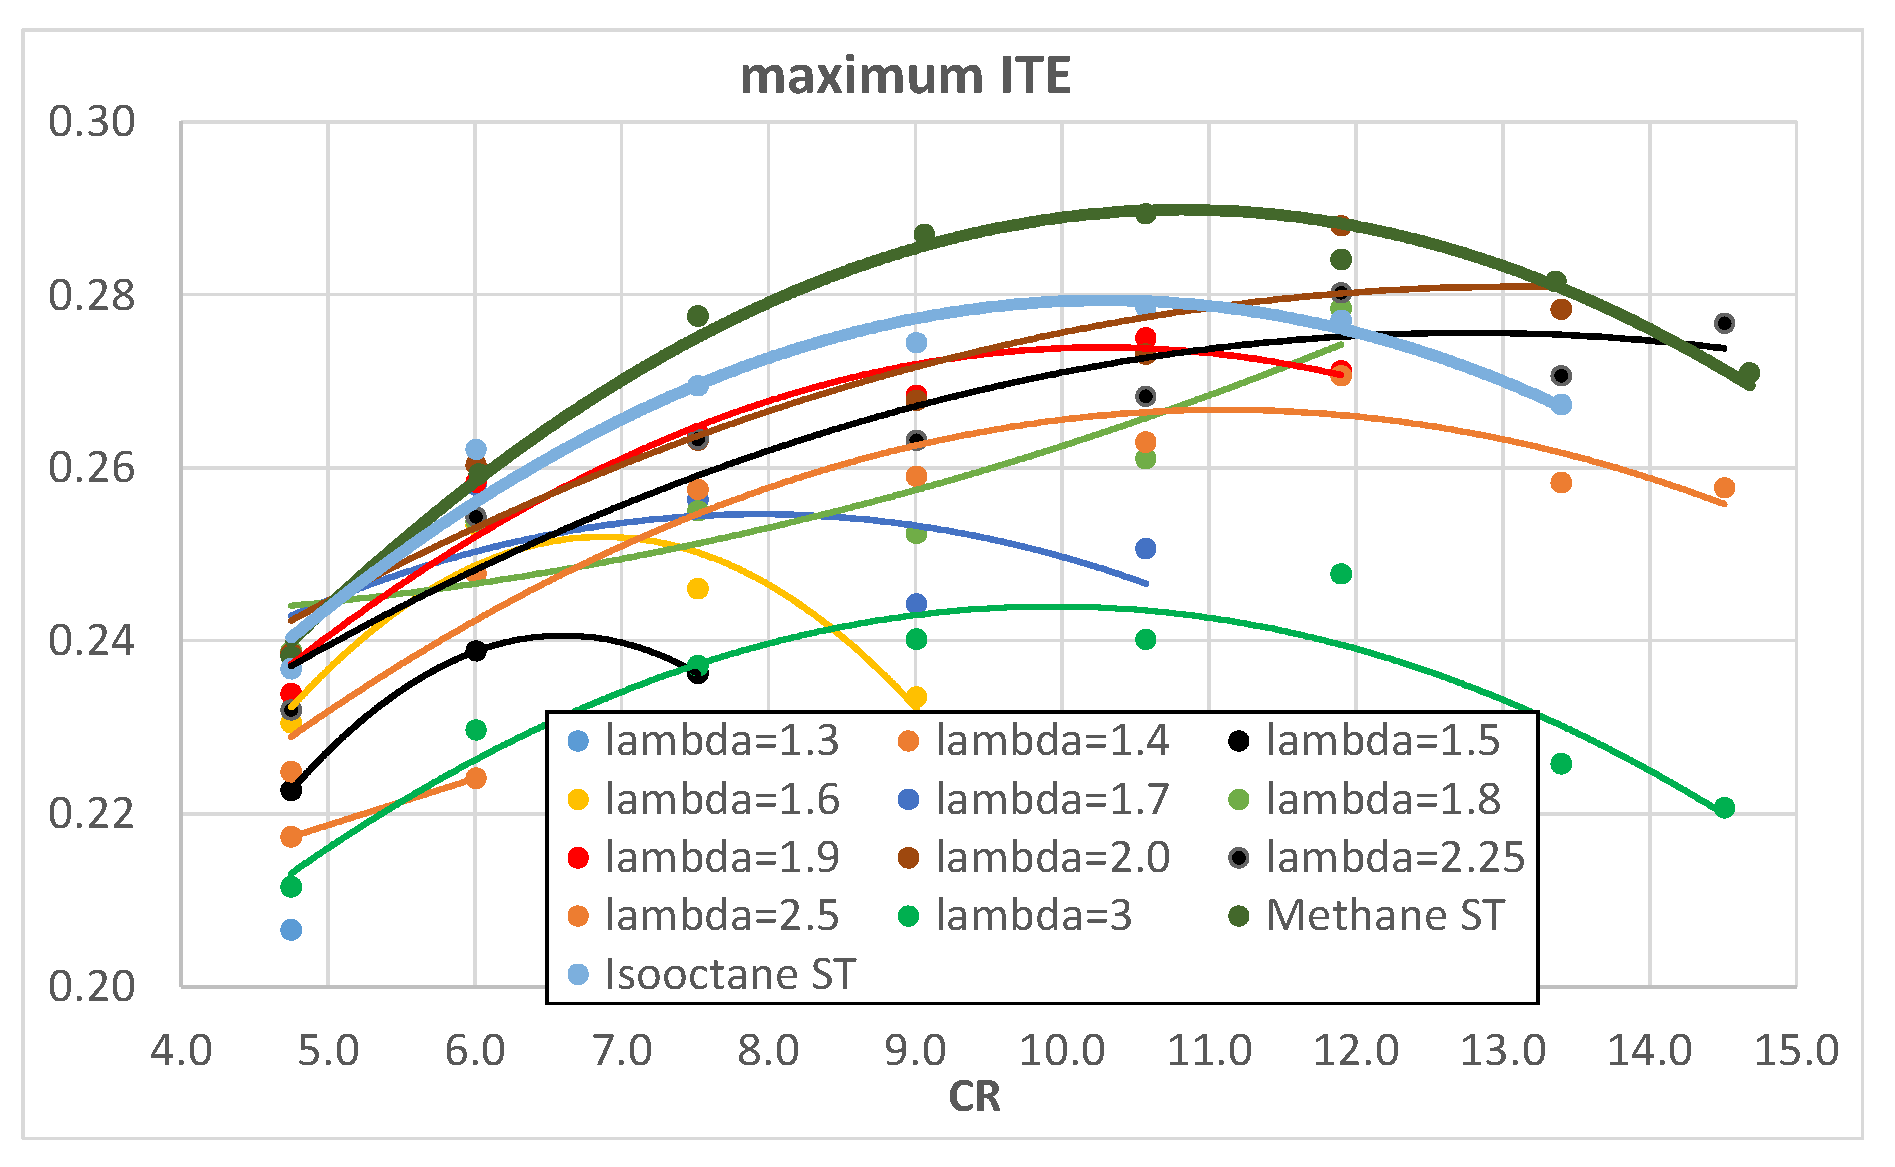
Figure 7 shows the experimentally measured engine ITE as a function of λ and
Figure 8 as a function of engine CR: the higher values of engine ITE, when fueled with hydrogen, can be found for λ around 2 and for CR between 10 and 13; the best engine ITE, when fueled with hydrogen, is found for λ = 2 and CR = 11.9 (
Figure 7) and is almost the same of the best engine ITE when fueled with methane and isooctane (
Figure 8).
Apart from the best comparison of values,
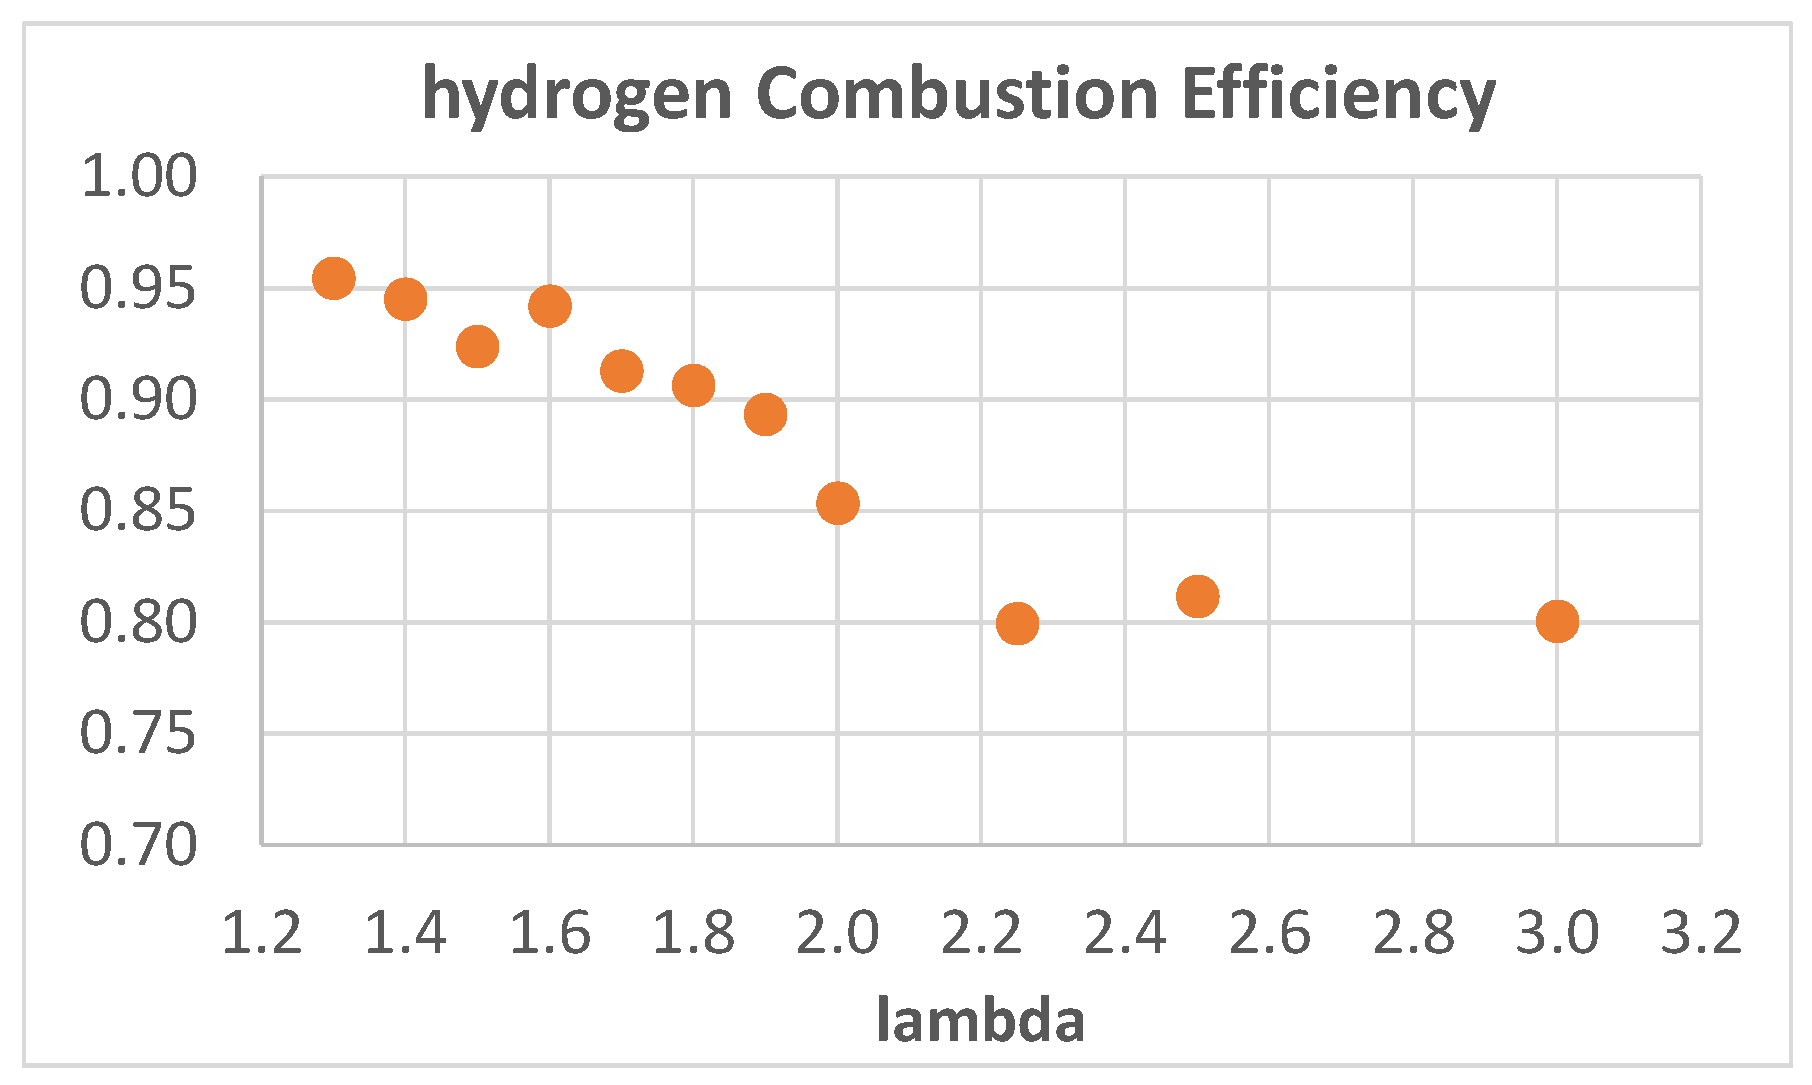
Figure 8 shows that the higher ITE values obtained with hydrogen are a bit lower than those obtained with both methane and isooctane; this is probably due to higher heat loss and/or lower combustion efficiency and lower combustion temperatures (due to the higher air excess). The measured oxygen content in the exhaust emissions was used to evaluate the combustion efficiency and the results, referring to hydrogen combustion, are shown in
Figure 9, where CE is plotted as a function of λ.
As expected, the CE decreases with increasing λ. From λ = 1.3 to λ = 1.9, the trend is almost linear with a small negative slope; for 1.9 < λ < 2.25, the trend is also linear, but with a greater negative slope, while for λ > 2.25 the CE is almost constant around a value of 0.8.
To limit the negative effect of λ on CE, it would be useful to increase turbulence, which is known to positively influence combustion speed and efficiency; the CFR engine has a fixed rotating speed of 900 rpm and a discoid shape combustion chamber, both of which do not promote turbulence.
Concerning the methane and isooctane stoichiometric mixtures, the CE was 0.92 and 0.97, respectively, and almost unaffected by engine CR. Also, hydrogen CE was almost unaffected by engine CR.
As described in a previous section, all of the acquired experimental data were used as inputs for a numerical simulation that, once calibrated with the proper values of the Woschni model
C3 constant, was able to give the same values of IMEP and ITE as outputs, experimentally determined under the operating conditions of
Table 4. This procedure allowed quantifying the heat losses to combustion chamber walls and then the HLE.
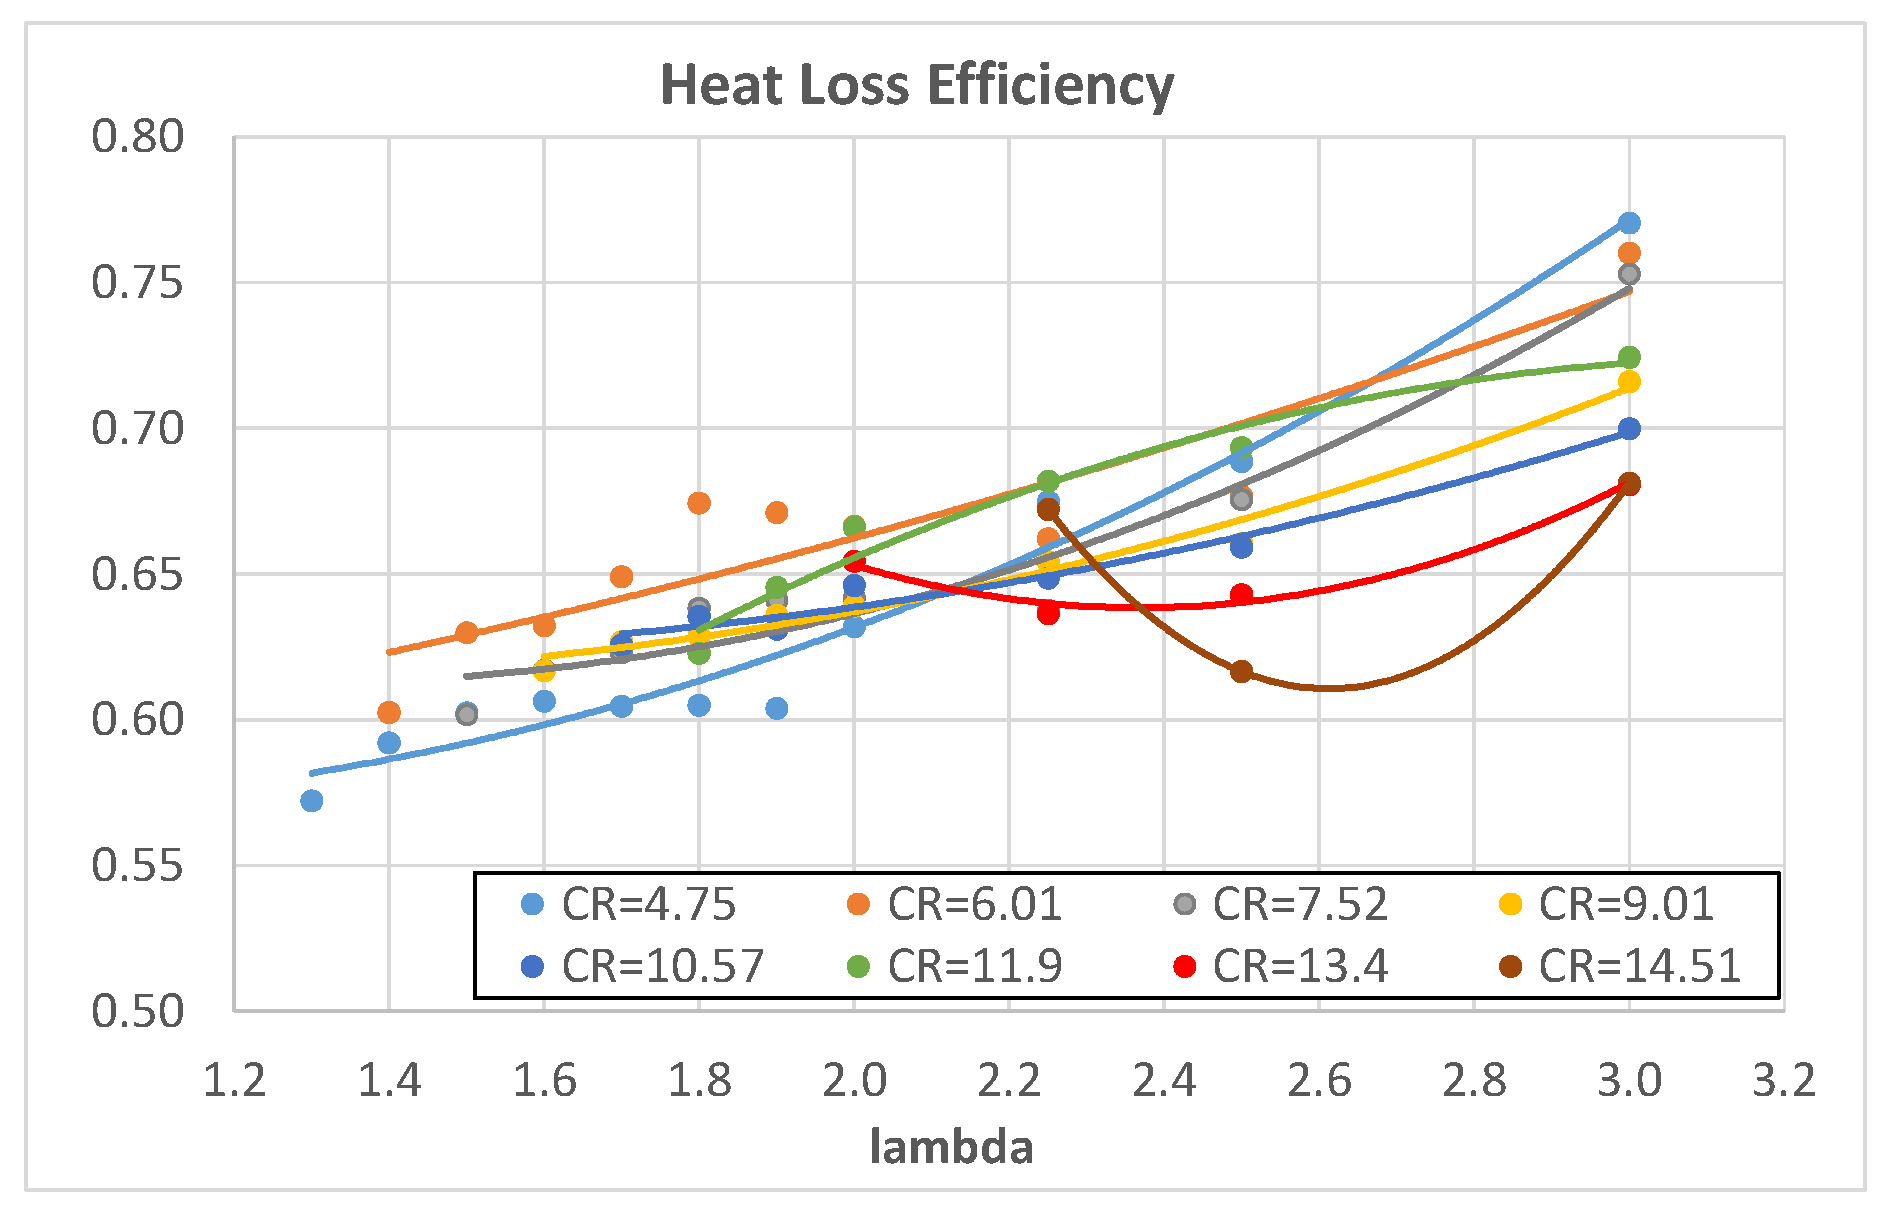
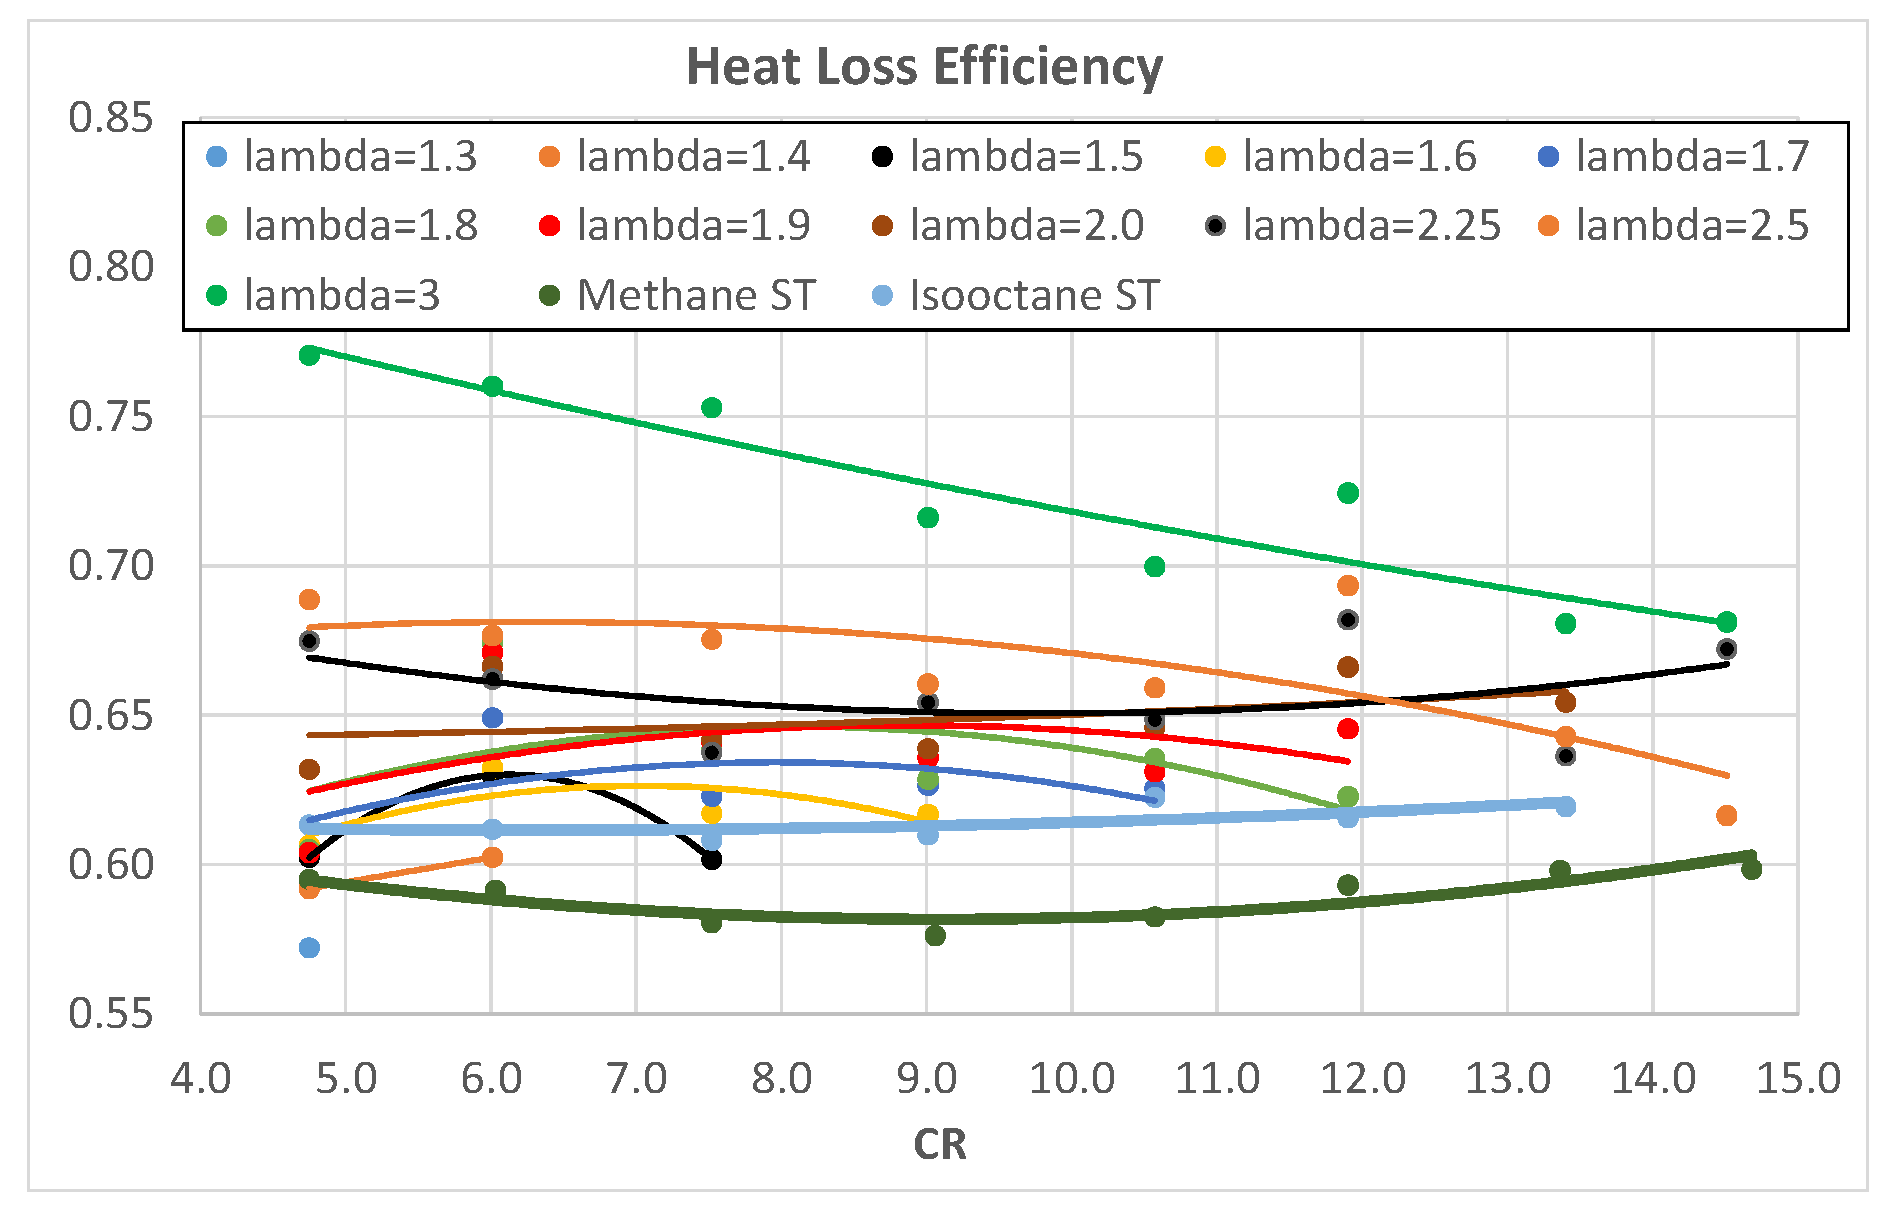
Figure 10 and
Figure 11 show the HLE of a hydrogen-fueled engine as a function of λ and CR, respectively. The excess air ratio seems to positively influence HLE as it almost linearly increases with λ, while CR barely affects HLE, except for λ = 3, where increasing CR brings a reduction in HLE. The increase in λ produces a slower combustion (
Figure 3 and
Figure 4) that is known to increase the minimum quenching distance [
4,
11]; this effect, together with lower combustion temperatures, produces higher HLE.
Hydrogen mixtures, with λ > 1.5, exhibit a higher HLE with respect to methane and isooctane. Isooctane shows a higher HLE than methane.
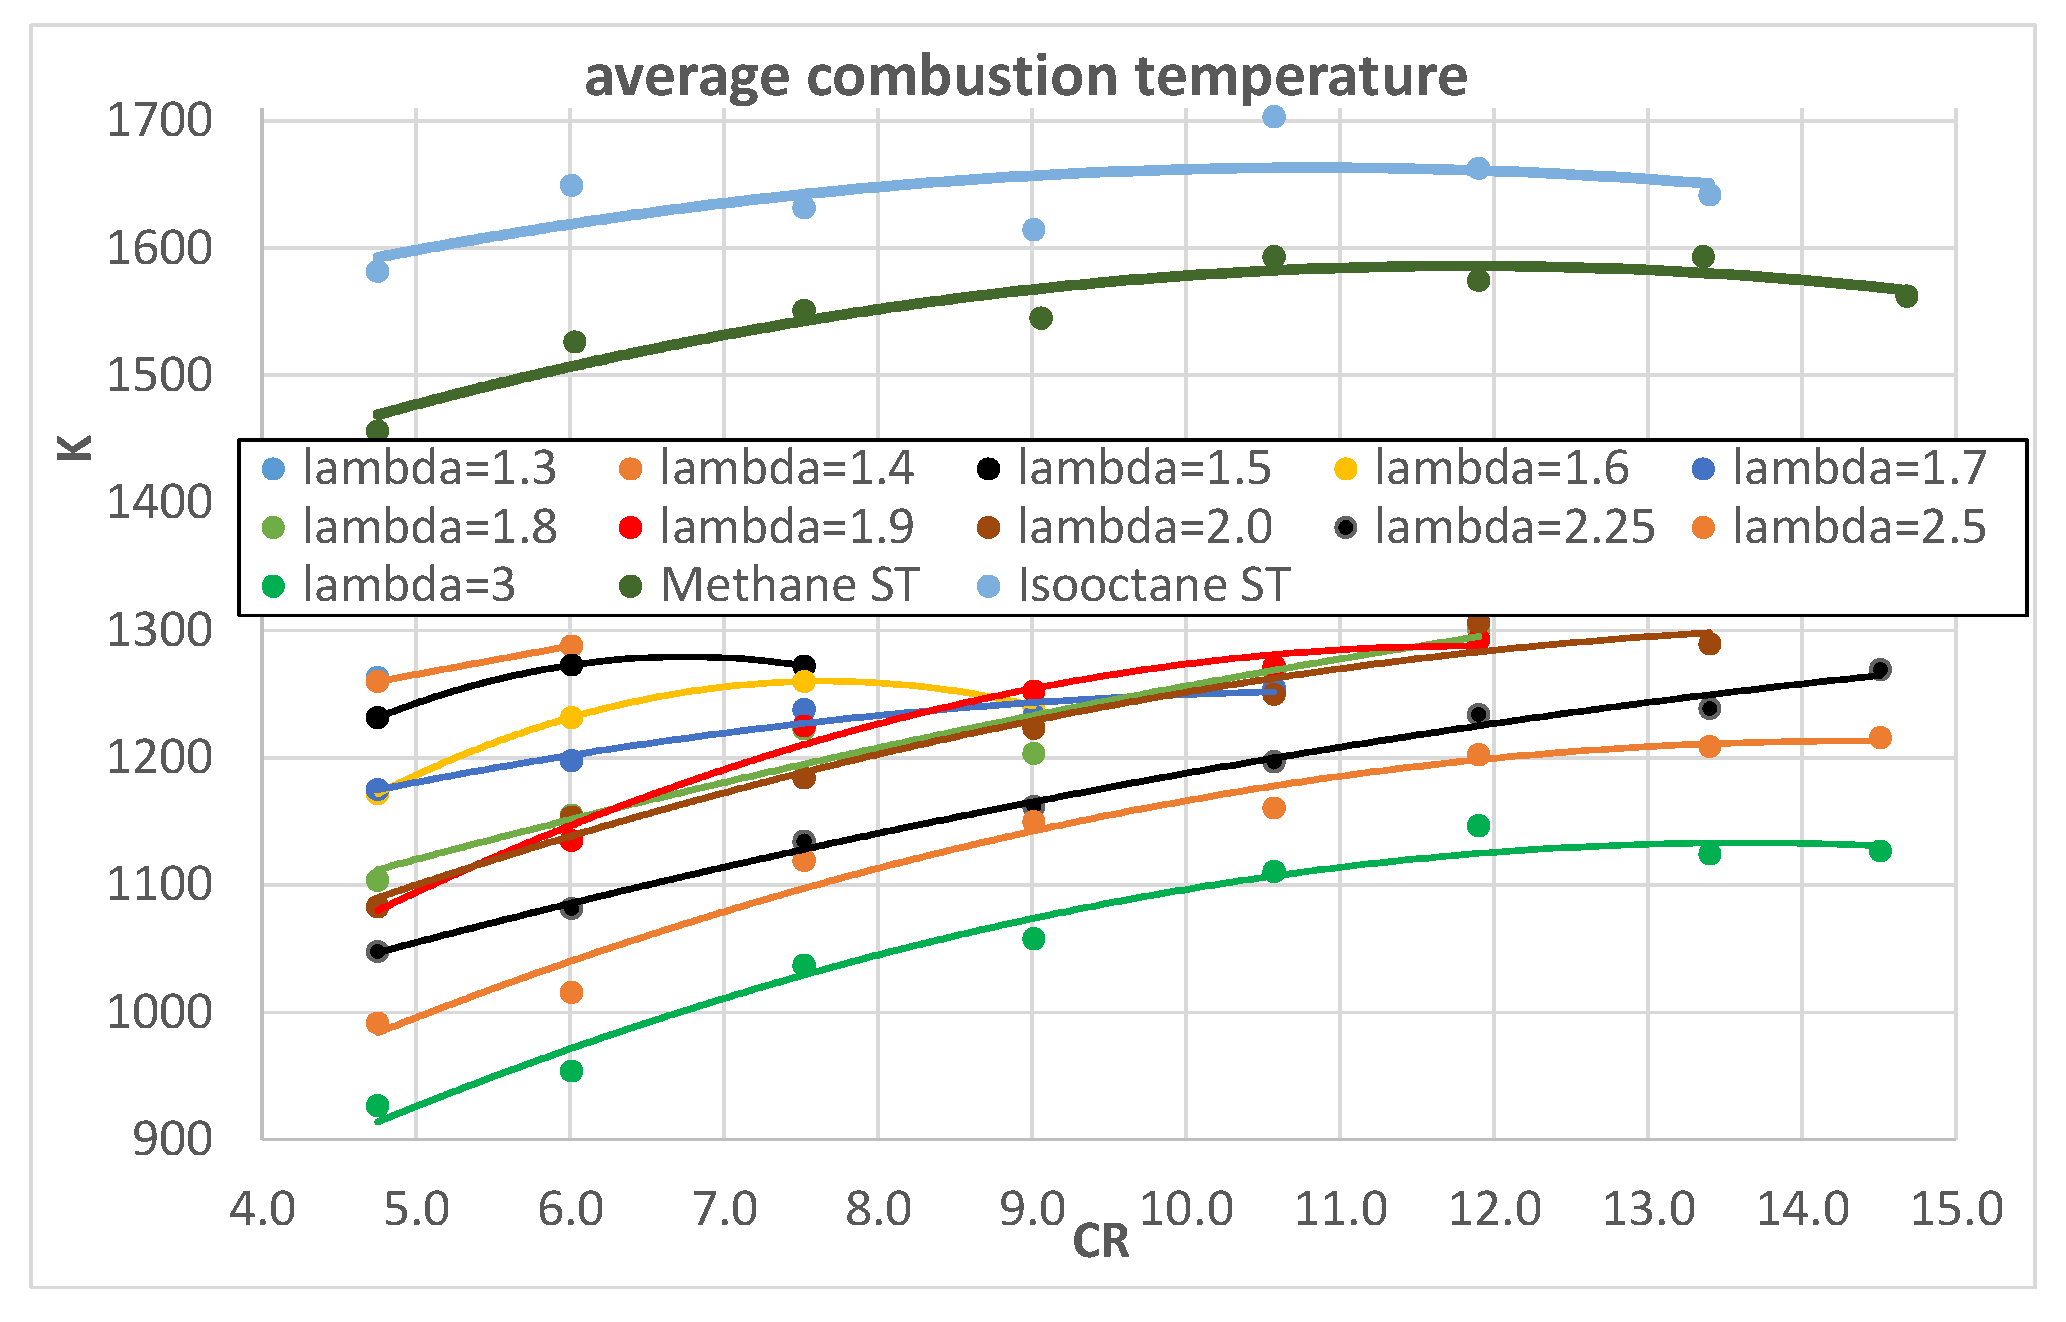
In order to give further evidence of the effects of λ and engine CR on heat exchanges,
Figure 12 and
Figure 13 show the average combustion temperatures, obtained from the 0-D thermodynamic model, as a function of λ and CR, respectively.
When λ increases, the temperatures significantly decrease as a consequence of the lower amount of heat generated by the combustion.
When engine CR increases, the average combustion temperature increases because of the higher temperature at the end of the compression stroke that corresponds to the start of the combustion phase. The increasing effect is higher for hydrogen compared to methane and isooctane.
In order to perform a more comprehensive analysis of HLE, the calibrated numerical model was used to simulate, for each λ and CR of
Table 4, the maximum IMEP (i.e., maximum ITE) operating conditions by changing the SA and then the combustion phase. In this way, the three fuels can be compared in a sort of “reference” condition. This also means that the first-try SA values of
Table 4 were not exactly the best ITE ones, as initially expected by setting the LPP at 15 CAD ATDC.
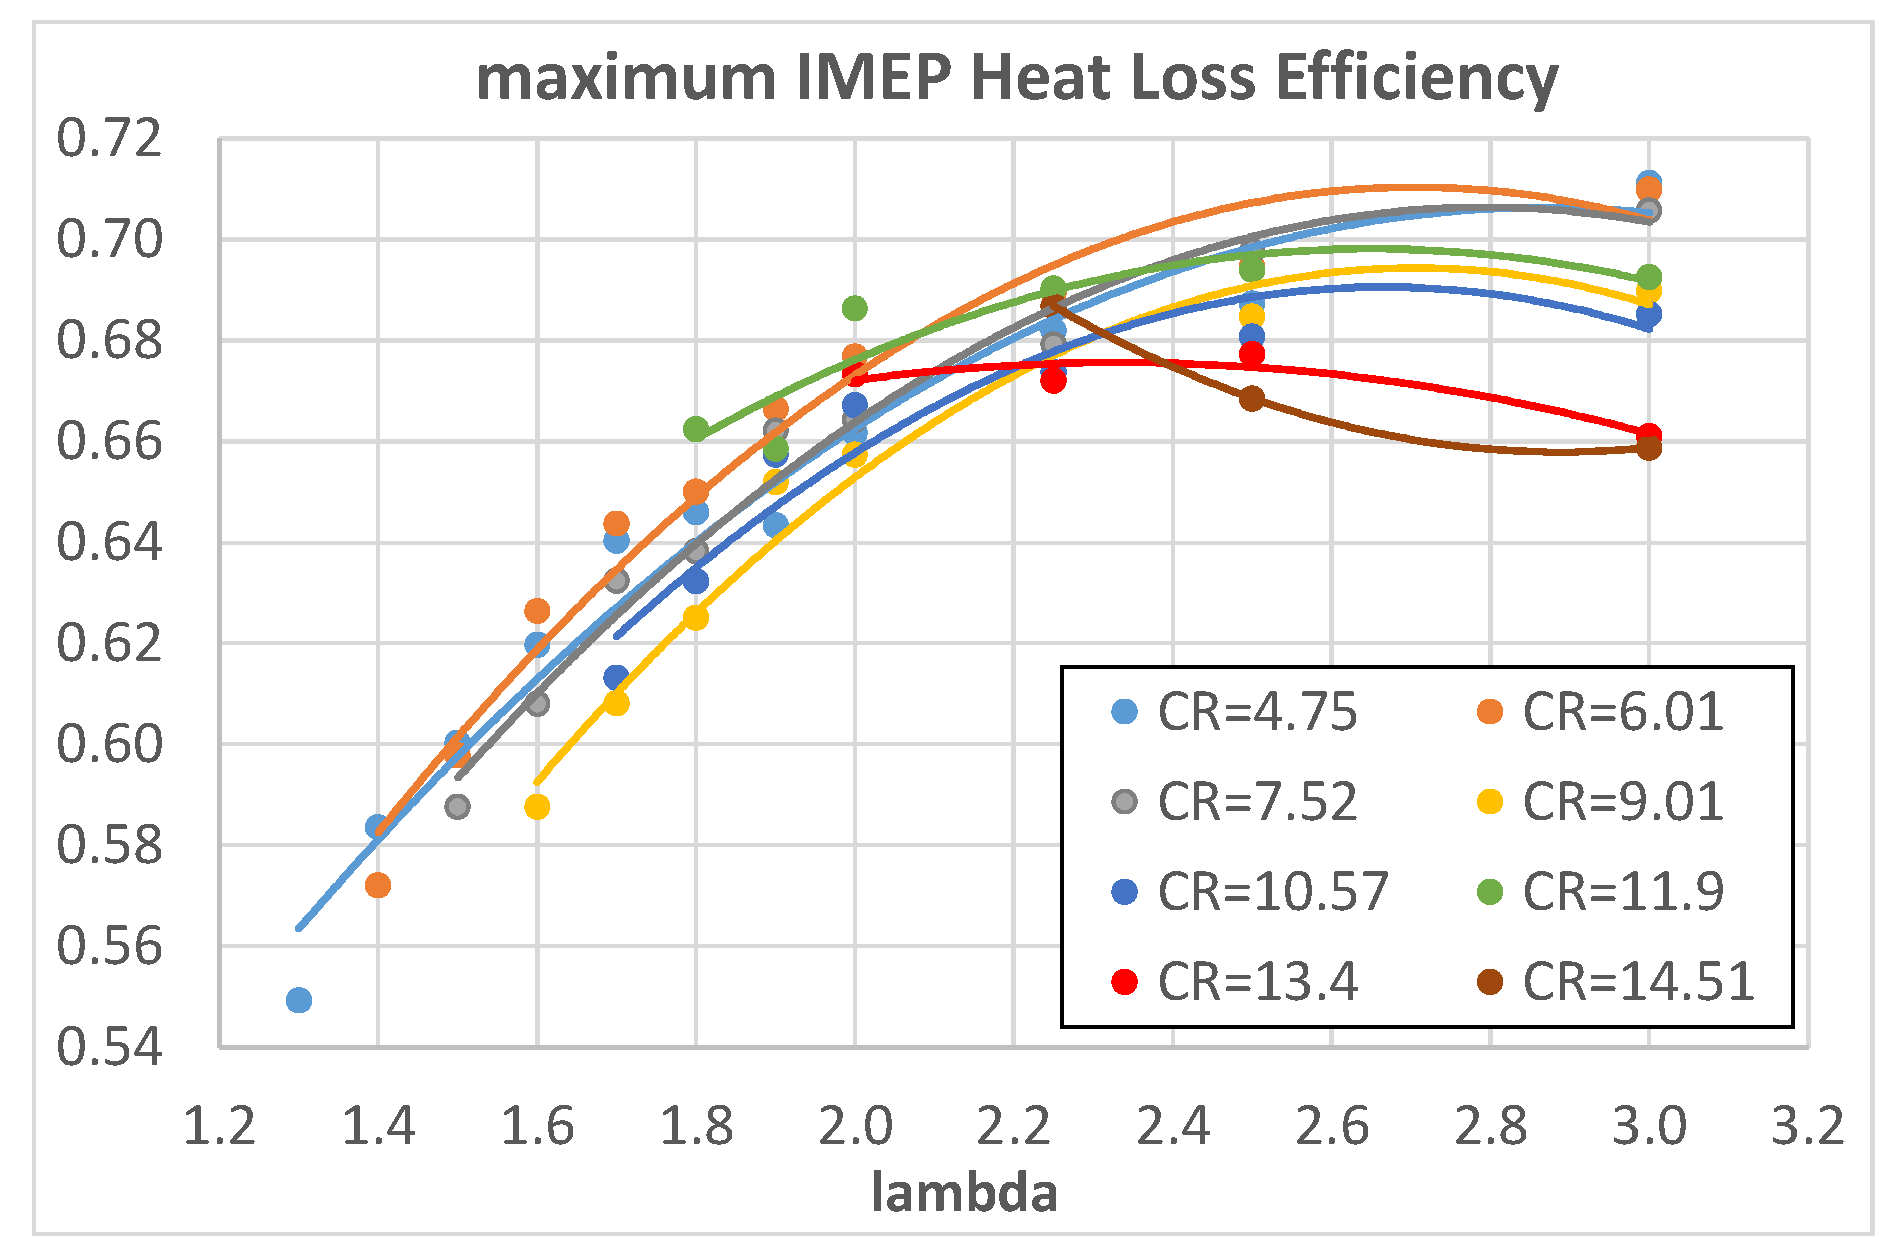
Figure 14 and
Figure 15 show the maximum IMEP (maximum ITE) HLE as a function of λ and CR, respectively.
Once again, HLE increases with λ, which means decreasing heat exchanges, but with respect to
Figure 10, the trend reaches a plateau for λ > 2.25; the increasing trend can be explained, on the one hand, with lower combustion temperatures and, on the other hand, with a reduced effect of the thin thermal boundary layer of the hydrogen–air mixture as already highlighted before. The difference here is the plateau for λ > 2.25, absent in
Figure 10; this underlines the importance of evaluating the HLE in a reference condition of maximum ITE that eliminates the overlapping effect of different combustion phasing. From the analysis of
Figure 15, some considerations can be drawn: in maximum ITE operating conditions, methane has the same or higher HLE than isooctane, reversing the situation of
Figure 11; from λ > 1.9, hydrogen mixtures exhibit higher HLE than both methane and isooctane. This last evidence, together with the analysis of
Figure 9 where λ = 1.9, exhibits quite a good CE of 0.9, helping to draw the conclusion that the maximum ITE is obtained for hydrogen fuel with 1.9 < λ < 2, as confirmed by
Figure 7.
Figure 16 and
Figure 17 show the simulated engine ITE as a function of λ and CR, respectively, obtained in the maximum IMEP operating conditions. The results almost confirm the ones displayed in
Figure 7 and
Figure 8: the maximum ITE is obtained with λ = 2 and CR = 11.9 because this operating condition produces the best compromise between a not-so-bad CE and an already-good HLE. Once again, the best ITE obtained with hydrogen is similar to that obtained with isooctane but is lower than that obtained with methane; this can be explained with a greater effect of the optimized spark advances on methane with respect to the other fuels.
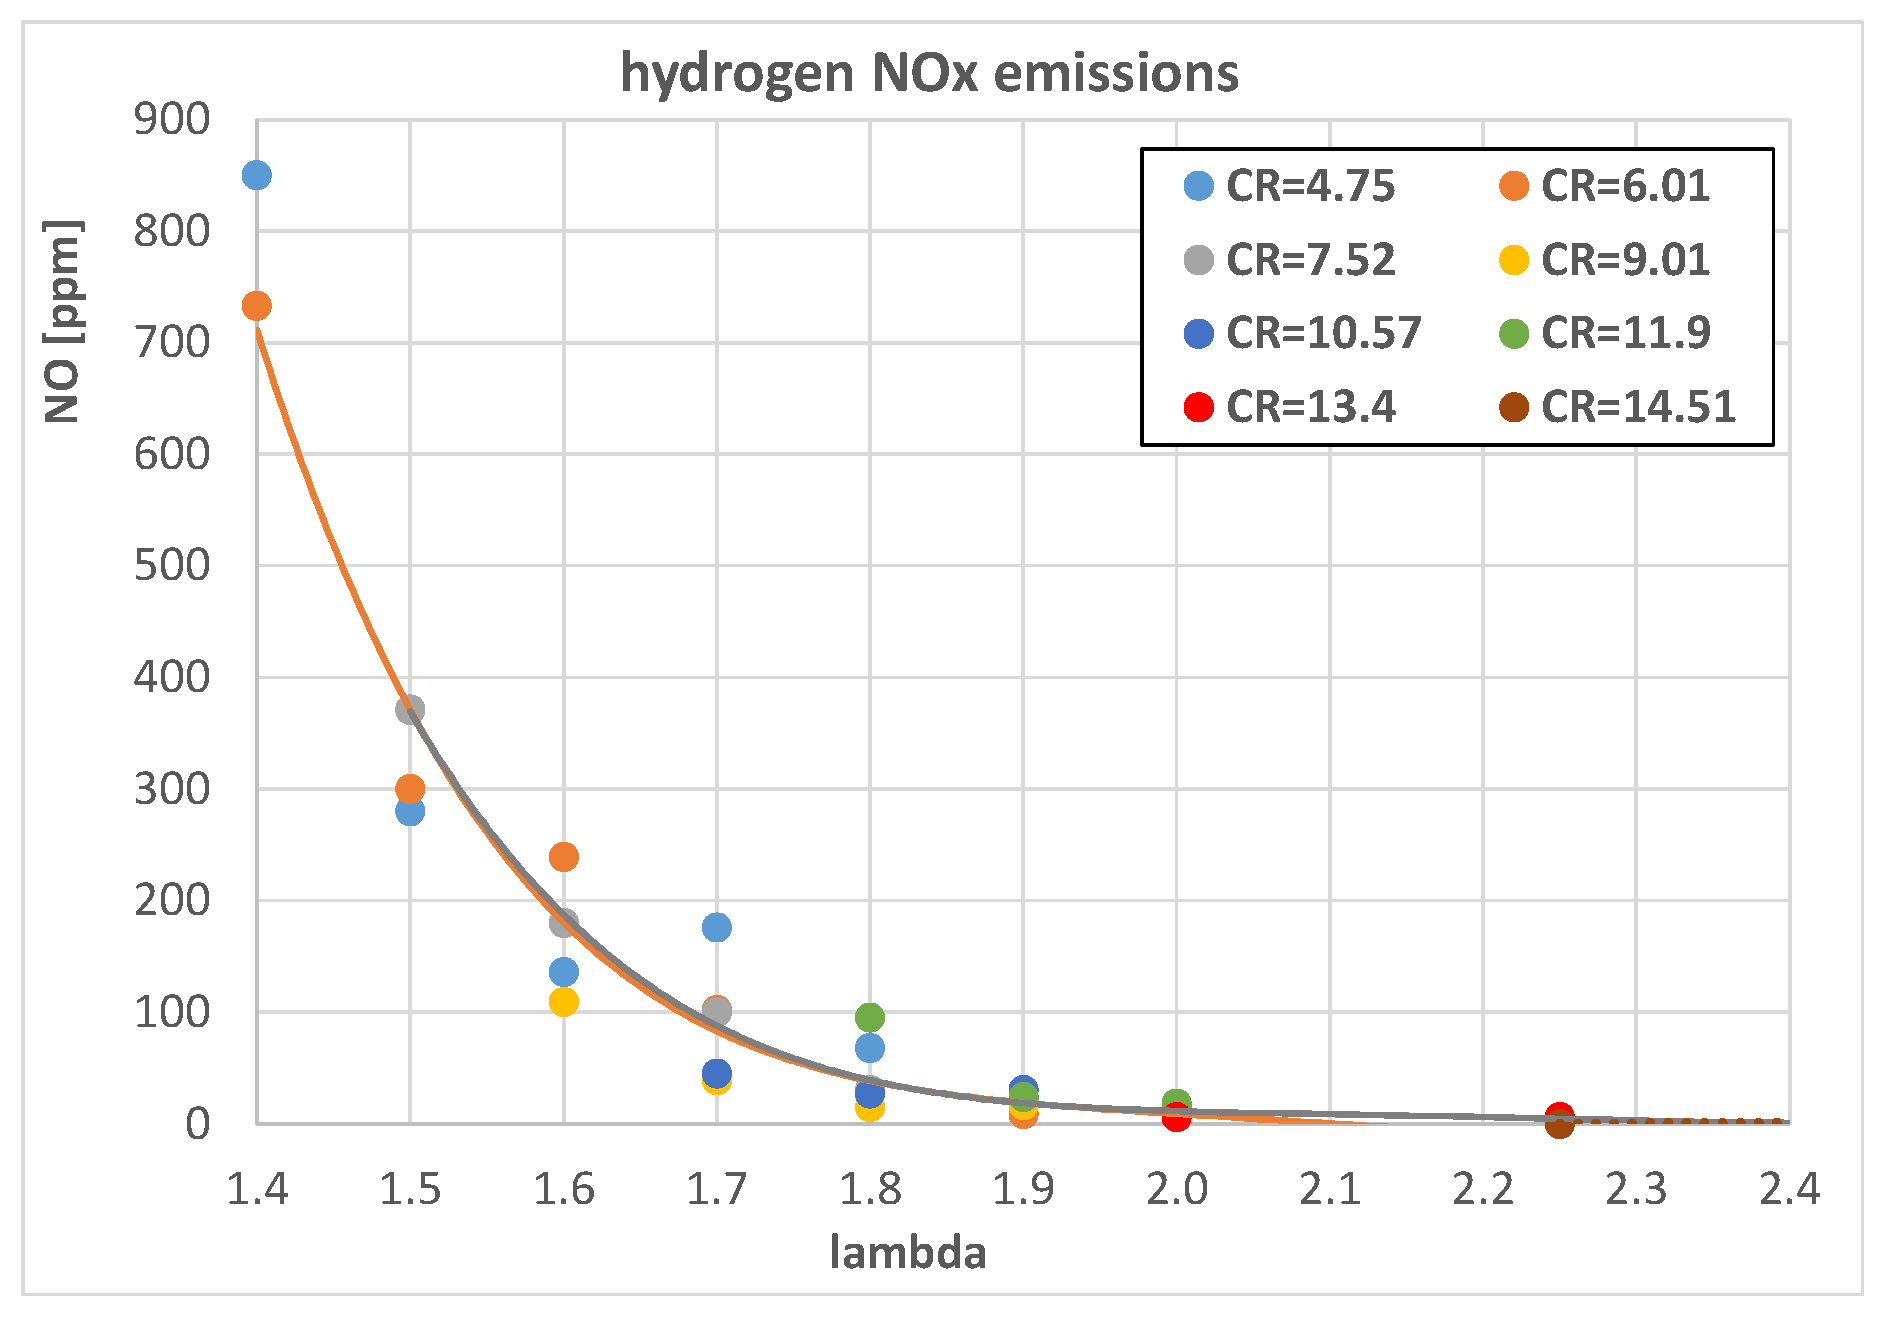
From an engine efficiency point of view, the best hydrogen A/F mixture is λ = 2 (
Figure 16), but this remains the best choice also considering the engine pollutant emissions.
Figure 18 shows the measured NOx emissions of a CFR engine when fueled with different hydrogen A/F mixtures; it is evident that for λ > 1.9, the emissions level drops around negligible values.
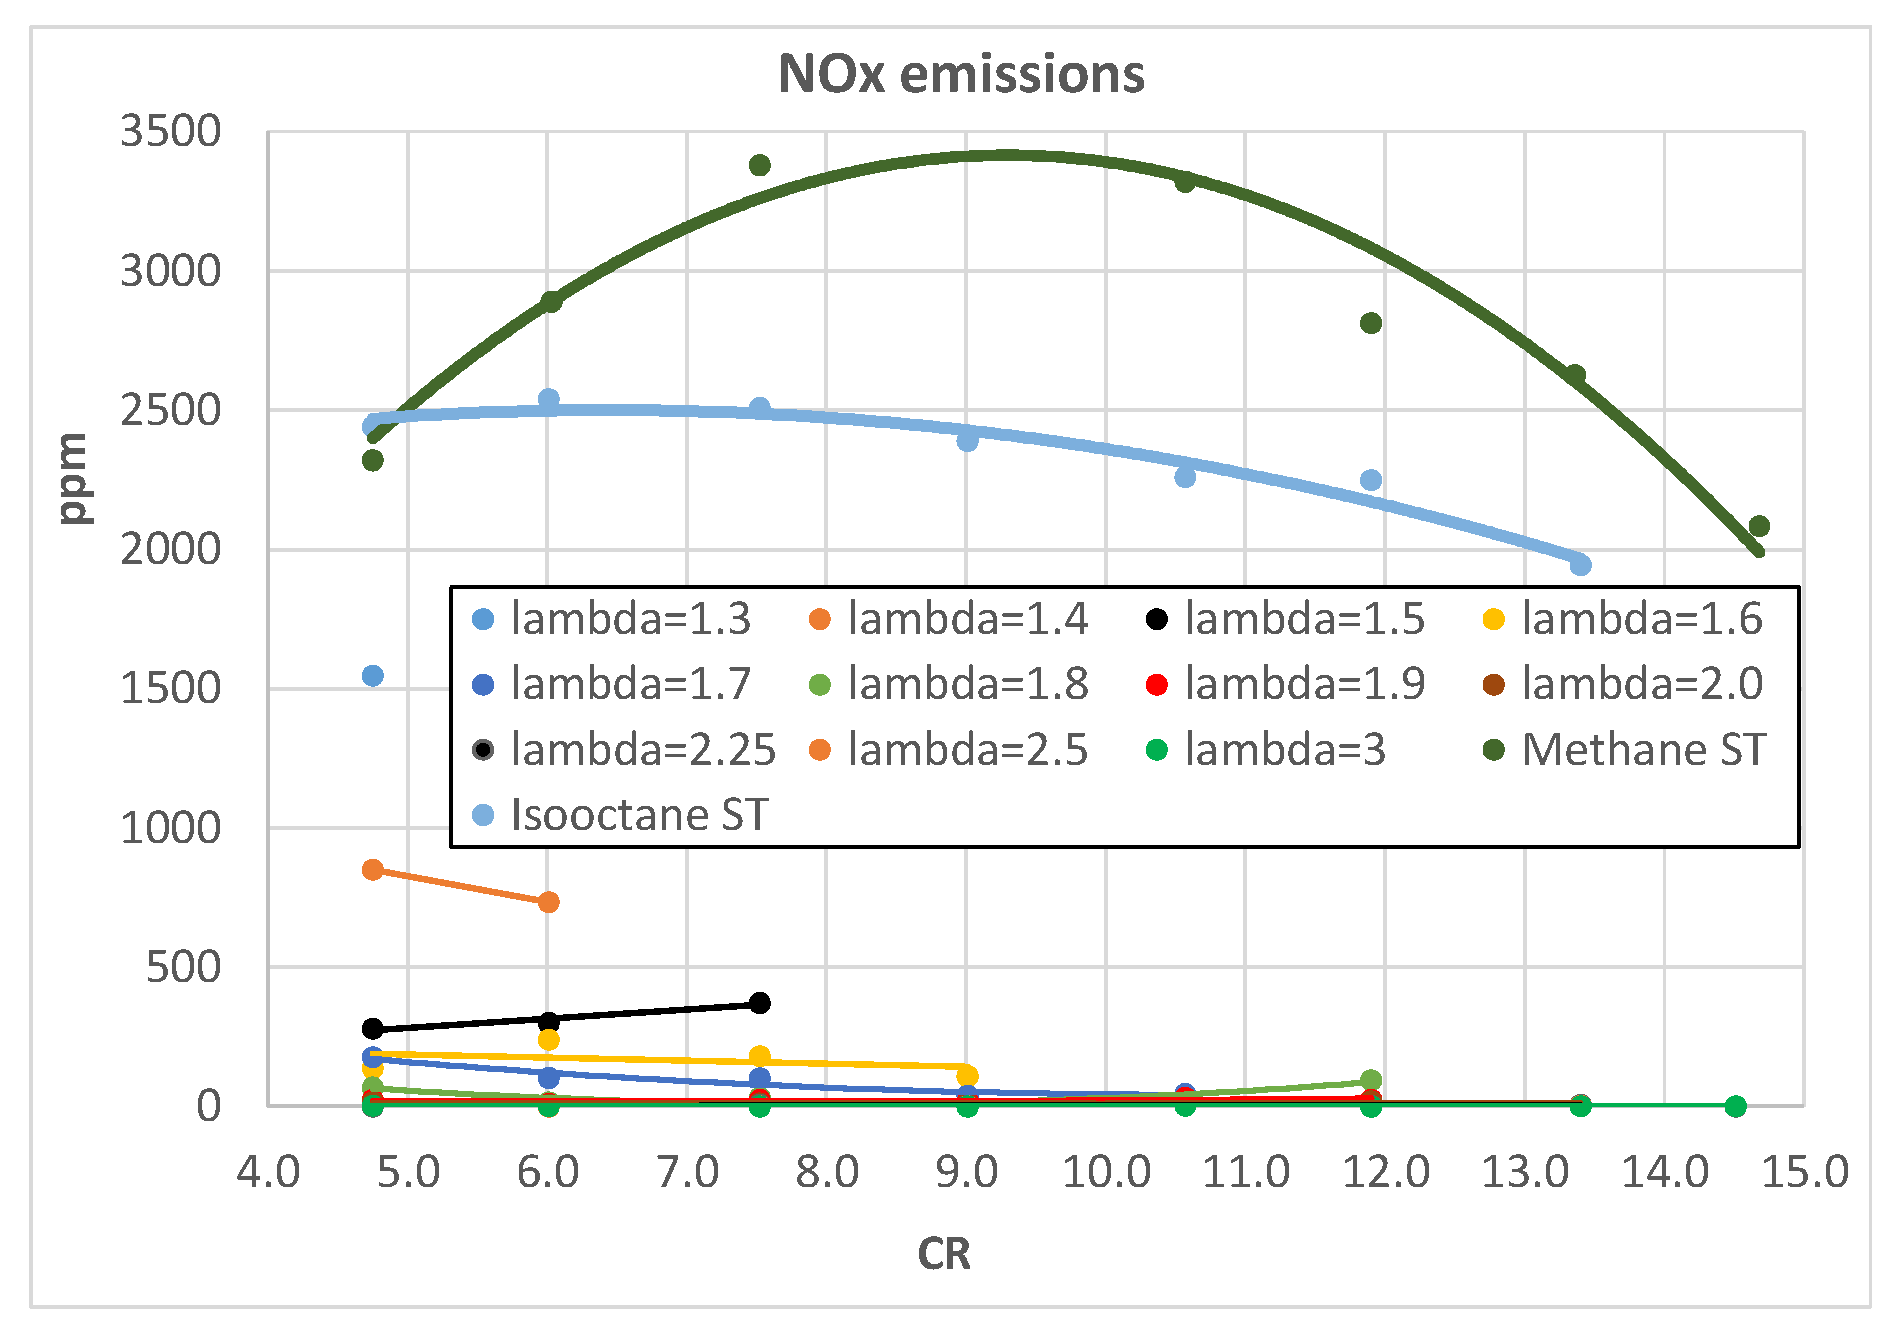
Figure 19 shows a comparison between hydrogen methane and isooctane in terms of NOx; even with λ = 1.3, the hydrogen-fueled engine emits around half the NOx levels of both methane and isooctane, 1500 ppm vs. 3000 ppm, confirming the very low environmental impact of this fuel compared with traditional ones.
In conclusion, the best hydrogen engine operating condition is λ = 2 and CR = 11.9, both from an engine efficiency and a low emissions point of view, because it represents the best compromise between quite a fast combustion (
Figure 3,
Figure 4,
Figure 5 and
Figure 6), a decent CE (
Figure 9), and a fairly good HLE (
Figure 14 and
Figure 15).


