Abstract
To achieve low-carbon collaborative operation of active distribution networks (ADNs) and microgrid clusters, this paper proposes a signal-guided collaborative optimization method. Firstly, a spatiotemporal carbon intensity equilibrium model (STCIEM) is constructed, overcoming the limitations of centralized carbon emission flow models in terms of data privacy and equitable distribution, and enabling distributed and precise carbon emission measurement. Secondly, a dual-market mechanism for carbon and electricity is designed to support peer-to-peer (P2P) carbon quota trading between microgrids and ADN-backed clearing, enhancing market liquidity and flexibility. In terms of scheduling strategy optimization, the multi-agent deep deterministic policy gradient (MADDPG) algorithm is incorporated into the carbon-electricity cooperative game framework, enabling differentiated energy scheduling under constraints. Simulation results demonstrate that the proposed method can effectively coordinate the operation of energy storage, gas turbines, and demand response, reduce system carbon intensity, improve market fairness, and enhance overall economic performance and robustness. The study shows that this framework provides theoretical support and practical reference for future distributed energy consumption and carbon neutrality paths.
1. Introduction
As the backbone of the energy industry, the power sector’s transition directly shapes economy-wide carbon emissions. As the core of energy conversion and transmission, the power system’s decarbonization and digital-intelligent transformation have become a key engine propelling the energy transition [1,2]. Within this architecture, coordination between the supply and demand sides is pivotal to efficient energy use and low-carbon operation [3]. In principle, power generation on the supply side is the dominant source of the system’s direct carbon emissions; reducing emissions at this stage is therefore often viewed as the most direct and effective mitigation pathway. In practice, however, demand-side electricity consumption not only directly influences generation output but also materially affects the system’s overall operational efficiency, thereby determining the scale and intensity of supply-side emissions. Consequently, a supply-side-only approach cannot deliver system-wide decarbonization. Deploying intelligent demand-side management (IDSM) to optimize the demand side can further curb total emissions, enable supply–demand coordination, and steer the power system toward comprehensive decarbonization. Accordingly, decarbonizing the power system requires not only optimization on the generation side but also carbon-emission accountability on the user side [4].
Given the fundamental differences between the supply and demand sides—in operating entities, governance methods, and business models—designing a carbon-emissions allocation mechanism that ensures fair burden-sharing is a core challenge for power-system decarbonization. Owing to its strong consistency with power-flow physics, the carbon emission flow (CEF) model [5] has become a key instrument for estimating nodal carbon intensity [6]. In active distribution networks (ADNs), CEF has been widely used for resource scheduling [7,8,9]; integrated with distributed-energy dispatch and demand-side management (DSM), it materially enhances low-carbon operational efficiency. Data-driven variants of CEF [10] further incorporate demand response (DR), enabling dynamic alignment between user behavior and prevailing carbon-intensity levels. In practical applications, distribution network operators generally have limited observability beyond the point of common coupling (PCC) [11], which defines the interface between an ADN and MGs. This limitation restricts their ability to access detailed user information within MGs. This constrains centralized CEF implementations at the distribution level and raises the risk of user-privacy leakage.
Under dynamic supply–demand conditions, coordinated operation between ADNs and multiple microgrids (MMGs) is pivotal to maximizing the utilization efficiency of distributed energy resources (DERs) [12,13,14]. Beyond their interactions with external markets, ADNs also enable intra-network energy transactions among MGs and influence user demand through adaptive pricing schemes [15]. To improve both flexibility and operational reliability, a variety of localized trading frameworks tailored for ADN–MMG ecosystems have been developed [16,17,18]. Although these methods enhance overall economic efficiency, they often neglect the complex interdependencies among participating entities, resulting in suboptimal and inequitable allocation of resources [15]. Centralized coordination strategies, moreover, are inadequate for accommodating the diverse objectives and autonomous behavior of MGs and ADNs, thereby failing to reflect the system’s inherently decentralized and self-regulated nature [19]. In addition, numerous studies treat interconnected MGs as homogeneous units, oversimplifying their heterogeneity and network constraints by applying relaxed formulations. Such abstraction disregards the diversity in MG structures, DER compositions, consumer characteristics, and the physical as well as operational limitations of the grid [20,21] Consequently, such models can yield infeasible or suboptimal solutions in practice, undermining system reliability and operational efficiency.
In power-system optimization, data-driven algorithms—leveraging massive streams of real-time and historical data—can quickly capture system dynamics and uncertainty to build fine-grained models that deliver efficient distributed resource scheduling, cost reduction, and risk management [22]. However, conventional reward-centric multi-agent deep reinforcement learning (MADRL) often neglects strict operational constraints; most data-driven methods lack explicit mechanisms to guarantee behavioral safety [23], limiting their effectiveness to unconstrained or lightly constrained settings [24]. The literature has explored several strategies to address these issues. A straightforward tactic is to penalize constraint violations directly within the reward function [25,26]. This, however, cannot strictly ensure that solutions remain inside the feasible set, nor can it preclude unsafe operations during offline training and online deployment.
To enhance safety assurance and regulatory compliance, various optimization techniques have been incorporated into reinforcement learning (RL). Typical strategies include pre-classifying control actions through supervised learning and introducing physical safety constraints to mitigate the likelihood of violations [27]. Interior-point optimization has also been employed to guide policy updates by imposing significant penalties on any constraint-breaching behavior [28]. Alternatively, some studies modify the policy-update rule itself, allowing updates only when constraints are satisfied and utilizing Trust Region Policy Optimization (TRPO) to address infeasible cases [29]. Although these techniques effectively reduce the frequency of violations, they simultaneously increase model complexity and computational burden, leaving residual safety challenges unresolved.
Overall, notable gaps persist in the literature regarding carbon-emissions allocation, the design of fair and efficient carbon–electricity markets, and constraint modeling for multi-agent reinforcement learning. First, although centralized CEF models align well with power-flow physics, their use in ADNs and clusters of MGs is impeded by data-sharing and privacy-protection barriers, hindering accurate metering in decentralized settings. Second, existing carbon–electricity market mechanisms rely excessively on centralized coordination and lack flexible peer-to-peer (P2P) trading and clearing/settlement mechanisms, limiting effective benefit-sharing among diverse actors. Third, traditional MADRL approaches for power-system optimization often overlook operational constraints and safety, yielding solutions with inadequate feasibility and robustness in real-world systems.
To address these challenges, we propose a low-carbon co-optimization framework for ADNs and clusters of MMGs. We develop a spatiotemporal carbon-intensity equalization model (STCIEM) that enables privacy-preserving, accurate carbon metering and fair allocation. At the market layer, we design an optimization mechanism that supports P2P trading across coupled carbon–electricity dual markets, together with ADN backstop clearing, to enhance market flexibility and fairness. For scheduling-policy optimization, we employ multi-agent deep deterministic policy gradients (MADDPG) with explicit constraint modeling to achieve supply–demand co-optimization in a decentralized game-theoretic setting, thereby improving system stability and decarbonization performance. The overall framework establishes a verifiable improvement path across the method–mechanism–control loop, with the comparison to existing studies shown in Table 1.

Table 1.
Comparative Analysis of Prior Work and This Study.
This study makes three contributions.
- A distributed carbon-emission-flow framework grounded in STCIEM that circumvents the privacy limitations of centralized models and enables privacy-preserving, spatiotemporal allocation of emissions between ADNs and MGs.
- A carbon–electricity dual-market mechanism that supports peer-to-peer trading of carbon allowances together with ADN backstop clearing, thereby enhancing market flexibility while safeguarding allocative fairness.
- A constraint-aware multi-agent scheduling policy based on MADDPG that achieves supply–demand co-optimization under decentralized strategic interaction and improves system stability and decarbonization outcomes.
The rest of this paper is organized as follows. Section 2 details the modeling of ADNs and MG clusters and the proposed STCIEM. Section 3 presents the dual-market optimization mechanism, including the P2P carbon–electricity trading design and ADN backstop clearing. Section 4 describes the MADDPG-based multi-agent optimization strategy and constraint-modeling approach. Section 5 reports simulation case studies and comparative analyses. Section 6 concludes and discusses directions for future work.
2. Spatio-Temporal Equalization–Based Method for Computing Carbon-Emission Intensity
Traditional centralized CEF models estimate regional electricity carbon-emission factors by accounting for generation-side emissions and apportioning them to load areas according to power exchanges. In practice, the operating entities behind these areas are subject to commercial confidentiality and sectoral regulation, which discourages data sharing and, in turn, raises privacy concerns. To overcome this barrier, we adopt a distributed CEF computation framework grounded in the STCIEM [30]. The PCC functions as the central node for information exchange, safeguarding data integrity and supporting precise assessment of carbon-emission flows. Over each time interval, the dynamic carbon intensity for the ADN and individual MGs is derived as follows:
Here, and represent the time-varying carbon intensities of the ADN and MG , respectively. The indicator is defined as 1 when net power flows from the ADN to MG ), and 0 otherwise . denotes the internal active power loss of the ADN at time ; accordingly, the denominator of Equation (1) describes the net power supply that the ADN can actually deliver to the MGs and downstream loads during this time period.
Compared with centralized CEF approaches, STCIEM uses a decentralized scheme centered on the point of common coupling. It requires only periodic updates from the PCC based on time-interval power measurements. Each participant computes its carbon intensity locally with private operational parameters. The result is broadcast through the PCC. Unit-level sensitive data are not exposed, while system-level carbon-budget consistency is maintained. This design reduces reliance on global real-time synchronization. It eases communication and computation bottlenecks. It also scales well to multiple microgrids and improves robustness. The active distribution network aggregates node results using a unified weighted-average carbon intensity on a regular cadence. This mitigates the bias often seen in centralized apportionment. It strengthens consistency and fairness in settlement. Overall, STCIEM provides clear advantages in privacy protection, operational efficiency, scalability, and robustness. It also better matches the operational reality of distributed multi-agent energy systems.
3. Carbon–Electricity Dual-Market Optimization for ADN and MGs
To jointly deliver economic operation and carbon mitigation, we augment the baseline two-layer ADN–MG coordination model with a carbon-allowance trading module and cast it as a coupled carbon–electricity dual market that supports peer-to-peer bilateral negotiation together with an ADN backstop-clearing facility. The hourly electricity-trading routine is retained, and a daily carbon-allowance settlement cycle is introduced. MGs reconcile their carbon positions either via bilateral matching on the platform or by transacting directly with the ADN.
3.1. Dual-Market Optimization Model for the ADN Operator
Within the proposed architecture, the ADN operator serves as the coordinator of power dispatch and the backstop clearer in the carbon market. Its objective is to maximize the system-level net benefit while meeting the distribution network’s own decarbonization target. The corresponding optimization objective is formulated as follows:
An optimization model is developed for the ADN operator whose objective function contains three components: the economic surplus from electricity trading, captured by the price spread between internal and external markets; a cleanliness term that reflects the distribution network’s carbon-intensity level; and a carbon-allowance trading term that enables flexible allowance transactions among MGs and couples them with power trades. This design not only maximizes the ADN’s overall welfare but also leverages the allowance market to drive additional emissions reductions, improving abatement performance and fostering a more sustainable allocation of energy. The formal properties of the proposed STCIEM, including budget balance, fairness, uniqueness, and privacy guarantees, are provided in Supplementary S1.
Due to the relatively high resistance-to-reactance ratio of the (ADN–MMG system, an AC power flow model is required. Equations (4)–(7) define the network power-flow constraints, where denotes the voltage angle difference between buses and ; is the conductance of the line connecting buses and ; and is the corresponding susceptance. When ≥ 0, the power flow is directed from the distribution network to the MGs; in this case, the transferred power is treated as load from the perspective of the distribution network and as generation from the perspective of the microgrids. Equation (8) represents the line capacity constraint, Equation (9) specifies the bus voltage magnitude limits, and Equation (10) imposes the branch current magnitude constraint.
3.2. Dual-Market Optimization Model for MG Operators
Over each daily scheduling horizon, every MG performs hour-by-hour dispatch and, at day’s end, settles its carbon-allowance position against realized emissions and its initial allocation to ensure full coverage. Allowances can be traded on the platform either bilaterally with other MGs or directly with the ADN under a non-uniform-price, over-the-counter negotiation mechanism. Over each daily scheduling horizon, electricity is settled on an hourly basis, while carbon allowances are cleared once at the end of the day. In this work, daily carbon quotas are allocated and settled independently for each day, and interday carry-over of unused allowances is not considered. The optimization aims to minimize the total expenditure associated with electricity procurement and carbon trading, which can be expressed as:
The model is subject to constraints (12)–(24). The objective in (11) comprises four components: the first two quantify, respectively, MG m operating cost over the scheduling horizon T and its carbon-emission cost; the latter two capture revenues from carbon-allowance trades among MGs and from trades between MG and the ADN. Any emissions by an MG that exceed its allocated allowances must be covered by purchasing additional allowances, whereas surplus allowances may be sold to generate income.
- First item Micro-gas-turbine operational constraints
Equations (12)–(15) specify the carbon-allowance constraints. Equation (12) enforces period-by-period account balance for each MG . Equation (13) limits, for every period , the allowance demand of MG so that it does not exceed the total allowances available to it. Equation (14) imposes market clearing for bilateral trades, requiring that the volume of allowances sold by some MG equals the volume purchased by its counterparty . Equation (15) imposes non-negativity on the allowance variables.
- 2.
- Micro-gas-turbine operational constraints
Equation (16) specifies the micro-gas turbine’s power-output limits, while Equations (17) and (18) enforce its ramping (up/down rate) constraints.
- 3.
- DR operational constraints
In this study, DR is modeled under a daily energy-neutrality assumption total daily load remains constant. Let denote the load adjustment scheduled for MG at time , and the baseline demand of MG at node .
Equation (19) enforces daily energy-neutrality for DR—the aggregate load over the day equals the baseline. Equation (20) requires that the post-DR total load remain nonnegative at all times. Equation (21) bounds the magnitude of load adjustments undertaken during the DR process.
- 4.
- Energy-storage system operational constraints
Equation (22) describes the variation process of charging and discharging power, while Equation (23) constrains the available power range. Meanwhile, Equation (24) specifies the upper and lower limits of the charging and discharging outputs. In this paper, constraints (22)–(24), together with penalizing boundary violations in the reward function, ensure that the state of charge of the storage remains within the interval [5, 95].
3.3. P2P Carbon-Trading Mechanism
To enable more flexible and efficient carbon allowance transfers within microgrid clusters, this study develops a P2P-based carbon trading platform. MGs submit bids and offers according to their abatement capability, emission surplus or deficit, and economic preferences, and transactions are cleared via bilateral negotiation within price bounds linked to an external reference, without disclosing unit-level sensitive data. This design reflects heterogeneous marginal abatement costs, constrains arbitrage, and improves price interpretability and compliance. A unified clearing framework aligns hourly electricity settlement with daily carbon settlement, while the active distribution network serves as a residual clearer under low-liquidity conditions to maintain continuous matching and price stability. Overall, compared with centralized schemes, the platform enhances privacy, supports marginal-cost-based allocation, and improves clearing robustness and social welfare.
In each time step , the ADN broadcasts the internal retail price adjustment () and the external price signal (). Each MG then optimizes its local dispatch and submits a bid vector with its net demand/supply and carbon buy/sell quantities. The electricity market is cleared hourly by balancing the aggregate net demand and supply of all MGs; residual power is exchanged with the upstream grid at (), and MG-side settlements use (). Carbon trades are accumulated over the day and cleared once at day-end, consistent with daily carbon-quota settlement without interday carry-over. Communication in each step is limited to broadcasting a few scalar prices and collecting one bid vector per MG, so the overhead grows roughly linearly with the number of MGs and remains modest. Simulations assume perfect information synchronization and instantaneous market clearing, i.e., communication and computation delays are ignored.
3.3.1. Bidding and Clearing Rules
For each daily carbon-trading round , every participating MG submits:
- A sell quote (ask): the amount of allowances offered and the minimum acceptable unit price ;
- A buy quote (bid): the amount of allowances requested and the maximum willingness-to-pay .
The platform clears a bilateral trade between and if the admissibility condition is satisfied.
When a trade is executed, the transaction price is set to the arithmetic mean of the two quotes:
3.3.2. ADN Participation and Clearing Functionality
To enhance market liquidity and trading feasibility, the ADN is introduced as the clearing entity for carbon-allowance transactions. When trades among MGs cannot be fully matched, the platform allows bilateral transactions between MGs and the ADN to ensure a balanced supply and demand of carbon allowances within the market.
Similar to MG-to-MG transactions, MG–ADN trades also follow a bilateral quotation scheme. MG m submits to the ADN either a bid price or an ask price . Once the trading condition is satisfied, the clearing price is determined according to the arithmetic mean rule:
The ADN’s quotation can either be fixed as a platform-guided reference or self-adjusted according to its operational strategy, thereby guiding market behavior and improving system-wide decarbonization efficiency.
The proposed P2P negotiated pricing with ADN backstop clearing has sound market properties in terms of individual rationality, budget balance, price bounds and liquidity. A trade is executed only when the buyer’s bid is no lower than the seller’s ask, and the clearing price is their arithmetic mean. Thus, the price always lies within the submitted interval, the buyer never pays more than its bid, and the seller never receives less than its ask, ensuring individual rationality. For every transaction the buyer’s payment equals the seller’s revenue; when the ADN acts as counterparty it follows the same rule, so the mechanism is budget-balanced.
All quotes are restricted to a band linked to the external carbon-market reference price, and clearing prices are clipped to this band, creating explicit upper and lower bounds and reducing scope for risk-free arbitrage. On the liquidity side, when microgrids behave as price takers, the ADN’s standing orders within this band provide a permanent liquidity channel that absorbs residual demand or supply and prevents clearing interruptions. When some microgrids have partial pricing power, the average-price rule and price bounds limit price manipulation, while the ADN backstop supplies basic depth under thin-liquidity conditions and stabilizes welfare outcomes.
4. Multi-Agent Learning Framework and Scheduling-Strategy Optimization
In the collaborative environment of carbon–electricity dual markets, each MG within the system can be regarded as an autonomous agent with coupled interactions. Its scheduling behavior is influenced not only by its own load, generation state, and carbon-emission capacity, but also by the dynamic feedback of other participants’ carbon-trading strategies. To achieve system-level coordination under limited communication and local-information constraints, a partially observable Markov game (PoMG) framework is established to represent the interactive decision process among multiple MGs. The MADDPG algorithm is employed to derive the optimal joint policy for this game. Building upon conventional deterministic policy-gradient methods, MADDPG integrates an attention mechanism to model inter-agent policy dependencies and adopts a dual-policy update structure to enhance learning stability. During training, each agent independently optimizes its policy network, while centralized training and distributed execution enable effective coordination of multi-agent strategies.
4.1. Multi-Agent Markov Game Formulation
Consider a multi-agent system composed of interconnected MGs operating within the coupled carbon–electricity markets. The interactive dynamics are formulated as a PoMG, represented by a five-tuple:
where denotes the set of agents (including each MG and the ADN), is the global state space that incorporates system load, power generation, carbon-allowance allocation, emission levels, and trading history; represents the action space of agent m, encompassing both power-dispatch and carbon-trading decisions; denotes the observation space of agent ; and is the reward function, capturing the single-period economic profit and decarbonization benefit of agent .
At each time step , the system state evolves dynamically under the joint actions of all agents, denoted by , following the Markov transition process:
Because each agent can only access its own local observation , the corresponding policy function is defined as:
That is, each agent determines its action based solely according to its locally observed information .
The goal of each agent is to maximize its long-term expected return, evaluated as the discounted cumulative reward.
where denotes the discount factor that determines the relative importance of future rewards.
4.1.1. Observation
At each time step, the observations of the ADN and each heterogeneous MG agent are represented as a high-dimensional vector, defined as follows:
In this context, is defined as the observation vector containing information available only at the PCC level, including internal variables that describe each entity’s operating conditions and PCC-level data that convey power-exchange information at the interface.
For the ADN, the observation includes the upstream-grid (UPG) trading power , carbon intensity , external electricity price , total exchanged power within the system , and the ADN’s own emission intensity . On this basis, carbon-trading-related variables are further incorporated, including each MG’s ask price , bid price , and allowance quantity , which serve as inputs for market matching and ADN clearing.
For each MG, the observation vector includes its purchased power , load power , state of charge , external electricity price , ADN carbon intensity , and local emission intensity . In terms of carbon trading, each MG additionally submits its own bid/ask information , and the allowance quantity for the current trading period.
4.1.2. Action
For each MG , the action vector at time t, denoted as , consists of the following variables:
where . represent the charging and discharging power of the energy storage system, respectively. denotes the micro gas turbine output, while indicates the demand response participation level. represent the carbon allowances sold to and purchased from the ADN by MG m. The set represents bilateral carbon allowance transactions among MGs, with the trading period indexed by .
As the coordinator of the carbon–electricity market, the ADN’s strategy variables emphasize platform-level guidance and clearing control.
Its action vector is defined as:
where is the internal retail price; denotes the ADN’s bid price for carbon allowances purchased from MG represents the ADN’s ask price for carbon allowances sold to MG.
4.1.3. State Transition
The state-transition process is affected by both control actions and stochastic disturbances in multiple state variables, including solar irradiance influencing photovoltaic generation, fluctuations in market prices, variations in UPG carbon intensity, and dynamic changes in MG loads. The transition function is formulated in a data-driven way to reflect the intertwined dynamics of carbon-allowance trading, power scheduling, and energy-storage management.
4.1.4. Reward Function
At each time step , the reward function associated with every agent in the ADN–MMGs framework embodies the objectives of both the ADN and MG models, as formulated in Equations (3) and (11). For an ADN agent, the reward accounts for the power cost or profit , the benefit obtained from electricity trading, and the carbon-market clearing gain .
4.2. Multi-Agent Optimization Based on MADDPG
In the ADN–MMG cooperative optimization problem studied here, each microgrid is modeled as an independent agent operating in a continuous action space for both dispatch and trading, which makes traditional discrete-action Q-learning inadequate. We therefore adopt a MADDPG algorithm with a centralized training and decentralized execution (CTDE) scheme: global information is used during training to improve sample efficiency and convergence, while execution relies only on local observations, reducing communication overhead and protecting private operating data. Continuous policies avoid the precision loss and curse of dimensionality associated with action discretization, and feasible-set projection plus penalty terms at the policy output enforce storage SOC limits, demand response energy neutrality and bounds, and gas turbine output and ramping constraints, while naturally coupling with electricity price and carbon intensity signals. The framework has low dependence on an exact system model, can accommodate device heterogeneity, incomplete information, and uncertainty, and thus offers good scalability and practical applicability.
In a Markov game involving intelligent agents, at each time step , the environment is in a global state . The -th agent observes only local information , and generates actions deterministically according to a strategy . The joint action influences the environment, which in turn results in a state transition probability and an individual reward .
MADDPG employs Centralized Training, CTDE. During execution, each agent relies solely on its own observation and the actor associated with it. During training, however, each agent is assigned a critic that has access to joint information, which is used to evaluate the value of joint actions and stabilize multi-agent nonstationarity.
Specifically, the critic of the -th agent is denoted as ), where is the concatenation of the local observations and is the joint action. During training, the critic uses samples from the replay buffer with samples , and constructs the target for the Bellman equation as:
The critic minimizes the Bellman error:
The strategy adopts a deterministic policy gradient as follows:
That is, the joint action value is evaluated with respect to the action and propagated through for feedback. To enhance stability, MADDPG adopts a new target network:
Furthermore, during the exploration phase, the actor explores using noise and gradually refines the actions. The returned actions are trained in the continuous action space of the environment. Since the training is off-policy and can be reused, there is no need for the critic to focus on specific agents, allowing each agent to execute its own independently, which naturally satisfies the decentralization requirement.
To ensure that the learned policies remain compatible with the AC network constraints introduced in Section 3, the physical limits are treated as hard constraints during both training and execution. Let denote the joint action at time , collecting all continuous control variables such as BESS charging/discharging power, micro-gas-turbine output, demand-response adjustments, and tie-line exchanges. Before being applied to the environment, is projected onto the device-level feasible set by a component-wise clipping operator
where and denote the lower and upper bounds of each controllable variable. The clipped joint action is then used to update the system and to run an AC power-flow calculation, which returns the nodal voltage magnitudes and branch currents . Based on these results, we define violation indicators for the voltage-magnitude and thermal-limit constraints as
where , and are the voltage and thermal limits specified for the ADN. For each agent, the instantaneous reward used in (41) is obtained by augmenting the economic and carbon terms (denoted ) with safety penalties,
where are penalty coefficients. When all voltage and line-loading constraints are satisfied, and the reward is unaffected; any violation leads to a reduction in proportional to the severity of the constraint breach. In this way, the projection in (40) and the penalty terms in (41)–(43) jointly discourage infeasible actions during training, while the same projection operator is applied in the execution phase to guarantee that the dispatched schedules satisfy the AC network limits.
In our implementation, the feasible set explicitly encodes all device-level constraints in Equations (16)–(24), including GT generation limits and ramping, DR power bounds and energy-neutrality over the scheduling horizon, and BESS power/SOC bounds. During both training and testing, all joint actions are first projected onto , so that these constraints are enforced at every step.
Compared to the single-agent DDPG, the key difference in MADDPG lies in the input of the critic: the state feature and the joint action are included. This allows the critic to compute the value function that reflects the change in the strategies of other agents, which helps to stabilize the system. On the other hand, the actor only relies on the agent’s own observation , ensuring that actions are taken without the need for information or communication from other agents. This structure facilitates collaboration, competition, and mixed scenarios, and it can dynamically select whether or not to share parameters. Overall, MADDPG maintains the continuous action model of DDPG while using CTDE to centralize the collection of information from multiple agents, forming a clearer and more stable multi-agent reinforcement learning framework.
5. Case Study
The study uses the IEEE 33-bus system for optimization model validation to address the low-carbon operation problem of the ADN-MMG. The configuration of DER is shown in Figure 1. In order to improve the robustness of the model under future random environmental conditions, the training process includes high-frequency noise, applying load power, the power generation capacity of photovoltaic systems, price, and the volatility of the distribution network. The training data is based on historical information, and the configuration includes AMD EPYC 9554-CPU, 128GB of memory, and an NVIDIA GeForce RTX 4090 GPU for computational implementation. The simulation was conducted using Python 3.13.0/Gymnasium 1.1.1 software and Pandapower 3.1.1 to simulate the real-world power grid environment.
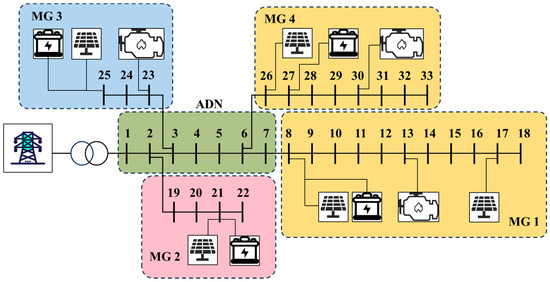
Figure 1.
IEEE 33-Bus network.
5.1. Case Setup
In this study, the paper explores a method to integrate MGs with different network structures and varying energy consumption characteristics into the ADN. MG1 and MG4 are primarily mechanical loads with relatively low-price elasticity; MG2 focuses on Thermostatically Controlled Loads (TCL) and Electric Vehicles (EVs) charging, with prominent peaks; MG3 includes Heating, Ventilation, and Air Conditioning (HVAC) and lighting, which occupy a relatively high proportion and align with PV generation. The baseline net-load and PV profiles of each MG are represented as synthetic 24 h time series with a resolution of 1 h, constructed to reflect typical daily patterns of the four MG categories and scaled according to the DER capacities in Table 2.
Table 2.
DERS parameter settings.
To assess the effectiveness of the proposed model, a 24-h horizon is discretized into one-hour decision intervals (T = 24). In the testing stage, simulations are performed for seven consecutive daily episodes. For each episode, the same baseline load profiles are used, while the PV output is perturbed by independent uniform noise up to 10% of the hourly maximum-power-point value, thereby generating different stochastic scenarios to emulate day-to-day variability and verify the consistency of the results.
The configuration parameters of the DERs are listed in Table 2. Within the distribution network, the internal market price adjustment range is defined as [−0.2, 0.2] ($/kWh). In the MMG layer, the controllable output ranges for energy storage systems and micro gas turbines are [−300, 300] kW and [−50, 50] kW, respectively [30]. The demand-response variation is limited to [−0.2, 0.2] times the real-time load. The corresponding MADDPG algorithm parameters are provided in Table 3. The upstream-grid carbon intensity is modeled as an hourly time series with a resolution of 1 h and units of t/MWh (based on data provided by the supporting utility). The emission factor of the micro gas turbines is derived by considering typical GT efficiency and the lower heating value of natural gas, and is used as a time-invariant equivalent carbon-emission factor in the simulations. The external market price adopts a three-level time-of-use structure. Specifically, is set to 0.246 $/kWh during 0:00–7:00 and 12:00–13:00, 0.603 $/kWh at 8:00 and 20:00–23:00, and 1.007 $/kWh during 9:00–11:00 and 14:00–19:00. This time-of-use tariff serves as the baseline external price signal, around which the internal retail price adjustment is applied.
Table 3.
Hyperparameter settings of the MADDPG algorithm.
In this case study, each algorithm is trained with a single random seed over 8000 episodes, and each episode consists of 24 one-hour decision steps, yielding about () decision steps in total. After collecting the first 2000 steps as warm-up data, the network parameters are updated every 4 steps to complete policy training and convergence.
5.2. Result Analysis
During both training and testing, the safety layer described in Section 4.2 is used to check and correct potential violations of the device-level constraints in Equations (16)–(24), including SOC bounds, DR power limits and energy-neutrality, and GT output and ramp limits. For the test days reported in this section, the resulting dispatch trajectories were inspected and no substantive violations of these constraints were observed, indicating that device-level operational safety is effectively ensured within the experimental scope.
Figure 2 illustrates the evolution of the agents’ total reward over a 24-step episode, together with the corresponding operational behavior. The total power output and load exhibit similar profiles with a negative correlation: between 9:00 and 15:00, MGs in the ADN increase clean electricity sales and power transfers while the regional carbon intensity decreases, leading to lower carbon emissions. In the evening, solar generation decreases as the load rises, and MG-side resources such as gas turbines and energy storage systems increase their output during the peak period while reducing the overall generation cost. The ADN reward curve (Figure 3) remains relatively stable, mainly because the electricity price varies smoothly; around noon, the ADN carbon intensity is low due to cleaner upstream supply, and the ADN reward is adjusted accordingly.
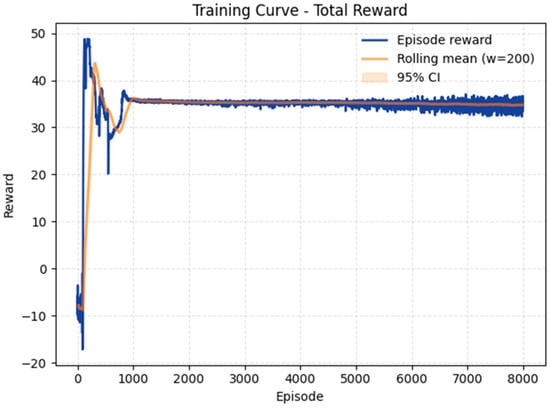
Figure 2.
Total reward curve.
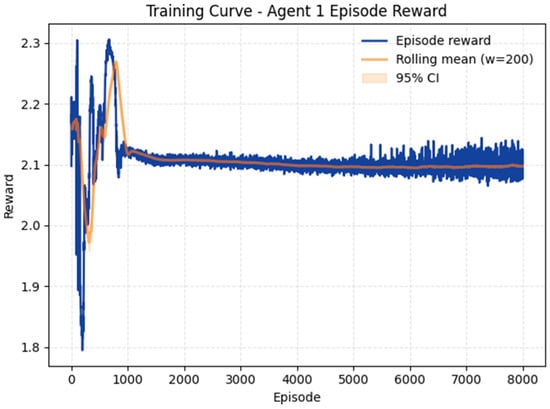
Figure 3.
ADN reward curve.
The physical state of the area is more sensitive: the frequency of charging and discharging of energy storage is large, and the carbon emissions fluctuate greatly. During the evening, carbon emissions increase with the larger change in load. It is worth noting that the SOC value in Figure 4 reflects this significant change in the system. In summary, Figure 4 show that the optimization model is robust to both economic performance and equipment longevity. The operations are aligned with carbon goals, and the system can adaptively balance power generation with demand.
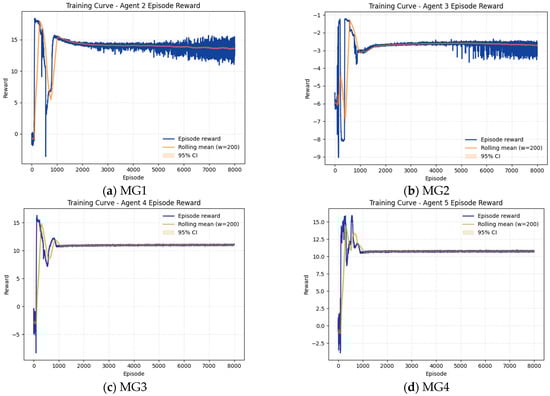
Figure 4.
MG reward curve.
From Figure 5, it can be seen that the SOC of the four energy storage units remains within the constraint range throughout the 24-h operation cycle, but shows significant differences. The SOC of BESS 2 stays at a high level, indicating that it mainly serves as a backup under the scheduling strategy, participating in charging and discharging less frequently. BESS 3 charges rapidly during the day when solar power output is sufficient, and gradually discharges in the evening, reflecting the typical role of peak shaving and valley filling. The SOC of BESS 4 fluctuates multiple times throughout the day, indicating that it frequently responds to system load and price signals to achieve local balance. In contrast, BESS 1 continuously discharges in the first half of the day, with its SOC gradually decreasing to the lower limit, showing that it mainly undertakes the task of peak shaving during the day.
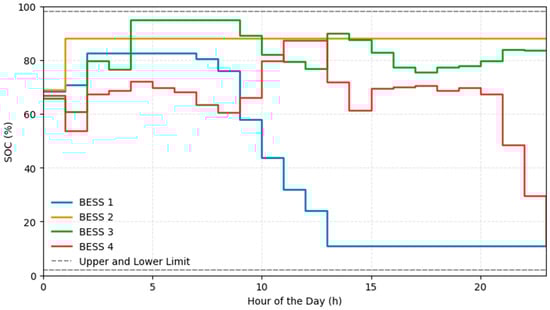
Figure 5.
Daily SOC variation curve of the BESSs.
Overall, under the coordination of the multi-agent strategy, each energy storage unit operates in a differentiated manner, avoiding the risk of exceeding limits, while sharing energy regulation tasks across time, which helps improve the system’s flexibility and low-carbon operation efficiency.
Figure 6 shows the daily output characteristics of the gas turbines GT1, GT3, and GT4. Overall, all three units operate within their technical constraints but exhibit different scheduling characteristics. GT1 quickly ramps up in the early morning and maintains a high output for several hours, demonstrating its support role during the initial load rise phase of the system. The output curve of GT3 shows a gradual increase, reaching a relatively high level in the evening, indicating that it compensates during the evening peak and when renewable output is insufficient. In contrast, GT4 maintains the most stable output, staying close to a constant level, primarily supplying the system’s base load.
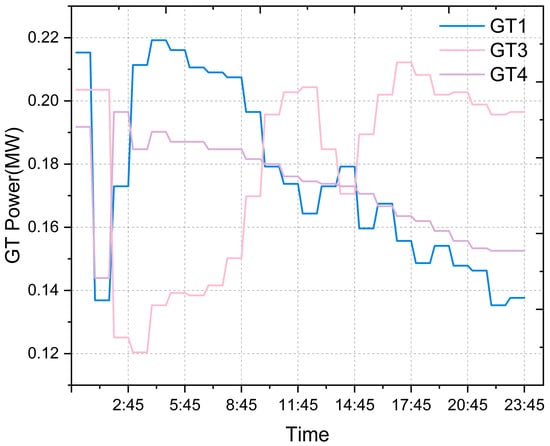
Figure 6.
Daily output curve of GTs.
It is worth noting that GT1 and GT3 alternately assume the marginal regulation role at different times, which helps reduce the fluctuations and startup/shutdown frequencies of individual units. This differentiated operation mode not only enhances the economic efficiency and reliability of the gas turbine group but also, by reducing redundant startups and the dependence on high-carbon power during certain periods, creates conditions for the overall low-carbon dispatch of the system.
Figure 7 reflects the carbon intensity variation characteristics of the ADN and the four MGs over a 24-h period. From the overall trend, ADN and MG3 maintain higher carbon intensity during most periods, indicating that they mainly rely on fossil energy sources such as gas turbines for power supply, contributing significantly to system carbon emissions. In contrast, MG1 and MG2 generally exhibit lower carbon intensity, with some periods even approaching neutral levels, showing that their higher share of clean energy provides significant emission reduction benefits. MG4 operates at an intermediate level, with a noticeable increase in carbon intensity during the morning and evening peak periods, indicating that its scheduling is more influenced by load and electricity price fluctuations.
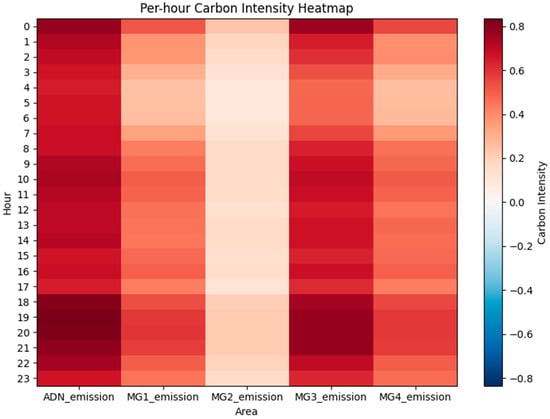
Figure 7.
Hourly carbon intensity distribution heatmap for each region.
It is worth noting that at night (18:00–22:00), the carbon intensity of ADN significantly rises, suggesting that when renewable energy is insufficient, the ADN bottom-up mechanism increases the system’s marginal emissions. The differences in carbon intensity distribution across different MGs during various time periods highlight the carbon emission inconsistencies caused by the unbalanced source-load-storage structure. This provides intuitive insights for the subsequent optimization based on P2P carbon quota trading and ADN clearing mechanisms.
As can be seen from Figure 8, the carbon quota trading behaviors of different MGs exhibit significant differentiation over the course of a week. MG1 and MG2 are net buyers of carbon quotas during most periods, indicating that their load rigidity or high carbon intensity requires them to purchase quotas to meet emission constraints. In contrast, MG3 frequently becomes a net seller during the day when solar power output is sufficient, reflecting its high share of clean energy and strong emission reduction advantages. MG4 alternates between buying and selling throughout the week, positioning itself as a balanced market participant.

Figure 8.
Carbon quota buy-and-sell situation of each MG within one week.
Overall, under the P2P carbon trading platform, the differentiated trading roles formed by each MG based on their own resource endowment and emission levels not only alleviate the problem of uneven quota distribution but also demonstrate the effectiveness of the trading mechanism in promoting low-carbon collaboration.
Figure 9 shows that the adjustment range of relative to is small: in most periods their difference is about 0.01 $/kWh. This implies that the internal price is a fine-grained correction to the external time-of-use tariff rather than a new price structure. When the MG cluster still has usable local flexibility, the ADN raises slightly above (by about 0.01–0.02 $/kWh) to strengthen the marginal price signal in high-price hours and encourage MGs to reduce upstream purchases through local discharge and demand response. When most MGs have already increased local output and upstream purchases have fallen, is kept close to or slightly below to avoid further price increases when local resources are nearly exhausted. Thus, the internal price can be interpreted as a state-dependent refinement of the external tariff, based on the ADN’s observation of storage and demand-response conditions, to balance economic efficiency and low-carbon objectives.
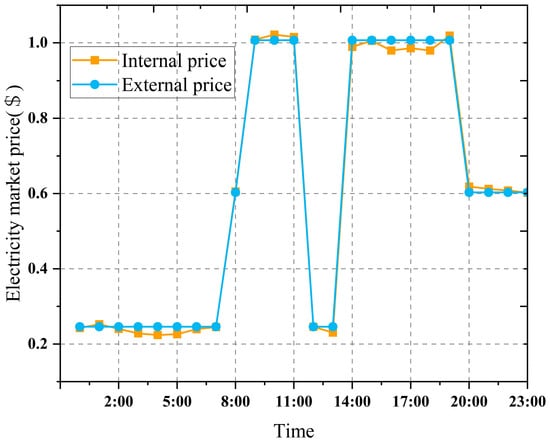
Figure 9.
Internal vs. external market prices (24 h).
Figure 10 reflects the changes in the profits generated from carbon quota buying and selling by each MG over the course of a week. It can be observed that MG3, with its strong renewable output, generally has positive carbon trading profits, although with significant fluctuations. This indicates that it can generate additional income by selling excess quotas during peak periods. MG1 and MG2, being long-term net buyers, have mostly negative trading profits, implying that they face greater pressure in their low-carbon transition. The profit curve of MG4 remains close to zero, with occasional small positive and negative fluctuations, reflecting its more stable and balanced role in the market.
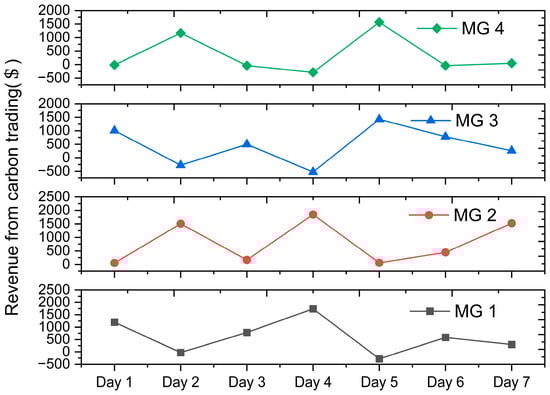
Figure 10.
Carbon trading revenue variation of each MG within one week.
The carbon trading profits are closely related to the energy structure and load characteristics of each MG, and they also confirm that the dual carbon-electricity market mechanism can create incentive effects for MGs with a high share of clean energy, thereby promoting overall system emission reductions.
Furthermore, because the upstream-grid carbon intensity varies significantly over time, the case-study results also reflect the qualitative influence of carbon-intensity levels on carbon trades and dispatch decisions. During hours with higher upstream carbon intensity, the internal price adjustment of the ADN becomes more active and the MGs respond by increasing local generation and demand-side adjustments, which leads to larger carbon-quota trading volumes and more pronounced redispatch. In contrast, when is relatively low, the system relies more on upstream supply, the incentives for local flexibility are weaker, and both trading activity and redispatch magnitudes are reduced. These patterns indicate that the proposed mechanism reacts consistently to the temporal carbon signals embedded in , even though the calibrated carbon-intensity parameters themselves are kept fixed across scenarios.
5.3. Comparative Analysis of Low-Carbon Economic Optimal Dispatch Decisions
To systematically evaluate the carbon reduction and economic benefits of the proposed carbon–electricity coordinated optimization mechanism, this section conducts a comparative analysis of low-carbon economic decision-making from two perspectives: “algorithm comparison” and “market configuration scenarios.”
Table 4 compares the performance of four algorithms at both the MGs and ADN levels: centralized DDPG (C-DDPG), independent DDPG (IDDPG), a rule-based algorithm (RBD), and the MADDPG algorithm adopted in this paper. In terms of carbon reduction, MADDPG achieves the lowest total emissions from MGs (27.16 t), corresponding to reductions of about 4.9% and 6.0% relative to C-DDPG and RBD, and still about 2.5% lower than the best baseline IDDPG (27.85 t). In terms of economic performance, the MG operating cost under MADDPG (2568.41 $) is 6.3% lower than C-DDPG and 4.5% lower than RBD, while being only about 3.2% higher than the more cost-oriented IDDPG baseline. At the ADN level, MADDPG also yields the lowest carbon-intensity ratio (0.85), reducing it by approximately 3–5% compared with the other baselines, while achieving the highest ADN operating profit (466.82 $), which is 8.7% and 18.7% higher than C-DDPG and RBD, and still about 1.7% higher than IDDPG. Overall, these results indicate that, compared with centralized RL, independent RL, and the rule-based algorithm, the cooperative MADDPG algorithm achieves a more favorable trade-off among cost, emissions, and profit, lowering carbon intensity and improving ADN revenues while keeping MG operating costs competitive.
Table 4.
Algorithm Performance on MGs and ADN.
Table 5 presents an ablation study on the carbon–electricity market design. Case 1 disables horizontal P2P carbon–electricity trading among MGs while retaining ADN clearing, Case 2 keeps P2P trading but removes the ADN backstop clearing, and Case 3 corresponds to the full two-layer mechanism. When P2P is removed (Case 1), MGs exhibit higher total emissions (30.24 t) and operating cost (2901.16$), and the ADN carbon-intensity ratio deteriorates to 0.91, although the ADN obtains the highest profit (498.50 $) because more energy is cleared at the ADN level. In contrast, removing ADN clearing but retaining P2P trading (Case 2) forces MGs to self-balance using local flexibility; this yields the lowest MG emissions (17.25 t) and the best ADN carbon-intensity ratio (0.81), but MG operating cost increases sharply to 4841.01 $ and the ADN suffers a loss (−177.40 $), which is economically unattractive. Under the full mechanism (Case 3), MG operating cost is minimized (2568.41$), the ADN carbon-intensity ratio is reduced to 0.85 (about 7% lower than Case 1), and ADN profit remains high (466.82$, only slightly below Case 1 but far above Case 2). Overall, these ablations confirm that combining P2P trading with ADN clearing yields a more balanced cost–emissions–profit trade-off than either P2P-only or ADN-only market designs.
Table 5.
Comparison of Market Mechanism Cases.
6. Conclusions
This paper proposes a low-carbon collaborative optimization method for the ADN and MMG clusters. By constructing the STCIEM, the method achieves distributed, accurate carbon emission measurement and fair distribution. The designed dual carbon-electricity market mechanism supports P2P trading and ADN bottom-up clearing, effectively enhancing the market’s flexibility and fairness. Combined with the MADDPG algorithm, each MG can learn and implement differentiated scheduling strategies in a decentralized game environment, thereby balancing the system’s economic performance with low-carbon goals.
Simulation results show that this framework can coordinate energy storage for peak shaving and valley filling, gas turbine base load support, and marginal regulation, revealing the hourly carbon intensity differences across regions. Compared to traditional centralized methods, this study has clear advantages in privacy protection, carbon intensity balancing, and market liquidity, demonstrating its feasibility in complex power markets and distributed energy environments.
In summary, the innovation of this paper lies not only in the organic combination of STCIEM and the dual carbon-electricity market but also in the introduction of multi-agent reinforcement learning into carbon-electricity collaborative optimization, providing theoretical support and practical reference for future large-scale clean energy integration and carbon neutrality path exploration.
Supplementary Materials
The following supporting information can be downloaded at: https://www.mdpi.com/article/10.3390/en18246614/s1, Supplementary S1: Formal properties of STCIEM; Supplementary S2: List of symbols.
Author Contributions
Conceptualization, Z.W., S.L. and Y.H. (Yuping Huang); Methodology, W.W. and Y.H. (Yilin Huang); Software, Y.H. (Yilin Huang); Validation, S.L. and K.Y.; Formal analysis, Z.W., K.Y. and Y.H. (Yilin Huang); Investigation, Z.W., G.L. and X.Z.; Resources, S.L.; Data curation, Z.W., G.L., X.Z. and Y.H. (Yilin Huang); Writing—Original draft preparation, S.L., W.W. and Y.H. (Yilin Huang); Writing—Review and Editing, S.L. and Y.H. (Yuping Huang).; Visualization, Y.H. (Yilin Huang); Supervision, S.L.; Project administration, Y.H. (Yuping Huang); Funding acquisition, S.L., K.Y., W.W., G.L. and X.Z. All authors have read and agreed to the published version of the manuscript.
Funding
This work is supported by the National Key Research and Development Program of China (2022YFB3304503) and the Science and Technology Project of China Southern Power Grid Company Ltd. (031900KC24040022(GDKJXM20240391)).
Data Availability Statement
The data presented in this study are available on request from the corresponding author. Some of the data are not publicly available due to confidentiality agreements with the project sponsor.
Conflicts of Interest
Authors Zihao Wang, Shuoyu Li, Kai Yu, Wenjing Wei, Guo Lin and Xiqiu Zhou were employed by the company Dongguan Power Supply Bureau of Guangdong Power Grid Co., Ltd. The remaining authors declare that the research was conducted in the absence of any commercial or financial relationships that could be construed as a potential conflict of interest.
Abbreviations
The following abbreviations are used in this manuscript; the list of symbols is provided in Supplementary S2.
| ADN | Active Distribution Network |
| MG/MGs | Microgrid(s) |
| MMG/MMGs | Multiple Microgrids/Multi-Microgrid(s) |
| DER/DERs | Distributed Energy Resource(s) |
| CEF | Carbon Emission Flow |
| PCC | Point of Common Coupling |
| IDSM | Intelligent Demand-Side Management |
| DSM | Demand-Side Management |
| DR | Demand Response |
| P2P | Peer-to-Peer |
| STCIEM | Spatiotemporal Carbon Intensity Equilibrium Model |
| MADDPG | Multi-Agent Deep Deterministic Policy Gradient |
| MADRL | Multi-Agent Deep Reinforcement Learning |
| TRPO | Trust Region Policy Optimization |
| PoMG | Partially Observable Markov Game |
| RL | Reinforcement Learning |
| DDPG | Deep Deterministic Policy Gradient |
| CTDE | Centralized Training, Decentralized Execution |
| UPG | Upstream Grid |
| SOC | State of Charge |
| BESS/BESSs | Battery Energy Storage System(s) |
| GT/GTs | Gas Turbine(s) |
| PV | Photovoltaic |
| EV/EVs | Electric Vehicle(s) |
| TCL | Thermostatically Controlled Load(s) |
| HVAC | Heating, Ventilation, and Air Conditioning |
| IEEE | Institute of Electrical and Electronics Engineers |
| CPU | Central Processing Unit |
| GPU | Graphics Processing Unit |
| GeLU | Gaussian Error Linear Unit |
References
- Zhang, Z.; Kang, C. Challenges and Prospects for Constructing the New-type Power System Towards a Carbon Neutrality Future. Proc. CSEE 2022, 42, 2806–2819. [Google Scholar] [CrossRef]
- Shu, Y.; Zhang, L.; Zhang, Y.; Wang, Y.; Lu, G.; Yuan, B.; Xia, P. Carbon Peak and Carbon Neutrality Path for China’s Power Industry. Chin. J. Eng. 2021, 23, 1–14. [Google Scholar] [CrossRef]
- Xu, Z.; Sun, H.; Guo, Q. Review and Prospect of Integrated Demand Response. Proc. CSEE 2018, 38, 7194–7205+7446. [Google Scholar] [CrossRef]
- Liu, Y.; Li, Y.; Zhou, C.; Song, J.; Deng, H.; Du, E.; Zhang, N.; Kang, C. Overview of Carbon Measurement and Analysis Methods in Power Systems. Proc. CSEE 2024, 44, 2220–2236. [Google Scholar] [CrossRef]
- Kang, C.; Zhou, T.; Chen, Q.; Wang, J.; Sun, Y.; Xia, Q.; Yan, H. Carbon Emission Flow from Generation to Demand: A Network-Based Model. IEEE Trans. Smart Grid 2015, 6, 2386–2394. [Google Scholar] [CrossRef]
- Lu, Z.; Bai, L.; Wang, J.; Wei, J.; Xiao, Y.; Chen, Y. Peer-to-Peer Joint Electricity and Carbon Trading Based on Carbon-Aware Distribution Locational Marginal Pricing. IEEE Trans. Power Syst. 2023, 38, 835–852. [Google Scholar] [CrossRef]
- Wan, T.; Tao, Y.; Qiu, J.; Lai, S. Distributed Energy and Carbon Emission Right Trading in Local Energy Systems Considering the Emission Obligation on Demand Side. IEEE Syst. J. 2023, 17, 6292–6301. [Google Scholar] [CrossRef]
- Zhang, M.; Xu, Y.; Yi, Z. Two-Stage Carbon-Oriented Scheduling of an Active Distribution Network with Thermostatically Controlled Load Aggregators. IEEE Trans. Sustain. Energy 2024, 15, 1462–1474. [Google Scholar] [CrossRef]
- Liang, Z.; Mu, L. Multi-agent low-carbon optimal dispatch of regional integrated energy system based on mixed game theory. Energy 2024, 295, 130953. [Google Scholar] [CrossRef]
- Wang, Y.; Qiu, J.; Tao, Y. Optimal Power Scheduling Using Data-Driven Carbon Emission Flow Modelling for Carbon Intensity Control. IEEE Trans. Power Syst. 2022, 37, 2894–2905. [Google Scholar] [CrossRef]
- Zhang, Q.; Dehghanpour, K.; Wang, Z.; Huang, Q. A Learning-Based Power Management Method for Networked Microgrids Under Incomplete Information. IEEE Trans. Smart Grid 2020, 11, 1193–1204. [Google Scholar] [CrossRef]
- Ibrahim, N.N.; Jamian, J.J.; Md Rasid, M. Optimal multi-objective sizing of renewable energy sources and battery energy storage systems for formation of a multi-microgrid system considering diverse load patterns. Energy 2024, 304, 131921. [Google Scholar] [CrossRef]
- Du, Y.; Li, F. Intelligent Multi-Microgrid Energy Management Based on Deep Neural Network and Model-Free Reinforcement Learning. IEEE Trans. Smart Grid 2020, 11, 1066–1076. [Google Scholar] [CrossRef]
- Ceja-Espinosa, C.; Pirnia, M.; Cañizares, C.A. An Affine Arithmetic-Based Energy Management System for Cooperative Multi-Microgrid Networks. IEEE Trans. Smart Grid 2024, 15, 1317–1329. [Google Scholar] [CrossRef]
- Liu, X.; Li, S.; Zhu, J. Optimal Coordination for Multiple Network-Constrained VPPs via Multi-Agent Deep Reinforcement Learning. IEEE Trans. Smart Grid 2023, 14, 3016–3031. [Google Scholar] [CrossRef]
- Yan, M.; Shahidehpour, M.; Paaso, A.; Zhang, L.; Alabdulwahab, A.; Abusorrah, A. Distribution Network-Constrained Optimization of Peer-to-Peer Transactive Energy Trading Among Multi-Microgrids. IEEE Trans. Smart Grid 2021, 12, 1033–1047. [Google Scholar] [CrossRef]
- Wu, Y.; Zhao, T.; Yan, H.; Liu, M.; Liu, N. Hierarchical Hybrid Multi-Agent Deep Reinforcement Learning for Peer-to-Peer Energy Trading Among Multiple Heterogeneous Microgrids. IEEE Trans. Smart Grid 2023, 14, 4649–4665. [Google Scholar] [CrossRef]
- Pinto, R.S.; Unsihuay-Vila, C. A data-driven distributionally robust expansion planning model for ADNs with multi-microgrids considering energy trading strategy based on game theory. Sustain. Energy Grids Netw. 2024, 39, 101431. [Google Scholar] [CrossRef]
- Chen, X.; Zhai, J.; Jiang, Y.; Ni, C.; Wang, S.; Nimmegeers, P. Decentralized coordination between active distribution network and multi-microgrids through a fast decentralized adjustable robust operation framework. Sustain. Energy Grids Netw. 2023, 34, 101068. [Google Scholar] [CrossRef]
- Chen, T.; Bu, S.; Liu, X.; Kang, J.; Yu, F.R.; Han, Z. Peer-to-Peer Energy Trading and Energy Conversion in Interconnected Multi-Energy Microgrids Using Multi-Agent Deep Reinforcement Learning. IEEE Trans. Smart Grid 2022, 13, 715–727. [Google Scholar] [CrossRef]
- Monfaredi, F.; Shayeghi, H.; Siano, P. Multi-agent deep reinforcement learning-based optimal energy management for grid-connected multiple energy carrier microgrids. Int. J. Electr. Power Energy Syst. 2023, 153, 109292. [Google Scholar] [CrossRef]
- Gong, J.; Liu, Y. Coordinated Optimization of Active Distribution Network Based on Deep Deterministic Policy Gradient Algorithm. Autom. Electr. Power Syst. 2020, 44, 113–120. [Google Scholar]
- Gao, Y.; Yu, N. Model-augmented safe reinforcement learning for Volt-VAR control in power distribution networks. Appl. Energy 2022, 313, 118762. [Google Scholar] [CrossRef]
- Hu, Z.; Chan, K.W.; Zhu, Z.; Wei, X.; Zheng, W.; Bu, S. Techno–Economic Modeling and Safe Operational Optimization of Multi-Network Constrained Integrated Community Energy Systems. Adv. Appl. Energy 2024, 15, 100183. [Google Scholar] [CrossRef]
- Zhang, Y.; Mei, Z.; Wu, X.; Jiang, H.; Zhang, J.; Gao, W. Two-Step Diffusion Policy Deep Reinforcement Learning Method for Low-Carbon Multi-Energy Microgrid Energy Management. IEEE Trans. Smart Grid 2024, 15, 4576–4588. [Google Scholar] [CrossRef]
- Cao, D.; Zhao, J.; Hu, W.; Yu, N.; Ding, F.; Huang, Q.; Chen, Z. Deep Reinforcement Learning Enabled Physical-Model-Free Two-Timescale Voltage Control Method for Active Distribution Systems. IEEE Trans. Smart Grid 2022, 13, 149–165. [Google Scholar] [CrossRef]
- Wang, Y.; Qiu, D.; Sun, M.; Strbac, G.; Gao, Z. Secure energy management of multi-energy microgrid: A physical-informed safe reinforcement learning approach. Appl. Energy 2023, 335, 120759. [Google Scholar] [CrossRef]
- Ye, Y.; Wang, H.; Chen, P.; Tang, Y.; Strbac, G. Safe Deep Reinforcement Learning for Microgrid Energy Management in Distribution Networks with Leveraged Spatial–Temporal Perception. IEEE Trans. Smart Grid 2023, 14, 3759–3775. [Google Scholar] [CrossRef]
- Zhang, J.; Sang, L.; Xu, Y.; Sun, H. Networked Multiagent-Based Safe Reinforcement Learning for Low-Carbon Demand Management in Distribution Networks. IEEE Trans. Sustain. Energy 2024, 15, 1528–1545. [Google Scholar] [CrossRef]
- Ye, T.; Huang, Y.; Yang, W.; Cai, G.; Yang, Y.; Pan, F. Safe multi-agent deep reinforcement learning for decentralized low-carbon operation in active distribution networks and multi-microgrids. Appl. Energy 2025, 387, 125609. [Google Scholar] [CrossRef]
Disclaimer/Publisher’s Note: The statements, opinions and data contained in all publications are solely those of the individual author(s) and contributor(s) and not of MDPI and/or the editor(s). MDPI and/or the editor(s) disclaim responsibility for any injury to people or property resulting from any ideas, methods, instructions or products referred to in the content. |
© 2025 by the authors. Licensee MDPI, Basel, Switzerland. This article is an open access article distributed under the terms and conditions of the Creative Commons Attribution (CC BY) license (https://creativecommons.org/licenses/by/4.0/).