Abstract
This study presents a comprehensive thermo-economic evaluation of a pumped thermal energy storage (PTES) system based on a supercritical carbon dioxide (s-CO2) recompression Brayton cycle (RBC). A multiparametric analysis was conducted through systematic parameterization of key design variables, including mass fractions directed to the recompressor during charging and to the high-pressure turbine during discharging, as well as compressor inlet pressure and temperature and turbine inlet temperature. Performance optimization focused on two main indicators: round-trip efficiency () and levelized cost of storage (LCOS), enabling identification of trade-offs between thermodynamic and economic performance. Results show that minimizing LCOS yields 148.72 $/MWh with an of 57.1%, whereas maximizing efficiency achieves 61.5% at an LCOS of 158.4 $/MWh. Exergy destruction analysis highlights the strategic role of the main compressor and thermal storage tanks in overall irreversibility distribution. These findings confirm the technical feasibility of the s-CO2 recompression Brayton cycle as a competitive solution for long-duration thermal energy storage.
1. Introduction
Accelerated climate change effects from prolonged fossil fuel use have driven a global transition toward cleaner, sustainable energy sources. This shift prioritizes technologies such as concentrated solar power (CSP), photovoltaics, and wind energy to mitigate greenhouse gas emissions. The share of these technologies in the global energy mix has shown significant growth in recent years [1]. The variability of these renewable resources poses a major challenge for integration into electricity systems. Their intermittency complicates the balance between generation and demand, compromising grid stability. This challenge necessitates energy storage systems capable of efficiently managing surplus energy to ensure continuous supply [2,3]. Existing technologies such as electrochemical batteries face limitations in cost, lifetime, and scalability [4].
To address these limitations, efficient and scalable storage technologies are required. Pumped Thermal Energy Storage (PTES) has emerged as a promising alternative, offering high efficiency, low cost, and excellent scalability. PTES stores thermal energy for subsequent electricity generation, with the most advanced systems employing Brayton cycles using supercritical CO2 as the working fluid [5,6,7,8,9,10]. Tafur-Escanta et al. [5] demonstrated the potential of s-CO2 heat pumps for electrical energy storage, highlighting their efficiency when integrating thermal storage with electricity generation. Held et al. [6] advanced this line by pilot-scale testing of a transcritical CO2-based pumped thermal energy storage (PTES) system, validating its practical performance under real-world operating conditions. Rabi et al. [7] presented a comprehensive review of PTES technologies, addressing their fundamental principles, design configurations, and challenges for their future development. Zhao et al. [8] focused on the multi-objective thermo-economic optimization of Brayton PTES systems, highlighting the role of working fluids and sensible heat storage materials in improving efficiency and reducing costs. Frate et al. [9] compared Brayton-PTES configurations utilizing solid and liquid sensible heat storage, providing a clear insight into the techno-economic trade-offs between both alternatives. Finally, Cascetta et al. [10] analyzed the operational performance of a Joule-Brayton PTES system integrated with a concentrating solar power plant, demonstrating the synergy between thermal energy storage and renewable energy generation.
Benchmarking studies reinforce the growing interest in PTES technologies by positioning them favorably against other storage solutions. Benato and Stoppato (2018) [11] reported that PTES systems offer a balanced combination of high performance and long-term viability, with round-trip efficiencies between 70% and 80% and an estimated lifetime of 25–30 years. In comparison, technologies such as flow batteries or liquefied air storage (LAES) offer similar efficiencies (40–85%) but significantly shorter lifetimes averaging 15 years. McTigue, J. et al., (2020) [12], introduced a PTES variant using s-CO2 as the working fluid, achieving a round-trip efficiency up to 78% at 560 °C, surpassing cycles based on ideal gases. Their study also proposed a hybrid configuration integrating s-CO2-PTES with CSP plants, enabling recompression during low-demand periods and leveraging stored heat to boost heat engine efficiency, resulting in a 10–18% increase in net work compared to the conventional recompression cycle.
Further advancements include reversible Brayton cycle designs by Sun R. et al. (2022) [13] incorporating heat recovery and recompression strategies. The recompression variant achieved a round-trip efficiency of 69.38%, outperforming basic configurations without recovery by up to 33 percentage points. Exergy analysis revealed that the greatest losses occur in heat exchangers and recuperators, underscoring the importance of improving thermal coupling between the working fluid and storage medium. Novotny et al. [14] reviewed the commercial development of Carnot batteries, emphasizing their role as medium- and long-duration storage solutions. Although their round-trip efficiency typically remains below 70%, low thermal storage costs and long lifetimes make them viable for storing surplus electricity for extended periods. Recent proposals, such as Linares et al. [15], integrate CSP with s-CO2 Brayton cycles, achieving efficiencies above unity when combined with solar heat sources and advanced heat exchanger designs.
Off-design performance studies by McTigue and Neises [16] and Wang et al. [17] highlight the operational flexibility of PTES systems under variable conditions, achieving efficiencies up to 74.47% in thermally integrated configurations. Liu et al. [18] developed a regenerative s-CO2 PTES system incorporating thermochemical storage and industrial waste heat recovery, reporting thermal and exergy efficiencies of 49.19% and 40.48%, respectively. Albay et al. [19] explored operational strategies for s-CO2 PTES systems integrated with wind farms, achieving average efficiencies near 46.5%. Yang and Du [20] analyzed an RBC-PTES system optimized using NSGA-II, reporting a round-trip efficiency of 70.75%, an energy density of 36.88 kWh/m3, and an LCOS of 0.108 $/kWh under optimal conditions. These findings confirm the potential of RBC-PTES configurations for large-scale, long-duration energy storage.
In PTES systems, the implementation of a thermodynamic cycle, particularly the s-CO2 storage cycle, offers significant advantages in terms of thermal efficiency, operation at high pressures and temperatures, equipment downsizing, and cost-effectiveness. These features make it an attractive option for large scale thermal energy storage. However, a comprehensive assessment of the thermo-economic performance of PTES systems requires a detailed analysis of alternative Brayton cycle topologies, such as the recompression configuration. In this context, key variables such as the mass fraction directed at the recompressor during charging and discharging processes, as well as the inlet temperature and pressure conditions of the compressor and the turbine inlet temperature, play a critical role in optimizing performance parameters such as round-trip efficiency and the LCOS. Therefore, this article focuses on the thermo-economic evaluation of a PTES system employing a supercritical carbon dioxide (s-CO2) recompression Brayton cycle.
A comprehensive parameterization is performed, incorporating the key design variables of the RBC-PTES system. Subsequently, optimal configurations are identified that balance energy efficiency, maximizing round-trip efficiency, and economic viability, minimizing the LCOS. Finally, an energy, entropic, and exergy analysis is performed under the optimal conditions. This allows for the quantification of irreversibilities in each system component, revealing how the parameters affect overall thermodynamic performance.
2. Approach
2.1. System Description
This study focuses on a pumped thermal energy storage (PTES) system based on a recompression Brayton cycle (RBC), coupled with a solar power tower, as shown in Figure 1.
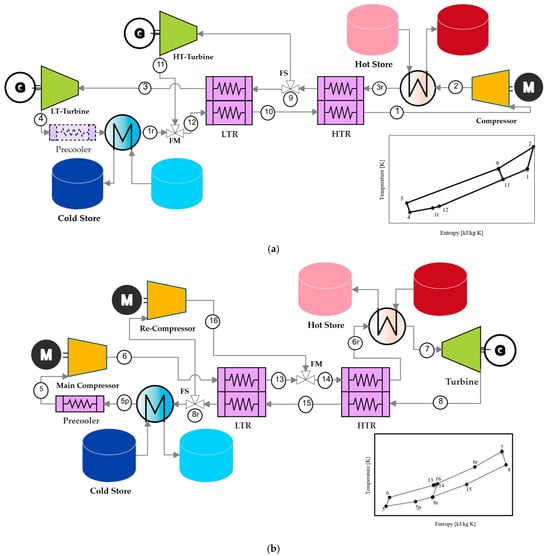
Figure 1.
RBC as PTES system. (a) charging stage and (b) discharging stage.
Figure 1a shows the RBC configuration during charging stage. The system includes a main compressor that increases the pressure and temperature of the working fluid (s-CO2). Two expansion turbines, HT-Turbine and LT-Turbine, enable staged expansion: the HT-Turbine receives the hottest, highest-pressure flow, while the LT-Turbine expands the remaining flow at reduced temperature and pressure. High- and low-temperature recuperators recover heat between streams to minimize external heating. During charging, surplus electricity drives the compressors, converting mechanical work into thermal energy stored in the hot tank via the hot-side heat exchanger.
Figure 1b shows the RBC configuration during discharge. Stored heat from the hot tank is transferred to the working fluid, driving turbine expansion stages. The turbine converts thermal energy into mechanical power, which is then transformed into electricity. The cycle includes two compressors: a main compressor and a recompressor, the latter bypassing the low-temperature recuperator to reduce exergy losses.
Recuperators maintain internal heat recovery between hot and cold streams, minimizing losses and stabilizing cycle performance. After expansion and recuperation, the cooled working fluid releases heat to the cold tank, completing the cycle. This configuration ensures high round-trip efficiency and operational flexibility for long-duration energy storage.
2.2. Input Assumptions
This analysis is based on specific assumptions summarized in Table 1, which lists the main input parameters and boundary conditions used in the thermodynamic simulations of the RBC-PTES system.
The discharge stage was defined as a net electrical power output of 10 MW. During the charging cycle, the compressor inlet pressures were optimized, while during the discharging cycle, these pressures ranged between 74 and 84 bar. Turbine inlet pressures were also optimized. Compressor inlet temperature was optimized during charging and varied between 305.1 K and 320.1 K during discharging. Turbine inlet temperature was optimized during charging and set between 773.2 K and 993.2 K during discharging. Component efficiencies were assumed constant at 0.80 for compressors and 0.85 for turbines, consistent with literature [21,22,23,24,25].
Pressure drops were assumed to be 1% of the inlet pressure across recuperators and precoolers [26,27]. Compression ratios for both charging and discharging stages were optimized. Split ratios were constrained to ensure a minimum temperature difference of 5 K at the pinch point [28], ranging from 0.06 to 0.25 during charging and 0.06 to 0.21 during discharging to maintain recuperator functionality.

Table 1.
Input assumptions.
Table 1.
Input assumptions.
| Parameter | Value | Units | |
|---|---|---|---|
| Net power discharge [29,30,31] | 10 | MW | |
| Compressor inlet pressure in charging stage | Optimized | bar | |
| Compressor inlet pressure in discharging stage | 74–84 | bar | |
| Turbine inlet pressure | Optimized | bar | |
| Compressor inlet temperature in charging stage | Optimized | K | |
| Compressor inlet temperature in discharging stage | 305.1–320.1 | K | |
| Turbine inlet temperature in charging stage | Optimized | K | |
| Turbine inlet temperature in discharging stage | 773.2–993.2 | K | |
| Compressor efficiency [21,22,23,24] | 0.80 | - | |
| Turbine efficiency [21,22,23,25] | 0.85 | - | |
| Charge compression ratio | Optimized | - | |
| Discharge compression ratio | Optimized | - | |
| Charge split ratio | 0.06–0.25 | - | |
| Discharge split ratio | 0.06–0.21 | - | |
| Pressure drops for recuperator [26,27] | 1 | % | |
| Pressure drops for precooler [26,27] | 1 | % | |
| Pinch point [28] | 5 | K |
The system was designed for a discharge power of 10 MW and a charging duration of 10 h. Discharge duration was not fixed but varied according to stored energy for each design configuration. The model operates under steady-state conditions; thermal losses and standby losses in storage tanks were not considered.
2.3. Working Fluid
The RBC employs supercritical carbon dioxide (s-CO2) as the working fluid. Figure 2 shows the variation of its thermophysical properties with temperature at different pressures relevant to Brayton cycle applications.
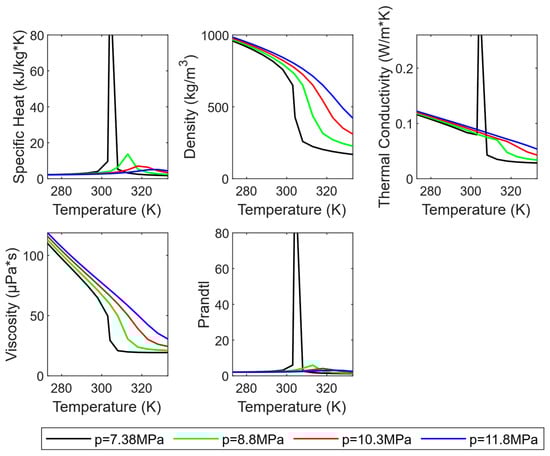
Figure 2.
Properties of CO2 as a function of temperature for different pressures [32].
This figure presents the variation of key thermophysical properties of pure CO2 with temperature at different operating pressures relevant to supercritical Brayton cycle applications.
The plots illustrate the specific heat capacity, density, thermal conductivity, viscosity, and Prandtl number within the temperature range of 275–330 K.
At the critical pressure (7.38 MPa), sharp peaks in specific heat and Prandtl number are observed in the vicinity of the critical temperature. These peaks reflect the strong sensitivity of CO2 properties near the phase transition [32]. As the pressure increases above the critical point (8.8–11.8 MPa), these anomalies become progressively smoothed, and the magnitude of property fluctuations decreases.
Density decreases monotonically with temperature, while thermal conductivity and viscosity exhibit moderate declines with rising temperature and pressure. Accurate characterization of these properties is essential for predicting heat transfer, fluid dynamics, and overall cycle performance.
2.4. Thermodynamic Analysis
The term “exergetic efficiency of the cycle” is defined as the ratio of the coefficient of performance (COP) of the heat pump to the equivalent Carnot COP of the cycle for the charge stage [31,33]. The formulation presented in Equation (1) is defined by.
In this context, the term is used to denote the equivalent Carnot COP of the cycle for the charge stage [31,33,34,35,36]. The calculation of this quantity is performed using the Equation (2).
Within the domain of the charging stage, the heat absorption temperature and the heat rejection temperature are represented by: , while respectively.
To use the above formula, it is necessary to obtain and using Equations (3) and (4).
As reported in previous literature [33,37], the exergy efficiency of the cycle in the discharge stage is defined by the following Equation (5), defined by the ratio between the thermal efficiency and the equivalent Carnot efficiency.
The value of denotes the equivalent Carnot efficiency of the cycle during its discharge stage [33,34,35,36,37]. This efficiency can be quantified by utilizing the following Equation (6).
In Equation (6), is used to denote the heat absorption temperature, and is used to denote the heat rejection temperature, both in the discharge stage. The values of these temperatures are determined by means of the following equations:
2.5. Costs Analysis
Costs were estimated using power-law correlations validated in previous studies [31,38]. To calculate the costs associated with the heat recuperators, turbine, compressors, gearbox, and generator, the Equations (9) and (10) were used.
where, and are the adjustment coefficients, denotes the scaling parameter, signifies the temperature correction factor determined by Equation (10) and represents the component cost
where represents the temperature breakpoint, which is typically set at 550 °C. The fit coefficients, and , are used to determine the maximum temperature rating of the component, .
The cited reference [31,38] provides the fitting coefficients and for the different components of the power cycle.
The costs of hot and cold storage tanks are calculated using Equations (11) and (12), respectively [39].
where and represents the volume of molten salt in the hot tank and the volume of water in the cold tank, respectively.
The levelized cost of electricity (LCOE) method was developed to facilitate the comparison of financial costs between electricity generation using renewable sources and conventional technologies. From this framework emerged the concept of LCOS, which adapts the LCOE methodology to evaluate energy storage systems [30,31], may be calculated utilizing the Equation (13), which has been validated in current scientific literature [40,41]:
Being the discount rate, the specific year of operation and the lifetime of the technology [5,42]. The initial investment cost (CAPEX) of the necessary equipment. In accordance with the limits outlined in the referenced material [43,44], the operating and maintenance costs (OPEX) have been calculated as 2.2% of CAPEX. The Equation (14) is used to calculate the energy produced over the course of a year, represented as .
where are the yearly discharge cycles, are the discharge hours of the plant and is the generator efficiency due to the energy production.
The round-trip efficiency, denoted as , can be calculated from the total electrical power consumed and produced during the discharge and charge stages, respectively [5,15,31,45], as shown in Equation (15).
In this investigation, the charging hours of the installation () are assumed to be constant [5,46]. Further research could benefit from an optimization of this parameter, as well as an investigation of the impact of on the LCOS of the plants. To calculate the LCOS, it is necessary to enter specific coefficients and parameters. Please refer to Table 2 for details.
Table 2.
Coefficients and parameters for LCOS calculation [31].
In this study, a comprehensive parameterization of the main design variables of the recompression Brayton cycle-based PTES system (RBC-PTES) was carried out to systematically explore their impact on the system’s thermodynamic behavior and techno-economic indicators. Simulations were performed using custom code implemented in MATLAB R2022a, while the thermophysical properties of the working fluid (pure CO2 and binary mixtures) were obtained using REFPROP v10 [32], accessed via a Python 3.9.12 wrapper. The computational procedure in its entirety is summarized in the flowchart presented in Figure 3.
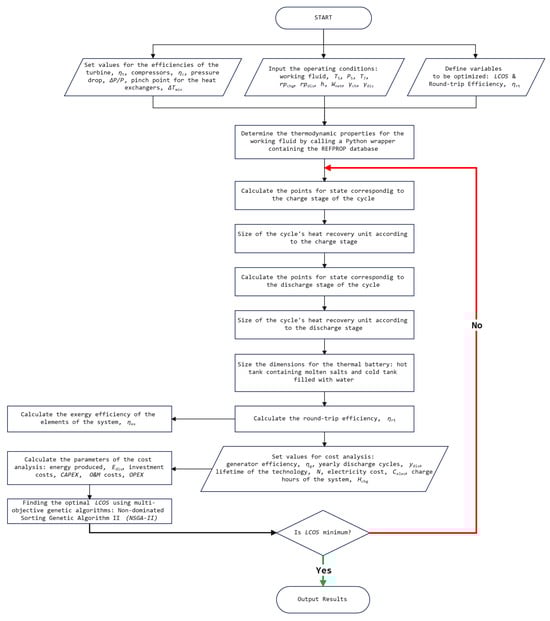
Figure 3.
Code flowchart for the development of parametrization.
3. Results and Discussion
The parametric study was performed through system simulations, analyzing the behavior of key operating variables (CIT, TIT, etc.) within their defined ranges (Table 1). Results are presented as scatter plots, where each point represents a simulation, enabling identification of trends, correlations, and optimal operating zones.
3.1. Compressor Intel Temperature Sensitive Analysis
3.1.1. Minimum LCOS
Figure 4 shows the effect of compressor inlet temperature (CIT) on RBC-PTES performance under the criterion of minimizing LCOS. In Figure 4a, round-trip efficiency () is observed to range from 0.53 to 0.60, with a slight decrease as the CIT increases. On the other hand, Figure 4b shows that LCOS progressively increases with CIT, starting from values close to 148 $/MWh and reaching up to 170 $/MWh. The scatter plot reflects the sensitivity of the system to operating conditions, highlighting that lower CIT values simultaneously allow for improved and reduced storage costs. The minimum LCOS (148.72 $/MWh) occurs at CIT of 307.1 K, with a round trip efficiency of 57.1%.
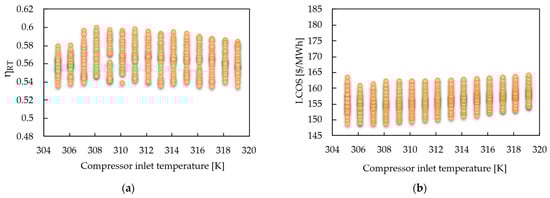
Figure 4.
Impact of Compressor inlet temperature. (a) Round-trip efficiency vs. CIT and (b) LCOS vs. CIT.
From a thermodynamic perspective, a lower CIT reduces the specific compression workload, thereby reducing associated irreversibilities and improving the system’s energy efficiency. This translates into higher and a direct reduction in LCOS. Conversely, as the CIT increases, the compressor must operate further from critical CO2 conditions, increasing exergy losses and generating higher energy storage costs. Consequently, CIT optimization is confirmed as a key factor in maximizing RBC-PTES performance, consolidating its position as one of the most influential design variables in overall system performance.
3.1.2. Maximum Round-Trip Efficiency
Figure 5 shows that, by prioritizing round-trip efficiency leads to values around 0.615, concentrated around CIT = 306.1 K (see Figure 5a). Operating close to the critical point reduces compression work and enhances recuperator performance [31,49], increasing overall efficiency. However, these conditions are associated with a slightly higher LCOS (158.4 $/MWh, see Figure 5b), confirming the trade-off between efficiency and cost.
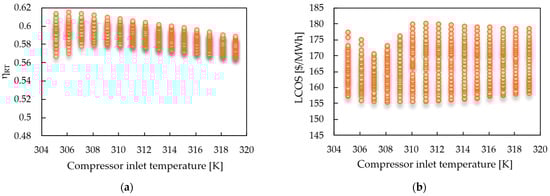
Figure 5.
Impact of Compressor inlet temperature. (a) Round-trip efficiency vs. CIT and (b) LCOS vs. CIT.
3.2. Turbine Inlet Temperature Sensitive Analysis
3.2.1. Minimum LCOS
Figure 6 presents a parametric analysis of the impact of turbine inlet temperature (TIT) on round-trip efficiency and LCOS. Both graphs were constructed as scatter points, allowing the density of the explored scenarios to be visualized in the design space. Figure 6a shows an increasing trend in with increasing TIT.
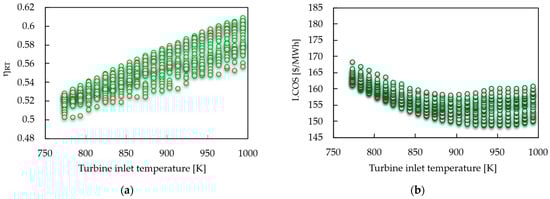
Figure 6.
Impact of turbine inlet temperature. (a) Round-trip efficiency vs. TIT and (b) LCOS vs. TIT.
The efficiency improvement is associated with greater available exergy in the turbine inlet flow, which reduces system irreversibility. However, this benefit does not translate linearly into economic terms. In Figure 6b, the LCOS exhibits a U-shaped curve, with a minimum value near TIT = 953.2 K, indicating an optimal point where efficiency gains offset the additional cost of high-temperature components.
3.2.2. Maximum Round-Trip Efficiency
Figure 7 presents a parametric sensitivity analysis of the system to variations in the TIT, using round-trip efficiency as the main optimization criterion.
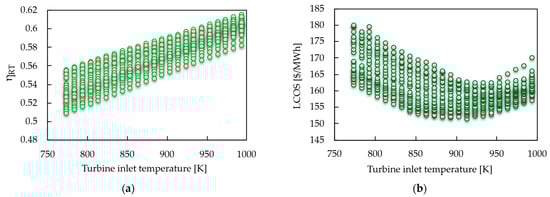
Figure 7.
Impact of turbine inlet temperature. (a) Round-trip efficiency vs. TIT and (b) LCOS vs. TIT.
As observed in Figure 7a, there is an increasing trend in with respect to TIT, indicating that higher turbine inlet temperatures increase overall system performance. An increase in TIT improves the system’s specific work and reduces entropy generation at the discharge stage. Figure 7b shows that the LCOS presents a “U” shape with respect to TIT. Although the LCOS initially decreases with increasing TIT due to greater efficiency and lower energy losses, it reaches a minimum value and then increases again. The optimum TIT, from the perspective of maximizing round trip efficiency, is at 993.2 K, with a , but with a compressor inlet pressure () of 77 bar, where system performance and cost remain balanced.
3.3. Compressor Inlet Pressure Sensitive Analysis
3.3.1. Minimum LCOS
Figure 8 shows the effect of discharged compressor inlet pressure (CIP) on round-trip efficiency and LCOS. The results indicate that while the CIP has a limited impact on remains within a narrow range between 0.53 and 0.592 (see Figure 8a), LCOS is clearly more sensitive. The lowest LCOS values, close to 148 $/MWh, are observed when the inlet pressure is between 74 and 77 bar (see Figure 8b), demonstrating that operating at lower pressures favors cost reduction. This behavior is associated with a decrease in compression work and, consequently, in cycle irreversibilities, thus improving economic performance even if the improvements in efficiency are relatively limited.
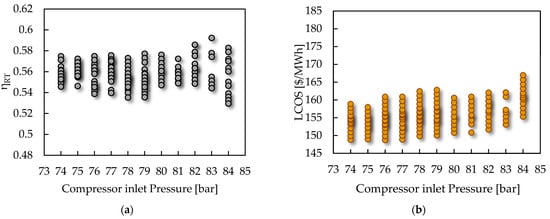
Figure 8.
Impact of compressor inlet pressure. (a) Round-trip efficiency vs. CIP and (b) LCOS vs. CIP.
3.3.2. Maximum Round-Trip Efficiency
Figure 9 presents the sensitivity of the compressor inlet pressure to and LCOS. The scatter plot in Figure 9a shows that efficiency reaches its maximum value, around 61.2%, when the inlet pressure is maintained between 75 and 79 bar. However, as the pressure increases above this range, efficiency tends to gradually decrease, reflecting an increase in the irreversibilities associated with the compression process and, therefore, lower energy consumption of the cycle. In parallel, Figure 9b shows that this thermodynamic behavior leads to a significant increase in LCOS, which grows steadily with pressure. This implies that maximizing round-trip efficiency requires operating at moderate compressor inlet pressures, even at the expense of incurring relatively lower storage costs, but without compromising overall system performance.
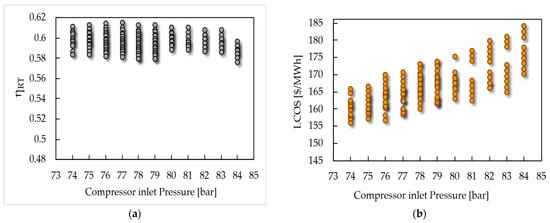
Figure 9.
Impact of compressor inlet pressure. (a) Round-trip efficiency vs. CIP and (b) LCOS vs. CIP.
3.4. Charging Mass Fraction Sensitive Analysis
3.4.1. Minimum LCOS
Figure 10 presents a scatter plot illustrating the effect of the charge mass fraction () on round-trip efficiency and LCOS. This parameter regulates the mass flow distribution between the high and low-pressure turbine lines of the RBC-PTES system during charging stage, directly affecting the enthalpy available for subsequent energy recovery. In Figure 10a, a slight increase in the is observed with increasing , due to better exploitation of the pressure gradient, although with a notable dispersion indicating sensitivity to other system parameters. However, in Figure 10b, the LCOS behavior shows a clear minimum at , with a , a , and a bar, suggesting an optimal branching ratio that balances compression and expansion costs within the system.
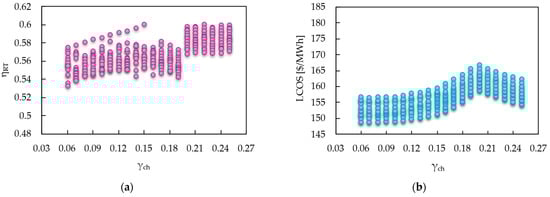
Figure 10.
Impact of charging mass fraction. (a) Round-trip efficiency vs. and (b) LCOS vs. .
3.4.2. Maximum Round-Trip Efficiency
In the analysis presented in Figure 11a, a positive correlation is observed between and the round-trip efficiency, with an increasing and slightly curvilinear behavior.
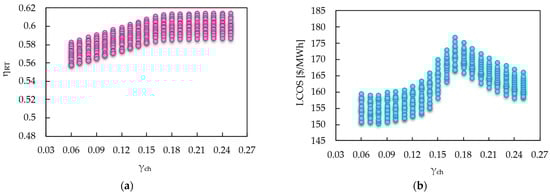
Figure 11.
Impact of charging mass fraction. (a) Round-trip efficiency vs. and (b) LCOS vs. .
In this sense, a greater proportion of fluid directed toward the high-pressure turbine in charging stage allows for better utilization of the enthalpy gradient, which translates into greater energy recovery capacity during the charging stage. That is, as increases, a higher pressure is reached in the charging system, which improves heat transfer in the exchangers and increases the network recovered during unloading. In contrast, Figure 11b reveals that the LCOS exhibits an increasing trend with respect to , albeit with an apparent minimum near (consistent with Figure 10b). This increase in LCOS can be attributed to the additional energy cost associated with handling higher flow rates in the high-pressure turbine, which increases electrical demand during the load phase and, consequently, LCOS. The maximum round-trip efficiency of 61.5% is achieved with a of 0.25 and a .
This analysis highlights the importance of optimally selecting the according to the design objective, whether maximizing system efficiency or minimizing storage costs. The ideal operating point will not be the same depending on whether the system is designed to maximize energy recovery or to ensure economic competitiveness against alternative technologies.
3.5. Discharging Mass Fraction Sensitive Analysis
3.5.1. Minimum LCOS
The mass fraction represents the fraction of fluid diverted to the recompressor during the discharge stage of the RBC-PTES system. As shown in Figure 12, the optimal value to minimize the LCOS is . At this point, the system achieves a favorable balance between energy efficiency and operating costs derived from recompression work. A lower direct bypass to the recompressor implies a higher proportion of fluid directed to the main compressor, which increases irreversibilities due to entropy generation, decreases round-trip efficiency, and increases the LCOS.
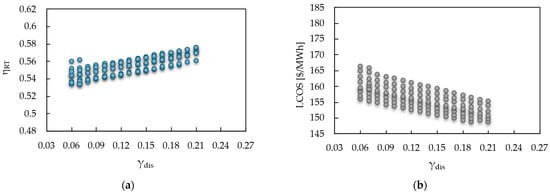
Figure 12.
Impact of discharging mass fraction. (a) Round-trip efficiency vs. and (b) LCOS vs. .
3.5.2. Maximum Round-Trip Efficiency
Figure 13a shows that as increases, the round-trip efficiency increases steadily. The optimal value that maximizes is 0.21, which represents a favorable operating condition for harnessing stored energy. This behavior can be explained by better management of the entropy flow within the discharge stage. By allowing a larger fraction of the fluid to be redirected to the recompressor, the generation of irreversibilities associated with entropy generation in these components is reduced. This strategy improves the system’s exergy efficiency by reducing thermal losses during expansion and recompression. Figure 13b shows how the LCOS varies as a function of the mass fraction directed at the recompressor in unloading mode. As increases, the LCOS decreases steadily, reaching a minimum in , indicating that this value represents a favorable operating point from an economic perspective.
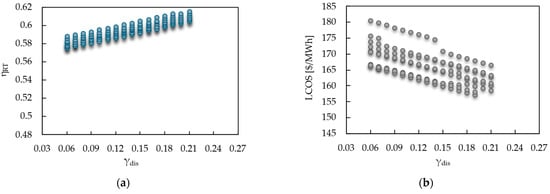
Figure 13.
Impact of discharging mass fraction. (a) Round-trip efficiency vs. and (b) LCOS vs. .
3.6. Three-Dimensional Sensitivity Analysis
3.6.1. Minimum LCOS
Figure 14 shows the influence of two parameters: the mass fraction directed to the high-pressure turbine () and the mass fraction directed to the recompressor () on the LCOS of the RBC-PTES system. Results indicate the LCOS progressively decreases as increases, reaching its minimum value of 148.72 $/MWh in the region where the high values of and coincide. This demonstrates that reducing irreversible losses during the compression and heat transfer process at the loading stage is key to improving the economic competitiveness of the system.
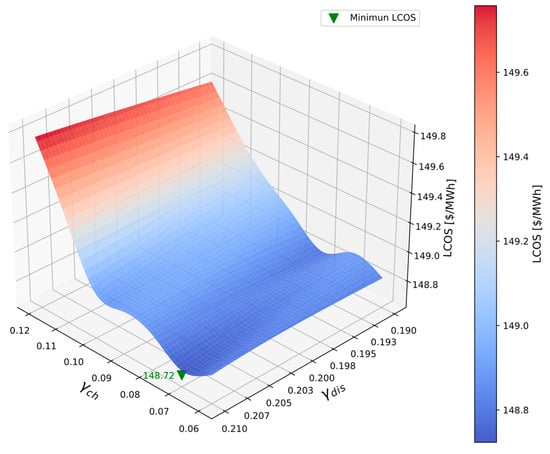
Figure 14.
Impact of the charging and discharging split ratio on LCOS.
3.6.2. Maximizing Round-Trip Efficiency
Figure 15 presents the optimization surface corresponding to the round-trip efficiency () as a function of the mass fractions during charging () and discharging (). The maximum efficiency point, identified as , is attained for and .
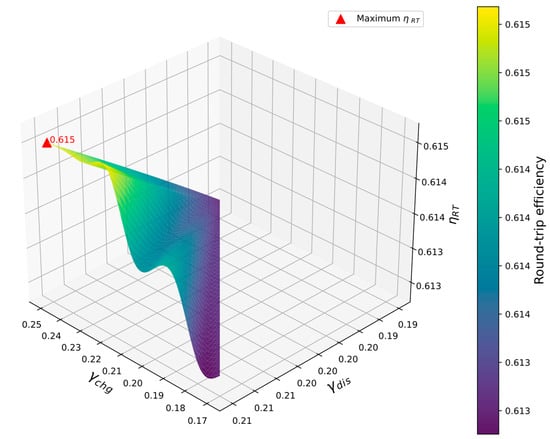
Figure 15.
Impact of the charging and discharging split ratio on Round-trip efficiency.
The general trend of the graph indicates that the efficiency is sensitive to variations in the mass fraction during the charging process, while the influence of discharging is less pronounced near the optimum value. This phenomenon can be interpreted as indicative of the predominant impact of flow balance during the recompression stage on the reduction of overall irreversibility. Within the range of analyzed values, an increase in is conducive to enhanced energy recovery in the heat recuperator, thereby mitigating losses associated with thermal gradients. However, the observation that the optimal condition for remains constant at approximately 0.21 indicates that the potential for enhancement during expansion is comparatively constrained, with compression work emerging as the pivotal variable for enhancing efficiency.
3.7. Exergy Efficiency Comparison
Figure 16 presents the comparative analysis of the exergy efficiency of the main components of the RBC-PTES system under two optimization criteria: minimization of the LCOS (Figure 16a,b) and maximization of the round-trip efficiency (Figure 16c,d). In the case of LCOS oriented minimum optimization, results indicate during the loading phase (Figure 16a), the hot tank reaches efficiencies close to unity, while the cold tank presents the highest irreversibility, with significantly lower values. The heat recuperators (LTR and HTR) maintain high and stable efficiencies, indicating reliable performance in heat recovery and transfer. During the unloading phase (Figure 16b), the trend continues: the tanks are the most contrasting components, while the turbine and recuperators present efficiencies above 90%, contributing to the stability of cycle.
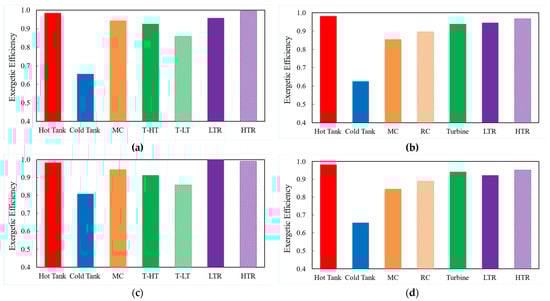
Figure 16.
Exergy efficiency. (a) Exergy Efficiency at LCOS minimum and charge stage, (b), Exergy Efficiency at LCOS minimum and discharge stage, (c) Exergy Efficiency at round-trip efficiency maximum and charge stage (d) Exergy Efficiency at round-trip efficiency maximum and discharge stage.
On the other hand, when the objective is to maximize round-trip efficiency, a general improvement in the exergy efficiency of almost all components is observed, particularly in the cold tank, whose exergy penalty is significantly reduced compared to the minimum LCOS scenario. Furthermore, both during charging and discharging, the recuperators (LTR and HTR) achieve efficiencies close to unity, demonstrating greater effectiveness in exploiting thermal gradients. The turbine also shows a slight increase in efficiency compared to the minimum LCOS case, reflecting better utilization of the working potential.
Optimization to minimize LCOS prioritizes cost reduction, but at the expense of greater irreversibility in certain critical components, such as the cold tank. Conversely, optimization aimed at maximum round-trip efficiency results in more balanced energy use among subsystems, improving the overall efficiency of the RBC-PTES system, although with a potential impact on increased efficiency costs.
3.8. Exergy Destruction Comparison
Figure 17 presents a comparative analysis of distributed exergy destruction by component in the charging (Figure 17a,c) and discharging (Figure 17b,d) modes of the RBC-PTES system, under two optimization criteria: minimum LCOS (top) and maximum round-trip efficiency (bottom). This comparison allows identifying the key components responsible for the greatest irreversibilities.
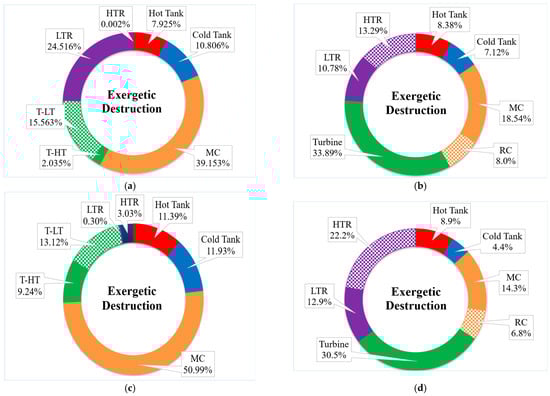
Figure 17.
Exergy Destruction. (a) Exergy Destruction at LCOS minimum and charge stage, (b), Exergy Destruction at LCOS minimum and discharge stage, (c) Exergy Destruction at round-trip efficiency maximum and charge stage (d) Exergy Destruction at round-trip efficiency maximum and discharge stage.
In charge stage (Figure 17a), the Main Compressor (MC) accounts for the greatest exergy loss (39%), followed by the LTR (24%), and the low-pressure turbine (L-LT) (16%), reflecting that compression is the main generator of irreversibilities and a key factor in the LCOS. These losses could be reduced by improving isentropic efficiency or incorporating an intercooler. In discharge stage (Figure 17b), the turbine (34%), the HTR (13%), and, again, the MC (19%) stand out, indicating that thermal irreversibilities due to poorly utilized gradients are significant. This highlights the importance of better thermal integration to minimize losses during energy recovery.
By maximizing round-trip efficiency, the exergy destruction profile changes considerably. In charging stage (Figure 17c), the MC accounts for 51% of the irreversibilities, reflecting the higher compressive stress required to improve recovery efficiency. This demonstrates a trade-off between efficiency and internal losses, where higher efficiency requires greater specific work per unit of heat stored. In discharging stage (Figure 17d), a redistribution of losses is observed: the HTR (22%) and LTR (13%) increase in importance, while the turbine retains a significant share (31%). This indicates that, under high-efficiency conditions, losses due to thermal gradients and mismatches in the recuperators intensify, resulting from greater utilization of low-exergy sensible heat.
The analysis demonstrates the need for careful selection of optimization criteria, as loss mechanisms vary considerably depending on the objective. It also highlights the importance of specific improvement strategies for equipment with the highest destruction rates, such as compressors and recuperators, to achieve simultaneous improvements in cost and efficiency.
A comparison of the system performance indicators is presented in Figure 18, considering the energy and exergy analyses. On the one hand, when the system behaves as a power cycle (discharge stage) the thermal efficiency is 45.2%, while the Carnot equivalent efficiency is 59.8%, indicating the existence of irreversible losses mainly associated with non-ideal compression and expansion processes. Exergy efficiency presents a significantly higher value (75.5%), reflecting a better representation of the quality of the transformed energy. On the other hand, in the case of the system operating as a heat pump (charge stage), the coefficient of performance (COP) reaches 1.26, while its Carnot equivalent is close to 1.55. However, when analyzed from an exergy perspective, the value obtained (81.2%) reveals that, although the system exhibits good energy efficiency, thermodynamic irreversibilities continue to limit its approximation to ideal behavior.
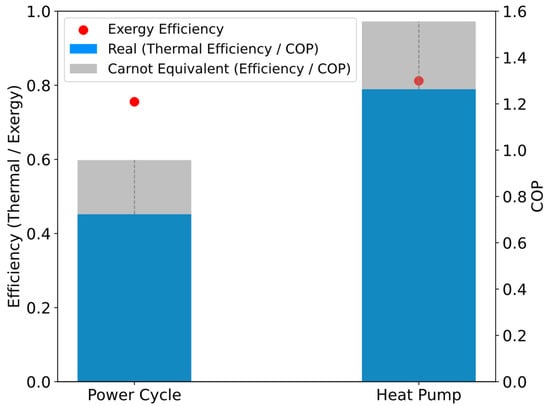
Figure 18.
Comparison of thermodynamic and exergy performance indicators of the RBC-PTES system.
3.9. PTES System Performance Comparison
As demonstrated in Table 3, the investigation has drawn upon a range of sources, each of which has made a distinct contribution to the overall understanding of the subject. In their work, Yang and Du [20] hypothesized that the efficiencies of the turbomachines employed in this study are higher than those observed in the present research. Consequently, round-trip efficiency is enhanced.
Table 3.
Performance comparison of PTES system.
4. Conclusions
This study presents a thermo-economic evaluation of a pumped thermal energy storage (PTES) system based on a recompression Brayton cycle with supercritical CO2 (s-CO2). A comprehensive parameterization of key design variables including mass fractions for recompression, compressor inlet conditions, and turbine inlet temperature was conducted to identify configurations that maximize round-trip efficiency and minimize the levelized cost of storage (LCOS). Additionally, the impact of irreversibilities in major components was assessed through energy, entropy, and exergy analyses.
The results reveal a trade-off between economic and thermodynamic performance (Table 4). Minimizing LCOS yields 148.72 $/MWh with a round-trip efficiency of 57.1%, while maximizing efficiency achieves 61.5% at an LCOS of 158.4 $/MWh. These outcomes are primarily influenced by compressor inlet pressure (76–77 bar), turbine inlet temperature (953.2–993.2 K), and charging mass fraction (0.07–0.25). Overall, optimized operation enables a balanced compromise between cost and efficiency, confirming the technical feasibility of the recompression Brayton cycle for long-duration thermal storage.
Table 4.
Multiparameter optimization results of PTES system.
The choice of optimization criterion significantly affects thermodynamic and exergy performance. Minimizing LCOS prioritizes cost reduction but increases irreversibilities in the cold tank and main compressor. Conversely, maximizing round-trip efficiency improves overall component performance, particularly in critical areas such as the cold tank and recuperators, which approach near-ideal efficiency. However, this improvement entails higher exergy destruction in the main compressor, highlighting the trade-off between efficiency and internal losses.
5. Future Work
Future work should focus on RBC-PTES systems using binary and ternary s-CO2 mixtures as working fluids to enhance thermodynamic performance. Additionally, dynamic simulations are needed to evaluate optimal configurations under real operating conditions, considering thermal stratification, standby losses, and parasitic effects in storage tanks. Integration with renewable energy sources and advanced heat exchanger technologies also represents a promising avenue for improving system efficiency and reducing LCOS.
Author Contributions
Conceptualization, P.T.-E., F.C.-O. and R.V.-C.; methodology, R.V.-C.; software, R.V.-C.; validation, J.M.-A.; formal analysis, P.T.-E., F.C.-O., L.G.-P. and R.V.-C.; investigation, F.C.-O. and S.A.-T.; resources, J.M.-A.; data curation, P.T.-E. and R.V.-C.; writing—original draft preparation, P.T.-E., F.C.-O., L.G.-P. and S.A.-T.; writing—review and editing, R.V.-C. and J.M.-A.; visualization, P.T.-E., F.C.-O. and L.G.-P.; supervision, J.M.-A. All authors have read and agreed to the published version of the manuscript.
Funding
The authors wish to thank “Comunidad de Madrid” for the financial support to ACES4NET0-CM project (TEC-2024/ECO-116), through the R&D activities programme “Tecnologías 2024”.
Data Availability Statement
Data will be made available on request.
Acknowledgments
The authors are indebted to the Thermal Energy for Sustainability (TE4S) Research Group at the Universidad Politécnica de Madrid for the invaluable support provided. In addition, the authors would like to express their profound gratitude to the FOCAPRO and GICFOR Research Groups at the Universidad Técnica del Norte for their indispensable contributions to this research.
Conflicts of Interest
The authors declare no conflicts of interest.
Abbreviations
The following abbreviations are used in this manuscript:
| CAPEX | Capital cost, M$ |
| Compressor inlet pressure, MPa | |
| Compressor inlet temperature, K | |
| Coefficient of performance | |
| Equivalent Carnot coefficient of performance | |
| LCOS | Levelized cost of storage, $/MWh |
| NSGA-II | Non-dominated Sorting Genetic Algorithm II |
| OPEX | Operational and maintenance cost, M$ |
| PTES | Pumped thermal energy storage |
| REFPROP | Reference fluid properties |
| RBC | Recompression Brayton cycle |
| s-CO2 | Supercritical carbon dioxide |
| Scaling parameter | |
| Turbine inlet temperature, K | |
| Molten salts | |
| Water | |
| Greek symbols | |
| Split ratio | |
| Compressor efficiency | |
| Equivalent Carnot efficiency | |
| Exergetic efficiency | |
| Generator efficiency | |
| Round-trip efficiency | |
| Turbine efficiency | |
| Thermal efficiency | |
| Entropic generation, W/K | |
| Roman symbols | |
| Cost, USD | |
| Specific exergy, J/kg | |
| Exergy destruction rate, kW | |
| Temperature correction factor | |
| Hours of operation of the plant, h | |
| Specific enthalpy, J/kg | |
| Mass flow rate, kg/s | |
| Lifetime of technology, years | |
| Specific year of operation | |
| Pressure, MPa | |
| Heat, W | |
| Discount rate | |
| Compression ratio | |
| Specific entropy, J/kg·K | |
| Temperature, K | |
| Volume, m3 | |
| Yearly cycles |
References
- Hao, Y.; Khan, I. Impact of decarbonization enablers, energy supply between transition and disruption, on renewable energy development. Energy 2025, 324, 135863. [Google Scholar] [CrossRef]
- Rekioua, D. Energy Storage Systems for Photovoltaic and Wind Systems: A Review. Energies 2023, 16, 3893. [Google Scholar] [CrossRef]
- Selänniemi, A.; Hellström, M.; Björklund-Sänkiaho, M. Long-Duration Energy Storage—A Literature Review on the Link between Variable Renewable Energy Penetration and Market Creation. Energies 2024, 17, 3779. [Google Scholar] [CrossRef]
- Sharma, R.; Kumar, H.; Kumar, G.; Sharma, S.; Aneja, R.; Sharma, A.K.; Kumar, R.; Kumar, P. Progress and challenges in electrochemical energy storage devices: Fabrication, electrode material, and economic aspects. Chem. Eng. J. 2023, 468, 143706. [Google Scholar] [CrossRef]
- Tafur-Escanta, P.; Valencia-Chapi, R.; López-Guillem, M.; Fierros-Peraza, O.; Muñoz-Antón, J. Electrical energy storage using a supercritical CO2 heat pump. Energy Rep. 2022, 8, 502–507. [Google Scholar] [CrossRef]
- Held, T.; Miller, J.; Mallinak, J.; Avadhanula, V.; Magyar, L. Pilot-Scale Testing of a Transcritical CO2-Based Pumped Thermal Energy Storage System. In Turbo Expo: Power for Land, Sea, and Air, Proceedings of the ASME Turbo Expo 2024: Turbomachinery Technical Conference and Exposition, London, UK, 24–28 June 2024; The American Society of Mechanical Engineers: New York, NY, USA, 2024. [Google Scholar] [CrossRef]
- Rabi, A.M.; Radulovic, J.; Buick, J.M. Pumped Thermal Energy Storage Technology (PTES): Review. Thermo 2023, 3, 396–411. [Google Scholar] [CrossRef]
- Zhao, Y.; Song, J.; Liu, M.; Zhang, K.; Markides, C.N.; Yan, J. Multi-objective thermo-economic optimisation of Joule-Brayton pumped thermal electricity storage systems: Role of working fluids and sensible heat storage materials. Appl. Therm. Eng. 2023, 223, 119972. [Google Scholar] [CrossRef]
- Frate, G.F.; Ferrari, L.; Desideri, U. Techno-Economic Comparison of Brayton Pumped Thermal Electricity Storage (PTES) Systems Based on Solid and Liquid Sensible Heat Storage. Energies 2022, 15, 9595. [Google Scholar] [CrossRef]
- Cascetta, M.; Licheri, F.; Merchán, R.P.; Petrollese, M. Operating performance of a Joule-Brayton pumped thermal energy storage system integrated with a concentrated solar power plant. J. Energy Storage 2023, 73, 108865. [Google Scholar] [CrossRef]
- Benato, A.; Stoppato, A. Pumped Thermal Electricity Storage: A Technology Overview; Elsevier Ltd.: Amsterdam, The Netherlands, 2018. [Google Scholar] [CrossRef]
- McTigue, J.; Farres-Antunez, P.; Ellingwood, K.; Neises, T.; White, A. Pumped thermal electricity storage with supercritical CO2 cycles and solar heat input. In Proceedings of the VII International Young Researchers’ Conference—Physics, Technology, Innovations (PTI-2020), Ekaterinburg, Russia, 18–22 May 2020; AIP Publishing: Melville, NY, USA, 2020; p. 190024. [Google Scholar] [CrossRef]
- Sun, R.; Zhao, Y.; Liu, M.; Yan, J. Thermodynamic design and optimization of pumped thermal electricity storage systems using supercritical carbon dioxide as the working fluid. Energy Convers. Manag. 2022, 271, 116322. [Google Scholar] [CrossRef]
- Novotny, V.; Basta, V.; Smola, P.; Spale, J. Review of Carnot Battery Technology Commercial Development. Energies 2022, 15, 647. [Google Scholar] [CrossRef]
- Linares, J.I.; Martín-Colino, A.; Arenas, E.; Montes, M.J.; Cantizano, A.; Pérez-Domínguez, J.R. Carnot Battery Based on Brayton Supercritical CO2 Thermal Machines Using Concentrated Solar Thermal Energy as a Low-Temperature Source. Energies 2023, 16, 3871. [Google Scholar] [CrossRef]
- McTigue, J.; Neises, T. Off-design operation and performance of pumped thermal energy storage. J. Energy Storage 2024, 99, 113355. [Google Scholar] [CrossRef]
- Wang, P.; Li, Q.; Wang, S.; He, C.; Wu, C. Off-design performance evaluation of thermally integrated pumped thermal electricity storage systems with solar energy. Energy Convers. Manag. 2024, 301, 118001. [Google Scholar] [CrossRef]
- Liu, H.; Zhang, Y.; Xu, Q.; Han, W.; Shen, J. A Carnot battery system integrating ca(OH)2/CaO thermochemical energy storage and supercritical CO2 cycles for long-term energy storage and residential heat supply. Appl. Energy 2025, 377, 124535. [Google Scholar] [CrossRef]
- Albay, A.; Zhu, Z.; Mercangöz, M. Optimization-based state-of-charge management strategies for supercritical CO2 Brayton cycle pumped thermal energy storage systems. J. Energy Storage 2025, 111, 115387. [Google Scholar] [CrossRef]
- Yang, H.; Du, X. Thermo-economic analysis and multi-objective optimization of pumped thermal electricity storage system with S-CO2 recompression Brayton cycle. J. Energy Storage 2025, 124, 116821. [Google Scholar] [CrossRef]
- Wang, K.; Li, M.J.; Guo, J.Q.; Li, P.; Liu, Z.B. A systematic comparison of different S-CO2 Brayton cycle layouts based on multi-objective optimization for applications in solar power tower plants. Appl. Energy 2018, 212, 109–121. [Google Scholar] [CrossRef]
- Ma, Y.N.; Hu, P.; Jia, C.Q.; Wu, Z.R.; Chen, Q. Thermo-economic analysis and multi-objective optimization of supercritical Brayton cycles with CO2-based mixtures. Appl. Therm. Eng. 2023, 219, 119492. [Google Scholar] [CrossRef]
- Valencia-Chapi, R.; Coco-Enríquez, L.; Muñoz-Antón, J. Supercritical CO2 Mixtures for Advanced Brayton Power Cycles in Line-Focusing Solar Power Plants. Appl. Sci. 2020, 10, 55. [Google Scholar] [CrossRef]
- Song, J.; Wang, Y.; Wang, J.; Markides, C.N. Optimal design of supercritical CO2 (s-CO2) cycle systems for internal combustion engine (ICE) waste-heat recovery considering heat source fluctuations. In Proceedings of the European sCO2 Conference, DuEPublico—Duisburg-Essen Publications Online, Online, 23–24 March 2021; pp. 205–211. [Google Scholar] [CrossRef]
- Thada, S.; Pradeep, A.M.; Sridharan, A. Preliminary aerodynamic design of a supercritical carbon dioxide Compressor Impeller for Waste Heat Recovery Applications. In Proceedings of the European sCO2 Conference, DuEPublico—Duisburg-Essen Publications Online, Online, 23–24 March 2021; pp. 154–163. [Google Scholar] [CrossRef]
- Siddiqui, M.E.; Taimoor, A.A.; Almitani, K.H. Energy and exergy analysis of the S-CO2 Brayton cycle coupled with bottoming cycles. Processes 2018, 6, 153. [Google Scholar] [CrossRef]
- Zhang, R.; Su, W.; Lin, X.; Zhou, N.; Zhao, L. Thermodynamic analysis and parametric optimization of a novel S–CO2 power cycle for the waste heat recovery of internal combustion engines. Energy 2020, 209, 118484. [Google Scholar] [CrossRef]
- Wang, K.; Shi, X.; He, Q. Thermodynamic analysis of novel carbon dioxide pumped-thermal energy storage system. Appl. Therm. Eng. 2024, 255, 123969. [Google Scholar] [CrossRef]
- Parisi, S.; Desai, N.B.; Haglind, F. Techno-Economic Analysis of Using Reversible Turbomachinery for Pumped Thermal Energy Storage Systems. J. Sol. Energy Eng. Trans. ASME 2024, 146, 051003. [Google Scholar] [CrossRef]
- Smallbone, A.; Jülch, V.; Wardle, R.; Roskilly, A.P. Levelised Cost of Storage for Pumped Heat Energy Storage in comparison with Other Energy Storage Technologies. Energy Convers. Manag. 2017, 152, 221–228. [Google Scholar] [CrossRef]
- Valencia-Chapi, R.; Tafur-Escanta, P.; Muñoz-Antón, J. Exergetic-cost analysis of pumped thermal energy storage (PTES) systems using s-CO2 mixtures as a working fluid. J. Energy Storage 2025, 139, 118952. [Google Scholar] [CrossRef]
- Huber, M.L.; Lemmon, E.W.; Bell, I.H.; McLinden, M.O. The NIST REFPROP Database for Highly Accurate Properties of Industrially Important Fluids. Ind. Eng. Chem. Res. 2022, 61, 15449–15472. [Google Scholar] [CrossRef]
- Çengel, Y.; Boles, M.; Kanoglu, M. Thermodynamics: An Engineering Approach, 10th ed.; McGraw Hill: New York, NY, USA, 2024; Available online: https://www.mheducation.com/highered/product/thermodynamics-an-engineering-approach-cengel.html (accessed on 10 February 2025).
- Tafur-Escanta, P.; López-Paniagua, I.; Muñoz-Antón, J. Thermodynamics Analysis of the Supercritical CO2 Binary Mixtures for Brayton Power Cycles. Energy 2023, 270, 126838. [Google Scholar] [CrossRef]
- Nieto-Carlier, R.; Gonzalez-Fernandez, C.; Lopez-Paniagua, I.; Jimenez-Alvaro, A.; Rodriguez-Marin, J. Termodinámica; Dextra Editorial S.L.: Madrid, Spain, 2014. [Google Scholar]
- Winterbone, D.E.; Turan, A. Advanced Thermodynamics for Engineers, 2nd ed.; Elsevier Ltd.: Amsterdam, The Netherlands, 2015. [Google Scholar]
- Sharma, O.P.; Kaushik, S.C.; Manjunath, K. Thermodynamic analysis and optimization of a supercritical CO2 regenerative recompression Brayton cycle coupled with a marine gas turbine for shipboard waste heat recovery. Therm. Sci. Eng. Prog. 2017, 3, 62–74. [Google Scholar] [CrossRef]
- Weiland, N.T.; Lance, B.W.; Pidaparti, S.R. SCO2 power cycle component cost correlations from DOE data spanning multiple scales and applications. In Proceedings of the ASME Turbo Expo, American Society of Mechanical Engineers (ASME), Phoenix, AZ, USA, 17–21 June 2019. [Google Scholar] [CrossRef]
- Delise, T.; Tizzoni, A.; Menale, C.; Telling, M.; Bubbico, R.; Crescenzi, T.; Corsaro, N.; Sau, S.; Licoccia, S. Technical and economic analysis of a CSP plant presenting a low freezing ternary mixture as storage and transfer fluid. Appl. Energy 2020, 265, 114676. [Google Scholar] [CrossRef]
- Schmidt, O.; Melchior, S.; Hawkes, A.; Staffell, I. Projecting the Future Levelized Cost of Electricity Storage Technologies. Joule 2019, 3, 81–100. [Google Scholar] [CrossRef]
- Bodner, J.; Koksharov, J.; Dammel, F.; Stephan, P. Analysis of low-temperature pumped thermal energy storage systems based on a transcritical CO2 charging process. Energy Sci. Eng. 2023, 11, 3289–3306. [Google Scholar] [CrossRef]
- Zhang, Y.; Yin, S.; Yan, X.; Liu, Z. Performance of a CO2-based mixture cycled transcritical pumped thermal energy storage system. Renew Energy 2025, 238, 121893. [Google Scholar] [CrossRef]
- McTigue, J.D.; Farres-Antunez, P.; Sundarnath, J.K.; Markides, C.N.; White, A.J. Techno-economic analysis of recuperated Joule-Brayton pumped thermal energy storage. Energy Convers. Manag. 2021, 252, 115016. [Google Scholar] [CrossRef]
- Georgiou, S.; Shah, N.; Markides, C.N. A thermo-economic analysis and comparison of pumped-thermal and liquid-air electricity storage systems. Appl. Energy 2018, 226, 1119–1133. [Google Scholar] [CrossRef]
- Barberis, S.; Maccarini, S.; Shamsi, S.S.M.; Traverso, A. Untapping Industrial Flexibility via Waste Heat-Driven Pumped Thermal Energy Storage Systems. Energies 2023, 16, 6249. [Google Scholar] [CrossRef]
- McTigue, J.D.; Farres-Antunez, P.; Neises, T.; White, A. Supercritical CO2 Heat Pumps and Power Cycles for Concentrating Solar Power. In Proceedings of the 26th SolarPACES Conference, Almería, Spain, 28 September–2 October 2020; Available online: https://www.nrel.gov/docs/fy21osti/77955.pdf (accessed on 10 February 2025).
- Jülch, V. Comparison of electricity storage options using levelized cost of storage (LCOS) method. Appl. Energy 2016, 183, 1594–1606. [Google Scholar] [CrossRef]
- Ökten, K.; Kurşun, B. Thermo-economic assessment of a thermally integrated pumped thermal energy storage (TI-PTES) system combined with an absorption refrigeration cycle driven by low-grade heat source. J. Energy Storage 2022, 51, 104486. [Google Scholar] [CrossRef]
- Tafur-Escanta, P.; Valencia-Chapi, R.; López-Paniagua, I.; Coco-Enríquez, L.; Muñoz-Antón, J. Supercritical CO2 binary mixtures for recompression brayton s-CO2 power cycles coupled to solar thermal energy plants. Energies 2021, 14, 4050. [Google Scholar] [CrossRef]
Disclaimer/Publisher’s Note: The statements, opinions and data contained in all publications are solely those of the individual author(s) and contributor(s) and not of MDPI and/or the editor(s). MDPI and/or the editor(s) disclaim responsibility for any injury to people or property resulting from any ideas, methods, instructions or products referred to in the content. |
© 2025 by the authors. Licensee MDPI, Basel, Switzerland. This article is an open access article distributed under the terms and conditions of the Creative Commons Attribution (CC BY) license (https://creativecommons.org/licenses/by/4.0/).