Abstract
Crystallization is a fundamental unit operation in chemical, pharmaceutical, and energy industries, where strict control of crystal size distribution (CSD) is essential for ensuring product quality and process efficiency. However, the nonlinear dynamics of crystallization and the absence of explicit functional relationships between process variables make effective control a significant challenge. This study proposes a hybrid approach that integrates process tomography with deep reinforcement learning (RL) for adaptive crystallization control. A dedicated hybrid tomographic system, combining Electrical Impedance Tomography (EIT) and Ultrasound Tomography (UST), was developed to provide complementary real-time spatial information, while a ResNet neural network enabled accurate image reconstruction. These data were used as input to a reinforcement learning agent operating in a Simulink-based simulation environment, where temperature was selected as the primary controlled variable. To evaluate the applicability of RL in this context, four representative algorithms: Actor–Critic, Asynchronous Advantage Actor–Critic, Proximal Policy Optimization (PPO), and Trust Region Policy Optimization, were implemented and compared. The results demonstrate that PPO achieved the most stable and effective performance, ensuring improved control of CSD and improved control proxies consistent with potential energy savings. The findings confirm that hybrid tomographic imaging combined with RL-based control provides a promising pathway toward sustainable, intelligent crystallization processes with enhanced product quality and energy efficiency.
1. Introduction
1.1. Background and Related Work
Crystallization remains a key separation technique in the chemical, energy, and pharmaceutical industries. It is central to defining the final product by controlling particle attributes such as size, shape, and purity. These attributes directly influence both downstream processing and the end-use performance of the material [1,2,3]. Because large-scale crystallizers are among the most energy-intensive assets in solids processing, improving control of crystal size distribution (CSD) directly translates into reduced utility use, fewer reworks, and lower emissions across chemical, energy, and pharmaceutical applications. Contemporary practice combines mechanistic population-balance descriptions with Process Analytical Technology (PAT) to monitor supersaturation and steer nucleation–growth kinetics, yet maintaining narrow, reproducible CSDs under time-varying disturbances remains challenging [2,3,4].
Point sensors (e.g., ATR-FTIR, FBRM, PVM) provide invaluable local information, but they cannot reveal the spatial heterogeneities that frequently underlie secondary nucleation, agglomeration, or localized encrustation [5]. Process tomography is a family of imaging methods that reconstruct cross-sections or volumes of internal material properties from indirect measurements, enabling spatial observability in opaque industrial tank reactors, pipes and other equipment. EIT emphasizes conductivity/phase-fraction contrasts [6,7,8], UST captures acoustic velocity [9,10], attenuation and scattering linked to solid fraction and structure, whereas optical techniques reveal micrometer-scale morphology and interfaces [11,12,13]. Over the last decade, these tomographic techniques have matured enough to fill this gap: electrical impedance/resistance tomography (EIT/ERT) and ultrasound computed tomography (UST) can non-intrusively image opaque crystallizing slurries, enabling volumetric supervision of mixing, phase distribution, and evolving solid fractions in real time [10,14,15]. In particular, UST has been shown to visualize batch CaCO3 crystallization dynamics, while ERT can map conductivity fields that correlate with crystal content or reactant addition, supporting both monitoring and fault detection [10,14,16]. In parallel, advances in industrial flow metrology, including optimized vortex shedding geometries for flow meters and correction strategies for wet gas orifice measurement, are improving the robustness of process monitoring and providing complementary inputs for energy efficient process control [17,18].
Real-time tomography-in-the-loop control is beginning to emerge, aided by faster electronics and reconstruction algorithms. Recent reviews show the path from feature extraction to closed-loop control, but also highlight barriers to adoption such as latency, noise, and ill-posed inverse problems [5,15]. Data-driven reconstructions now mitigate some of these limitations: unrolled variational networks (e.g., Learned Primal–Dual) deliver high-quality images at low latency, tailored to nonlinear forward operators typical of EIT/UST [19], and industrial studies demonstrate recurrent neural networks (LSTM) that fuse multi-modal electrical tomography streams for reactor monitoring in situ [6].
These sensing advances come together with a broader trend in the process industries: reinforcement learning (RL) for optimal decision-making under uncertainty. RL algorithms with trust-region/proximal updates are now widely used because they stabilize policy improvement in high-dimensional, continuous-control problems. They have begun to deliver competitive results on process-systems benchmarks and real plants [20,21,22]. In biomanufacturing, RL has optimized batch-to-batch trajectories and enabled PPO-based control of monoclonal-antibody production. Meanwhile, the open-source PC-Gym suite provides standardized environments (including crystallizer models) to compare RL against NMPC across disturbances and constraints [20,21,22]. Crucially, RL has shown it can handle fast, nonlinear, partially observed physical systems by learning coil actuation to shape tokamak plasmas on real hardware, which highlights its potential for complex thermohydrodynamic processes such as crystallization [23]. Within this setting, reinforcement learning provides a natural formalism to map high-dimensional tomographic states to optimal temperature actions under partial observability and delayed end-of-batch rewards.
1.2. Motivation, Novelty and Paper Structure
Crystallization is the process of forming a substance in a crystalline state from a liquid, gas, or amorphous solid. Crystallization is widely used as a unit operation in the chemical industry, both at the purification and separation stages and in the final stages of sugar and pharmaceutical production. Global production of basic crystalline substances such as sucrose, salt, fertilizers, and other bulk chemical compounds exceeds one million tons per year, and demand for them is constantly growing [24]. These processes are not only central to product quality but also highly energy-intensive, making their optimization directly relevant to sustainable and renewable energy strategies.
In the chemical and pharmaceutical industries, online monitoring systems are becoming increasingly important. Traditional approaches are based on spot measurements of temperature, concentration or conductivity, which do not provide complete information about the dynamics of the system. In recent years, ultrasonic methods, both single frequency and spectroscopic, have found widespread application and have proven their usefulness in monitoring fermentation, coagulation and crystallization processes, particularly in the food and pharmaceutical sectors [10]. Their major advantage is the ability to perform in situ measurements, which allows observation of the process without interrupting it.
Tomographic techniques (EIT, UST) provide spatially resolved information. Although they cannot match microscopy in terms of precision of CSD analysis, they allow observation of system topology, material phase distribution and suspension homogeneity, making them useful tools in integrated measurement and control systems. Recent advances in tomographic imaging show that these systems can be an alternative for monitoring large scale processes, supporting spot measurements of particle size distribution, and increasing the reliability of diagnostics and automation in industry [9].
Crystallization belongs to the class of strongly nonlinear systems. Since the optimal temperature trajectory is unknown and the process is sensitive to supersaturation dynamics, direct model-based optimization is often impractical. For this reason, adaptive controllers that integrate simulation, machine learning, and reinforcement learning are increasingly being considered.
As part of this work, a simulation system was developed in the Matlab (R2025b)/Simulink environment in which RL agent controlled the temperature of the crystallization process using information provided by EIT, UST, and image reconstructions based on ResNet deep neural networks. The agent’s task was to make control decisions based on process observations and maximize the reward function, which was designed to promote the formation of crystals with specified CSD parameters. To evaluate the usefulness of the RL approach in controlling the crystallization process, an analysis was performed using four representative algorithms: AC, A3C, PPO and TRPO. These algorithms were compared in terms of learning stability, convergence speed, and control effectiveness, and then the solution best suited to the specifics of the process under study was selected.
The motivation of this research was not only to improve control over CSD and product uniformity but also to address the pressing need for energy-efficient operation of crystallization processes, which are among the most energy-consuming unit operations in bulk chemical and pharmaceutical industries. The research gap lies in the absence of integrated systems that combine tomographic sensing with intelligent, adaptive control algorithms to optimize both quality and energy use in real time.
The novelty of this study lies in the development of an integrated framework that simultaneously addresses product quality and sustainability challenges in crystallization. Unlike previous approaches, the proposed system uses hybrid tomography (EIT and UST) to obtain multidimensional, real-time insight into crystallization dynamics and combines it with deep learning-based image reconstruction using ResNet networks. This rich tomographic information is then incorporated into a reinforcement learning loop, in which the agent autonomously discovers adaptive cooling policies without requiring explicit process models. In this way, the method links process monitoring directly with decision-making, creating a self-optimizing control system capable of steering nonlinear crystallization dynamics toward desired CSD targets. At the same time, the adaptive shaping of temperature trajectories reduces energy consumption, thereby aligning process control with the principles of sustainable manufacturing and decarbonization. The integrated approach therefore provides not only a novel pathway to intelligent automation of crystallization but also a contribution to the broader field of sustainable energy systems, offering a transferable methodology that can be extended to other energy-intensive unit operations.
2. Materials and Methods
2.1. Description of the Crystallization Process
Crystallization is a pivotal unit process in the chemical, energy, and pharmaceutical industries. This process enables the production with strictly controlled purity, structure, and physicochemical properties. Its course is associated with a phase transition, defined as the transformation of a substance from a solution to a solid phase, caused by a change in thermodynamic conditions, such as temperature, pressure, or concentration. In the context of solution supersaturation, two primary stages are identified: nucleation, defined as the formation of crystallization nuclei, and crystal growth, characterized by the enlargement of existing structures [25].
This process is accompanied by complex transport phenomena, including heat exchange, mass transport, and phase dynamics. These phenomena directly determine both the energy efficiency and the quality of the final product.
For solution crystallization to begin, the system must be brought into a supersaturated state. Supersaturation provides the thermodynamic driving force for nucleation and subsequent crystal growth. Once crystallization has been initiated, the concentration of the solution may evolve in different ways. The course of this change depends on several factors, including the rate of solvent evaporation, the available crystal surface area, the intensity of secondary nucleation, and the intrinsic growth kinetics of the crystals. An alternative approach to inducing crystallization from solution is the use of an antisolvent, which is particularly effective for substances with very high solubility. In this method, an additional solvent, known as the antisolvent, is introduced into the system, thereby reducing the solubility of the solute in the primary solvent. As a result, the solution becomes supersaturated, which in turn drives the onset of crystallization. This technique does not require thermal manipulation of the solution, and both the primary solvent and the antisolvent should remain chemically inert with respect to the crystallizing substance.
The crystallization process consists of several fundamental sub-processes, namely nucleation, crystal growth, dissolution, aggregation, and breakage. The dynamics of the solid phase can be effectively described using the population balance equation (PBE), which tracks the evolution of the crystal size distribution, whereas the liquid phase (concentration, temperature) is typically analyzed through mass and energy balance equations. The integration of these two approaches provides a comprehensive representation of the crystallization process [26,27].
Nucleation occurs in a supersaturated solution, most commonly within the metastable region, where nuclei form either spontaneously in a homogeneous medium or heterogeneously in the vicinity of impurities, pre-existing nuclei, or structural irregularities. This stage plays a decisive role in determining both the number of crystals formed and their subsequent growth behavior, thereby exerting a significant influence on the final product properties. The energetic balance of nucleus formation can be expressed in terms of the total change in Gibbs free energy, which consists of the surface and volumetric contributions, as given in Equation (1):
where —total change in Gibbs free energy of the nucleus, —volumetric free energy change, —surface free energy change, —interfacial free energy.
The critical radius of a nucleus, above which growth becomes energetically favorable, is defined as (2):
At this point, the critical free energy barrier is (3):
These relationships highlight that increased supersaturation reduces both the critical radius and the activation energy barrier, thus accelerating nucleation rates.
A rigorous description of the crystallization process requires integrating nucleation and growth kinetics into system-level balances. The PBE describes the dynamics of the crystal size distribution (4):
where is the nucleation rate, is the growth rate, , account for aggregation phenomena, and , represent breakage processes.
The mass balance of solute concentration in the crystallizer can be written as (5):
where is solute concentration, the crystal density, and the shape factor.
The energy balance incorporates the release of latent heat of crystallization and heat exchange with the cooling medium (6):
where is the latent heat of crystallization, the heat transfer coefficient, and the heat exchange area. A schematic of the jacketed, mechanically agitated crystallizer that defines the notation used in Equations (4)–(6) is shown in Figure 1.
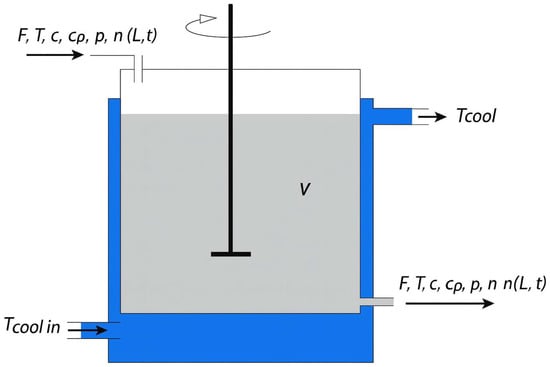
Figure 1.
Double-jacket crystallizer model with key variables.
The outcome of crystallization is governed by several key parameters that determine both product quality and applicability. The crystal size distribution describes the range of particle sizes within a sample and is commonly represented by histograms. A variety of equivalent diameters are used to characterize particle dimensions, including volume, surface, and projection-based measures that reflect the complexity of crystal geometries [28]. Equally important are the shape and morphology of crystals, encompassing their geometric form, texture, and structural regularity. These features influence physical properties such as strength, solubility, and optical behavior. Closely related is polymorphism, the ability of a substance to crystallize in multiple structural forms, which can drastically alter stability and dissolution rates. This is particularly critical in pharmaceuticals, where polymorphic form determines drug bioavailability.
The quality of crystalline products is further affected by impurities entrapped in the lattice or incorporated during growth, as well as by the degree of agglomeration, which alters handling, solubility, and final performance [1]. Together, these parameters define process efficiency and product usability. For example, in food production, crystal size governs sensory perception: fine crystals are desired in frozen desserts for smooth texture, while coarse sugar or salt crystals provide distinct tactile sensations.
2.2. Tomographic Imaging System
The experimental setup employed a hybrid industrial tomograph that combines Electrical Impedance Tomography and Ultrasound Tomography, hereafter referred to as EIT+UST (Figure 2). This hybrid approach leverages the complementary nature of the two imaging modalities: EIT provides information about the conductivity distribution of the medium, while UST offers insight into its acoustic properties and structural heterogeneities. All hardware components of the tomograph, including electronics, sensors, and transducers, were designed and manufactured in the laboratory of Netrix S.A.
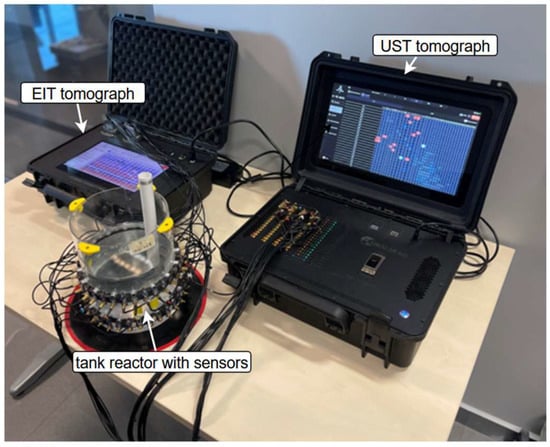
Figure 2.
Measurement setup.
At the center of the system is a transparent plastic vessel with a diameter of 20 cm, filled with tap water. Inside the vessel, plastic tubes filled with air were introduced to simulate phase heterogeneities. The vessel is surrounded by two concentric sensor arrays: 16 passive stainless-steel electrodes for EIT measurements, and 16 active ultrasonic transducers for UST measurements. The electrodes have a simple construction, serving to inject current into the medium and record differences across adjacent electrodes, switched via a multiplexer. In contrast, the ultrasonic transducers are more complex, as each must both generate and receive acoustic waves at a central frequency of 40 kHz.
Each UST transducer is equipped with a single-processor microcontroller, an A/D converter for acoustic signal processing, an active filter, and a potentiometer enabling adjustment of the received signal gain. Data transfer and control of the transducers are carried out via a CAN 2.0A bus, while RJ12 wiring is used for power supply and communication with the tomograph control unit. The ultrasonic transducers operated at a central frequency of 40 kHz ( cm in water), and given the reactor diameter of 30 cm, the acoustic energy density was several orders of magnitude lower than in sonocrystallization studies, insufficient to induce cavitation or disturb the crystallization front. The system worked in a passive tomographic mode, emitting short, low-energy microsecond pulses sequentially for imaging only, with total energy negligible compared to the mechanical mixing at 100 rpm. No differences in crystallization rate or morphology were observed with ultrasound activation, confirming that the acoustic field served purely diagnostic purposes and did not alter the physicochemical conditions of crystal formation. Due to the above facts, the influence of UST wave energy on the research object should be considered negligible.
Although both the EIT electrodes and the UST transducers are integrated into a single measurement system, each sensor group operates independently, collecting data in parallel. To minimize interference and measurement noise, the hybrid control system coordinates acquisition cycles in such a way that electrical and ultrasonic measurements are not performed simultaneously. For EIT, current is injected through one opposing pair of electrodes, while voltage is measured across neighboring electrodes, resulting in a measurement vector of 96 values. In turn, the UST system produces a measurement vector of 120 acoustic values. The placement of EIT electrodes and UST transducers in slightly different planes does not affect the interpretation of the results, since the solution in the crystallizer was continuously mixed using a magnetic stirrer (100 rpm). The mechanical agitation ensured homogeneous distribution of solute and suspended crystals throughout the reactor volume, thereby providing comparable information for both imaging modalities.
The hybrid tomograph prototype developed in this study is distinguished by its ability to synchronously register and process data from both EIT and UST modalities. Based on the reference measurements, algorithms were developed to generate simulation data that could be used to train and validate the RL environment. Image reconstruction is performed using dedicated algorithms for each modality: inverse problem solvers for EIT based on regularization methods, and tomographic back-projection or iterative reconstruction for UST.
This combination of modalities makes the system particularly suited for monitoring crystallization processes, offering complementary perspectives on the evolving internal structure of the suspension. EIT highlights conductivity changes linked to solute concentration and phase distribution, whereas UST reveals acoustic heterogeneities associated with nucleation, bubble formation, and crystal growth. By fusing both sources of information, the hybrid imaging system provides a more comprehensive representation of the process dynamics, which in turn enhances the ability of data-driven control algorithms to optimize crystallization in real time.
2.3. Simulation and Reinforcement Learning Environment
The batch crystallization control model, based on RL algorithm, was developed in the Simulink simulation environment. Simulink is a MATLAB-based graphical programming environment designed for modeling, simulating, and analyzing dynamic systems. Simulink can easily combine physical models of crystallization, like mass and energy balances and supersaturation dynamics, with data-driven parts, such as deep neural networks (ResNet) for creating tomographic images. Simulink is not just a tool for running numerical simulations. It also acts as a testing ground for AI-based process control, allowing safe trials of various control methods before applying them in real life. The system reflects an experimental laboratory setup in which the growth of crystals is monitored using EIT and UST. Control of temperature, or another medium affecting solubility, is carried out in a closed feedback loop. Following the scheme presented in Figure 3, the model extends a crystallization process of potassium nitrate (KNO3) and is based on the PCSS crystallizer simulation block. Its architecture corresponds to the classical RL paradigm, where the agent observes the state of the environment, selects actions (e.g., temperature adjustments), and receives a reward signal to update its control policy.
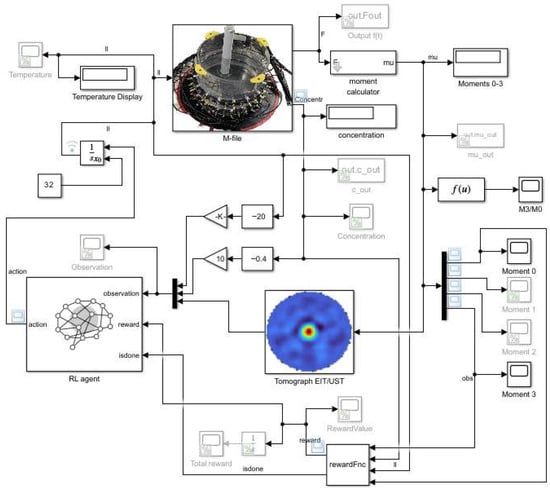
Figure 3.
Simulink model of batch crystallization with reinforcement learning agent supervision.
At the core of the simulation model lies the crystallizer, represented by a Simulink S-Function block. Its functionality is distributed across two files: the first configures the block, manages state propagation, and organizes function calls, while the second implements the numerical solution of the governing equations describing crystal growth dynamics. The applied Conservation Element and Solution Element method [29], using a predictor–corrector approach, ensures stable evaluation of the crystal size distribution over crystal length and time . Growth kinetics are modeled via the growth rate function , distribution gradients , and temporal derivatives , accounting also for supersaturation and nucleation phenomena.
The measurement and data processing subsystem provides a statistical characterization of the evolving crystal population. It evaluates the first four moments of the crystal size distribution, denoted as , which capture essential global properties of the system. Specifically, represents the total number of particles, relates to their mean size, reflects the overall surface area, and corresponds to the total crystal volume. Tracking the temporal evolution of these moments makes it possible to follow the dynamics of crystallization and to supply key indicators for assessing process performance.
To supply image-like input for the RL agent, a tomographic reconstruction block converts the calculated moments into synthetic tomographic images of fixed vector length (2502 pixels). Normalized values of the four moments are cyclically assigned to pixel positions, thereby producing a deterministic mapping of process features into image form. This mimics real EIT/UST systems, which generate pixel-based images reflecting conductivity or acoustic density distributions. To reduce redundancy and correlations among features, Principal Component Analysis (PCA) was applied, yielding a reduced feature vector that serves as part of the agent’s observation. Alongside image input, the agent also receives direct process parameters such as temperature and solute concentration, thereby combining heterogeneous data sources to better characterize system states.
The reinforcement learning agent block acts as the decision-making unit. It receives the state observations (synthetic images, temperature, concentration) and outputs an action (temperature adjustment) according to its learned policy. In training mode, the agent also receives the reward signal and episode termination information, updating the weights and biases of its neural network in line with the chosen RL algorithm (AC, A3C, PPO, TRPO). This closed-loop scheme enables the agent to autonomously learn optimal control strategies without requiring an explicit mathematical model of the process.
The reward function, implemented via an S-Function block, is computed primarily from the ratio of the third to zeroth moment, which defines the mean crystal volume (7):
The maximum reward corresponds to the target mean unit volume of the product. A terminal reward approach was adopted: the agent receives no intermediate reward, only a final one at the end of an episode. This design choice reflects the fact that only the final product quality is relevant, while rewarding intermediate states could encourage suboptimal policies (e.g., prolonging the process unnecessarily or exploiting partial results). Although terminal rewards can slow down training due to lack of intermediate feedback, they avoid reward hacking and simplify the design of the reward function. An exemplary plot of reward evolution during the training process is presented in Figure 4. It can be observed that the initial reward values decrease systematically, then stabilize, before exhibiting a sharp increase that drives the curve toward values close to the maximum. Toward the end of the trajectory, oscillations appear, which are most likely attributable to overfitting of the algorithm.
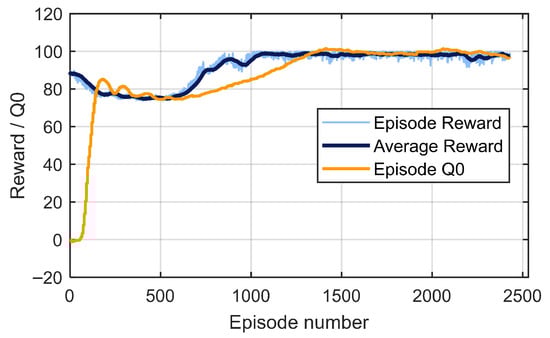
Figure 4.
An exemplary plot of reward evolution during the training process.
For validation purposes, a naive control subsystem was incorporated into the simulation, implementing three predefined temperature trajectories that serve as benchmarks for testing the simulation mechanism and comparing its outcomes against experimental data. The first trajectory (red), referred to as the early growth profile (Equation (8), Figure 5), is designed to promote rapid crystal growth at the beginning of the process. In this case, the temperature decreases relatively quickly during the initial phase, after which the cooling rate slows down, creating favorable conditions for early nucleation and growth.
where —temperature in °C, —process time in seconds.
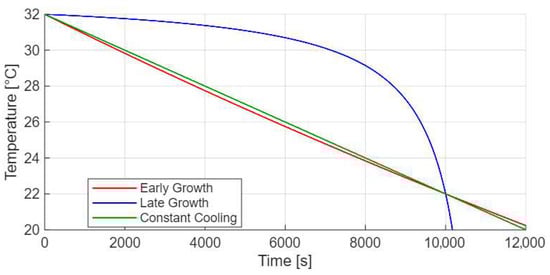
Figure 5.
Temperature profile for early crystal growth.
In the Early Growth phase, weak metabolic heat generation causes the temperature to follow a nearly linear decline similar to constant cooling, with minor deviations due to transient heat accumulation. Around 5000 s, the temperature is slightly lower than in the conductive case, while near 10,000 s it becomes marginally higher as biological activity intensifies. In the Late Growth regime (Equation (9), Figure 5), enhanced metabolic heat generation counteracts cooling, maintaining a higher temperature until the substrate is depleted. The transition between the two regimes depends mainly on the metabolic heat generation rate and the effective heat transfer coefficient. Intermediate curves can be obtained by varying these parameters. For longer times (up to 15,000–20,000 s), the temperature would approach ambient equilibrium as metabolic activity declines.
The Late Growth profile allows the main crystal growth to occur in the final phase of crystallization.
Finally, the constant cooling profile (Equation (10), Figure 5) enforces a steady, linear temperature drop throughout the process, representing the simplest control strategy in which the cooling rate remains uniform over time. Together, these three reference profiles provide a robust framework for verifying the consistency of the simulation with real process behavior, as well as for evaluating the performance of the reinforcement learning agent against well-defined baseline strategies.
Visualization and real-time monitoring are enabled using Simulink’s built-in graph views and indicators. Multiple signals, such as concentration, moments, and control actions, can be displayed simultaneously, facilitating detailed analysis of process dynamics and performance of the RL controller.
The developed simulation environment combines a physically grounded crystallizer model, statistical and tomographic data processing, PCA-based dimensionality reduction, RL-based decision-making, and terminal reward evaluation. Its structure corresponds to a Markov Decision Process (MDP), and under partial observability, for example, when the agent relies only on image based input, it can be interpreted as a Partially Observable MDP. The environment thus provides a comprehensive and realistic framework for testing reinforcement learning methods in crystallization control, while also serving as a safe test environment for validating real-time tomographic reconstruction strategies prior to industrial implementation. Importantly, it also allows systematic evaluation of energy efficiency and sustainability aspects, linking advanced control with practical process optimization goals.
2.4. Reinforcement Learning Algorithms
To assess the applicability of reinforcement learning for crystallization control, four representative algorithms were selected (AC, A3C, PPO, TRPO). They include classical actor–critic frameworks, distributed and asynchronous variants, as well as more advanced policy-gradient approaches that improve stability and robustness of training.
The Actor–Critic (AC) method serves as the baseline, combining the strengths of policy-based and value-based learning. The actor updates the control policy by selecting actions (e.g., temperature adjustments), while the critic evaluates the value function to estimate long-term returns. The policy gradient is expressed as:
where is the advantage function, defined as the difference between the cumulative return and the critic’s value estimate. This dual structure enables faster convergence than pure policy-gradient methods and reduces variance in gradient estimates. However, vanilla AC [30] can be sensitive to hyperparameters and may become unstable in complex environments.
The Asynchronous Advantage Actor–Critic (A3C) improves upon the basic AC by running multiple agents in parallel, each interacting with its own environment copy. These agents explore asynchronously and update a shared global model, which accelerates learning and stabilizes convergence by decorrelating experience trajectories. The policy and value gradients for each worker are given as:
where and represent the parameters of the actor and critic, respectively. Global parameters are updated asynchronously according to:
The use of multiple parallel agents reduces correlation in the data and improves robustness. In the crystallization context, A3C is particularly useful for handling stochasticity and partial observability arising from tomographic input data.
Trust Region Policy Optimization (TRPO) is another policy-gradient method, but instead of clipping or penalizing updates, it directly enforces a constraint on the step size of policy updates using the Kullback–Leibler (KL) divergence:
The optimization objective is defined as:
subject to the KL-divergence constraint above. By ensuring that each new policy stays close to the previous one, TRPO avoids instability and collapse during training. While TRPO is more computationally demanding due to the use of second-order optimization, it provides strong convergence guarantees. In crystallization process control, TRPO offers robustness against sudden policy shifts, ensuring smooth adaptation of temperature profiles to maintain supersaturation conditions and product quality.
Proximal Policy Optimization (PPO) is a simplified and more effective version of TRPO, which applies restrictions on the size of policy changes to increase the stability of the algorithm. Similarly to TRPO, the operation begins with the initiation of the policy with selected network weights, then the agent explores the environment using the current policy, generating trajectories consisting of a sequence of states, actions, and rewards. Next, as in TRPO, the advantage is calculated., representing the difference between the cumulative reward and the current value . The algorithm maximizes the objective function:
where
Here, is a hyperparameter limiting the size of policy updates. Alternatively, PPO can include a penalty on the Kullback–Leibler divergence between old and new policies:
The policy parameters are updated iteratively using stochastic gradient ascent:
PPO achieves stable performance, is easy to tune, and has become a state of the art standard in continuous control problems. For crystallization, PPO offers a strong balance between robustness, efficiency, and sample complexity.
All algorithms were implemented using deep neural networks with comparable architectures to ensure fairness of comparison. Input features included PCA-reduced tomographic vectors, process variables (temperature, concentration), and statistical moments (). Fully connected feedforward networks were adopted, with two to three hidden layers and 128–256 neurons per layer, employing ReLU activations. Optimizers were based on Adam with learning rates in the range of to . For PPO and TRPO, mini-batch on-policy updates were performed, while A3C exploited parallel asynchronous workers. Discount factors () were set to 0.99, balancing short-term variability with long-term process outcomes.
In this study, the hyperparameters of the reinforcement learning agents were selected through systematic tuning to ensure convergence stability and reproducibility of results. The Proximal Policy Optimization (PPO) agent employed a discount factor of 0.99999, ensuring long-term reward optimization suitable for the prolonged dynamics of the crystallization process. The entropy loss weight of 0.01 promoted balanced exploration and prevented premature convergence to deterministic policies. The experience horizon (512) and mini-batch size (128) parameters were selected experimentally to achieve a stable policy update without excessive variance in gradient estimation. The training procedure used three epochs per policy update, and the neural network architecture consisted of two hidden layers with 128 neurons each, initialized via the rlAgentInitializationOptions Matlab object.
Training was performed in parallel using the rlTrainingOptions Matlab class, with a total of 10,000 episodes and 30,000 steps per episode, ensuring sufficient coverage of the state-action space. The stopping criterion was defined as an average reward of 99.54, which corresponded to the optimal control policy within the simulation environment. The entire process, including training progress and final agent weights, was automatically saved for validation and reproducibility. Simulation-based validation was subsequently conducted using the trained agent under identical environment conditions to confirm policy consistency.
Training was organized in episodic fashion, with each episode corresponding to a complete crystallization batch. The following evaluation criteria were applied:
- Convergence speed: number of episodes required to reach near-optimal policy performance.
- Stability of training: variance of reward trajectories across independent training runs.
- Reward trajectory: monotonicity and smoothness of learning curves.
- Final product quality: assessed via mean crystal volume () and distribution characteristics.
2.5. RL Agent Evaluation Through Energy Consumption
The following is a comparison of the energy consumption of the system equipped with the RL controller with classical deterministic models in the crystallization process. Figure 6 shows instantaneous cooling duty for the RL controller (“Example RL”) and three baseline temperature trajectories (“early growth”, “late growth”, and “constant cooling”). The duty is computed from the energy balance (Equation (6)) of the jacketed crystallizer. The baseline temperature profiles follow Equations (8)–(10) and are evaluated over a batch horizon by reparameterizing the normalized time used in Equations (8) and (9), , to so that the shapes are preserved at the longer horizon (cf. Figure 5). Operating assumptions for this comparison: and . The area under each curve equals the integrated cooling load . Under identical and , the integrated loads are: RL 0.967 , constant 1.000 , early-growth 1.015 , and late-growth 1.272 . Equivalently, assuming coefficient of performance COP = 3, 0.322, 0.333, 0.338, and 0.424 , respectively. Thus, the RL policy reduces cooling energy by 3.33% vs. constant cooling, 4.73% vs. early growth, and 24.03% vs. late-growth. These percentages are shape-driven and remain invariant to and COP. (Energy balance: Equation (6), baselines: Equations (8)–(10), see Figure 5).
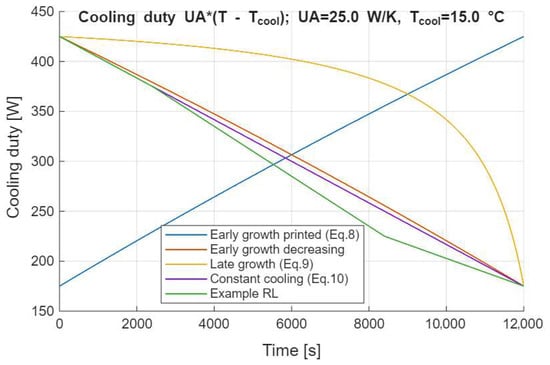
Figure 6.
Instantaneous cooling duty—RL agent evaluation.
3. Results
3.1. Results of Image Reconstruction with ResNet Network
In the proposed simulation model, a trained neural network based on EIT, UST, and the ResNet architecture is responsible for generating tomographic images. These reconstructions subsequently serve as input data for RL agent, which utilizes them to optimize control strategies in the crystallization process.
The first stage of the study was devoted to the training and verification of the proposed ResNet model on experimental phantom data. The purpose of this step was to validate the ability of the neural network to generate reliable tomographic reconstructions prior to its application in crystallization experiments.
The ResNet was trained using the Adam optimizer, with mini-batches of 64 input data samples and a total of 500 training iterations. Validation was performed every 100 iterations to monitor convergence and prevent overfitting. The use of residual connections in the network mitigated the vanishing gradient problem, ensuring stable training and effective feature extraction from the tomographic measurements.
Figure 7 presents the reconstruction results obtained for selected experimental configurations. The first column shows the actual measurement setup, while the subsequent columns depict the reconstructions obtained from EIT, UST, and the hybrid EIT+UST approach using the trained ResNet. The reconstructions are visualized using a color map, where red regions correspond to inclusions with different physical properties compared to the background.
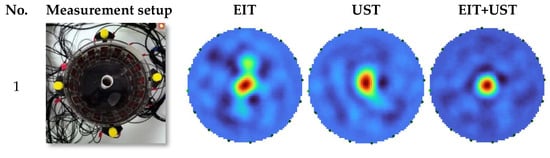
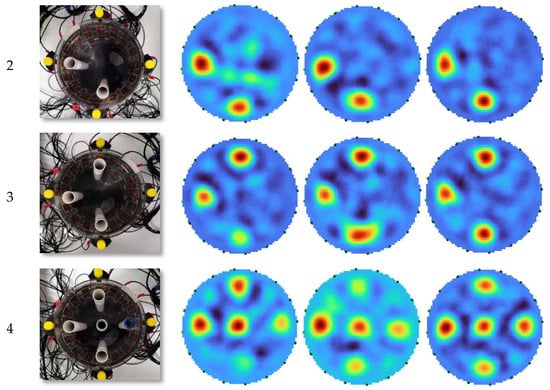
Figure 7.
Comparison of actual reconstructions obtained using EIT, UST and hybrid EIT+UST model.
The results demonstrate that ResNet correctly reproduces the number, position, and approximate shapes of the inclusions. Reconstructions based on EIT typically have blurred contours and reduced resolution, while UST introduces background noise and artifacts. In contrast, the hybrid EIT+UST configuration clearly improves the quality of the reconstructed images. By combining the complementary information from both modalities, the hybrid approach enhances spatial localization and contrast, providing reconstructions that are more consistent with the real measurement setup.
Figure 7 allows for a perceptual assessment of the reconstruction quality. A quantitative assessment was performed using a simulation-generated test set containing reference images with the ResNet model. The mean MSE and Image Correlation Coefficient (ICC) values were calculated for 1000 test cases [31]. The results are presented in Table 1.

Table 1.
Quality indicators for the EIT, UST and EIT+UST models.
For the hybrid EIT+UST model, the RMSE error value is the lowest, while the ICC is closest to 1, which clearly indicates that the combination of both methods proved to be more effective than the separately used EIT and UST methods. The total latency between tomographic data acquisition and the control action executed by the reinforcement learning (RL) controller was experimentally determined. The reconstruction of tomographic images using the ResNet model requires approximately 0.1 s, while the processing time of the RL controller, including state evaluation and action computation, is approximately 0.02 s. Therefore, the overall delay from sensor measurement to control response equals about 0.12 s.
These results confirm that the trained ResNet model is capable of producing stable and reliable reconstructions from hybrid tomographic measurements. Consequently, the network can be effectively applied to real crystallization experiments, where high quality tomographic input is essential for further reinforcement learning–based control.
3.2. Experimental Study of Dynamic Crystallization
In the next stage, the developed tomographic system was applied to monitor a real crystallization process. The experiment focused on dynamic crystallization conducted under mechanical mixing conditions. The experimental setup consisted of the following components: a magnetic stirrer IKA C-MAG HS 7 control to provide uniform mixing of the liquid, an additional magnetic stirrer IKA Midi MR 1 digital for parallel mixing processes, a peristaltic pump BT101L (flow range: 0.00011–575 mL/min) for precise dosing of liquids, a precision balance OHAUS PIONEER PR6201/E for accurate measurements of reagents and a water demineralizer HYDROLAB HLP 10UV to ensure high purity water for solution preparation.
The crystallization process was based on the chemical reaction:
Two liters of a 1 M calcium chloride solution were prepared in advance to prevent aeration and then introduced into the measurement vessel using the peristaltic pump. A 1 M sodium carbonate solution was prepared separately with the aid of the C-MAG HS 7 control stirrer. During the experiment, the sodium carbonate solution was dosed at a rate of 36 mL/min directly into the calcium chloride solution while maintaining a stirring speed of 100 rpm.
The collected measurement data were processed using Block Wise Transform Regularization (BWTR). This advanced technique allows the suppression of noise and artifacts in tomographic reconstructions by dividing the image into smaller blocks (e.g., 8 × 8 pixels), applying local mathematical transforms (Discrete Cosine or wavelet transform), followed by soft thresholding regularization. The blocks are then recombined into a complete image using averaging in overlapping areas, ensuring smooth transitions and consistent visual quality. During the experiments carried out in the 200 mm vessel, different stirring speeds were tested. It was determined that at 100 rpm the noise level was sufficiently low not to affect the measurements, and therefore this value was selected to minimize disturbances in the analyzed medium.
Figure 8 presents the reconstructions obtained during the dynamic crystallization of calcium carbonate at a dosing rate of 36 mL/min and a stirring speed of 100 rpm, over a total process time of 20 min. The time of each measurement is indicated above the corresponding reconstruction (hh:mm:ss format). The first reconstruction (top-left) shows a completely homogeneous field (blue), corresponding to the initial moment before crystallization. Between 09:03:00 and 09:06:00 the first local concentrations appear, indicating the onset of crystal formation. Yellow and green regions emerge in the upper part of the vessel, suggesting the nucleation zone. Between 09:07:00 and 09:10:00 the high-intensity region (yellow) expands and intensifies, while additional crystallization zones develop in other regions of the vessel. From 09:11:00 to 09:13:00 further growth of the crystallization zone is observed, with some asymmetry in the signal distribution caused by local differences in flow or turbulence from the stirrer. In the later stages (09:18:00–09:21:00) the crystallization zone stabilizes, and only minor variations in signal intensity can be observed, which may indicate the transition from active crystal growth to the maturity phase of the formed structures.
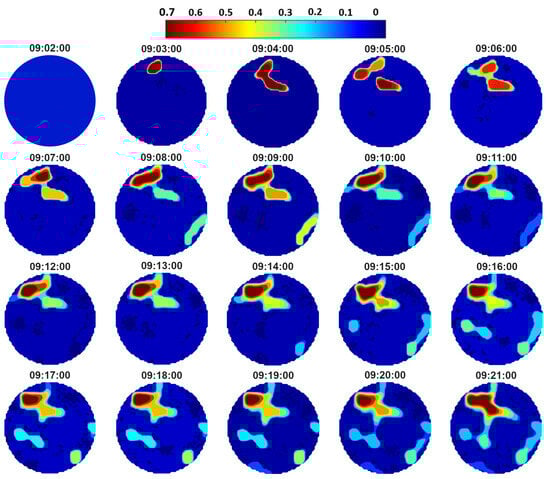
Figure 8.
Reconstructions from the calcium carbonate crystallization process at an injection rate of 36 mL/min and a mixing speed of 100 rpm.
Although the crystallizer was mechanically stirred at 100 rpm, the reconstructed EIT maps display persistent high-contrast regions. These do not represent stationary crystals but rather quasi-stable zones of local conductivity change caused by convective flow patterns, nucleation regions, or microbubbles of CO2. Due to the two-dimensional nature and spatial averaging of EIT, such dynamic heterogeneities may appear as fixed structures in successive frames. This experiment confirmed that tomography is an effective tool for real-time monitoring of dynamic crystallization processes. It enabled the visualization of nucleation onset, the spatial distribution of solid particles, and the stabilization of the suspension under controlled mixing conditions.
3.3. Verification of the Simulation Model
As described above, the simulation and training environment for the reinforcement learning (RL) agent is a complex tool composed of several interconnected components. Correct implementation and integration of each element is essential for the system to be applicable in further work on machine learning–based process control.
For verification purposes, a naive control function was applied, and the simulation results were compared with theoretical expectations. The reference was obtained from the solubility curve of potassium nitrate in water (Figure 9), which allowed the calculation of the expected crystallized mass according to Equation (22):
where —expected mass precipitated in the form of crystals (if negative, the value is set to zero), —initial mass of the crystallized substance, —temperature.
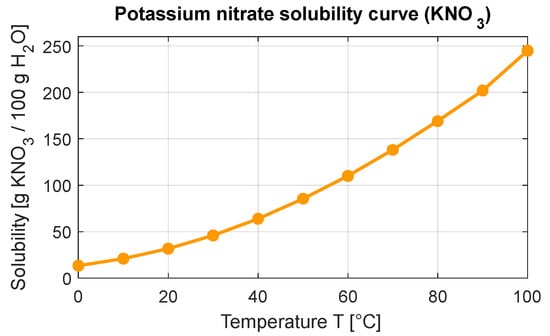
Figure 9.
Potassium nitrate solubility curve.
In parallel, the crystallized mass was estimated from the third moment of the crystal size distribution, proportional to the total crystal volume, using Equation (23):
where —mass of the crystallized substance, —density of the crystallized substance, —density of the solvent.
The results are summarized in Figure 10. Initially, noticeable deviations occur between the theoretical and simulated crystal mass curves, which can be attributed to the induction period of crystallization, i.e., the time required to reach stable supersaturation and nucleation conditions. After approximately 1000 simulation steps, both curves converge and proceed almost in parallel, with the deviation stabilizing at around 1.5%. The corresponding error trend is shown in Figure 11.
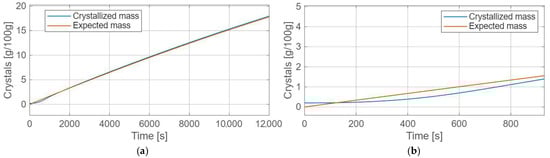
Figure 10.
Expected and simulated crystal mass: (a)—whole period, (b)—a fragment of the period.
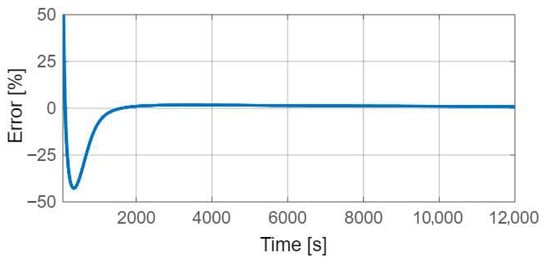
Figure 11.
Percentage error of expected and simulated crystal mass.
The discrepancy in the early phase can be explained by physical phenomena not captured in the simplified balance model, such as nucleation induction time, local supersaturation heterogeneities, and hydrodynamic effects of mixing. Once stable growth is initiated, these factors become negligible, and the simulated trajectory reflects the expected thermodynamic behavior dictated by the solubility curve and cooling profile.
This level of agreement (error ~1.5%) confirms the correctness of the implemented kinetic model and validates the simulation environment as a reliable platform for subsequent reinforcement learning experiments.
3.4. Comparative Analysis of Reinforcement Learning Agents
In the final stage of the study, the performance of different reinforcement learning algorithms was compared in order to identify the most effective approach for process control. Four algorithms were tested: AC, A3C, PPO, and TRPO. Each agent was trained in the same simulation environment using comparable network architectures and hyperparameters, ensuring fair evaluation conditions.
The results (Figure 12a–d) demonstrate significant differences in learning dynamics. The vanilla AC algorithm achieved relatively low performance, with rewards oscillating around 75–80 points and a highly unstable critic frequently overestimating or underestimating returns. A3C showed a similar behavior, with occasional peaks in performance caused by asynchronous exploration, but no sustained improvement in the learned policy.
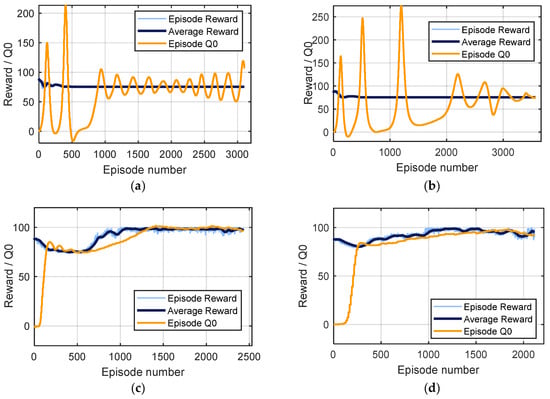
Figure 12.
Learning algorithm reward graph: (a) AC, (b) A3C, (c) PPO, (d) TRPO.
In contrast, TRPO achieved much greater stability. After an initial decline, the average reward steadily increased, eventually reaching approximately 100 points. The critic’s estimates aligned well with the observed returns, leading to smooth convergence, although some signs of overfitting were observed in later episodes.
PPO exhibited the most effective learning behavior. After a short initial phase, the agent’s average reward increased almost linearly and stabilized close to 95–100 points. The critic predictions remained consistent with the actual returns, avoiding large fluctuations. This resulted in the most stable and efficient policy among the evaluated algorithms.
Overall, the comparison indicates that while basic actor–critic methods (AC, A3C) are insufficient for the highly nonlinear and delayed reward nature of the crystallization process, advanced policy optimization methods such as PPO and TRPO provide much better stability and performance. Among them, PPO was identified as the best performing algorithm, combining robustness, efficiency, and high final reward, making it the most suitable choice for reinforcement learning–based crystallization control.
4. Discussion
The present work demonstrates that integrating hybrid EIT+UST with RL agent can achieve effective closed-loop temperature control in batch crystallization. By manipulating the cooling profile based on real-time tomographic feedback, the RL agent influenced nucleation and growth kinetics to steer the CSD towards desired targets. Such precise temperature control is critical, as crystallization outcomes (polymorph, crystal shape, size, and distribution) largely determine product quality and the efficiency of subsequent processes [4,32].
Traditionally, a variety of PAT sensors, including focused beam reflectance measurements, spectroscopic probes, and in situ imaging microscopy, have been used to monitor crystallization in real time and enable feedback control. These conventional PAT tools provide valuable data, such as chord length counts or solute concentration, but generally as point measurements or one dimensional distributions [14,33]. In contrast, tomographic approaches provide cross-sectional or volumetric views of the crystallizing suspension, capturing spatial variations that single-point probes cannot [14,34,35]. This multidimensional insight allows the controller to detect and respond to phenomena such as local supersaturation or crystal clustering, which are often invisible to conventional sensors.
Indeed, fast tomographic imaging techniques, both “hard-field” methods such as X-ray CT and “soft-field” methods such as ultrasound or electrical impedance tomography, have increasingly been recognized as promising tools for real-time control of multiphase processes [5,6,16,36]. By combining EIT and UST, which are sensitive to complementary physical properties (electrical conductivity and acoustic impedance, respectively), a more holistic depiction of the batch crystallizer’s internal state was obtained. The EIT+UST hybrid sensor thus acts as an advanced PAT system, continuously imaging the evolving solid–liquid distribution. These images were analyzed and provided as input to the reinforcement learning agent, which then implemented the control strategy in the reactor. This approach is in line with recent initiatives such as the TOMOCON consortium [16,36], which envision smart tomographic sensor networks embedded in process control loops, underscoring the value of spatially resolved measurements for improving regulation of crystallization and related multiphase operations.
On the control side, the results contribute to the growing evidence that model-free RL can successfully handle the nonlinear, multivariable dynamics of chemical processes [20]. The PPO algorithm in particular proved adept at learning an effective temperature policy for crystallization, achieving stable performance without requiring an explicit process model [21,22]. Unlike PID or model predictive controllers, which require careful tuning or detailed kinetic models, the PPO agent autonomously discovered a policy that maximized product quality indicators defined in the reward function. The agent dynamically adjusted cooling rates in response to tomographic states, in effect keeping the process within favorable regions of the phase diagram. This behavior is analogous to established crystallization control philosophies: supersaturation control and direct nucleation control, strategies known to improve final crystal quality [4,33,34]. In this study, the PPO agent effectively learned a similar principle, balancing nucleation and growth to avoid extremes of overcooling or overheating that lead to excessive secondary nucleation or uncontrolled supersaturation. Notably, this was achieved in a model-free and adaptive manner, with the agent learning directly from tomographic feedback and reward signals, rather than relying on pre-programmed trajectories. This capacity to optimize directly for end objectives, such as maximizing mean crystal size while minimizing the width of the CSD, is a key advantage of reinforcement learning in crystallization, as highlighted in recent reviews [37].
In a broader context, the integration of tomography and RL exemplifies the transition toward intelligent, data-driven and autonomous process control systems. The TOMOCON project and similar efforts have proposed “smart sensor” frameworks in which imaging data are not only diagnostic but also active drivers of feedback regulation [5,37]. The results presented here provide a concrete implementation of this vision, demonstrating that an RL policy can indeed utilize high-dimensional sensor inputs in real time to optimize an industrially relevant process. This leads to a more adaptive control system: whereas conventional controllers may underperform if crystallization deviates from design assumptions due to unknown kinetics, impurities, or scale-up effects, the RL agent continually adapts its actions to the actual process state observed via tomography.
From the perspective of sustainable manufacturing, the methodology proposed here demonstrates how intelligent control can simultaneously enhance product quality and reduce energy consumption.
The successful application of PPO-based reinforcement learning combined with hybrid EIT+UST confirms the feasibility of intelligent crystallization control. Beyond immediate improvements in crystal size distribution and energy efficiency, this approach represents a step toward autonomous, adaptive, and sustainable process industries. As global energy demand grows and decarbonization targets become more urgent, advances in adaptive process control of energy-intensive operations, such as the one demonstrated here, constitute critical contributions to the development of reliable and sustainable energy systems.
5. Conclusions
This study introduced an integrated, tomography-informed control framework that couples hybrid electrical impedance and ultrasonic imaging, ResNet-based reconstructions, and deep reinforcement learning to steer batch crystallization via temperature manipulation. The Simulink-based environment reproduced solubility-driven expectations for KNO3 (steady-state mass error ≈ 1.5%), and laboratory experiments with CaCO3 confirmed that EIT+UST can track the onset and spatial evolution of crystallization in real time, with BWTR post-processing reducing artifacts in the reconstructions. These results substantiate the feasibility of closing the loop with tomographic feedback for quality-oriented crystallization control.
A direct comparison of four RL agents (AC, A3C, TRPO, PPO) showed that policy optimization methods are better suited to the nonlinear, partially observed, delayed-reward nature of crystallization. While AC and A3C exhibited unstable learning and limited gains, TRPO delivered smooth improvements, and PPO provided the most consistent high rewards and stable policies. In effect, the PPO controller learned to shape cooling trajectories that balanced nucleation and growth, aligning the process with desirable CSD targets using high-dimensional tomographic state information.
Various approaches were tested during the study, including those that incorporated intermediate rewards. However, due to the nature of the problem under investigation, particularly the nonlinear dynamics of crystal growth, only the final reward yielded the best, stable results. This choice of reward policy reflects the fact that only the quality of the final product is important. Rewarding intermediate states encouraged the model to use suboptimal policies (e.g., unnecessarily extending the process or using partial results).
The quality of the RL controller was evaluated based on the convergence characteristics and stability of the reward function, which reflected the system’s ability to maintain optimal crystallization conditions. The reward was designed to penalize deviations from the desired conductivity profile and excessive control activity, effectively balancing process precision and actuator effort. Although energy consumption was not included explicitly as a separate term in the reward formulation, it was indirectly accounted for through the control efficiency term, which discourages unnecessary adjustments.
From a sustainability perspective, the framework offers a practical way to reduce resource intensity in energy-hungry solids processing. Although this manuscript infers potential energy benefits indirectly (via smoother policies and quality indicators), the combination of spatially resolved sensing and adaptive control is well-positioned to reduce over-cooling, rework, and off-spec batches–levers that ultimately translate into lower utility use. Realization of these gains now calls for explicit energy accounting under controlled studies.
The present work used PCA-reduced image features and terminal-reward formulations to simplify learning. Future studies should quantify energy consumption and cooling duty explicitly, implement the controller on a pilot crystallizer with closed-loop EIT+UST to assess latency, robustness, and sensor fusion at scale, and benchmark against advanced model-based controllers and under disturbances (feed, seeding, impurities). Extending the approach to antisolvent and semi-batch modes, as well as to other solutes and polymorphic systems, will further test generalizability.
Author Contributions
Conceptualization, K.N. and T.R.; methodology, G.K., T.R. and K.N.; software, K.N.; validation, G.B., P.K., E.J. and D.D.; resources, T.R.; data curation, G.K.; writing—original draft preparation, M.K.; writing—review and editing, G.K., T.R., M.K., G.B., P.K., E.J. and D.D.; visualization, M.K. and G.B.; supervision, T.R.; funding acquisition, T.R. All authors have read and agreed to the published version of the manuscript.
Funding
This research received no external funding.
Data Availability Statement
The data presented in this study are available on request from the corresponding author. The data is not made public because it is the property of the company.
Conflicts of Interest
The Authors Tomasz Rymarczyk and Konrad Niderla were employed by the company Netrix S.A. Research and Development Center. The remaining authors declare that the research was conducted in the absence of any commercial or financial relationships that could be construed as a potential conflict of interest.
Abbreviations
The following abbreviations are used in this manuscript:
| A3C | Asynchronous Advantage Actor–Critic |
| AC | Actor–Critic |
| ATR-FTIR | Attenuated Total Reflectance-Fourier Transform Infrared Spectroscopy |
| COP | Coefficient of Performance |
| CSD | Crystal Size Distribution |
| EIT | Electrical Impedance Tomography |
| ERT | Electrical Resistance Tomography |
| FBRM | Focused Beam Reflectance Measurement |
| LSTM | Long Short-Term Memory |
| MDP | Markov Decision Process |
| NMPC | Nonlinear Model Predictive Control |
| PAT | Process Analytical Technology |
| PBE | Population Balance Equation |
| PCA | Principal Component Analysis |
| PPO | Proximal Policy Optimization |
| PVM | Particle Vision and Measurement |
| ResNet | Residual Network |
| RL | Reinforcement Learning |
| TRPO | Trust Region Policy Optimization |
| UST | Ultrasonic Tomography |
References
- Myerson, A.S.; Erdemir, D.; Lee, A.Y. (Eds.) Handbook of Industrial Crystallization; Cambridge University Press: Cambridge, UK, 2019. [Google Scholar] [CrossRef]
- Orehek, J.; Teslic, D.; Likozar, B. Continuous Crystallization Processes in Pharmaceutical Manufacturing: A Review. Org. Process Reseatch Dev. 2021, 25, 16–42. [Google Scholar] [CrossRef]
- Yazdanpanah, N.; Nagy, Z.K. (Eds.) The Handbook of Continuous Crystallization; Royal Society of Chemistry: Cambridge, UK, 2020. [Google Scholar] [CrossRef]
- Gao, Y.; Zhang, T.; Ma, Y.; Xue, F.; Gao, Z.; Hou, B.; Gong, J. Application of PAT-Based Feedback Control Approaches in Pharmaceutical Crystallization. Crystals 2021, 11, 221. [Google Scholar] [CrossRef]
- Hlava, J.; Abouelazayem, S. Control Systems with Tomographic Sensors—A Review. Sensors 2022, 22, 2847. [Google Scholar] [CrossRef] [PubMed]
- Kłosowski, G.; Rymarczyk, T.; Niderla, K.; Kulisz, M.; Skowron, Ł.; Soleimani, M. Using an LSTM Network to Monitor Industrial Reactors Using Electrical Capacitance and Impedance Tomography—A Hybrid Approach. Eksploat. I Niezawodn. 2023, 25, 11. [Google Scholar] [CrossRef]
- Yan, P.; Jin, H.; Tao, F.F.; He, G.; Guo, X.; Ma, L.; Yang, S.; Zhang, R. Flow Characterization of Gas-Liquid with Different Liquid Properties in a Y-Type Microchannel Using Electrical Resistance Tomography and Volume of Fluid Model. J. Taiwan Inst. Chem. Eng. 2022, 136, 104390. [Google Scholar] [CrossRef]
- Kulisz, M.; Kłosowski, G.; Rymarczyk, T.; Słoniec, J.; Gauda, K.; Cwynar, W. Optimizing the Neural Network Loss Function in Electrical Tomography to Increase Energy Efficiency in Industrial Reactors. Energies 2024, 17, 681. [Google Scholar] [CrossRef]
- Koulountzios, P.; Aghajanian, S.; Rymarczyk, T.; Koiranen, T.; Soleimani, M. An Ultrasound Tomography Method for Monitoring Co2 Capture Process Involving Stirring and CaCO3 Precipitation. Sensors 2021, 21, 6995. [Google Scholar] [CrossRef]
- Koulountzios, P.; Rymarczyk, T.; Soleimani, M. Ultrasonic Time-of-Flight Computed Tomography for Investigation of Batch Crystallisation Processes. Sensors 2021, 21, 639. [Google Scholar] [CrossRef]
- Korzeniewska, E.; Gałązka-Czarnecka, I.; Sekulska-Nalewajko, J.; Gocławski, J.; Dróźdż, T.; Kiełbasa, P. Assessment of Changes in Vitamin Content and Morphological Characteristics in Strawberries Modified with a Pulsed Electric Field Using Chromatography and Optical Coherence Tomography. NFS J. 2025, 38, 100217. [Google Scholar] [CrossRef]
- Gocławski, J.; Sekulska-Nalewajko, J.; Korzeniewska, E. Prediction of Textile Pilling Resistance Using Optical Coherence Tomography. Sci. Rep. 2022, 12, 18341. [Google Scholar] [CrossRef]
- Ji, Y.; Yang, S.; Zhou, K.; Rocliffe, H.R.; Pellicoro, A.; Cash, J.L.; Wang, R.; Li, C.; Huang, Z. Deep-Learning Approach for Automated Thickness Measurement of Epithelial Tissue and Scab Using Optical Coherence Tomography. J. Biomed. Opt. 2022, 27, 015002. [Google Scholar] [CrossRef]
- Rao, G.; Aghajanian, S.; Zhang, Y.; Jackowska-Strumiłło, L.; Koiranen, T.; Fjeld, M. Monitoring and Visualization of Crystallization Processes Using Electrical Resistance Tomography: CaCO3 and Sucrose Crystallization Case Studies. Sensors 2022, 22, 4431. [Google Scholar] [CrossRef]
- Hampel, U.; Babout, L.; Banasiak, R.; Schleicher, E.; Soleimani, M.; Wondrak, T.; Vauhkonen, M.; Lähivaara, T.; Tan, C.; Hoyle, B.; et al. A Review on Fast Tomographic Imaging Techniques and Their Potential Application in Industrial Process Control. Sensors 2022, 22, 2309. [Google Scholar] [CrossRef]
- Sattar, M.A.; Garcia, M.M.; Banasiak, R.; Portela, L.M.; Babout, L. Electrical Resistance Tomography for Control Applications: Quantitative Study of the Gas-Liquid Distribution inside A Cyclone. Sensors 2020, 20, 6069. [Google Scholar] [CrossRef] [PubMed]
- Tomaszewska-Wach, B.; Rzasa, M. A Correction Method for Wet Gas Flow Metering Using a Standard Orifice and Slotted Orifices. Sensors 2021, 21, 2291. [Google Scholar] [CrossRef] [PubMed]
- Rzasa, M.R.; Czapla-Nielacna, B. Analysis of the Influence of the Vortex Shedder Shape on the Metrological Properties of the Vortex Flow Meter. Sensors 2021, 21, 4697. [Google Scholar] [CrossRef] [PubMed]
- Adler, J.; Öktem, O. Learned Primal-Dual Reconstruction. IEEE Trans. Med. Imaging 2018, 37, 1322–1332. [Google Scholar] [CrossRef]
- Petsagkourakis, P.; Sandoval, I.O.; Bradford, E.; Zhang, D.; del Rio-Chanona, E.A. Reinforcement Learning for Batch Bioprocess Optimization. Comput. Chem. Eng. 2020, 133, 106649. [Google Scholar] [CrossRef]
- Gupta, N.; Anand, S.; Joshi, T.; Kumar, D.; Ramteke, M.; Kodamana, H. Process Control of MAb Production Using Multi-Actor Proximal Policy Optimization. Digit. Chem. Eng. 2023, 8, 100108. [Google Scholar] [CrossRef]
- Bloor, M.; Torraca, J.; Sandoval, I.O.; Ahmed, A.; White, M.; Mercangöz, M.; Tsay, C.; Antonio, E.; Rio Chanona, D.; Mowbray, M. PC-Gym: Benchmark Environments For Process Control Problems. arXiv 2024, arXiv:2410.22093. [Google Scholar] [CrossRef]
- Degrave, J.; Felici, F.; Buchli, J.; Neunert, M.; Tracey, B.; Carpanese, F.; Ewalds, T.; Hafner, R.; Abdolmaleki, A.; de las Casas, D.; et al. Magnetic Control of Tokamak Plasmas through Deep Reinforcement Learning. Nature 2022, 602, 414–419. [Google Scholar] [CrossRef]
- Ultrasound Tomography for Control of Batch Crystallization—The University of Bath’s Research Portal. Available online: https://researchportal.bath.ac.uk/en/studentTheses/ultrasound-tomography-for-control-of-batch-crystallization (accessed on 25 August 2025).
- Desiraju, G.R.; Vittal, J.J.; Ramanan, A. Crystal Engineering: A Textbook; World Scientific: Singapore, 2011. [Google Scholar]
- Szilagyi, B.; Majumder, A.; Nagy, Z.K. Fundamentals of Population Balance Based Crystallization Process Modeling. In The Handbook of Continuous Crystallization; Royal Society of Chemistry: London, UK, 2020; pp. 51–101. [Google Scholar] [CrossRef]
- Mersmann, A. (Ed.) Crystallization Technology Handbook; Marcel Dekker: New York, NY, USA, 2001. [Google Scholar] [CrossRef]
- Lewis, A.E.; Seckler, M.M.; Kramer, H.; Van Rosmalen, G. Industrial Crystallization: Fundamentals and Applications; Cambridge University Press: Cambridge, UK, 2015; pp. 1–323. [Google Scholar] [CrossRef]
- Jackson, K.A. Kinetic Processes: Crystal Growth, Diffusion, and Phase Transitions in Materials; Wiley-VCH: Weinheim, Germany, 2005; pp. 1–409. [Google Scholar] [CrossRef]
- Prakash, A.; He, N.; Goktas, D.; Greenwald, A. Bi-Level Policy Optimization with Nyström Hypergradients. arXiv 2025, arXiv:2505.11714. [Google Scholar] [CrossRef]
- Kłosowski, G.; Kulisz, M.; Rymarczyk, T.; Skowron, Ł.; Olszewski, P.; Niderla, K. Application of Machine Learning in Electrical Process Tomography with Variable Frequency Measurement Sequences. Measurement 2025, 247, 116770. [Google Scholar] [CrossRef]
- Wang, L.; Zhu, Y.; Gan, C. Nonlinear Model Predictive Control of Crystal Size in Batch Cooling Crystallization Processes. J. Process Control 2023, 128, 103020. [Google Scholar] [CrossRef]
- Zhang, T.; Szilágyi, B.; Gong, J.; Nagy, Z.K. Novel Semibatch Supersaturation Control Approach for the Cooling Crystallization of Heat-Sensitive Materials. AIChE J. 2020, 66, e16955. [Google Scholar] [CrossRef]
- Rao, G.; Aghajanian, S.; Koiranen, T.; Wajman, R.; Jackowska-Strumiłło, L. Process Monitoring of Antisolvent Based Crystallization in Low Conductivity Solutions Using Electrical Impedance Spectroscopy and 2-D Electrical Resistance Tomography. Appl. Sci. 2020, 10, 3903. [Google Scholar] [CrossRef]
- Aghajanian, S.; Rao, G.; Ruuskanen, V.; Wajman, R.; Jackowska-strumillo, L.; Koiranen, T. Real-time Fault Detection and Diagnosis of CaCO3 Reactive Crystallization Process by Electrical Resistance Tomography Measurements. Sensors 2021, 21, 6958. [Google Scholar] [CrossRef]
- Sahovic, B.; Atmani, H.; Sattar, M.A.; Garcia, M.M.; Schleicher, E.; Legendre, D.; Climent, E.; Zamansky, R.; Pedrono, A.; Babout, L.; et al. Controlled Inline Fluid Separation Based on Smart Process Tomography Sensors. Chem. Ing. Tech. 2020, 92, 554–563. [Google Scholar] [CrossRef]
- Lima, F.A.R.D.; de Moraes, M.G.F.; Barreto, A.G.; Secchi, A.R.; Grover, M.A.; de Souza, M.B. Applications of Machine Learning for Modeling and Advanced Control of Crystallization Processes: Developments and Perspectives. Digit. Chem. Eng. 2024, 14, 100208. [Google Scholar] [CrossRef]
Disclaimer/Publisher’s Note: The statements, opinions and data contained in all publications are solely those of the individual author(s) and contributor(s) and not of MDPI and/or the editor(s). MDPI and/or the editor(s) disclaim responsibility for any injury to people or property resulting from any ideas, methods, instructions or products referred to in the content. |
© 2025 by the authors. Licensee MDPI, Basel, Switzerland. This article is an open access article distributed under the terms and conditions of the Creative Commons Attribution (CC BY) license (https://creativecommons.org/licenses/by/4.0/).