Abstract
Wastewater treatment plants are municipal facilities established by governments to process wastewater from local communities. Aeration is a crucial stage of wastewater cleaning. In this paper authors present the concept of an airflow controller based on measures obtained from installation in Kraków/Płaszów. The model of the blowers’ station, which is based on measured values from this plant, is used as a reference. The development of such a numerical model enables tests of more efficient control strategies of blowers, leading to cost savings. From a technical standpoint, such a model can be systematically integrated into the management framework of wastewater treatment plants through the implementation of model predictive control (MPC) strategies. We decided to apply the control strategy presented in this paper to demonstrate the modeling approach by using only SCADA data measurements. The authors present two independent tests introduced to reduce momentary power consumption that is considered as the final indicator of system performance. The first test analyses two approaches to start-up inactive blower. The first algorithm selects the blower that has been inactive the longest. In the second one, the decision to activate the blower is based on its actual characteristics. The results of simulations clearly show that choosing the blower based on its characteristics is non-significantly more effective. The second test presented a strategy that delays blower activation to achieve operation at more favorable working points. A comparison of the simulation shows that delaying their activation leads to an improvement in the operating point, lowering average power consumption.
1. Introduction
In wastewater treatment naturally occurring phenomena were imported by humans for municipal wastewater treatment. From a scientific perspective, wastewater treatment is a relevant topic because of the complex processes involved. Wastewater treatment plants (WWTPs) are responsible for the sewage treatment and disposal of solid generated during the wastewater purification process. They involve multiple treatment stages throughout their operation. The primary treatment is mechanical and takes place in bar screens and primary clarifiers. The goal is to remove the largest and most easily separable physical contaminants. The secondary treatment is biological and takes place in the aerated bioreactors and secondary clarifiers. It involves the nitrification followed by denitrification of wastewater. It is typically tracked by the concentration of the dissolved oxygen (DO) level. According to [] the DO level reflects the bacteria metabolization in both aerobic and anaerobic stages. Hence, the level of DO impacts the air demand to sustain bacterial metabolic performance. The evolution of the sewage within these stages is depicted in Figure 1.
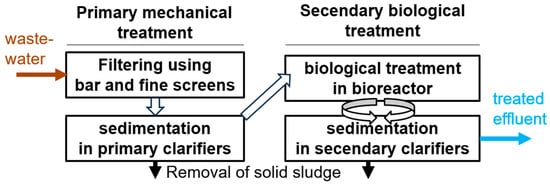
Figure 1.
General overview of wastewater treatment.
In biological treatment, the regulation of generated air plays a vital role. Each bioreactor is divided into sections that individually measure and regulate the DO. Maintaining a specified DO concentration requires aeration, which is carried out through diffusers installed in each section. Diffusers are preceded by individual manifold pipes connected to a common main collector, into which air is originally supplied by blowers. A sketch of the airflow pipeline is presented in Figure 2.
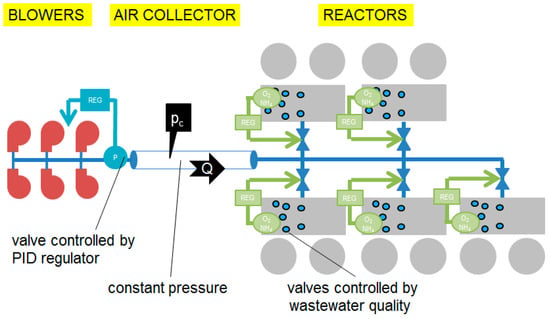
Figure 2.
Diagram describing principal elements of the aeration system.
Due to the large amount of fluid that is treated, WWTPs are very demanding from the energy point of view. This is true especially for the aeration system that is responsible for moving enormous quantities of air to feed biological processes. Thus, the efficiency of this system is a key aspect in WWTP operation and therefore a constant topic of research. For instance, Masłon et al. [] examined the energetic aspect of Polish WWTPs. Energy consumption was assessed at each stage of wastewater treatment, alongside an analysis of opportunities to optimize and reduce it. The share of biological treatment in the facility was found to be high and amounted to 55%. The authors indicated the possibility of reducing electricity consumption by 20–50%. Panepinto et al. [] suggested that aeration can use 55–70% of electricity consumed in the treatment process. He claimed that automated control of DO by managing the aeration in oxidation tanks can bring 20–36% energy savings. In [,] the authors indicate that aeration systems generally represent between 40% and 60% of the total energy costs in wastewater treatment plants. Most of the energy required from the aeration system comes from the blowers.
However, a strong limitation we observed in this field of research is the restricted access to real-world experimentation on the plant. The reasons for this are mainly related to the fact that controlling strategies are often considered a trade secret by private companies managing WWTP. Secondly, the implementation of innovative strategies can be associated with the risk of damaging the installation, which oftentimes is not acceptable. These circumstances highlight the importance of developing numerical models of treatment plants that can be the benchmark for testing new control strategies. Within this context, our research team has also developed numerical models describing the biological treatment of the wastewater [,].
Blower simulation is a commonly used approach to support and enhance testing processes. Authors focus on control valve positioning. Piotrowski et al. [] discuss a model of the aeration system for a biological WWTP located in Matowskie Pastwiska in Northeast Poland. The model was based on a proven approach using an electric analog. Pöyry et al. [] show a simplified modeling approach, emphasizing the control valves and the blowers, and it is tested by developing aeration system models for two Finnish WWTPs.
Dedicated applications can be used to model WWTP simulation. Amerlinck et al. [] present a realistic dynamic blower energy consumption model for WWTP in Bergara with WEST software. SIMBA implementing the ASM3 process to model WWTP in the central stretch of China’s coastline is used by Vergara-Araya et al. in []. The aeration calculates air in accordance with the German design guideline DWA-A 131.
The control of blowers is challenging due to numerous variables that can play a role in their efficient usage. Gu et al. prepared a general overview of control techniques in WWTPs []. Currently, the common solution for blower control is based on proportional–integral–derivative (PID) feedback control. In wastewater treatment plants, PID control is used to regulate blower operation, ensuring optimal oxygen supply for the biological treatment process. However, when operating conditions are highly variable, PID struggles because it does not succeed in quickly adapting to the new conditions. Some approaches proposed to regulate PID parameters making use of aeration profiles [,], adaptive online tuning [], or scheduling adjustment of the parameters for matching diurnal variations in the influent quantity []. Piotrowski et al. [,] employed a fuzzy logic for generating rules for off-line tuned PI controllers when the model of WWTP was unknown. In [] PID with a fuzzy controller is claimed to bring energy savings within just two weeks with respect to stand-alone PID optimized for a specific WWTP configuration. Another promising control strategy is based on model predictive control (MPC). Here the controller employs a mathematical model of the system to predict its future behavior and optimize control actions accordingly. Mulas et al. in [] present such a controller for the Mussalo WWTP and in [] for the Viikinmäki WWTP. Sophisticated control approaches targeting improvement of effluent quality and operating cost involve MPC in a hierarchical control structure. Krawczyk et al. [] present a hierarchical controller for dissolved oxygen in activated sludge processes for the Swarzewo WWTP. Smith et al. [] analyze the WWTP in Wheaton, IL, Sanitary District, discussing the implementation of feed-forward control that involves measurement of the load (disturbance) and adjustment of blowers and valves based on the predicted response. Such a controller can implement non-standard strategies, which depend on the time and foreseen operating conditions. A genetic algorithm paired with MPC was also proposed by De Canete et al. []. Monday et al. [] conducted a review of AI-Driven Control Strategies in the Activated Sludge Process with Emphasis on Aeration Control.
The MPC is superior to classic regulation based on PID controllers. While PID reacts only to current error (and its derivatives/integrals), MPC uses a process model to predict how the plant will behave in the future—it can act before disturbances cause problems. Genetic algorithms are not taken into account owing to their inherent limitations in real-time applications [].
In this paper we present the model in Matlab/Simulink R2024B that enabled us to test several scheduling strategies in the blowers’ controller. We focus on two problems: selection of blowers to activate during WWTP operation and how the delay in blowers’ activation impacts the power consumption. These strategies have an implication on the power consumption of the aeration system but also on other operational conditions, as discussed in the following sections.
This paper is structured as follows. Section 2 gives a general overview of the WWTP in Kraków/Płaszów to which our model is tuned. Section 3 describes the numerical model and the logic used in the control of the blowers. Section 4 presents the tests performed in simulation, their results and discussion. A summary of the work is provided in Section 5.
2. The Case Study of Płaszów WWTP
2.1. General Overview of WWTP
The modeled municipal WWTP is located in the Płaszów district in Kraków (50°01′52.5″ N, 20°01′03.4″ E). The object is a complex waste treatment system that consists of mechanical and biological treatment. The installation consists of numerous pumps, blowers and other electrical equipment, as presented in Figure 3.
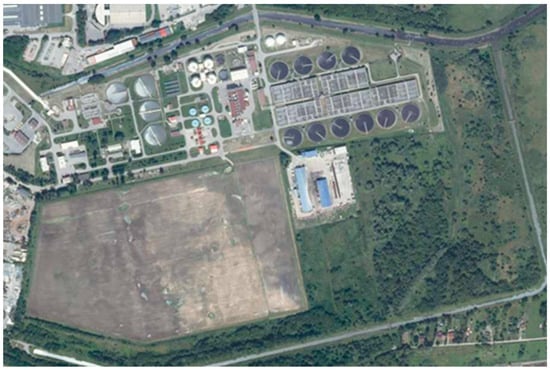
Figure 3.
Aerial image of the installation Source: https://geoportal.gov.pl/ (Head Office of Geodesy and Cartography, Poland), orthophotomap, accessed on 5 November 2025.
The wastewater treatment process at Płaszów WWTP comprises mechanical and biological treatment stages, while the subsequent utilization and thermal disposal of sludge serve to minimize the environmental footprint of the facility []. The system must set the parameters of the effluent within the limits imposed by the law [,]. Table 1 presents the maximal expected parameters of effluent during cleaning.

Table 1.
Expected values of effluent parameters in mg/L according to 91/271/EWG [] in Płaszów WWTP [].
Within each reactor, sewage continuously recirculates through 10 compartments, operating under both aerobic and anaerobic conditions. Each reactor is paired with two secondary clarifiers, where activated sludge is collected for further processing. The control of the wastewater flow within the reactors is fully automated, with pumps ensuring appropriate circulation through both internal and external recirculation loops. To maintain aerobic conditions, air is supplied via common collectors connected to the blowers. Figure 4 presents the bioreactors and common collectors of the plant.
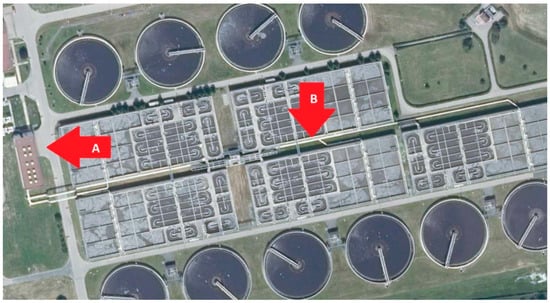
Figure 4.
Reactors in Płaszów WWTP with blower station (A) and air pipes (B). Source: https://geoportal.gov.pl/ (Head Office of Geodesy and Cartography, Poland), orthophotomap, accessed on 5 November 2025.
The structure is equipped with a Supervisory Control and Data Acquisition system (SCADA) that collects real-time data and monitors several processes of the WWTP.
2.2. Aeration Installation
The treatment plant is equipped with six blowers rated at 400 kW each []. Normally, three or four of them are in operation []. Blower delivery rate is regulated by adjusting the blade pitch to stabilize the pipeline pressure at 0.845 bar []. Changes in system pressure result from the control of the damper openings at the reactors, whose positions depend on the demand for oxygen dissolved in the sewage. Blowers limit start-up cycles to allow no more than several starts per hour due to the high currents and mechanical stresses generated. The blowers have internal controllers that count operating hours for maintenance, measure electrical parameters to alarm in case of malfunction or for predictive maintenance for uniform wear.
As mentioned, the control of the blowers is dictated by the pressure measured in a collector that is the result of control of oxygen measured in the reactors (Figure 5). When in the reactors a deviation between the measured and desired oxygen concentrations is observed, then throttling valves are opened, and more air is delivered by the diffusers into the reactors. This, in turn, produces a temporal change to the pressure in the collector that activates the blowers’ controller. The working point of the blowers is then adjusted to restore the pressure in the collector at the predefined setpoint, within an allowable hysteresis margin.
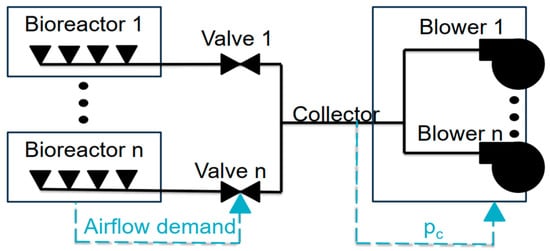
Figure 5.
Control of aeration system implemented in Płaszów WWTP.
3. The Model of Blowers Inspired by Płaszów WWTP
3.1. Model of the Aeration System
A model of the aeration system was developed within the Matlab/Simulink R2024b environment. The model is a simplification of the real installation but yet capable of assessing with good accuracy important output parameters of the system. The model receives the airflow demand (airflowdemand) as input and calculates in the simulation: the airflow generated by the blowers (airflowgenerated) and their momentary power consumption (powermomentary). This calculation is made through two main blocks:
- The aeration controller, which reads the airflowdemand and defines the level of utilization (Lutilization) of the blowers using a predetermined control rule.
- The model of the blowers that reads Lutilization of each blower from the controller and calculates airflowgenerated and powermomentary of the blowers.
A scheme of the model of the aeration system model is depicted in Figure 6.
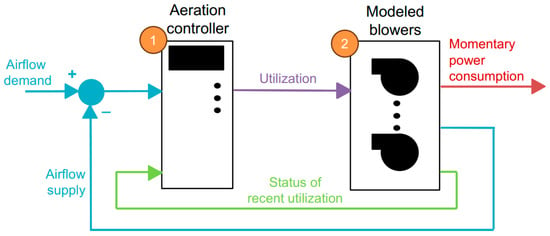
Figure 6.
Diagram of the aeration system model.
As mentioned above, the model is a major simplification of the real aeration system. For instance, the model omits the description of the diffusers, of the valve at the collector, and implements control laws of the blowers that may not be the real ones. These limitations are dictated in part by the complexity of the real system, and in part by our insufficient information regarding several aspects of the blowers’ controller and performance, which are not disclosed by the manufacturer. Furthermore, the model is not linked to the biological model of the reactor, which can be used to determine the airflowdemand. Instead, available SCADA measurements of the real airflow supplied by the blowers to the collector are used as input of the aeration model. Indeed, approximating the airflowdemand with the flow provided by the blowers is admissible because the pressure at the collector is almost constant.
In the following sections we provide a more detailed description of the aeration controller and the blowers’ model we elaborated for this research.
3.2. Aeration Controller
Lutilization is a variable parameter defined in the range [0, 1], which represents the ratio between the amount of airflow that the blower generates at a certain instant of time and the airflow it can generate. The blower’s controller is responsible for setting the level of utilization Lutilization and for activating/deactivating the blowers based on the airflowdemand and airflowgenerated signals. During the operation, Lutilization increases when airflowdemand is larger than airflowgenerated and decreases when the opposite condition is verified. At every simulation step, Lutilization increases or decreases by a small constant amount ∆L = 0.002, unless extreme values of Lutilization are met. Eventually, Lutilization is used to control the modeled blowers, with their operation being linearized in relation to this parameter (Section 3.3).
It should be noted that, for practical reasons, if a blower is active and its Lutilization = 0, the supplied airflowgenerated is not zero but equal to the minimum value that the blower can produce (see Section 3.3). However, the airflowgenerated goes to zero when the blower is deactivated. On the other hand, Lutilization = 1 means that the blower supplies maximal value of airflowgenerated.
The value TONdelay indicates how long the controller delays the activation of the next blower when all running have Lutilization = 1. The value TOFFdelay indicates the delay of deactivation when all operating blowers have Lutilization = 0. By default, both TONdelay and TOFFdelay are equal to 1 h.
The event of the blower’s deactivation is triggered by the following:
- All blowers running at Lutilization = 0 still produce too much air.
- At least one has been operating with Lutilization = 0 for a user-defined TOFFdelay time span.
- At least two blowers are active.
- In the event that all these three conditions are met, the blower with the longest operating time is stopped:
- All the active blowers are running with Lutilization = 1.
- The lastly activated blower has been operating with Lutilization = 1 for at least a user-defined TONdelay time span.
- No more than three blowers are already active, so that the maximum number of active blowers never exceeds four.
The authors investigate the impact of the blower activation algorithm (Section 4.2 and Section 4.3) and the effect of varying delay time of the blowers’ activation (Section 4.4) on momentary power consumption that is considered the final indicator of system performance.
3.3. Blowers’ Performance Model
Conducting experiments on real blowers to obtain an accurate representation of their behavior is not feasible due to operational and confidentiality constraints. Therefore, we characterize the blowers’ performance leveraging SCADA measurements collected during normal operating conditions of the plant over a year. The data include the airflow supplied by the blowers and their instantaneous power consumption. We can observe significant variability resulting from various factors, including operational, technical and practical aspects for such a long period.
It should be noted that, during the examined timeframe, blower no. 6 was rarely in operation, and its collected data were insufficient. Consequently, we decided to approximate its performance curve using that of blower no. 3, which shares the closest specifications. Finally, the chart for blower no. 3 (and blower no. 6) shows ambiguous nonlinearity greater than that of the other blowers. This may be caused by mechanical wear of the blower or by measurements that, for some reason, are more affected by humidity variations than those of the other units.
For each blower, power–airflow characteristics were developed and are illustrated in the scatter plots in Figure 7. Each data point in these diagrams represents a power–airflow pair measured at the same instant in time. The variations in characteristics are due to differences in blower wear and their location within the system. The resulting point clouds exhibit a strong linear relationship; therefore, they were approximated using linear regression models. The corresponding fitted lines are shown as solid lines, and the equations of the regression models are provided in Table 2.
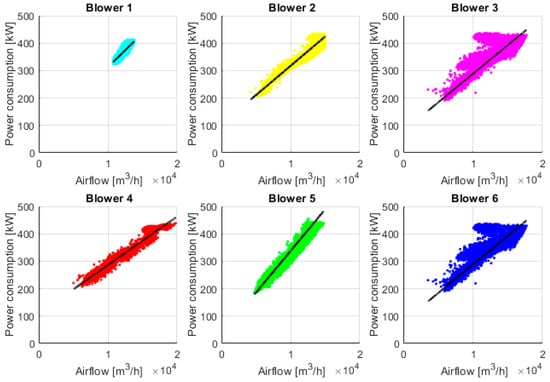
Figure 7.
Momentary power consumption in relation to the airflow generated by the blowers over the observation period with estimated regression lines (the colors were chosen for illustration purposes).

Table 2.
Equation estimated for particular blower presented in Figure 8.
This linear relation is used in the model designed to test different control scenarios. The plots in Figure 7 also provide evidence that blowers generate a minimum and a maximum value of airflow when they are active. These extreme values are listed in Table 2 and define an approximated range of utilization of the blowers.
We used the regression models to map Lutilization to airflowgenerated and powermomentary. It is performed by assuming that Lutilization corresponds to the range of utilization of the blowers depicted in Figure 7, with minimum and maximum values listed in Table 2. For instance, for the blower no. 1, Lutilization = 0 corresponds to airflowgenerated = 10,749 m3/h, while Lutilization = 1 to airflowgenerated = 13,825 m3/h. Similarly, the map between Lutilization and powermomentary for the blower no. 1 has extremes for powermomentary that are 330,651 m3/h and 407,551 m3/h.
Figure 8 shows the relationship between the airflow rate and the amount of power required to generate 1 m3/h of air, based on the same data set as presented in Figure 7. The characteristic curve is similar for each blower. It can be clearly observed that a greater amount of energy is required to deliver 1 m3/h of air at lower flow rates. Additionally, the average value is calculated and included in the figures.
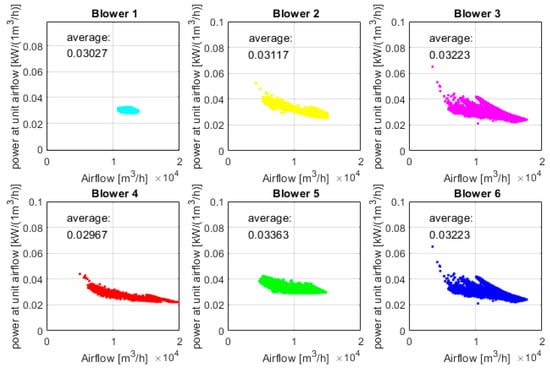
Figure 8.
Relationship between the airflow rate and the amount of power required to generate 1 m3/h of air (the colors were chosen for illustration purposes).
4. Simulation of the Blower’s Operation
4.1. Definition of Tests Performed During Simulations
The model presented above is used to study energy-optimal control. All test modifications are implemented on the controller’s side of the model (no. 1 in Figure 6). We are allowed to use a short, most representative 3-week-long period presenting normal operation of the blower station in Płaszów WWTP. In the figures below we present only the first week of simulation to achieve better visibility.
First, the selection of the blower to activate obeys one of the following rules:
- The blower that has not been working for the longest period of time (Section 4.2).
- According to a priority level based on the blowers’ performance (Section 4.3).
Next, we test a simulation that intentionally delays blower activation and deactivation.
The results of tests are analyzed in terms of momentary power consumption that is considered the final indicator of system performance.
4.2. Start-Up of Blowers with the Longest Downtime
In this case, the controller primarily starts the blower with the longest downtime. This practice is intended to evenly distribute the blowers’ usage, which is expected to lead to more even wear. The results of this analysis are presented in Figure 9 and Figure 10.
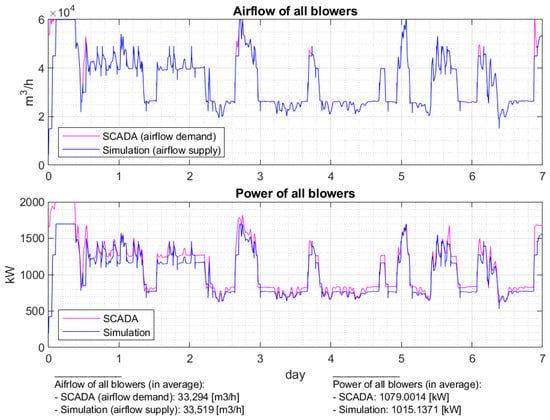
Figure 9.
Controller selects blowers with the longest downtime – airflow and power for all blowers.
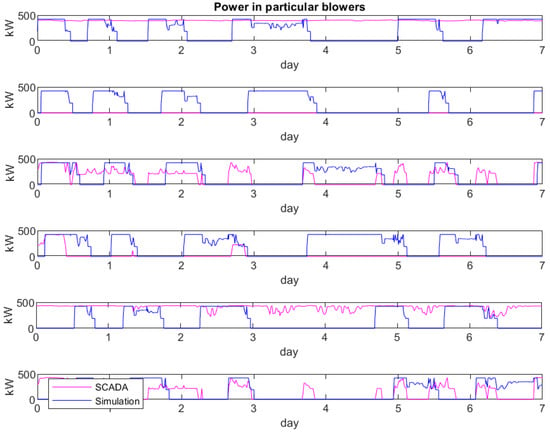
Figure 10.
Controller selects blowers with the longest downtime – power in particular blowers.
The SCADA signal for airflowdemand is compared to the total airflowgenerated by the blowers in the top diagram of Figure 9. The comparison shows good agreement between the two curves, indicating that the aeration controller effectively responds to the airflow needs. The second diagram of this figure also presents the total measured momentary power and the simulated powermomentary. In this case, we observe a small discrepancy between the numerical and measured values, with the former tending to underestimate the latter. We believe that this disagreement can be explained by the various approximations introduced into the model, which result in a systematic error. Finally, at the bottom of the figure, we show the average value of all parameters presented in curves. The values indicate that the model is sufficiently accurate to be used for qualitative comparison of different blower control strategies.
The results of the simulation for particular blowers are presented below. The algorithm shows that all blowers operate one by one. This strategy leads to even their wear.
The diagrams below compare the number of active blowers to that of the total Lutilization. Figure 11 shows all blowers together. Figure 12 presents Lutilization of each blower separately.
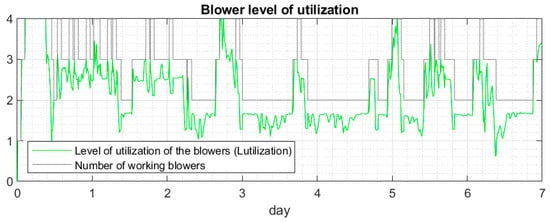
Figure 11.
Controller selects blowers with the longest downtime – blowers’ level of utilization.
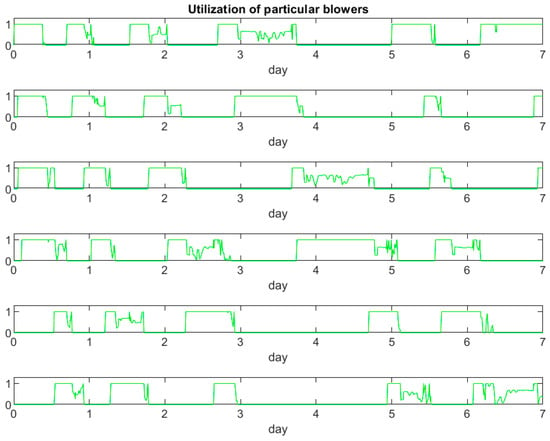
Figure 12.
Controller selects blowers with the longest downtime – utilization of particular blowers.
4.3. Selection of Blowers Determined by Their Working Efficiency
In this case, the controller primarily selects blowers based on their performance. The blower’s priority is assigned using an approximate efficiency, which is the average power required to generate 1 m3/h of air (see Figure 8 and Table 2). The resultant priority values are given in Table 3.

Table 3.
The blowers’ switching priority.
It should be noted that blowers 1, 2, and 3 have the best efficiency. The worst efficiency belongs to blower 5. The blowers with higher priority are activated first. Authors assume that blowers will be selected in the following order: 4 > 1 > 2 > 3 > 6 > 5.
The figures below present simulation results. The graphic below presents how the controller selects the blower.
The results of simulation for particular blowers are presented below.
The results presented in the figures above indicate the expected operation. Blowers 5 and 6 do not start because their efficiency is the lowest.
The average power of blowers (Figure 9 and Figure 13) remains largely unchanged. On the other hand, power in particular blowers (Figure 10 and Figure 14) clearly illustrate different sequences (in the second case, the two least efficient ones do not operate at all).
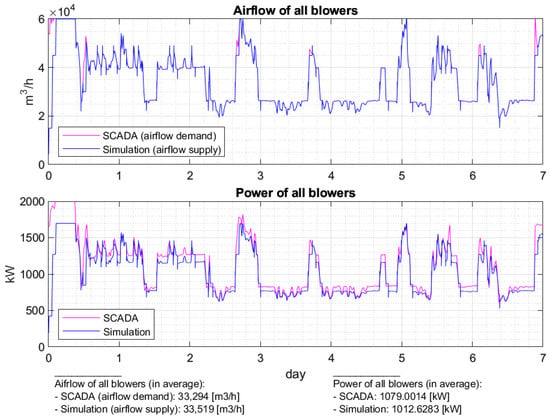
Figure 13.
Controller selects blowers determined by their working efficiency – airflow and power for all blowers.
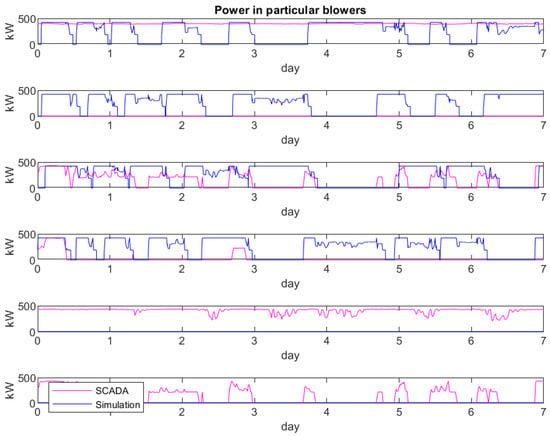
Figure 14.
Controller selects blowers determined by their working efficiency – power in particular blowers.
The performed simulations were compared with the SCADA measurements. A good agreement was achieved in terms of total power consumption (Figure 9 and Figure 13). However, a similar level of consistency was not obtained for the individual blowers (Figure 10 and Figure 14). The discrepancies result from the fact that the model was developed solely on the basis of the assumptions described in this study.
4.4. Influence of Blowers’ Delay Times on Power Consumption
Another observation is that intentionally delaying blower activation can enhance energy efficiency. Several simulations were performed using different activation and deactivation delay times for the blower.
In the previous simulation (Section 4.2 and Section 4.3), a delay of 1 h was applied for both activation (TONdelay) and deactivation (TOFFdelay). In addition, the possibility of delaying blower activation and deactivation by exactly 15 and 30 min was also analyzed. The results of these simulations are shown in the table below (Table 4).

Table 4.
Table showing the effect of delaying blower activation and deactivation on the power of all blowers.
These results indicate a reduction in momentary power consumption that is considered the final indicator of system performance. The delay in starting the next blower allows the others to operate at more efficient operating points, which results in noticeable energy savings. In contrast, when the deactivation of a blower is delayed, the remaining blowers operate at less efficient points, leading to poorer performance and higher momentary energy consumption.
5. Summary
This paper showcases modeling of complex WWTP processes useful to study and verify control strategies of a highly energy-consuming element of the plant, which is the aeration system. The model we developed allowed us to examine the performance of three different control strategies of the blowers.
We present two different methods to start-up the blower on the basis of the longest downtime and their working efficiency. It is evident that the second strategy has only a minor impact on the system’s momentary power consumption. The first strategy is intended to distribute blower operation evenly, leading to more uniform wear.
Another aspect worth noting is that, by intentionally delaying the activation of a blower, energy consumption can be optimized. Delaying the start-up of the next blower causes the remaining ones to operate at higher capacities and in more favorable operating points, which ultimately results in noticeable savings in power consumption.
The presented paper confirms that models of wastewater treatment plants can be used to study energy-optimal control. Especially because the physical system is not feasible due to the sensitivity of the treatment process, digital twins reduce risks.
Author Contributions
Conceptualization, methodology; validation—P.M. and K.K.; investigation, data curation, writing—original draft preparation and editing visualization—P.K. and A.G. All authors have read and agreed to the published version of the manuscript.
Funding
The research conducted as part of this doctoral dissertation was carried out with financial support under the GEKON-EPOS program (contract number GEKON2/O2/266926/3/2015).
Data Availability Statement
The data presented in this study are available upon request from the corresponding author. The data are not publicly available.
Conflicts of Interest
The authors declare no conflicts of interest.
References
- Li, D.; Zou, M.; Jiang, L. Dissolved oxygen control strategies for water treatment: A review. Water Sci. Technol. 2022, 86, 1444–1466. [Google Scholar] [CrossRef] [PubMed]
- Masłon, A.; Czarnota, J.; Szaja, A.; Szulzyk-Cieplak, J.; Łagód, G. The enhancement of energy efficiency in a wastewater treatment plant through sustainable biogas use: Case study from Poland. Energies 2020, 13, 6056. [Google Scholar] [CrossRef]
- Panepinto, D.; Fiore, S.; Zappone, M.; Genon, G.; Meucci, L. Evaluation of the energy efficiency of a large wastewater treatment plant in Italy. Appl. Energy 2016, 161, 404–411. [Google Scholar] [CrossRef]
- Liu, C.; Li, S.; Zhang, F. The oxygen transfer efficiency and economic cost analysis of aeration system in municipal wastewater treatment plant. Energy Procedia 2011, 5, 2437–2443. [Google Scholar] [CrossRef]
- Gu, Y.; Li, Y.; Li, X.; Luo, P.; Wang, H.; Wang, X.; Wu, J.; Li, F. Energy Self-sufficient Wastewater Treatment Plants: Feasibilities and Challenges. Energy Procedia 2017, 105, 3741–3751. [Google Scholar] [CrossRef]
- Król, P.; Gallina, A.; Uhl, T. Sewage influent estimation in BSM1 model of Płaszów WWTP. In Proceedings of the IDAACS’2021, Cracow, Poland, 22–25 September 2021. [Google Scholar] [CrossRef]
- Król, P.; Gallina, A.; Lubieniecki, M.; Uhl, T.; Żaba, T. Sensitivity analysis of a municipal wastewater treatment plant model. MATEC Web Conf. 2019, 252, 05010. [Google Scholar] [CrossRef]
- Piotrowski, R.; Ujazdowski, T. Model of Aeration System at Biological Wastewater Treatment Plant for Control Design Purposes. In Advances in Intelligent Systems and Computing; Springer: Berlin/Heidelberg, Germany, 2020; pp. 349–359. [Google Scholar] [CrossRef]
- Pöyry, L.; Ukkonen, P.; Mulas, M.; Mikola, A. Modelling solution for estimating aeration energy of wastewater treatment plants. Water Sci. Technol. 2021, 84, 3941–3951. [Google Scholar] [CrossRef] [PubMed]
- Amerlinck, Y.; De Keyser, W.; Gorka, U.; Nopens, I. A realistic dynamic blower energy consumption model for wastewater applications. Water Sci. Technol. 2016, 74, 1561–1576. [Google Scholar] [CrossRef] [PubMed]
- Vergara-Araya, M.; Hilgenfeldt, V.; Peng, D.; Steinmetz, H.; Wiese, J. Modelling to lower energy consumption in a large wwtp in china while optimising nitrogen removal. Energies 2021, 14, 5826. [Google Scholar] [CrossRef]
- Gu, Y.; Li, Y.; Yuan, F.; Yang, Q. Optimization and control strategies of aeration in WWTPs: A review. J. Clean. Prod. 2023, 418, 138008. [Google Scholar] [CrossRef]
- Nguyen, D.H.; Latifi, M.A.; Lesage, F.; Mulholland, M. Dynamic simulation and optimization of wastewater treatment plants. In Proceedings of the 2013 International Conference on Process Control (PC), Štrbské Pleso, Slovakia, 18–21 June 2013; pp. 407–414. [Google Scholar] [CrossRef]
- Li, X.; Jing, Y.; Olsson, G.; Yuan, Z. Finding the optimal aeration profiles and do profiles in a plug-flow biological wastewater treatment reactor with a theoretical approach. IFAC Proc. Vol. (IFAC-PapersOnline) 2014, 19, 2715–2720. [Google Scholar] [CrossRef]
- Tzoneva, R. Optimal PID control of the dissolved oxygen concentration in the wastewater treatment plant. In Proceedings of the AFRICON 2007, Windhoek, Namibia, 26–28 September 2007; pp. 1–7. [Google Scholar] [CrossRef]
- Åmand, L.; Carlsson, B. Aeration control with gain scheduling in a full-scale wastewater treatment plant. IFAC Proc. Vol. (IFAC-PapersOnline) 2014, 47, 7146–7151. [Google Scholar] [CrossRef]
- Piotrowski, R.; Zawadzki, A. Multiregional PI control strategy for dissolved oxygen and aeration system control at biological wastewater treatment plant. In Proceedings of the 2012 IEEE 17th International Conference on Emerging Technologies & Factory Automation (ETFA 2012), Krakow, Poland, 17–21 September 2012; pp. 1–8. [Google Scholar] [CrossRef]
- Han, Y.; Brdys, M.A.; Piotrowski, R. Nonlinear PI control for dissolved oxygen tracking at wastewater treatment plant. IFAC Proc. Vol. 2008, 41, 13587–13592. [Google Scholar] [CrossRef]
- Dainotto, A.; Barni, G.; Giaccherini, F.; Magnolfi, V.; Marsili-Libelli, S.; Simonetti, I. A multilevel coordinated control strategy for energy conservation in wastewater treatment plants. IFAC Proc. Vol. 2012, 45, 288–293. [Google Scholar] [CrossRef]
- Mulas, M.; Corona, F.; Sirvio, J.; Hyvonen, S.; Vahala, R. Full-scale implementation of an advanced control system on a biological wastewater treatment plant. IFAC-PapersOnLine 2016, 49, 1163–1168. [Google Scholar] [CrossRef]
- Mulas, M.; Tronci, S.; Corona, F.; Haimi, H.; Lindell, P.; Heinonen, M.; Vahala, R.; Baratti, R. Predictive control of an activated sludge process: An application to the Viikinmäki wastewater treatment plant. Process Control 2015, 35, 89–100. [Google Scholar] [CrossRef]
- Krawczyk, W.; Piotrowski, R.; Brdys, M.A.; Chotkowski, W. Modelling and Identification of Aeration Systems for Model Predictive Control of Dissolved Oxygen—Swarzewo Wastewater Treatment Plant Case Study. IFAC Proc. Vol. 2007, 40, 43–48. [Google Scholar] [CrossRef]
- Smith, R. How to Control Activated Sludge with Online Sensors. 2013. Available online: https://www.xylem.com/siteassets/brand/wtw/resources/white-papers/wtw-how-to-control-activated-sludge-with-online-sensors.pdf (accessed on 2 November 2025).
- de Canete, J.; del Saz-Orozco, P.; Garcia-Moral, I. Aeration Control and Parameter Soft Estimation for a Wastewater Treatment Plant Using a Neurogenetic Design, in Advances. In Computational Intelligence; Springer: Berlin/Heidelberg, Germany, 2011; pp. 315–322. [Google Scholar] [CrossRef]
- Monday, C.; Zaghloul, M.S.; Krishnamurthy, D.; Achari, G. A Review of AI-Driven Control Strategies in the Activated Sludge Process with Emphasis on Aeration Control. Water 2024, 16, 305. [Google Scholar] [CrossRef]
- Kudłacz, T.; Musiał-Malago, M. Funkcjonalne Miasto w Teorii i Praktyce na Przykładzie Krakowa i Krakowskiego Obszaru Metropolitarnego. 2018. Available online: https://wydawnictwo.uek.krakow.pl/images/pdf/kudlacz-musial-malago-funkcjonalne-miasto.pdf (accessed on 28 August 2024).
- Opis Projektu—Oczyszczalnia Ścieków Płaszów II w Krakowie. Available online: https://wodociagi.krakow.pl/pl/projekty/projekty-unijne/oczyszczalnia-sciekow-plaszow-ii-w-krakowie (accessed on 25 September 2025).
- Dyrektywa Rady z Dnia 21 Maja 1991 r. Dotycząca Oczyszczania Ścieków Komunalnych (91/271/EWG), 1991. Available online: https://orka.sejm.gov.pl/Drektywy.nsf/all/31991L0271/$File/31991L0271.pdf (accessed on 2 November 2025).
- HV-TURBO® Centrifugal Turbo Compressor. Available online: https://files.chartindustries.com/Howden_HVTurbo_Brochure.pdf (accessed on 2 November 2025).
- Biedrzycka, A. Kierunek: Pasywna oczyszczalnia Płaszów. Nowoczesne Budownictwo Inżynieryjne, November-December 2016, pp. 14–17. Available online: https://nbi.com.pl/content/uploads/assets/NBI-pdf/2016/6_69_2016/Pdf/4_MPWiK_Krakow.pdf (accessed on 2 November 2025).
Disclaimer/Publisher’s Note: The statements, opinions and data contained in all publications are solely those of the individual author(s) and contributor(s) and not of MDPI and/or the editor(s). MDPI and/or the editor(s) disclaim responsibility for any injury to people or property resulting from any ideas, methods, instructions or products referred to in the content. |
© 2025 by the authors. Licensee MDPI, Basel, Switzerland. This article is an open access article distributed under the terms and conditions of the Creative Commons Attribution (CC BY) license (https://creativecommons.org/licenses/by/4.0/).