Abstract
The SF6/N2 gas mixture is a key eco-friendly alternative to SF6 in power equipment. However, its insulation and decomposition behaviors under realistic conditions of varying pressure and electric field non-uniformity remain insufficiently studied. This study establishes an experimental platform to systematically investigate the power–frequency breakdown and decomposition characteristics of a 3:7 SF6/N2 mixture. Breakdown tests and critical field strength calculations were conducted under different pressures and electric field uniformities, followed by gas composition analysis. Results demonstrate that the proposed critical breakdown field strength method effectively predicts the mixture’s breakdown voltage. Furthermore, a range of decomposition products, including NF3, SOF2, CO2, and C2F6, were identified, whose concentrations generally decreased with rising pressure. These findings provide valuable experimental data and a predictive tool for optimizing the insulation design and condition monitoring of SF6/N2 gas-insulated equipment.
1. Introduction
As the global energy structure shifts toward greener and low-carbon alternatives [1], power systems are placing higher demands on the safety and environmental sustainability of high-voltage electrical equipment [2,3,4,5]. SF6 possesses an exceptionally high global warming potential (GWP), about 23,500 times greater than that of CO2, which poses a serious threat to the climate [6,7,8,9,10]. Therefore, identifying environmentally friendly alternatives to SF6 is urgent. In recent years, SF6-based gas mixtures have emerged as promising transitional solutions, capable of substantially reducing GWP while maintaining 60–80% of the insulation strength of pure SF6 [11,12,13,14,15]. Nitrogen (N2) has attracted significant research attention because of its low liquefaction temperature (–196 °C), chemical stability, and low cost [16,17,18,19].
The gas mixing ratio is a critical factor influencing insulation performance [20,21]. Experimental studies by Pengcheng Sun revealed that adding 20–30% SF6 to N2 enabled the mixture to achieve roughly 80% of the insulation strength of pure SF6 [22]. Similarly, Xintao Li found that an SF6/N2 mixture with a 3:7 ratio exhibited a pronounced synergistic effect and excellent insulation properties [23]. Consequently, an SF6/N2 mixing ratio of 3:7 is considered an optimal balance between insulation performance and economic efficiency.
During actual power equipment operations, internal electric field distributions often vary due to factors such as impurity intrusion, thereby compromising the insulating properties of the gas media [24]. Victor F. Tarasenko investigated the DC discharge characteristics of SF6/N2 gas mixtures [25]. However, systematic studies on SF6/N2 gas mixtures under different electric field configurations at power frequency remain limited, highlighting the need for further investigation.
Additionally, electrical equipment failures can lead to the decomposition of gaseous insulation media, and the resulting byproducts further degrade insulation strength, thereby threatening the stable operation of power systems. Shan Gao reported that SOF2 had the highest yield under partial discharge conditions [26]; Haoxin Chen experimentally investigated the decomposition characteristics of SF6/N2 mixtures under overheating faults [27]; and Fuping Zeng developed a fault diagnosis method for pure SF6 based on characteristic decomposition products [28]. However, the decomposition behavior of SF6/N2 mixtures under power–frequency breakdown conditions remains poorly understood. Therefore, investigating the evolution of decomposition products in SF6/N2 mixtures after power–frequency breakdown is of fundamental importance for advancing their use in fault diagnosis.
Although several studies have examined the breakdown behavior of SF6/N2 gas mixtures, the calculation of the critical breakdown field strength remains insufficiently developed. Furthermore, the insulation performance of SF6/N2 mixtures under varying pressures and electric field distributions remains poorly understood, limiting the availability of systematic theoretical guidance for insulation design in engineering applications. In addition, comprehensive data for fault diagnosis in SF6/N2 gas-insulated equipment are still lacking.
Based on the current research status, this study established an experimental platform to investigate the power–frequency insulation and decomposition characteristics of gas mixtures. The power–frequency breakdown voltages of SF6/N2 gas mixtures with a 3:7 ratio were systematically measured under varying pressures and electric field conditions and compared with results calculated from the critical breakdown field strength model to verify its accuracy. After each breakdown, gas samples were collected and analyzed to examine how decomposition products varied with breakdown number, electric field form, and gas pressure, aiming to provide a theoretical foundation and experimental data for the structural optimization and condition monitoring of SF6/N2 gas-insulated equipment.
2. Materials and Methods
2.1. Test Platform and Electric Field Simulation
Figure 1 and Figure 2 show the schematic and photograph of the experimental setup for power–frequency breakdown and decomposition tests, respectively. The test system consists of the following components: a 10 kV isolation transformer, a 220 V AC power supply, a voltage regulator (0–250 V output range), a 10 kVA step-up transformer, a 50 kΩ current-limiting resistor, a capacitor voltage divider (ratio 1:3000) (made by Wuhan Huatian Electric Power Automation Co., Ltd., Wuhan, China), a discharge chamber (see Figure 1) (made by Chongqing Diyu Electric Co., Ltd., Chongqing, China) equipped with an air inlet, outlet, observation window, and pressure gauge. The chamber housed made by Wuhan Guruidi Technology Co., Ltd., (Wuhan, China) interchangeable copper electrodes of various geometries to serve as defect models, a discharge signal acquisition unit (Yokogawa DL850E oscilloscope from Japan), and a decomposition product analysis unit (Shanghai Langxi SF6 Helium Ion Comprehensive Detector).
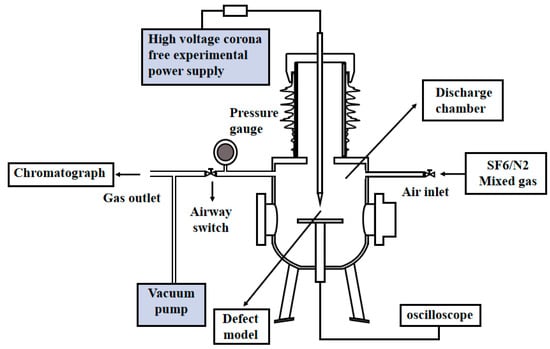
Figure 1.
Wiring schematic diagram of the power frequency breakdown and decomposition test platform.
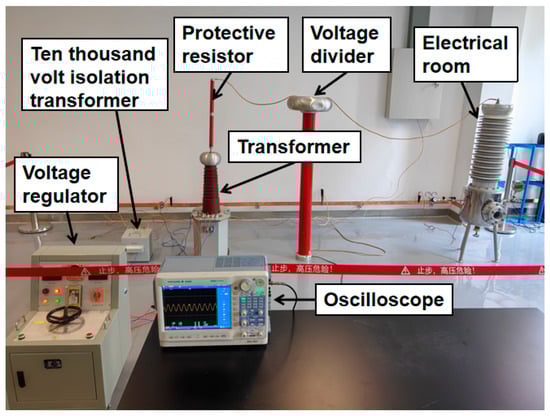
Figure 2.
Physical picture of the power frequency breakdown and decomposition test platform.
To study the power–frequency insulation and decomposition characteristics of SF6/N2 gas mixtures under different electric field configurations, electrodes with various geometries were employed to simulate quasi-uniform, slightly non-uniform, and highly non-uniform fields.
The degree of field uniformity among different electrodes is typically evaluated using the electric field nonuniformity coefficient [29], calculated as follows:
In this formula, represents the maximum and average electric field strengths; denotes the voltage between electrodes; and is the electrode spacing.
The electrode models were simulated and analyzed using finite element software (COMSOL Multiphysics 6.2). For the sphere–sphere electrode configuration, a 10 kV voltage was applied to the upper sphere while the lower sphere was grounded. In the needle–plate configuration, a 10 kV voltage was applied to the needle electrode while the plate electrode was grounded. All electrodes were made of brass, and an ultra-fine mesh was used for the simulation grid. The electric field distribution diagrams corresponding to the various electrode structures are presented in Figure 3.
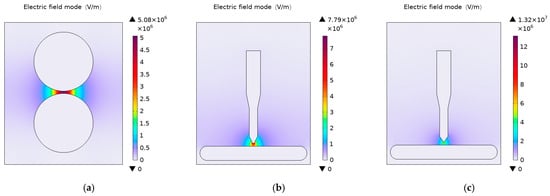
Figure 3.
Simulation results of electrode electric field: (a) Spherical electrode; (b) R = 1 mm Needle-Plate electrode; (c) R = 0.2 mm Needle-Plate electrode.
Table 1 lists the electric field nonuniformity coefficients of the electrodes shown in Figure 3, calculated using Equations (1) and (2). Generally corresponds to a uniform electric field; to a quasi-uniform field; to a slightly non-uniform field; to a highly non-uniform field. Therefore, spherical electrodes were used to simulate quasi-uniform electric fields, whereas needle–plate electrodes with curvature radii of 1 mm and 0.2 mm represented slightly and highly non-uniform fields, respectively. These configurations were adopted to investigate the power–frequency breakdown and decomposition behaviors of the gas mixtures.

Table 1.
Electric field nonuniformity coefficients of each electrode model.
2.2. Test Method and Detection System
In this study, an SF6/N2 gas mixture with a 3:7 mixing ratio—commonly used in power systems—was selected for testing [30]. To ensure experimental accuracy, the laboratory temperature and relative humidity were maintained at 20 ± 1 °C and 50 ± 2%, respectively, throughout the tests. To minimize the influence of electrode surface roughness on power–frequency breakdown performance, new electrodes were replaced after each test series. The tests covered engineering application scenarios ranging from atmospheric pressure to the typical maximum operating pressure of GIS equipment. Power–frequency breakdown tests were conducted under gas pressures ranging from 0.1 MPa to 0.6 MPa in quasi-uniform, slightly non-uniform, and highly non-uniform electric fields. Each test group underwent 50 breakdown cycles. A 3 min interval was maintained between successive tests to allow sufficient recovery of air-gap insulation. Gas samples were collected after every ten breakdown events for compositional analysis to examine the decomposition behavior of the gas mixture under breakdown conditions. For comparison, fifty power–frequency insulation tests using pure SF6 were conducted under three electric field configurations at 0.1–0.6 MPa to evaluate the feasibility of applying SF6/N2 mixtures.
To perform qualitative and quantitative analyses of the collected gas samples, an LX-3100A portable SF6 helium-ion comprehensive detector (Figure 4) was employed for gas composition analysis.
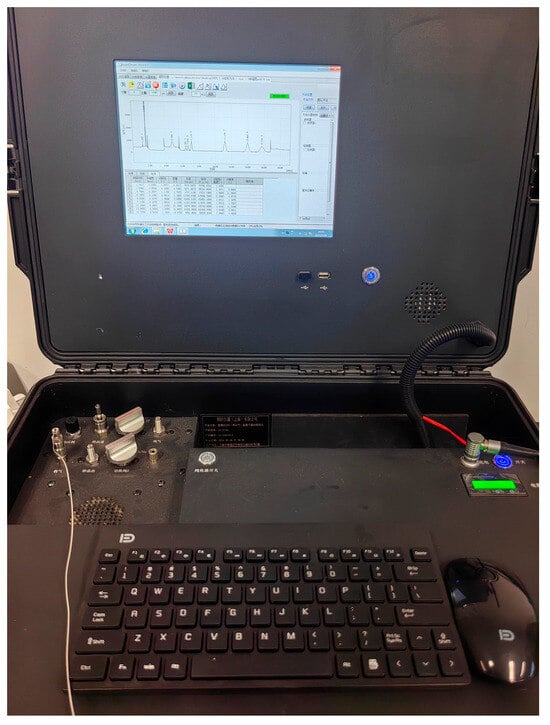
Figure 4.
Portable SF6 helium ion comprehensive detector.
The reference gas chromatogram and the retention times of each component are presented in Figure 5. A total of fifteen decomposition products were detected, satisfying the experimental requirements.

Figure 5.
Detector standard gas spectrum: (a) Detection channel pdd1; (b) Detection channel pdd2.
3. Test Results and Analysis
3.1. Power Frequency Breakdown Characteristics of SF6/N2 Mixed Gas
Figure 6 plots the breakdown voltage of the gas mixture as a function of pressure under quasi-uniform field conditions with a 2 mm electrode gap. The breakdown voltage of the mixture closely mirrors that of pure SF6, with both exhibiting a significant increase with rising pressure, although the rate of increase gradually decays at higher pressures. The dielectric strength of the gas mixture at 0.5 MPa is comparable to that of pure SF6 at 0.4 MPa. These results indicate that the gas mixture can effectively substitute for pure SF6 in quasi-uniform fields by a moderate increase in the filling pressure.
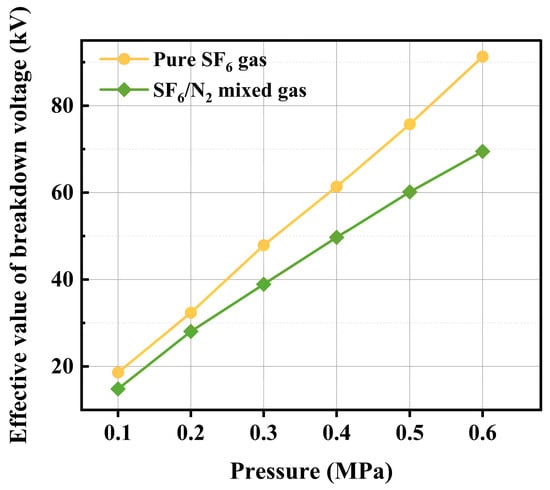
Figure 6.
Variation in the power frequency breakdown voltage of the quasi-uniform electric field SF6 and the mixed gas with pressure.
As illustrated in Figure 7, the breakdown voltage trends of both gases between 0.1 and 0.4 MPa under a slightly non-uniform electric field resemble those observed in a quasi-uniform field. With increasing pressure, the breakdown voltage of the gas mixture rises at a decreasing rate and ultimately reaches saturation. The difference between the breakdown voltages of pure SF6 and the gas mixture becomes increasingly significant at higher pressures. This suggests that under slightly non-uniform fields, the sensitivity of breakdown voltage to pressure variations diminishes at high pressures. Consequently, increasing the filling pressure provides only limited enhancement of power–frequency insulation performance.
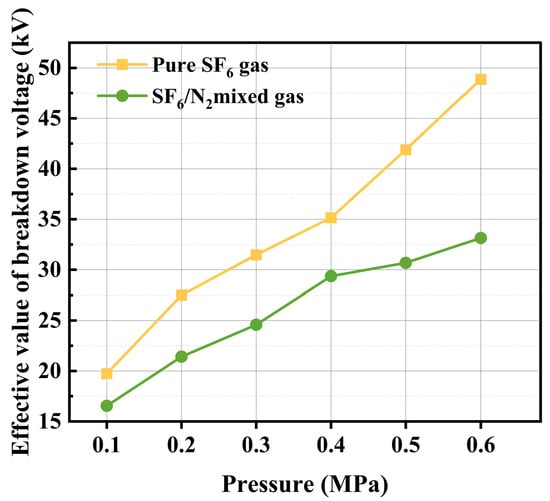
Figure 7.
Variation in the power frequency breakdown voltage of the slightly non-uniform electric field SF6 and the mixed gas with pressure.
Figure 8 illustrates the variation in power–frequency breakdown voltage of the test gas under an extremely non-uniform electric field. Under extremely non-uniform electric fields, the breakdown voltage trend differs markedly from those observed in quasi-uniform and slightly non-uniform fields. When the pressure rises from 0.1 to 0.2 MPa, the breakdown voltage of the gas mixture increases by 2.19 kV. As pressure continues to rise, the rate of increase in the breakdown voltage begins to decline. When the pressure rises from 0.5 to 0.6 MPa, the breakdown voltage increases by only 0.473 kV, indicating near-saturation. The breakdown voltage trend of the gas mixture resembles that of pure SF6 under identical conditions, indicating that the power–frequency breakdown voltage of the mixture is weakly sensitive to pressure changes in extremely non-uniform fields. Therefore, increasing the filling pressure offers little improvement in the insulation performance of the gas medium.
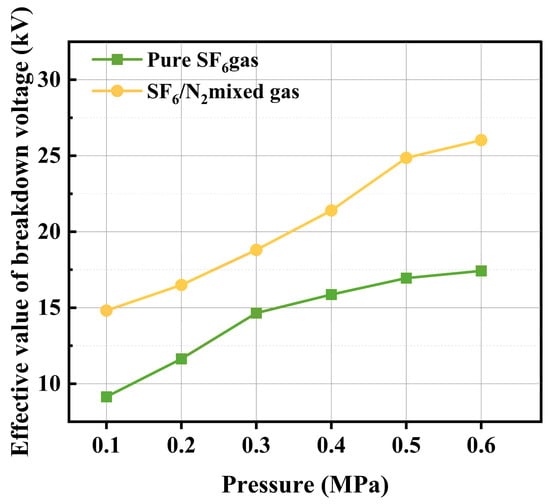
Figure 8.
Variation in the power frequency breakdown voltage of the non-uniform field SF6 and the mixed gas with pressure.
Under the experimental conditions of this study, Figure 9 illustrates the influence of electric field uniformity on the breakdown voltage of both the gas mixture and pure SF6. As the electric field nonuniformity increases, specifically when the nonuniformity coefficient rises from 1.026 to 2.54, the breakdown voltage of the gas mixture decreases accordingly. Notably, the breakdown voltage of the mixture at 0.3 MPa in a quasi-uniform field exceeds that measured at 0.6 MPa in slightly or extremely non-uniform fields. This demonstrates a strong correlation between the power–frequency breakdown voltage of the gas insulation medium and the degree of electric field nonuniformity, emphasizing that the effect of field distribution on insulation performance cannot be ignored. This phenomenon can be attributed to the space-charge distortion effect [31]. In a non-uniform electric field, space charges produced by the migration of charged particles further distort the original field distribution, causing strong local field enhancement and triggering premature breakdown [32]. Comparative test results show that in extremely non-uniform fields, the improvement in breakdown voltage due to increased gas pressure is over 60% lower than that observed in quasi-uniform fields. This finding suggests that gas pressure parameters and electrode structures should be comprehensively optimized in engineering design to facilitate the application of the SF6/N2 gas mixture.
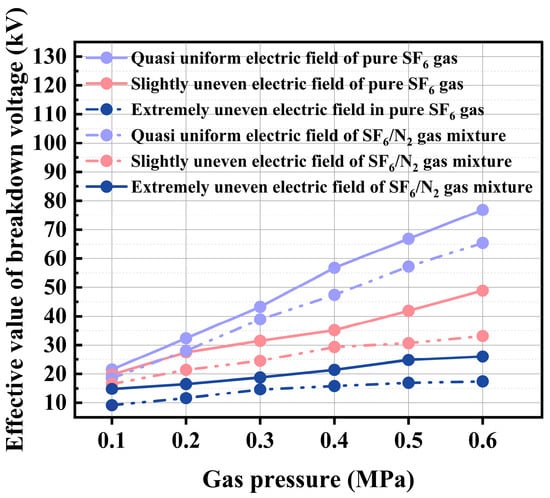
Figure 9.
Power frequency breakdown voltage of SF6 and the mixed gas varying with the non-uniformity of the electric field and the pressure.
3.2. Decomposition Characteristics of SF6/N2 Mixture Under Breakdown Condition
3.2.1. Variation Characteristics of C2F6, CF4, CH4, CO2 and NF3 Production
The carbon-containing decomposition products identified in this experiment include CO2, C2F6, CH4, and CF4. Carbon atoms mainly originate from the discharge-induced decomposition of carbon-based solid insulating materials, such as epoxy resin, present in the equipment. Of these carbon-containing products, CO2 exhibits the highest concentration CO2 exhibits the highest concentration, which varies with both pressure and the number of breakdown events, as shown in Figure 10. When the pressure rises from 0.2 MPa to 0.3 MPa, the CO2 concentration decreases significantly across all three electric field types: by 37.6% in the quasi-uniform field, 21.5% in the slightly non-uniform field, and 16.8% in the extremely non-uniform field. This reduction may result from the gradual consumption of carbon atoms within the discharge chamber as the number of breakdown events increases. Under these conditions, the formation of other carbon-containing decomposition products likely becomes the dominant reaction pathway, surpassing that of CO2. Furthermore, unlike the other two field types, CO2 concentration in the extremely non-uniform field shows a saturation trend as the number of breakdown events increases. This behavior can be explained by the low corona inception voltage characteristic of extremely non-uniform fields, which causes early consumption of available carbon atoms during initial discharge phases, leading to the observed saturation.
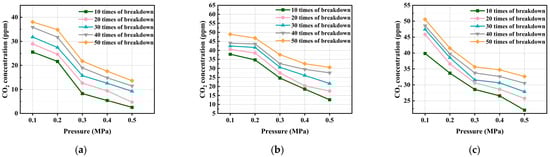
Figure 10.
Curve of CO2 concentration variation: (a) Variation curve of CO2 concentration in quasi uniform electric field with pressure and breakdown times; (b) Variation curve of CO2 concentration in slightly non-uniform electric field with pressure and breakdown times; (c) Variation curve of CO2 concentration in extremely non-uniform electric field with pressure and breakdown times.
Among other carbon-containing decomposition products, the detected quantities of CF4 and CH4 are minimal. The maximum concentration of CH4 is only 0.02 ppm, while that of CF4 is 0.0046 ppm, both negligible compared to other decomposition products. Similar to CO2, the concentration of C2F6 decreases with increasing pressure and increases with the number of breakdown events. However, unlike CO2, C2F6 concentration does not decrease significantly in the low-pressure range (0.1–0.4 MPa) with rising pressure. This suggests that under low-pressure conditions, the formation pathway of C2F6 is less sensitive to pressure changes than that of CO2, and the pathway leading to C2F6 formation dominates the reaction system.
Nitrogen-containing decomposition products can act as characteristic markers for SF6/N2 gas mixtures. In this experiment, NF3 was the only nitrogen-containing decomposition product detected. Figure 11 shows the variation of NF3 concentration under a quasi-uniform electric field. As shown, NF3 concentration increases with the number of breakdown events. In previous simulations of overheating faults in SF6/N2 mixtures, NF3 was not detected among the partial overheating decomposition products, indicating that its formation requires high energy input. Under discharge conditions, the instantaneous local temperature can reach thousands to tens of thousands of degrees Celsius, sufficient to ionize both SF6 and N2 [33]. The resulting fluoride ions (F−) and nitrogen ions (N+) combine to form NF3. Therefore, NF3 can be considered a characteristic decomposition product of SF6/N2 gas mixtures.
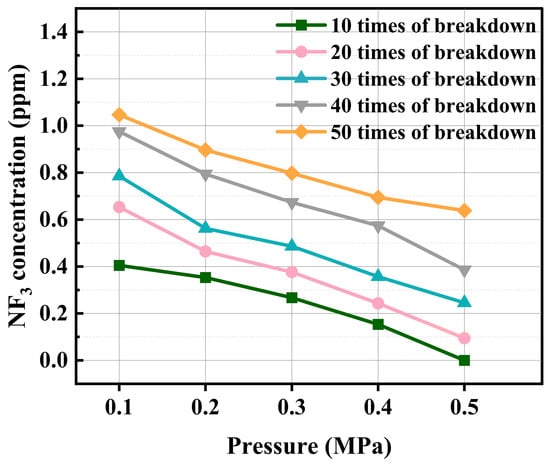
Figure 11.
Variation curve of NF3 concentration in quasi uniform electric field with pressure and breakdown times.
3.2.2. Variation Characteristics of SO2, SOF2, H2S and COS Production
The sulfur-containing decomposition products detected in this experiment included SO2, SOF2, H2S, and COS. Among these, SOF2 emerged as a primary decomposition product, appearing in relatively high concentrations at an early stage and becoming detectable after only ten power–frequency breakdown events. Figure 12 shows the variation of SOF2 concentration with gas pressure and the number of breakdowns under different electric field configurations. The concentration of SOF2 increased with the number of breakdowns across all field types. For instance, at 0.1 MPa, the SOF2 concentration after 50 breakdowns was 3.8 times that after 10 breakdowns in a quasi-uniform field, compared to 4.3 times in an extremely non-uniform field. This behavior is consistent with SOF2 being primarily generated through the hydrolysis of SF4 during SF6 decomposition [34]. The difference in final concentration can be attributed to the discharge characteristics of each field type. In quasi-uniform fields, the discharge energy is more concentrated, leading to rapid moisture consumption in the initial stages. Consequently, the rate of SOF2 formation slowed in later stages, resulting in a lower final concentration compared to extremely non-uniform fields, where moisture was consumed more gradually over a larger number of lower-energy discharges. Furthermore, over the pressure range of 0.1–0.5 MPa and after 50 breakdowns, the SOF2 concentration decreased by 62.7% in the quasi-uniform field, 60% in the slightly non-uniform field, and 65% in the extremely non-uniform field. This indicates that increased gas pressure, which raises SF6 molecular density and shortens the electron mean free path, effectively inhibits the dissociation of SF6 molecules and thereby reduces the formation of SOF2. Finally, at identical gas pressures and numbers of breakdowns, the concentration of SOF2 was highest in the extremely non-uniform electric field, exceeding that in the slightly non-uniform and quasi-uniform fields. This is because the highly localized electric field strength near the electrode tip in extremely non-uniform configurations lowers the corona inception voltage [35] and promotes continuous low-energy discharges. In contrast, in quasi-uniform fields, energy is released less frequently through full breakdown events. This fundamental difference in discharge behavior accounts for the higher SOF2 yields under extremely non-uniform electric field conditions.
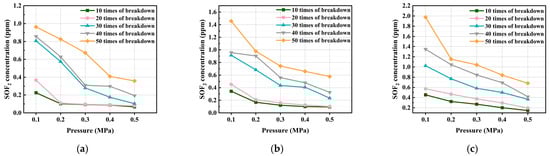
Figure 12.
SOF2 concentration variation curve: (a) Variation curve of SOF2 concentration in quasi uniform electric field with pressure and breakdown times; (b) Variation curve of SOF2 concentration in slightly non-uniform field with pressure and breakdown times; (c) Variation curve of SOF2 concentration in extremely non-uniform electric field with pressure and breakdown times.
The remaining sulfur-containing decomposition products detected in this study include SO2, H2S, and COS. Among these, SO2 was detectable only under low-pressure conditions (0.1–0.4 MPa) and after more than 30 breakdown events, with its concentration remaining low. The highest observed SO2 concentration was 0.47 ppm, occurring under an extremely non-uniform electric field at 0.1 MPa after 50 breakdowns. This indicates that SO2 formation is not a primary pathway in SF6 decomposition under breakdown conditions. H2S and COS were detected only under extremely non-uniform electric fields following 50 breakdowns. The maximum concentration of H2S was 0.16 ppm, observed at 0.2 MPa after 50 breakdowns, whereas COS reached an even lower peak concentration of 0.11 ppm. Given their occurrence only under severe discharge conditions in extremely non-uniform fields, both COS and H2S can be considered characteristic decomposition products indicative of intense breakdown events in such field configurations.
4. Insulation Strength Calculation
The critical breakdown field strength refers to the electric field strength when the growth and disappearance of electrons in a gas medium reach equilibrium. This value can represent the insulation strength of gas medium. It is necessary to introduce the data of the collision cross-sectionwhen calculating the critical breakdown field strength N2/SF6. Section data are taken from the S.F. Biagi Database [36]. The electron collision reaction rate can be calculated using Equation (3) by combining the electronic energy distribution function with the collision interface data [37].
In the above formula, is the normalized constant, , is the electronic mass, is the electron density, is the electron energy, is the type K impact section, is the isotropic part of the electron energy distribution function; Calculate the reduced ionization coefficient and the reduced adsorption coefficient through Equation (4).
In the above formula, is the electric field strength, is the particle number density, and is the gas pressure. The effective ionization coefficient can be obtained by Equation (5) [38,39].
In this paper, the of pure SF6 and the SF6/N2 mixture with a mixing ratio of 3:7 are calculated in the range of 100–1500 Td. The corresponding field strength at is the calculated critical breakdown field strength . The calculation results are shown in Figure 13, in which the critical breakdown field strengths of SF6/N2 gas mixture and SF6 are 289.02 Td and 354.8 Td, respectively.
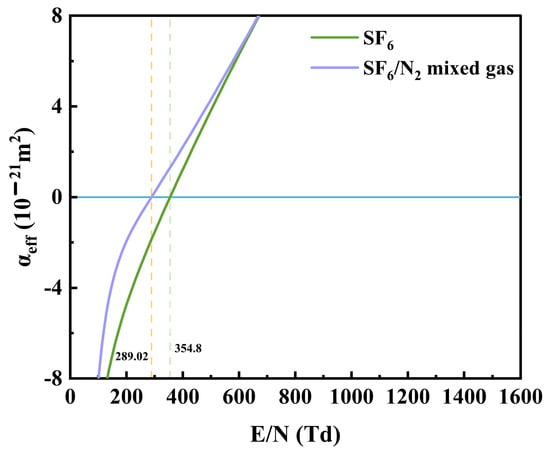
Figure 13.
Equivalent effective ionization coefficient.
On the basis of obtaining the critical breakdown field strength, the breakdown voltage under non-uniform electric field conditions can be calculated by Equation (6) [40], where is the nonuniformity coefficient of electric field and is the distance between electrodes.
Calculate the breakdown voltage of SF6 and SF6/N2 gas mixtures under quasi uniform field according to Equation (6) and compare it with the test results, as shown in Figure 14.
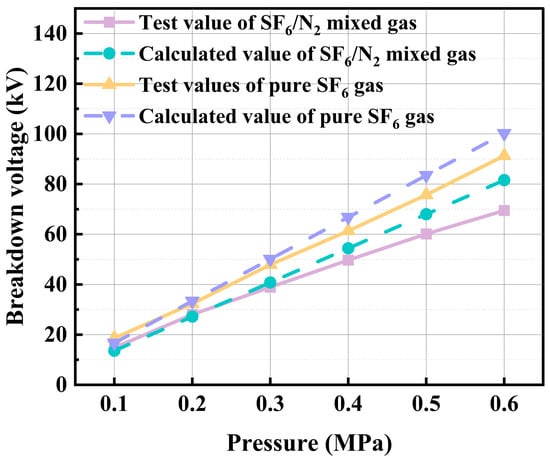
Figure 14.
Comparison of breakdown voltage test value and calculated value.
As illustrated, the breakdown voltage calculated using the critical breakdown field strength method accurately reproduces the pressure-dependent variation trend of gas breakdown voltage in a uniform electric field. However, at higher pressures, the calculated values fail to capture the saturation behavior observed experimentally, resulting in deviations in predicted breakdown voltage under high-pressure conditions. The maximum prediction error reaches 14.8% at 0.6 MPa. In contrast, the method provides relatively accurate predictions under low-pressure conditions, with errors within 8% in the range of 0.1–0.4 MPa. These results indicate that the critical breakdown field strength method can effectively evaluate the insulation performance of gaseous dielectrics at low pressures and may serve as a reliable criterion for predicting breakdown voltage in engineering applications.
5. Conclusions
This study systematically investigated the power–frequency breakdown characteristics and decomposition behavior of SF6/N2 mixtures (3:7), providing critical insights for the insulation design and fault diagnosis of eco-friendly gas-insulated equipment. The main conclusions are summarized as follows:
- (1)
- In a quasi-uniform electric field, the power–frequency breakdown voltage of the SF6/N2 mixture (mixing ratio 3:7) increases approximately linearly with gas pressure. At 0.5 MPa, the dielectric strength of the mixture is comparable to that of pure SF6 at 0.4 MPa, suggesting that insulation performance can be enhanced by increasing the filling pressure in practical applications. In a slightly non-uniform field, the voltage increase rate declines with pressure, indicating reduced sensitivity and a gradual saturation trend. In an extremely non-uniform field, the breakdown voltage shows minimal variation with pressure and exhibits pronounced saturation behavior.
- (2)
- Decomposition products of SF6/N2 mixtures under power–frequency breakdown include SO2, SOF2, COS, H2S, CO2, C2F6, CF4, CH4, and NF3. Among these, SOF2, CO2, C2F6, and NF3 are primary products, with concentrations decreasing as gas pressure rises. H2S and COS serve as characteristic indicators of severe breakdown events, while NF3 is a distinctive product that differentiates SF6/N2 mixtures from pure SF6.
- (3)
- The critical breakdown field strength method accurately predicts the insulation performance of gaseous dielectrics at low pressures (0.1–0.4 MPa) and serves as a reliable criterion for estimating breakdown voltage in gas-insulated systems for engineering applications.
Author Contributions
Conceptualization, Y.X. and J.X.; Software, Y.X.; methodology, J.W., X.L. and Z.G.; validation, L.L. and Z.G.; formal analysis, J.W.; investigation, Y.X.; resources, J.X. and X.L.; data curation, L.L.; writing—original draft preparation, J.W.; writing—review and editing, J.W. and Z.G.; visualization, X.L.; supervision, L.L. and J.X.; project administration, Z.G.; funding acquisition, J.X. All authors have read and agreed to the published version of the manuscript.
Funding
This research was funded by the Science and Technology Project of State Grid Sichuan Electric Power Company, with the project number being: 52199723002Z.
Data Availability Statement
The original contributions presented in this study are included in the article. Further inquiries can be directed to the corresponding author.
Conflicts of Interest
Author Lijuan Liao was employed by the company State Grid Sichuan Electric Power Company Ziyang Power Supply Company and Yalong Xia was employed by the company State Grid Sichuan Electric Power Research Institute. The remaining authors declare that the research was conducted in the absence of any commercial or financial relationships that could be construed as a potential conflict of interest.
References
- Rigby, M.; Mühle, J.; Miller, B.R.; Prinn, R.G.; Krummel, P.B.; Steele, L.P.; Fraser, P.J.; Salameh, P.K.; Harth, C.M.; Weiss, R.F.; et al. History of atmospheric SF6 from 1973 to 2008. Atmos. Chem. Phys. 2010, 10, 10305–10320. [Google Scholar] [CrossRef]
- Kieffel, Y.; Irwin, T.; Ponchon, P.; Owens, J. Green gas to replace SF6 in electrical grids. IEEE Power Energy Mag. 2016, 14, 32–39. [Google Scholar] [CrossRef]
- Tefferi, M.; Pyle, F.; Laso, A.; Dauksas, A.; Darko, K.; Uzelac, N.; Scott, A.; Xu, W. Streamer Criterion for Designing Gas-Insulated Medium Voltage Switchgear. In Proceedings of the 2022 IEEE Conference on Electrical Insulation and Dielectric Phenomena (CEIDP), Denver, CO, USA, 30 October–2 November 2022; pp. 451–454. [Google Scholar]
- Bujotzek, M.; Seeger, M. Parameter dependence of gaseous insulation in SF6. IEEE Trans. Dielectr. Electr. Insul. 2013, 20, 845–855. [Google Scholar] [CrossRef]
- Kieffel, Y. Characteristics of g3-an alternative to SF6. In Proceedings of the 2016 IEEE International Conference on Dielectrics, Montpellier, France, 3–7 July 2016; IEEE: Piscataway, NJ, USA, 2016; pp. 880–884. [Google Scholar]
- Zheng, X.; Shen, Y.; Wang, S.; Huang, K.; Cao, D. Selective adsorption of SF6 in covalent and metal–organic frameworks. Chin. J. Chem. Eng. 2021, 39, 88–95. [Google Scholar] [CrossRef]
- Mahdi, A.S.; Abdul-Malek, Z.; Arshad, R.N. SF6 Decomposed Component Analysis for Partial Discharge Diagnosis in GIS: A Review. IEEE Access 2022, 10, 27270–27288. [Google Scholar] [CrossRef]
- Rabie, M.; Christian, M.F. Assessment of eco-friendly gases for electrical insulation to replace the most potent industrial greenhouse gas SF6. Environ. Sci. Technol. 2018, 52, 369–380. [Google Scholar] [CrossRef]
- Ahmed, R.; Abd-Rahman, R.; Ullah, Z.; Ullah, R.; Sami, I.; Yousof, M.F.M. The Insulation Performance of Novel Refrigerant Gas as an Alternative to SF6 for Medium Voltage Switchgear. IEEE Access 2024, 12, 47068–47079. [Google Scholar] [CrossRef]
- Span, R.; Lemmon, E.W.; Jacobsen, R.T.; Wagner, W.; Yokozeki, A. A reference equation of state for the thermodynamic properties of nitrogen for temperatures from 63.151 to 1000 K and pressures to 2200 MPa. J. Phys. Chem. Ref. Data 2000, 29, 1361–1433. [Google Scholar] [CrossRef]
- Shao, T.; Tarasenko, V.F.; Zhang, C.; Beloplotov, D.S.; Yang, W.; Lomaev, M.I.; Zhou, Z.; Sorokin, D.A.; Yan, P. Abnormal polarity effect in nanosecond-pulse breakdown of SF6 and nitrogen. Phys. Lett. A 2014, 378, 1828–1833. [Google Scholar] [CrossRef]
- Tang, J.; Rao, X.; Tang, B.; Liu, X.; Gong, X.; Zeng, F.; Yao, Q. Investigation on SF6 spark decomposition characteristics under different pressures. IEEE Trans. Dielectr. Electr. Insul. 2017, 24, 2066–2076. [Google Scholar] [CrossRef]
- Niemeyer, L. SF6 recycling in electric power equipment. In Gaseous Dielectrics VIII; Springer: Boston, MA, USA, 1998; pp. 431–442. [Google Scholar]
- Li, W. Analysis report on development trend of power transmission and distribution industry. Business Year book of Power Transmission and Distribution Industry 2019–2020. pp. 110–120.
- Hyrenbach, M.; Zache, S. Alternative insulation gas for medium-voltage switchgear. In Proceedings of the 2016 Petroleum and Chemical Industry Conference Europe (PCIC Europe), Berlin, Germany, 14–16 June 2016; IEEE: Piscataway, NJ, USA, 2016; pp. 1–9. [Google Scholar]
- Lenssen, N.J.L.; Schmidt, G.A.; Hansen, J.E.; Menne, M.J.; Persin, A.; Ruedy, R.; Zyss, D. Improvements in the GISTEMP uncertainty model. J. Geophys. Res. Atmos. 2019, 124, 6307–6326. [Google Scholar] [CrossRef]
- Xiao, S.; Shi, S.; Li, Y.; Ye, F.; Li, Y.; Tian, S.; Tang, J.; Zhang, X. Review of decomposition characteristics of eco-friendly gas insulating medium for high-voltage gas-insulated equipment. J. Phys. D Appl. Phys. 2021, 54, 373002. [Google Scholar] [CrossRef]
- Hyrenbach, M.; Hintzen, T.; Müller, P.; Owens, J. Alternative gas insulation in medium-voltage switchgear. In Proceedings of the 23rd International Conference on Electricity Distribution, Lyon, France, 15–18 June 2015; IEEE: Piscataway, NJ, USA, 2015; pp. 1–10. [Google Scholar]
- Xiao, A.; Zhang, A.; Bonk, J.; Owens, J.; DeLorme, M. Recent development of alternative gases to SF6 for high voltage electrical power applications. In Proceedings of the 2020 IEEE International Conference on High Voltage Engineering and Application (ICHVE), Beijing, China, 6–10 September 2020; pp. 1–4. [Google Scholar]
- Qin, Z.Y.; Zheng, Y.; Wei, L.J.; Yang, S.; Zhang, C.; Zhou, W.J. Lightning impulse insulation characteristics of SF6/N2 gas mixture at low temperature. High Volt. Technol. 2017, 43, 3907–3913. [Google Scholar]
- Lin, X.; Li, L.W.; Li, X.T.; Su, A.; Chen, H. Calculation and analysis of cold dielectric recovery characteristics of high voltage SF6/N2 mixed gas circuit breaker. Proc. CSEE 2018, 38, 4620–4630. [Google Scholar]
- Sun, P.C.; Wang, B.T.; Hong, W.F.; Wang, Q.Z. Experimental study on insulation characteristics of SF6/N2 gas mixtures. China Power 2012, 45, 71–75. [Google Scholar]
- Li, X.T. Research on SF6/N2 and SF6/CF4 Discharge Mechanism and Circuit Breaker Dielectric Recovery Characteristics. Ph.D. Thesis, Shenyang University of Technology, Shenyang, China, 2017. [Google Scholar]
- Mahdy, A.M. Assessment of breakdown voltage of SF6/N2 gas mixtures under non-uniform field. IEEE Trans. Dielectr. Electr. Insul. 2011, 18, 607–612. [Google Scholar] [CrossRef]
- Sun, Y.; Li, Z.; Liu, J.; Gao, H.; Zhang, L.; Wang, S.; Sun, L.; Liu, M.; Li, S. Effects of Electric Field Nonuniformity on DC Positive Streamer Discharge of SF6/N2 Mixed Gas. IEEE Trans. Dielectr. Electr. Insul. 2024, 31, 2019–2028. [Google Scholar] [CrossRef]
- Gao, S.; Xiao, H.; Ding, R.; Yin, Z.; Zhuang, T.; Li, H.; Zhan, A.; Ye, F. Characterization of partial discharge decomposition of SF6/N2 gas mixture with different microwater contents. AIP Adv. 2024, 14, 055027. [Google Scholar] [CrossRef]
- Chen, H.; Zeng, X.; Xiao, Y.; Li, H.; Yao, Q.; Zeng, F. Influence of microwater on the decomposition of SF6/N2 gas mixture insulating media in overheating faults. AIP Adv. 2024, 14, 015154. [Google Scholar] [CrossRef]
- Zeng, F.; Wu, S.; Lei, Z.; Li, C.; Tang, J.; Yao, Q.; Miao, Y. SF6 fault decomposition feature component extraction and triangle fault diagnosis method. IEEE Trans. Dielectr. Electr. Insul. 2020, 27, 581–589. [Google Scholar] [CrossRef]
- Tang, J.; Pan, J.Y.; Yao, Q.; Miao, Y.; Zeng, F. Study on decomposition characteristics of SF6 at fault temperature of 300–400 °C. Proc. CSEE 2013, 33, 202–210+25. [Google Scholar]
- Q/GDW 11060-2019; State Grid Corporation of China Technical Specification for SF6/N2 Mixed GAS Insulated Electrical Equipment. China Electric Power Press: Beijing, China, 2019.
- Zeng, F.; Tang, J.; Fan, Q.; Pan, J.; Zhang, X.; Yao, Q.; He, J. Decomposition characteristics of SF6 under thermal fault for temperatures below 400 °C. IEEE Trans. Dielectr. Electr. Insul. 2014, 21, 995–1004. [Google Scholar] [CrossRef]
- Chen, X.; Chen, J. Power frequency breakdown and decomposition characteristics of C4F7N/CO2 mixed gas. J. Shanghai Univ. Electr. Power 2025, 41, 182–189. [Google Scholar]
- Shao, X.J.; Yuan, X.C.; Chen, X.X.; Qian, P.; He, Y.L.; He, Y.F.; Sun, A.B.; Zhang, G.J. Calculation of the reaction rate constant for the generation path of the main decomposition products of SF6 based on transition state theory and density functional theory. Sci. Technol. Eng. 2020, 20, 9415–9420. [Google Scholar]
- Chen, H.L.; Xu, J.Y.; Li, L.W.; Shan, C.W.; Lin, S. Experimental Study on the Breakdown Characteristics of SF6/N2 Mixed Gas with Non-uniform Electric Field. High-Volt. Electr. Appl. 2016, 52, 110–115. [Google Scholar]
- Wang, P.; Lu, Y.; Geng, J.H.; Liu, Y.; Ding, Y.; Wang, Y.; Zhou, S. Research and Verification of Numerical Models for spheroid-plate Gap flow-stable leading Transition in Areas at altitudes of 50 and 2200 m. Proc. CSEE. pp. 1–12. Available online: https://link.cnki.net/urlid/11.2107.TM.20250422.1316.004 (accessed on 1 September 2025).
- Pancheshnyi, S.; Biagi, S.; Bordage, M.; Hagelaar, G.; Morgan, W.; Phelps, A.; Pitchford, L. The LXCat project: Electron scattering cross sections and swarm parameters for low temperature plasma modeling. Chem. Phys. 2012, 398, 148–153. [Google Scholar] [CrossRef]
- Chen, S.; Lin, X.; Gao, K.L.; Geng, Z.X.; Li, X.L. Insulation characteristics of C4F7N/CO2 gas mixture under DC and power frequency voltage. High Volt. Technol. 2025, 1–9. [Google Scholar] [CrossRef]
- Hagelaar, G.J.M.; Pitchford, L.C. Solving the boltzmann equation to obtain electron transport coefficients and rate coefficients for fluid models. Plasma Sources Sci. Technol. 2005, 14, 722–733. [Google Scholar] [CrossRef]
- Cekmen, Z.C.; Dincer, M.S. Effective ionization coefficients and transport parameters in binary and ultradilute SF6-Ar mixtures using Boltzmann equation analysis. J. Phys. D Appl. Phys. 2009, 42, 145208. [Google Scholar] [CrossRef]
- Yan, Z.; Zhu, D.H. High Voltage Insulation Technology, 3rd ed.; Electric Power Press: Beijing, China, 2015; pp. 197–201. [Google Scholar]


Disclaimer/Publisher’s Note: The statements, opinions and data contained in all publications are solely those of the individual author(s) and contributor(s) and not of MDPI and/or the editor(s). MDPI and/or the editor(s) disclaim responsibility for any injury to people or property resulting from any ideas, methods, instructions or products referred to in the content. |
© 2025 by the authors. Licensee MDPI, Basel, Switzerland. This article is an open access article distributed under the terms and conditions of the Creative Commons Attribution (CC BY) license (https://creativecommons.org/licenses/by/4.0/).