Abstract
The rapid adoption of hydrogen fuel cell vehicles (HFCVs) in the Beijing–Tianjin–Hebei (BTH) hub accentuates the mismatch between renewable-based hydrogen supply in Hebei and concentrated demand in Beijing and Tianjin. We develop a mixed-integer linear model that co-configures a hydrogen pipeline network and optimizes hourly flow schedules to minimize annualized cost and CO2 emissions simultaneously. For 15,000 HFCVs expected in 2025 (137 t d−1 demand), the Pareto-optimal design consists of 13 production plants, 43 pipelines and 38 refueling stations, delivering 50 767 t yr−1 at 68% pipeline utilization. Hebei provides 88% of the hydrogen, 70% of which is consumed in the two megacities. Hourly profiles reveal that 65% of electrolytic output coincides with local wind–solar peaks, whereas refueling surges arise during morning and evening rush hours; the proposed schedule offsets the 4–6 h mismatch without additional storage. Transport distances are 40% < 50 km, 35% 50–200 km, and 25% > 200 km. Raising the green hydrogen share from 10% to 70% increases total system cost from USD 1.56 bn to USD 2.73 bn but cuts annual CO2 emissions from 142 kt to 51 kt, demonstrating the trade-off between cost and decarbonization. The model quantifies the value of sub-day pipeline scheduling in resolving spatial–temporal imbalances for large-scale low-carbon hydrogen supply.
1. Introduction
With the continual growth in global demand for clean energy and escalating concerns over climate change, hydrogen energy—characterized by its cleanliness and renewability—offers a pathway to mitigate oil and gas depletion and to propel the energy transition [1]. Possessing both high gravimetric energy density and zero direct emissions, hydrogen finds broad application across critical sectors such as transportation, industry, and energy storage. Endowed with abundant hydrogen resources and substantial market potential, China’s National Development and Reform Commission issued in March 2022 the Mid-to-Long Term Plan for Hydrogen Industry Development (2021–2035), formally positioning hydrogen as a cornerstone of the future energy system [2].
Hydrogen production, storage and transportation, and end use applications constitute the core segments of the hydrogen value chain. At present, hydrogen production remains dominated by fossil fuel pathways, with industrial by-product hydrogen serving as a vital stopgap to satisfy end use demand until renewable-based supply achieves scale. It is projected that around 2035, the supply share of industrial by-product hydrogen and water electrolysis will reach a pivotal inflection point [3]. In the transportation sector, hydrogen fuel cell vehicles—offering zero tailpipe emissions—present an effective alternative to battery electric vehicles [4]. By 2025, total hydrogen-powered vehicles in China are expected to surpass 50,000 units [2]. Supporting this growth, hydrogen refueling stations reached 245 in operation by the end of 2022 [5].
Despite rapid deployment, hydrogen transport continues to face pronounced regional imbalance challenges. Pipeline transport, owing to its high efficiency, operational safety, and competitive cost profile, is increasingly viewed as the optimal solution [6]. The Inner Mongolia–Beijing “West-to-East Hydrogen Transmission” pipeline demonstration project marks a significant milestone, ushering China into a new era of long-distance hydrogen pipeline transport.
References [7,8,9] developed water electrolysis hydrogen production models that emphasized cost reduction and performed techno-economic analyses across alkaline (AWE), proton exchange membrane (PEM), and anion exchange membrane (AEM) electrolyzer technologies, noting that PEM and AEM are expected to become competitive options in the medium to long term. References [10,11,12] conducted comprehensive technical assessments of these renewable hydrogen production pathways, evaluating hydrogen yield, energy efficiency, and dynamic operating characteristics, where PEM is preferred for high-purity and dynamic applications, while AEM remains in an early developmental stage. Fossil-fuel-based hydrogen production reduced CO2 emissions through process optimization [13,14,15,16,17], yet its broader decarbonization potential hinged on breakthroughs in carbon capture and storage (CCS). Industrial by-product hydrogen production exploited mature purification techniques for high-efficiency resource utilization but required further development to accommodate complex feedstock streams [17].
Hydrogen demand forecasting research primarily focused on refueling station requirements and fuel cell vehicle diffusion models [18,19]. Reference [20] applied logistic curves, and [21] utilized regression models to correlate vehicle penetration rates with market demand. Reference [22] employed a generalized Bass diffusion model to project China’s fuel cell vehicle market. References [23,24,25,26] investigated hydrogen consumption and transportation sector demand, introducing enhanced grey models and system dynamics forecasting frameworks. Studies [27,28,29] modeled hydrogen infrastructure demand and market scale, while recent European analyses [30] project 0.3–1.5 million HFCVs by 2050 and 3500–6500 hydrogen refueling stations by 2030 (rising to 4600–13,700 by 2050).
In the field of hydrogen pipeline technology and safety, materials resistant to hydrogen embrittlement and leakage detection methods were key research priorities [31,32,33,34,35]. However, the mechanisms of hydrogen–material interactions and the corresponding standards framework remained underexplored [36,37]. Economic analyses of pipeline networks indicated that, as hydrogen demand and transport scale increased, pipelines achieved cost advantages for long-distance transmission [38,39,40], though factors such as transport distance [41], operating pressure [42], and storage modalities [43] had to be jointly considered. References [44,45,46,47,48] integrated supply–demand matching with pipeline transport characteristics to advance studies on hydrogen network logistics.
Despite recent advances, the literature remains fragmented: most contributions offered single-dimensional (temporal-only or spatial-only) forecasts and failed to holistically integrate the multiple drivers that simultaneously shape hydrogen supply and demand. Logistics-oriented investigations of pipeline-based hydrogen transport are particularly scarce. To close these gaps, we adopted a logistics perspective and developed a bi-objective optimization model that jointly configures the pipeline network and determines hourly transport dispatch. The model minimizes total cost while maximizing pipeline utilization and explicitly constrains the green hydrogen supply ratio. In a single run it yields (i) the optimal pipeline layout linking production plants to refueling stations and (ii) an hourly delivery schedule, thereby harmonizing economic, operational, and environmental objectives.
This paper simultaneously configures the hydrogen pipeline network and optimizes hourly transport between production plants and refueling stations. Taking the BTH region as a testbed, we integrate plant-level supply dynamics with station-level demand uncertainty and solve a bi-objective mixed-integer model that minimizes total cost while maximizing pipeline utilization. The four research modules are summarized below.
- (1)
- Hour-by-hour hydrogen production curves are simulated for four technologically distinct pathways—off-grid electrolysis, grid-connected electrolysis, industrial by-product purification and fossil-fuel-based production with CCS—capturing their divergent part-load efficiencies and renewable energy correlations.
- (2)
- Regional ownership of HFCVs is forecast with a grey prediction model and converted into annual hydrogen demand. Voronoi diagrams delimit preliminary service areas for candidate refueling stations, after which entropy-weighted corrections adjust site weights and the regional demand is disaggregated into hourly station-level profiles that reflect traffic peaking and commuter patterns.
- (3)
- A bi-objective optimization model determines the Pareto frontier between total system cost and pipeline utilization. The model selects pipe diameters, routes, compression power and hourly mass flows, while enforcing pressure constraints, green hydrogen supply quotas, and minimum/maximum flow rates for every segment.
- (4)
- The methodology is applied to BTH. Plant-specific production simulations feed 8 760 h supply curves; station-specific demand curves are generated via the spatiotemporal downscaling procedure. The optimization returns a concrete network topology (number, length and diameter of pipelines) and an hourly transport schedule for a target year (2025). Sensitivity analyses quantify how changes in unit pipe investment cost and mandatory green hydrogen share shift the network design, throughput and cost–emission trade-off.
2. Hydrogen Production Simulation Under Different Production Pathways
2.1. Water Electrolysis Hydrogen Production Simulation
2.1.1. Scenario Building
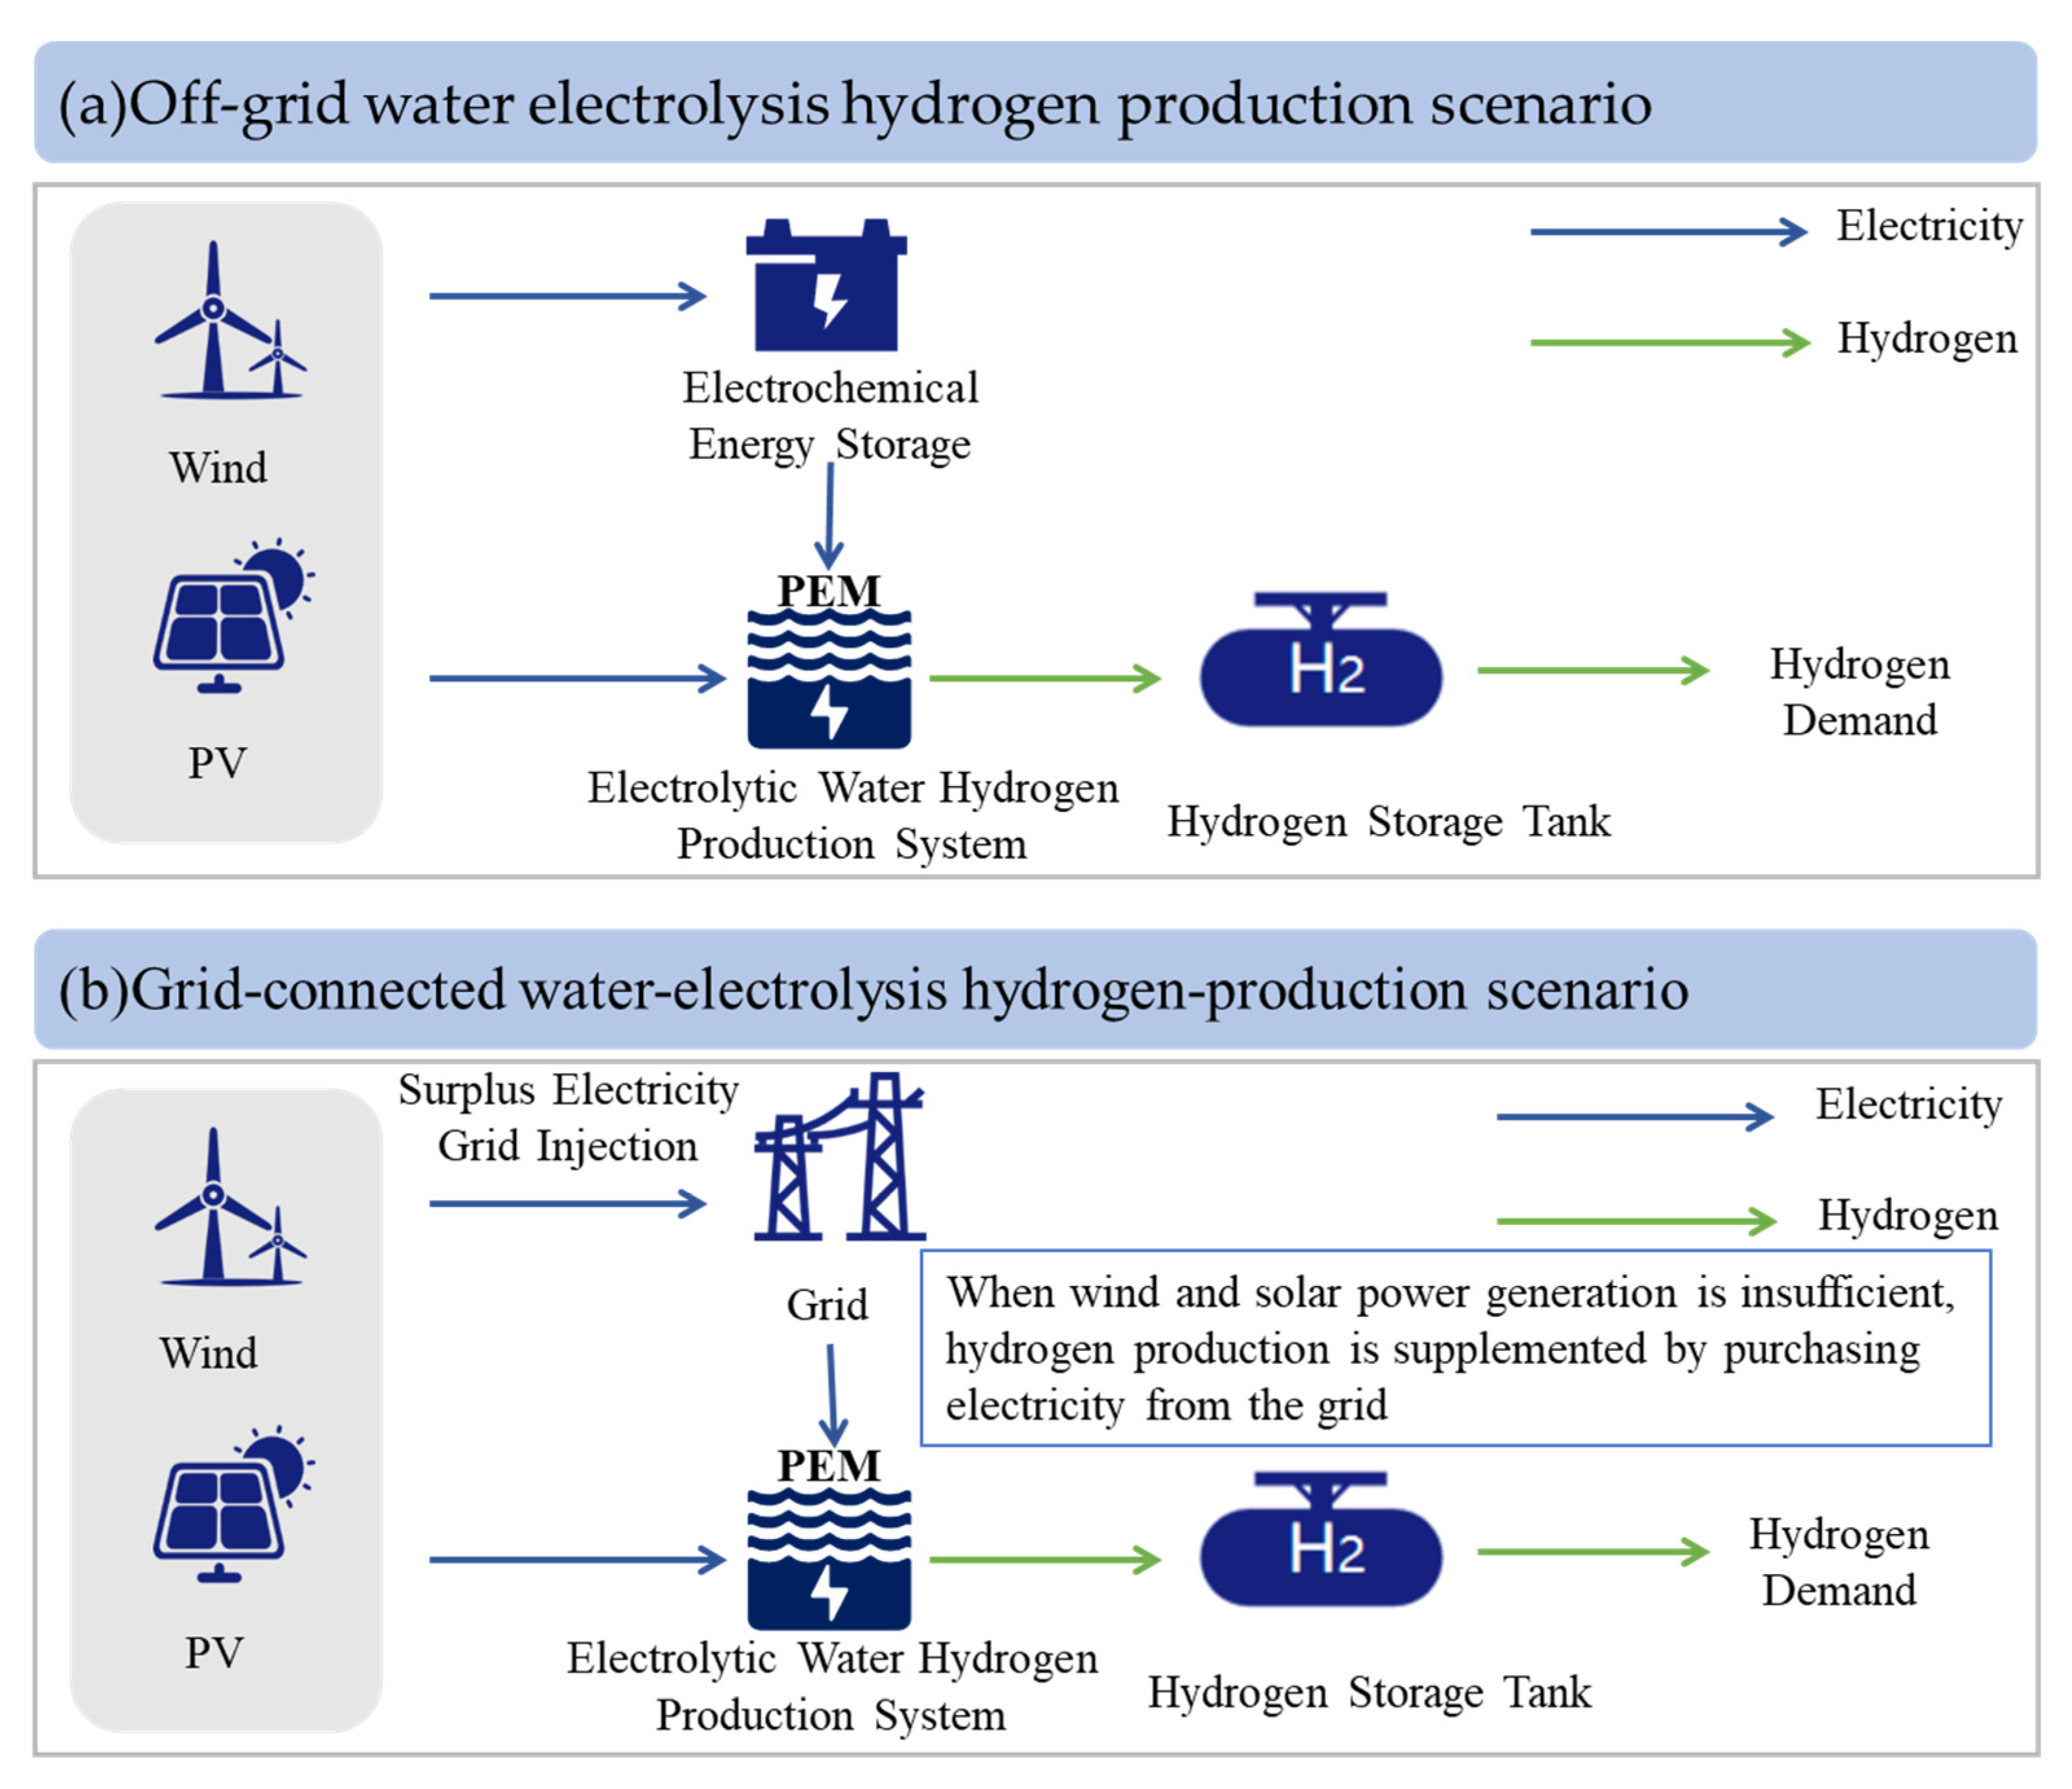
Based on different power supply methods in the water electrolysis hydrogen production process, discuss the two scenarios of off-grid and grid-connected water electrolysis hydrogen production.
- (1)
- Off-grid water electrolysis hydrogen production scenario
The water electrolysis hydrogen production system is directly coupled with renewable energy sources (e.g., wind power, photovoltaics), without connection to the public grid, and is equipped with energy storage devices to balance power supply and demand and ensure continuous hydrogen production, as shown in Figure 1a.
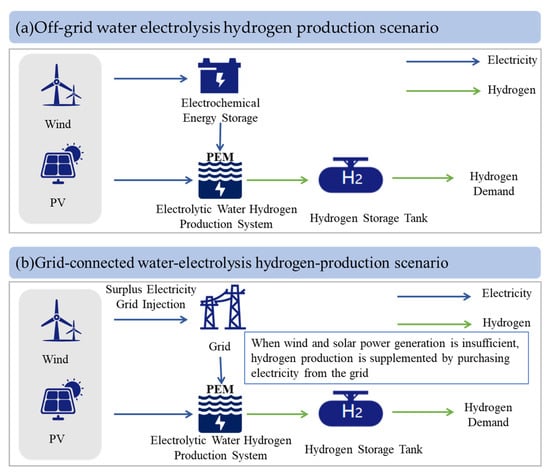
Figure 1.
(a) Off-grid water electrolysis hydrogen production scenario. (b) Grid-connected water electrolysis hydrogen production scenario.
Off-grid water electrolysis hydrogen production can be flexibly deployed in remote or renewable-energy-rich areas. An off-grid electrolysis system must be equipped with energy storage devices to balance generation fluctuations with electrolyzer operating requirements, ensuring a stable power supply and improving resource utilization efficiency.
- (2)
- Grid-connected water electrolysis hydrogen production scenario
The grid-connected water electrolysis hydrogen production scenario refers to a system where, in addition to renewable energy sources such as wind and solar power, the water electrolysis hydrogen production system is integrated into the public electricity grid, as shown in Figure 1b.
Grid-connected water electrolysis hydrogen production supplements power from the grid, utilizing low-cost electricity during off-peak hours to reduce costs and enhance hydrogen production efficiency and economic feasibility.
2.1.2. Off-Grid Water Electrolysis Hydrogen Production Simulation
The model constructed in this section uses wind and photovoltaic power generation as the electricity supply, with a proton exchange membrane (PEM) electrolyzer selected for hydrogen production. The PEM electrolyzer was chosen because of its high hydrogen purity, fast response to fluctuating renewable output, and relatively high commercial maturity [7]. Although the anion exchange membrane (AEM) technology shows promising potential for cost reduction in the long term, it is still at an early stage of industrial application, with ongoing improvements required in durability and material stability. An electrochemical energy storage system and a hydrogen storage tank are also integrated to ensure the stable operation of the electrolyzer.
- (1)
- Wind and Photovoltaic Output Model
The actual power output of the wind turbine is primarily determined by the cut-in wind speed and the cut-out wind speed. The calculation model for the power generation per unit capacity of the wind turbine is as follows:
In the formula, represents the hourly power generation per unit capacity of the wind turbine, denotes the rated power of a single wind turbine (in kW), and , , , correspond to the actual wind speed, cut-in wind speed, cut-out wind speed, and rated wind speed, respectively (in m/s).
The actual power output of the photovoltaic panel is primarily influenced by solar radiation intensity and ambient temperature. The calculation model for the hourly power generation per unit capacity of the photovoltaic panel is as follows:
In the formula, represents the hourly power generation per unit capacity of the photovoltaic panel, denotes the number of panels, , , are the real-time, short-circuit, and peak current values (in A), represent the real-time and peak voltage (in V), is the temperature and dust correction factor, denote the real-time and rated light intensity (in lx), and correspond to the ambient temperature, actual temperature of the photovoltaic panel, and the rated temperature (in °C).
- (2)
- Objective Function
The off-grid water electrolysis hydrogen production simulation model aims to minimize the total operating cost of the off-grid water electrolysis hydrogen production system. The total operating cost includes the operating costs of the electrolyzer and the electrochemical energy storage system, as shown in Equation (7):
In the equation, represents the total operating cost of the off-grid water electrolysis hydrogen production system, denotes the operating cost of the electrolyzer, and represents the operating cost of the electrochemical energy storage system.
- (3)
- Constraints
(1) Power Balance Constraint
The electric power supply relies entirely on renewable energy generation and the energy storage system. The power balance constraint is given by:
In the equation, and denote the photovoltaic and wind power outputs at time (kW), and represent the charging and discharging power of the electrochemical storage system at time (kW), and is the electrolyzer’s power consumption at time (kW).
(2) Electrolyzer Hydrogen Production Capacity Constraint
In the equation, denotes the amount of hydrogen produced by the water electrolysis system at time t, and represent the plant’s minimum and maximum hydrogen production capacities, respectively.
(3) Electrolyzer Power Constraint
The electrolyzer’s power consumption and hydrogen output must satisfy the following relationship:
In the equation, and denote the minimum and maximum power consumption of the electrolyzer, is a sufficiently large constant, represents the electrolyzer’s hydrogen production efficiency, and is the on/off status of the electrolyzer at time t.
(4) Electrolyzer Start-up and Shutdown Constraints
To avoid frequent cycling of the electrolyzer and thus reduce start-up/shutdown costs, we impose limits on the number of start/stop actions, as well as minimum up-time and down-time. We introduce a start/stop action variable , enforce that the electrolyzer cannot start up and shut down simultaneously in the same period, and cap the total number of start/stop actions by the equipment’s allowable lifetime. These constraints are formulated as follows:
Once the electrolyzer is started, it must run continuously for at least hours; once it is shut down, it must remain off for at least hours, as expressed by the following equations:
(5) Electrochemical Energy Storage Operation Constraints
The electrochemical energy storage operation constraints mainly regulate the charging and discharging power of the energy storage system as well as the state of charge. In the equation, denotes the state of charge of the electrochemical energy storage system at time t, represents the self-discharge rate of the energy storage system, refers to the charging/discharging efficiency of the system, represent the minimum and maximum state of charge, and denote the maximum charging and discharging power of the electrochemical storage system.
2.1.3. Grid-Connected Water Electrolysis Hydrogen Production Simulation
In the grid-connected water electrolysis hydrogen production scenario, the system can either obtain electricity from the grid to perform electrolysis or feed excess electricity back to the grid. The wind and solar power generation model is the same as in Section 2.1.2 Equation (6).
- (1)
- Objective Function
The goal of the grid-connected water electrolysis hydrogen production model is to minimize the total operating cost of the system, which includes the electricity purchase cost, electrolyzer operating cost, and potential electricity sales revenue.
In the equation, represents the total operating cost of the grid-connected water electrolysis hydrogen production system, denotes the electricity purchase cost, is the operating cost of the electrolyzer, and represents the revenue from selling electricity to the grid.
- (2)
- Constraints
(1) Power Balance Constraint
The power supply for the grid-connected water electrolysis hydrogen production system comes from both wind and solar generation. When wind and solar output are insufficient, electricity is purchased from the grid to ensure continuous and stable hydrogen production. During periods of excess wind and solar generation, the system can sell electricity to the grid. The power balance constraint is as follows:
In the equation, is the electrolyzer’s power consumption at time t (kW), denotes the system’s grid purchase power at time t (kW), and denotes the system’s grid sale power at time t (kW).
(2) Grid Interaction Constraints
The grid purchase and grid sale powers must satisfy the following constraints:
In the equation, represent the maximum grid purchase power and maximum grid sale power of the system, respectively.
Additionally, the electrolyzer’s hydrogen production capacity constraints, power constraints, and start/stop constraints are the same as those in Section 2.1.2.
2.2. Industrial By-Product Hydrogen Production Simulation
2.2.1. Technical Approach
The main sources of industrial by-product hydrogen include coke-oven gas, chlor-alkali process off-gas, and propane dehydrogenation tail gas, among others. This section focuses on by-product hydrogen production using coke-oven gas as the feedstock.
Gas collection is the first step in hydrogen production from coke-oven gas. The gas is collected through a negative pressure adsorption system and undergoes pre-treatment, including dust removal, coke removal, and naphthalene removal. Desulfurization is carried out using chemical absorption or physical adsorption technologies to remove hydrogen sulfide, preventing corrosion and poisoning of subsequent equipment. Hydrogen separation is achieved through pressure swing adsorption (PSA), membrane separation, and cryogenic separation techniques, utilizing selective adsorption, permeability, or differences in boiling points to separate and purify hydrogen.
2.2.2. Model Construction
- (1)
- Objective Function
The construction of the industrial by-product hydrogen production simulation model needs to take into account the characteristics of the industrial by-product gases, the hydrogen extraction process, and production scheduling optimization, with the goal of minimizing hydrogen production costs and carbon emission costs. The objective function is expressed as follows.
- (2)
- Constraints
(1) Hydrogen Production Capacity Constraint
The total hydrogen output must not exceed the plant’s maximum hydrogen production capacity. In the expression below, denotes this maximum capacity.
(2) Dynamic Supply Constraint
The supply of coke-oven gas fluctuates with the coke production cycle. The maximum available feed gas in hour t is given by:
where is the baseline supply rate, is the fluctuation coefficient, and is the coke-oven discharge period.
(3) Feed Gas Supply Constraint
Hydrogen output depends on how much coke-oven gas is fed to the plant. Denoting the actual gas feed in hour t by , it must satisfy:
(4) Energy Consumption Limit Constraint
The hydrogen production process consumes multiple forms of energy (e.g., electricity, heat). Let the maximum hourly consumption of each energy type be , it must satisfy:
2.3. Fossil Fuel Hydrogen Production Simulation
2.3.1. Technical Approach
The fossil fuel hydrogen production method considered in this section is primarily natural gas steam–methane reforming (SMR), which is the most common fossil-fuel-based hydrogen production process.
The production process includes the following steps:
(1) Raw material pretreatment: the desulfurization reactor removes sulfides; (2) Reforming reaction: the pretreated natural gas is mixed with steam and, under the action of a catalyst, produces synthesis gas; (3) Heat recovery and shift reaction: heat is recovered via a steam generator, further increasing hydrogen yield; (4) Gas cooling and separation: the gas is cooled and condensate is separated; (5) Hydrogen purification: a pressure-swing adsorption unit purifies the hydrogen to obtain high-purity product.
2.3.2. Model Construction
- (1)
- Objective Function
- (2)
- Constraints
(1) Raw material consumption constraint
Fossil fuel consumption is proportional to hydrogen production. In the equation, denotes the hydrogen production at time t, and represents the efficiency of converting natural gas into hydrogen.
3. Spatiotemporal Distribution-Based Hydrogen Demand Simulation
With the promotion of hydrogen fuel cell vehicles, hydrogen refueling stations—key demand nodes in hydrogen pipeline transportation—require accurate prediction and spatiotemporal distribution modeling of hydrogen demand, which is crucial for optimizing the hydrogen network. By comprehensively considering the growth in the number of hydrogen fuel cell vehicles, per-vehicle hydrogen consumption characteristics, and the dynamic fluctuations of demand over time and space, a hydrogen demand forecasting model for refueling stations is constructed to provide reliable demand inputs for subsequent network configuration and transportation optimization.
3.1. Hydrogen Fuel Cell Vehicle Ownership Forecast
3.1.1. Analysis of Hydrogen Fuel Cell Vehicle Application Types
Hydrogen fuel cell vehicles are widely applied in logistics, public transportation, and specialized operational sectors. In logistics, hydrogen fuel cell heavy-duty trucks and forklifts achieve zero emissions and enhance efficiency; in public transportation, buses and rail transit support vehicles address environmental concerns and range limitations; and in specialized operations, sanitation trucks, fire engines, and rescue vehicles boost efficiency, environmental performance, and reliability. The specific information on applications in various fields is shown in Table 1.

Table 1.
Comparison of Application Scenarios of HFCVs.
3.1.2. Hydrogen Fuel Cell Vehicle Ownership Forecast Based on Grey Prediction
The forecast of hydrogen fuel cell vehicle ownership forms the basis for predicting hydrogen demand at refueling stations. As hydrogen fuel cell vehicles are deployed at scale, the hydrogen demand at refueling stations will correspondingly increase.
Market data for hydrogen fuel cell vehicles are scarce, and traditional models (such as ARIMA or regression analysis) struggle to model effectively; grey prediction can generate forecasts based on limited data. Since hydrogen fuel cell vehicle adoption is influenced by multiple factors—policy subsidies, technological breakthroughs, and refueling station deployment—the grey model can capture growth patterns from data trends. Employing the GM(1,1) model effectively fits the exponential growth characteristics of hydrogen fuel cell vehicle ownership, achieving high model fitness and reliable forecasts. Please refer to Appendix A for the specific calculation process.
3.2. Modeling of Daily Demand Curves for Refueling Stations
3.2.1. Calculation of Regional Total Demand
To compute the daily hydrogen demand profiles for each refueling station within the region, we first use the hydrogen fuel cell vehicle ownership forecast from Section 3.1 to calculate the total regional hydrogen demand. Then, by applying a spatiotemporal distribution function, we allocate the regional demand across individual stations. Based on the refueling needs of different vehicle types, we simulate hourly fluctuations in hydrogen demand, ultimately obtaining the daily demand curve for each station.
- (1)
- Per-vehicle average daily hydrogen demand
For the three vehicle categories—hydrogen fuel cell logistics vehicles, hydrogen fuel cell buses, and hydrogen fuel cell special purpose vehicles—we analyze each type’s hydrogen requirements. The average daily hydrogen demand of a single fuel cell vehicle is determined by its daily mileage, hydrogen consumption per 100 km, and utilization rate, as given in Equation (32).
In the equation, denotes the average daily mileage of vehicles of class i, denotes the hydrogen consumption per 100 km for class i, and is the utilization rate of class i vehicles.
- (2)
- Regional Total Hydrogen Demand
Based on the above per-vehicle average daily hydrogen demand for each vehicle class and the regional ownership data of hydrogen fuel cell vehicles, calculate the total daily hydrogen demand of fuel cell vehicles in the region.
In the equation, denotes the total hydrogen demand of all hydrogen fuel cell vehicles in the region, and denotes the number (fleet size) of class-i hydrogen fuel cell vehicles.
3.2.2. Spatiotemporal Distribution Simulation
- (1)
- Spatial Distribution Simulation
In this section, the service area is first partitioned using a Voronoi diagram, then weight coefficients are adjusted via the entropy weight method, and finally the region’s total hydrogen demand is allocated to each refueling station.
(1) Voronoi-Based Spatial Partitioning
Using a Voronoi diagram, the geographic area is divided into multiple cells based on refueling station locations. Users within each cell are assumed to patronize the nearest station, and the initial demand allocation ratio is determined by the area of each cell, .
denotes the service region of refueling station i, and are the coordinates of station i.
(2) Entropy Weight Method for Weight Correction
To prevent capacity overloads resulting from pure distance-based allocation, the allocation weights are adjusted using the entropy weight method, which takes each station’s service capacity into account. The demand allocation formula for each refueling station after entropy weight correction is given by:
In the equation, denotes the demand allocated to the i hydrogen refueling station, denotes the comprehensive weight of that refueling station, denotes the area (in km2) of its Voronoi region.
- (2)
- Time Distribution Function
(1) Time Distribution of Logistics Vehicle Demand
The hydrogen-refueling demand of logistics vehicles is concentrated between 05:00–07:00 and 21:00–23:00, exhibiting a bimodal pattern. The demand of hydrogen fuel cell logistics vehicles is modeled by a bimodal Gaussian distribution, whose probability density function is given by:
The equation indicates that represents the center time of the morning peak, which corresponds to the concentrated refueling before departure; represents the center time of the evening peak, reflecting the refueling peak period after the return journey; and represents the duration of the morning peak and evening peak, reflecting the degree of dispersion in the arrival times of the logistics vehicles. The settings are = 6, = 22, and = 1.5.
(2) Time Distribution of Bus Demand
For hydrogen fuel cell buses, the demand distribution is modeled as a uniform distribution, with refueling demand assumed to be evenly distributed over the operating period from 06:00 to 23:00.
(3) Time Distribution of Special Purpose Vehicle Demand
Fire trucks typically refuel after completing missions or during routine maintenance. Sanitation vehicles refuel en masse in the early hours of the morning. Rescue vehicles generally refuel in the interval after their morning missions and before their afternoon missions, with afternoon refueling covering potential evening-time needs. The hourly demand of special purpose vehicles is modeled using a single-peak Gaussian distribution. The overall demand profile is obtained by a weighted superposition of the individual Gaussian distributions for sanitation vehicles, fire trucks, and rescue vehicles.
In the equation, are the weighting terms representing the proportions of fire trucks, sanitation vehicles, and rescue vehicles in the total demand.
(4) Temporal synthesis of total demand
By simulating with the above probability distribution functions, the hydrogen demand in each time interval is determined by the region’s total hydrogen demand and the temporal distribution.
- (3)
- Demand for hydrogen refueling stations under spatiotemporal distribution
By applying the spatial distribution function, the region’s total hydrogen demand is allocated to each refueling station based on its geographic location. At the same time, the temporal distribution function determines the total hydrogen demand for each time interval. Combining these into a spatiotemporal distribution function, the time-segmented demand for each station is ultimately determined by the region’s demand in that time segment and the station’s spatial allocation ratio.
4. Hydrogen Pipeline Network Transportation Configuration and Transport Coordination Optimization Modeling
4.1. Problem Description
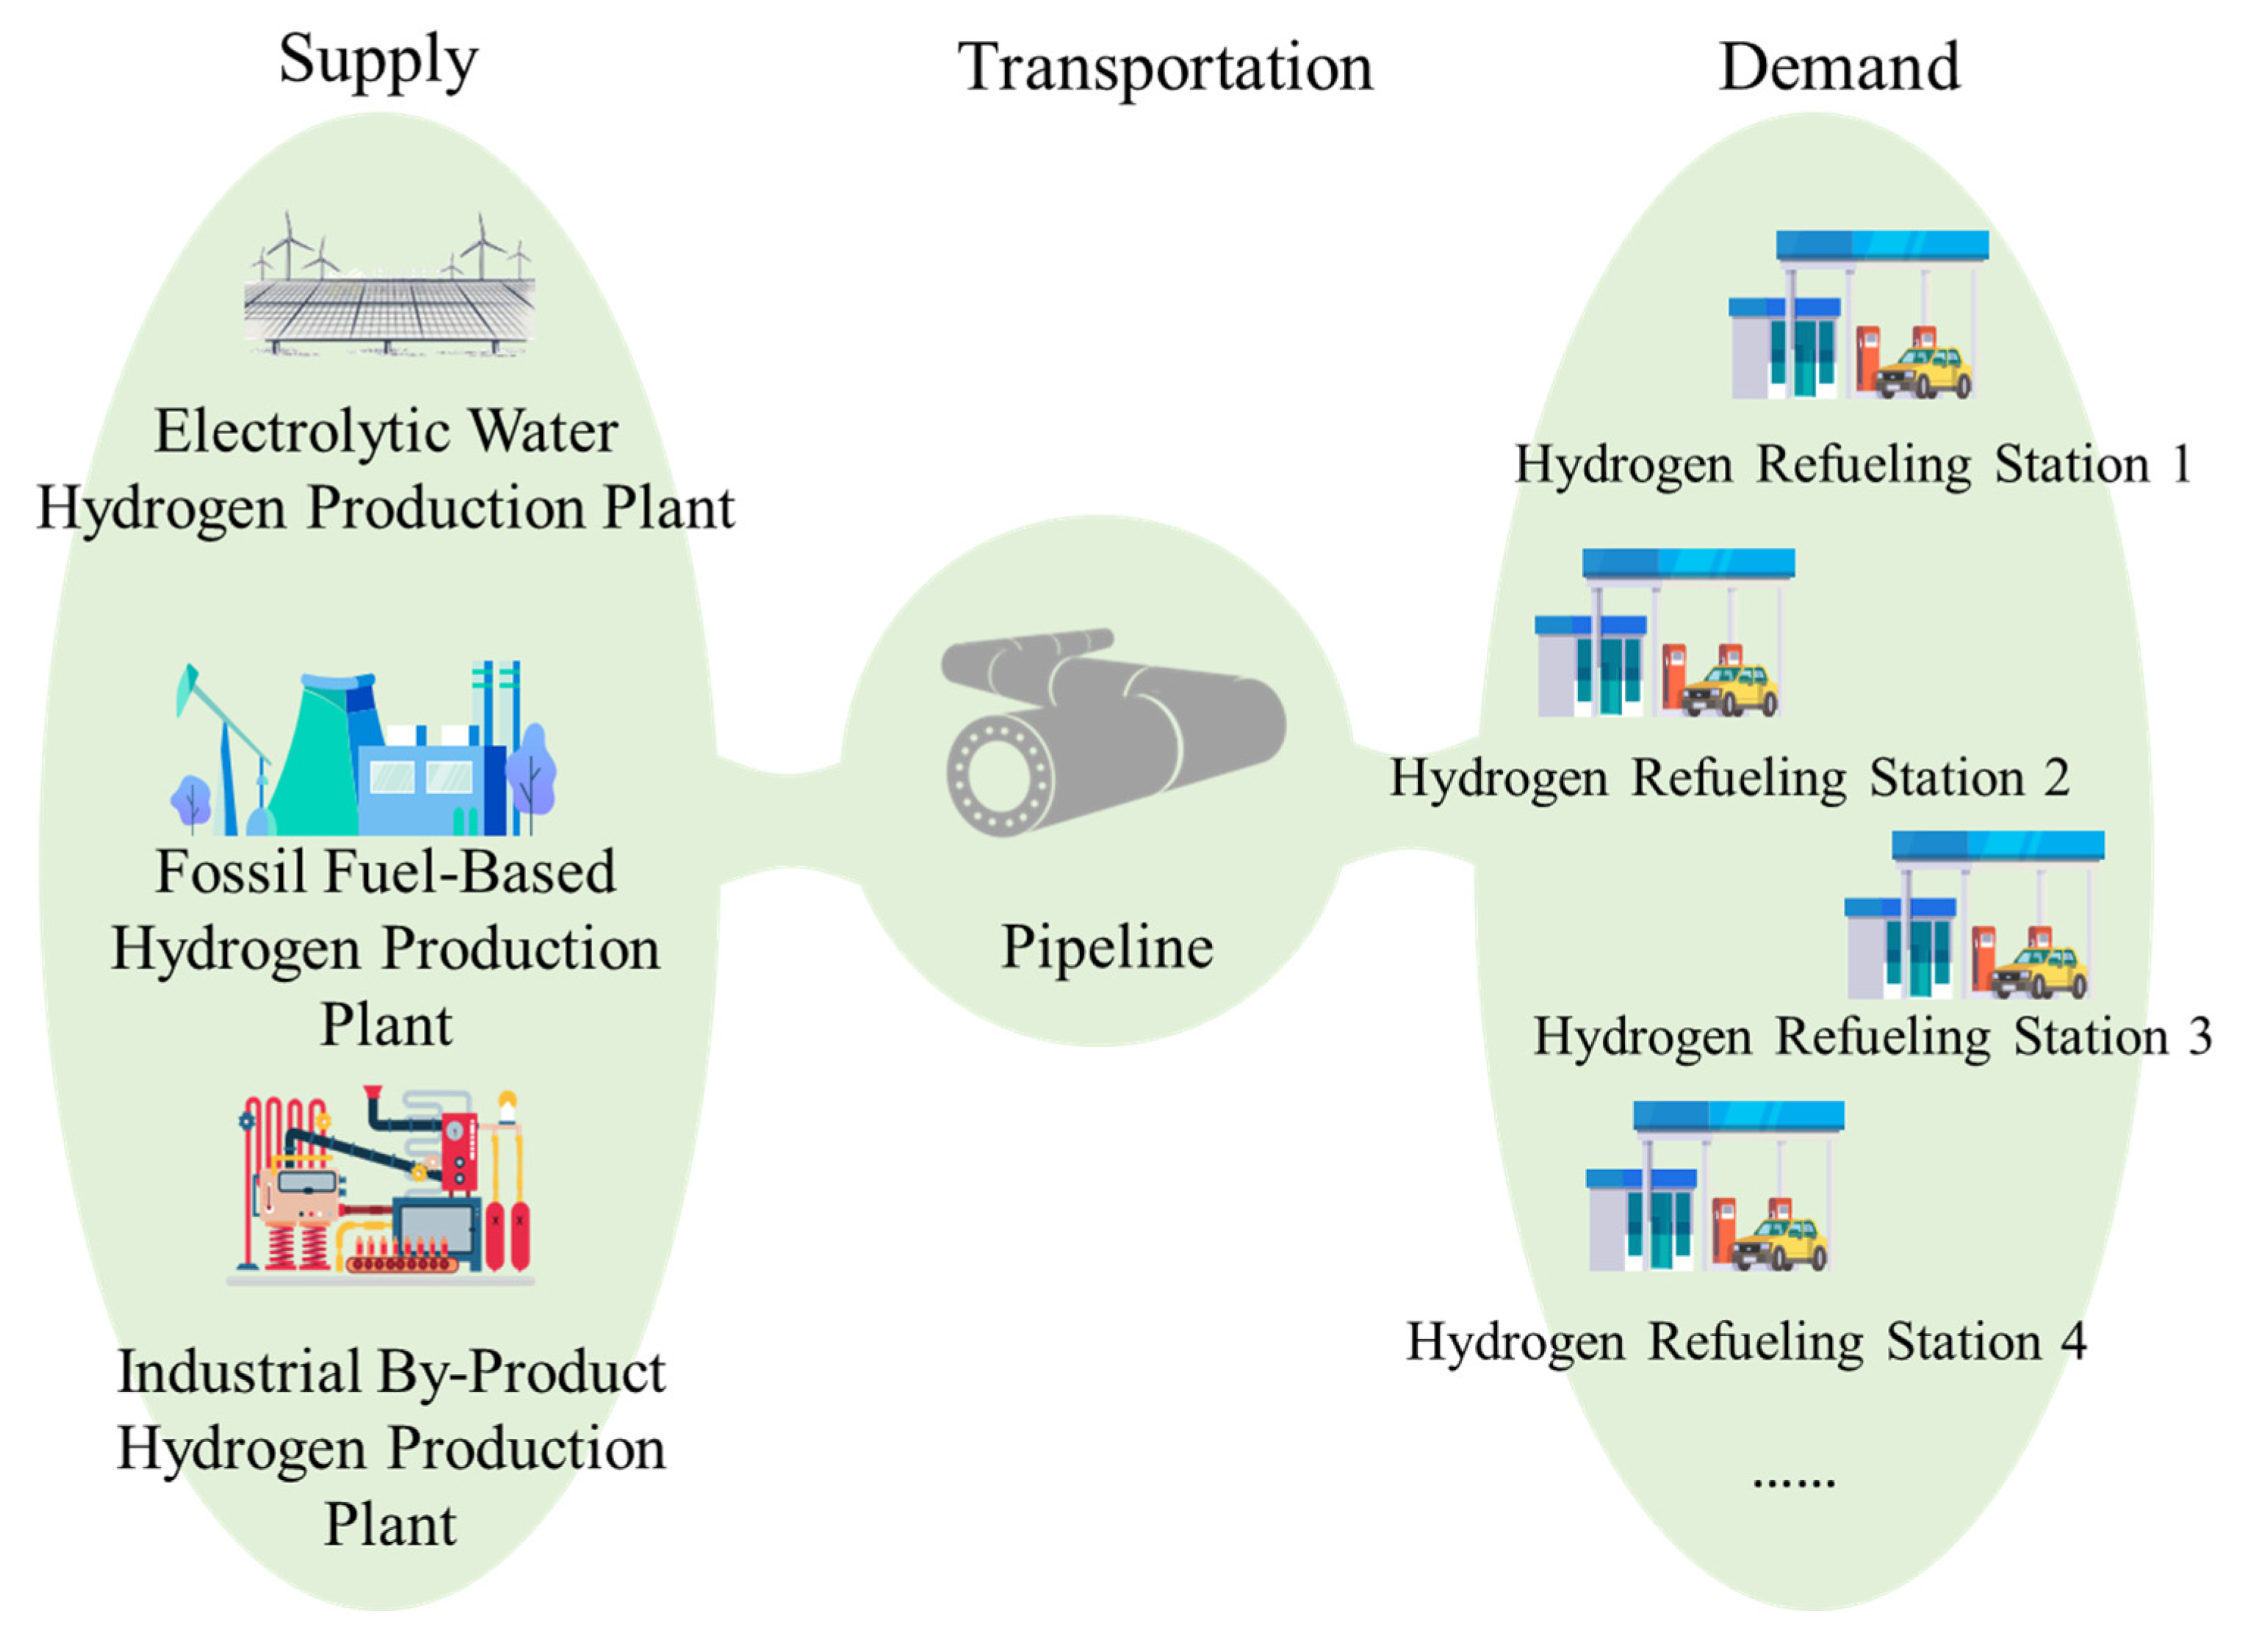
Based on the differing production and demand profiles of each hydrogen production plant and refueling station, and while ensuring that regional refueling stations’ hydrogen demands are met, this study examines the optimal configuration of the hydrogen pipeline network and hour-level hydrogen transport schemes to achieve efficient resource allocation and minimize transport costs. At the same time, to capture the timeliness and reliability of hydrogen supply, both the transport distance and transit time in the pipeline must be taken into full consideration. The hydrogen pipeline transmission framework is shown in Figure 2.
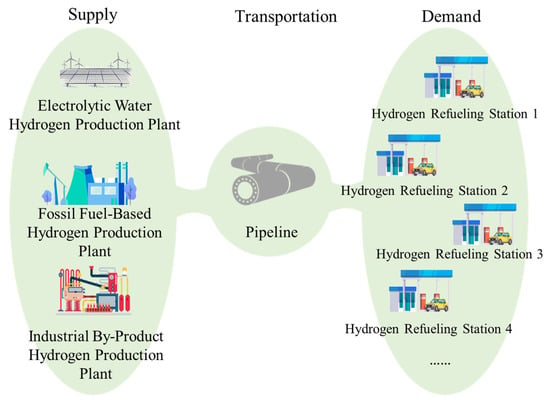
Figure 2.
Hydrogen pipeline transportation framework.
4.2. Model Construction
Combining the hydrogen production simulation on the supply side from Section 2 with the refueling station demand forecast on the demand side from Section 3, and based on the differences between the supply and demand curves of hydrogen production plants and refueling stations, this section develops an optimization model for hydrogen pipeline network configuration and transport. The model’s objectives are to minimize total pipeline transportation cost and maximize pipeline utilization, under constraints such as hydrogen supply–demand balance and pipeline capacity. Model assumptions and parameter values are listed in Appendix B.
4.2.1. Objective Function
This constraint ensures that at each time period t, the total supply from all hydrogen production plants equals the sum of all refueling stations’ demands plus the losses incurred during transportation, thereby guaranteeing that each station’s hydrogen demand is satisfied at every t.
4.2.2. Constraints
- (1)
- Hydrogen Supply Capacity Constraint:
- (2)
- Hydrogen Supply–Demand Balance Constraint:
This constraint ensures that at each time period t, the total supply from all hydrogen production plants equals the sum of all refueling stations’ demands plus the losses incurred during transportation, thereby guaranteeing that each station’s hydrogen demand is satisfied at every t.
- (3)
- Node Balance Constraint
At the supply-side node, the supply from the hydrogen production plant at time t equals the pipeline inflow at that node plus the hydrogen lost through leakage and permeation.
At the demand-side node, the pipeline outflow at time t equals the refueling station’s demand at time t.
For the pipeline’s inlet and outlet nodes, at time t, the inlet node’s flow equals the outlet node’s flow plus the hydrogen losses incurred during transport.
- (4)
- Green Hydrogen Supply Constraint
To drive the hydrogen transport system toward net-zero emissions, a minimum green hydrogen supply ratio is imposed. Over the entire optimization horizon, the share of green hydrogen transported must not fall below this minimum ratio, as expressed in the following equation:
- (5)
- Pipeline Network Transport Capacity Constraint
Hydrogen can only be transported between a production plant and a refueling station if a pipeline is constructed. Each pipeline can connect exactly one plant to one station. If a pipeline is built, equals 1; otherwise it equals 0.
- (6)
- Pipeline Operational Constraints
To minimize frequent start-ups and shutdowns of pipelines, a minimum continuous operation time and a maximum allowable downtime are imposed. Once pipeline transport starts, it must run continuously for at least hours; once it shuts down, it cannot remain offline for more than hours. Introduce a start/stop decision variable and an operation status variable for each pipeline at time t
4.3. Model Solution
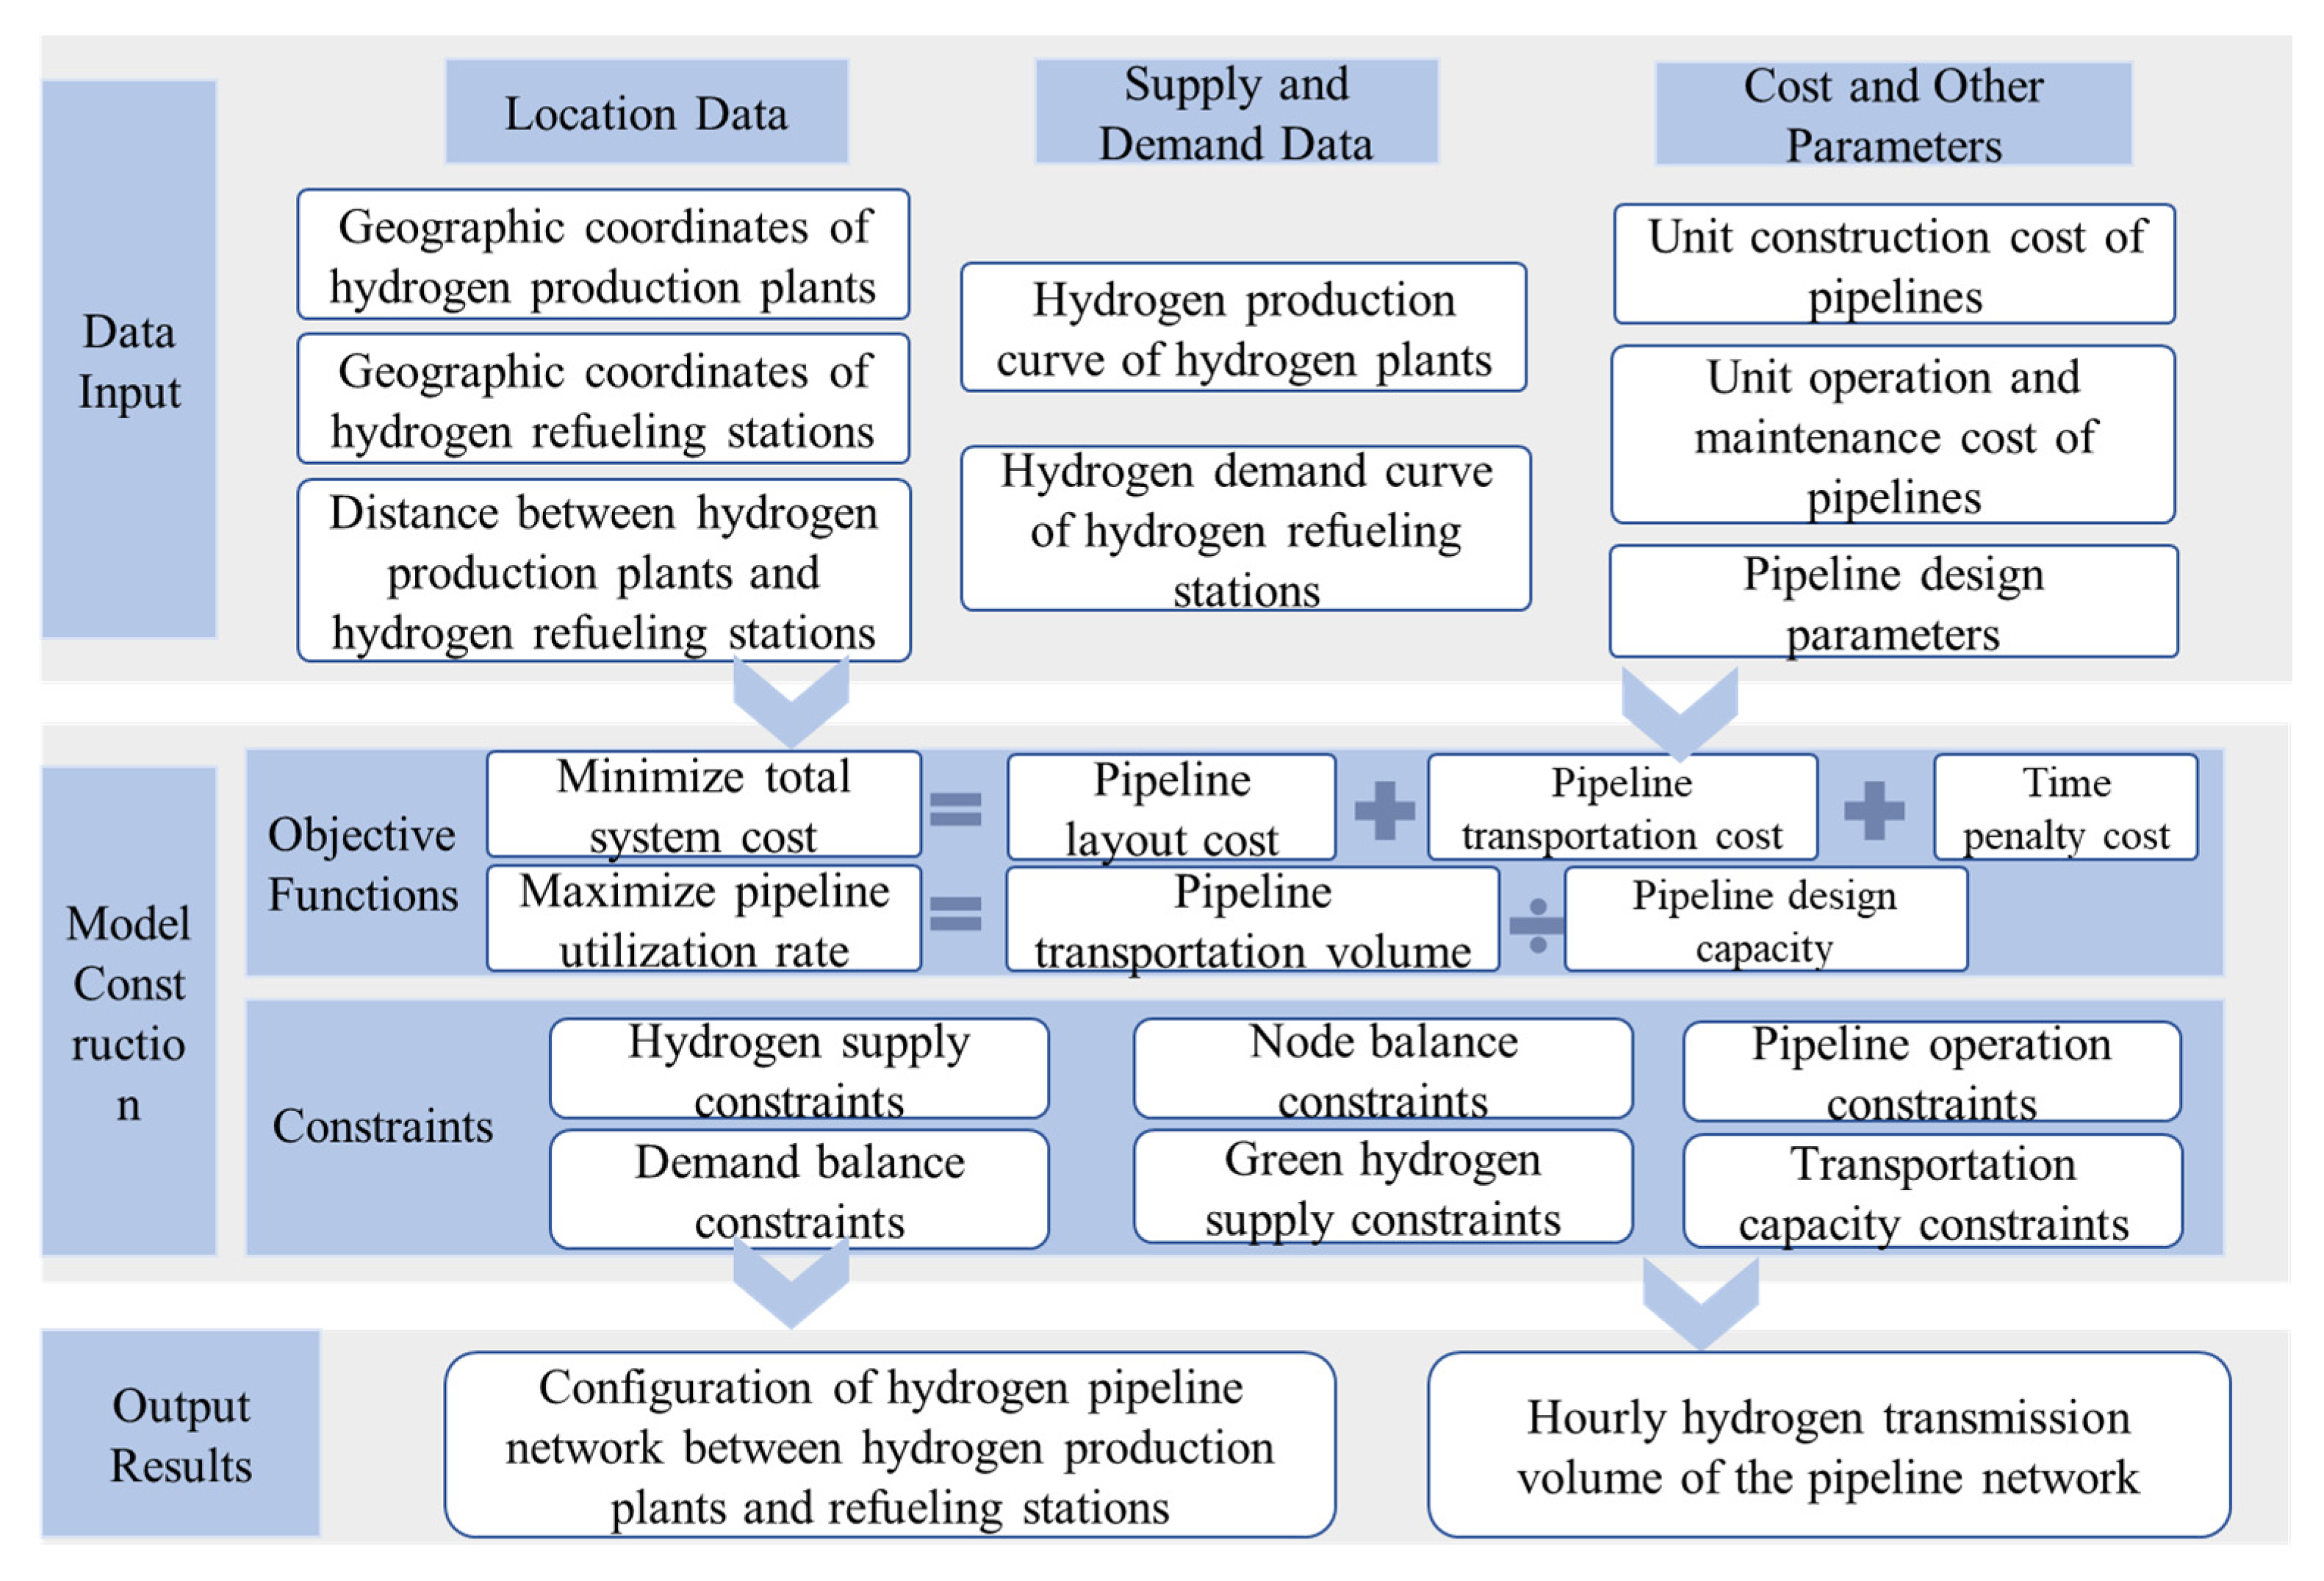
To solve the hydrogen pipeline network configuration and transportation optimization model, the production curves of the hydrogen plants, the demand curves of the refueling stations and the geographic locations of all plants and stations are first loaded as input data. These, together with various model parameters—such as cost figures and the distances between each plant and station—are then fed into the optimization model. Once solved, the model yields the pipeline network layout under the dual objectives of minimum cost and maximum pipeline utilization, as well as the hourly transportation links and flow volumes. The solution framework is illustrated in Figure 3.
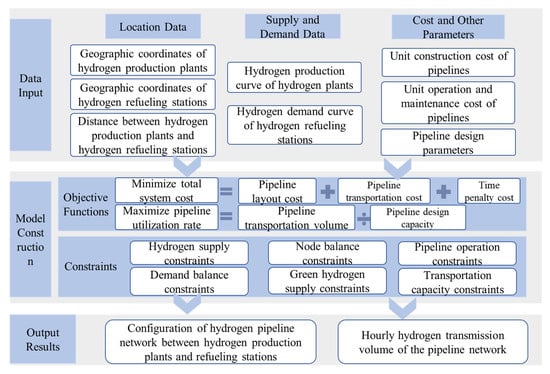
Figure 3.
Framework for solving the hydrogen pipeline network transportation model.
The hydrogen pipeline network configuration and transportation optimization model is solved in MATLABR2024a by calling the CPLEX12.10.0 solver. To fit CPLEX’s single-objective framework, the original multi-objective problem is first converted into a single-objective one via the weighted-sum method: the two goals of minimizing total cost and maximizing pipeline utilization are combined into a single objective function. By choosing different combinations of weights (one for cost, one for utilization), and solving the model for each weight set, we obtain a family of Pareto-optimal solutions. All non-dominated solutions are recorded to assemble the final Pareto solution set.
The proposed model introduces several advances in both conceptual design and mathematical formulation compared with existing studies.
Conceptually, most traditional hydrogen network models focus on spatial siting or single-period cost minimization, neglecting the temporal–spatial coupling between supply and demand. This study integrates spatial network configuration with hourly scheduling within a unified framework, allowing simultaneous representation of renewable energy variability and hydrogen refueling demand fluctuations. Structurally, the model employs a bi-objective mixed-integer linear programming (MILP) approach that minimizes annualized system cost while maximizing pipeline utilization. Through weighted-sum scalarization, Pareto-optimal solutions are derived to capture the trade-off between economy and operational efficiency. In addition, green hydrogen ratio constraints and pipeline start-up/shutdown continuity constraints are incorporated to enhance operational feasibility and stability. Overall, the model achieves an integrated, multi-objective, and constraint-coupled optimization framework, providing a more realistic and practical tool for dynamic regional hydrogen network planning.
5. Case Study Analysis
The complete hydrogen energy industry system, comprehensive infrastructure, and abundant application scenarios in the BTH region provide a vast market for hydrogen energy. To validate the feasibility of the model, we select several existing and planned hydrogen production plants and refueling stations in the BTH area—where hydrogen energy development is being vigorously promoted—as the study objects. We then study the hydrogen pipeline network transportation between them, and derive the pipeline configuration linking the production plants to the refueling stations.
5.1. Parameter Settings
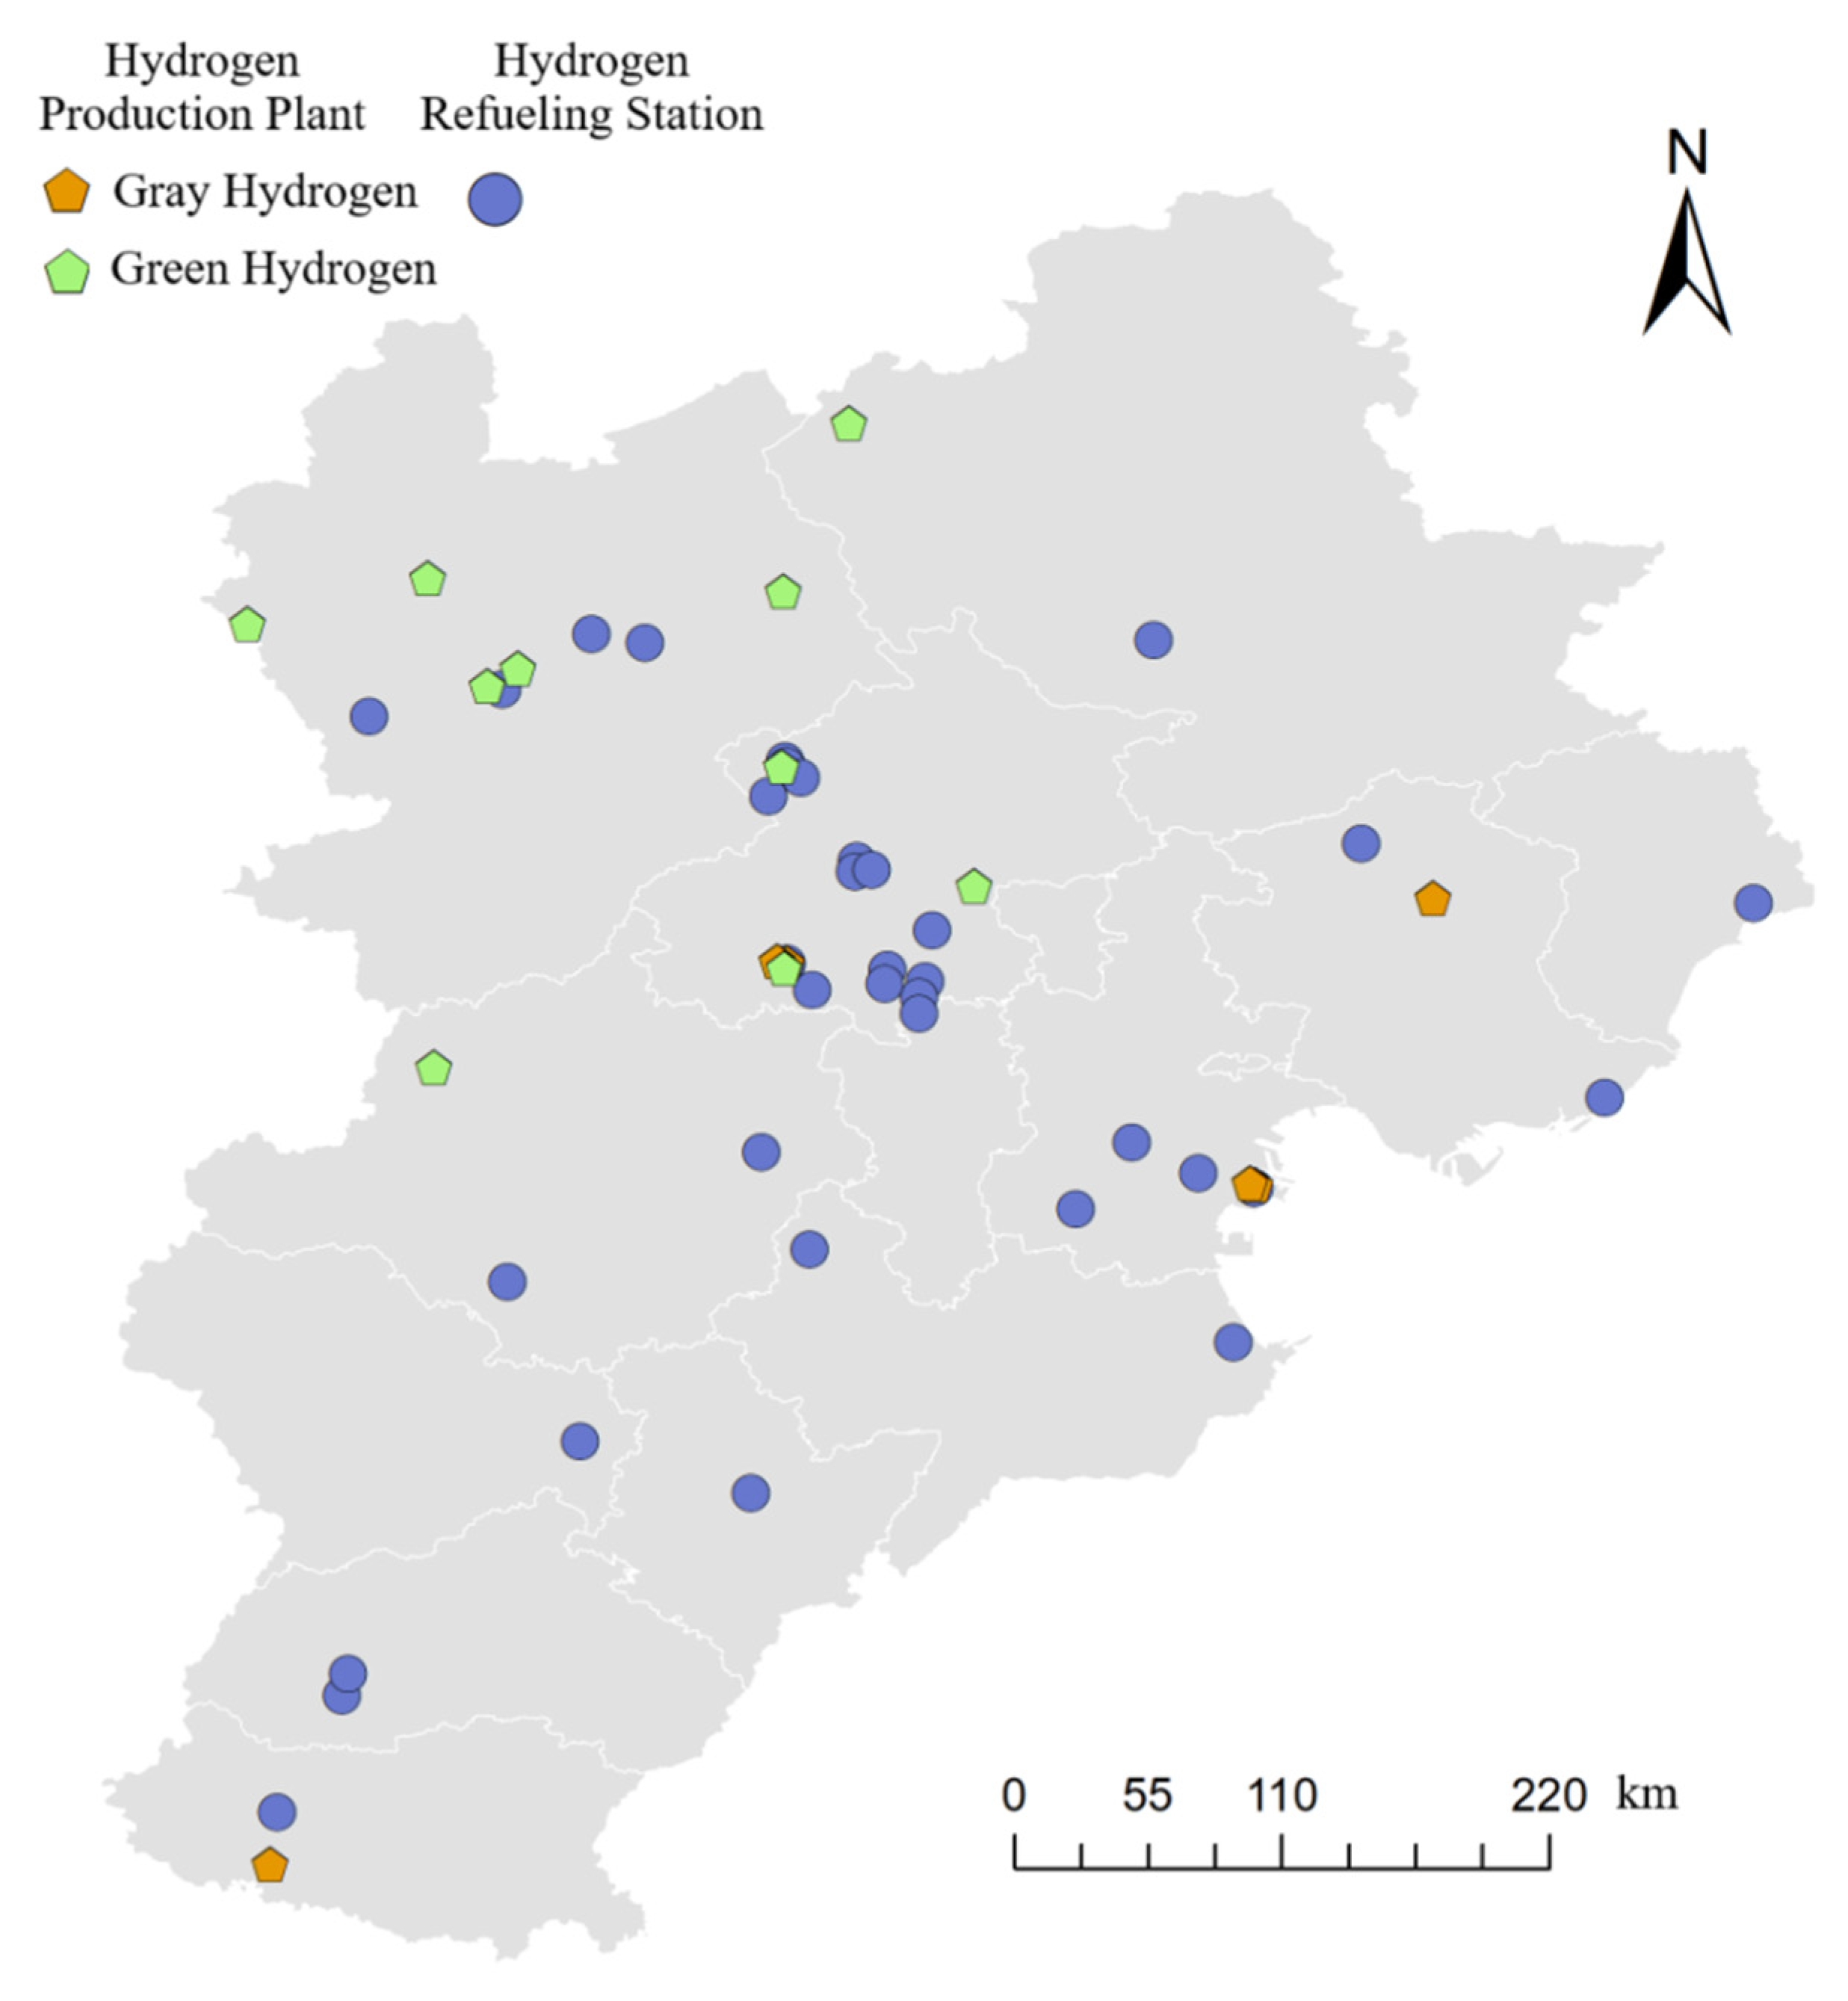
Based on actual constructions and the regional development plan, 16 hydrogen production plants employing different production methods within the BTH region were chosen as study objects. As the number of refueling stations in the region grows rapidly, 38 stations—selected according to their current construction status and development plans—were taken as study objects. Detailed information is provided in Appendix C.
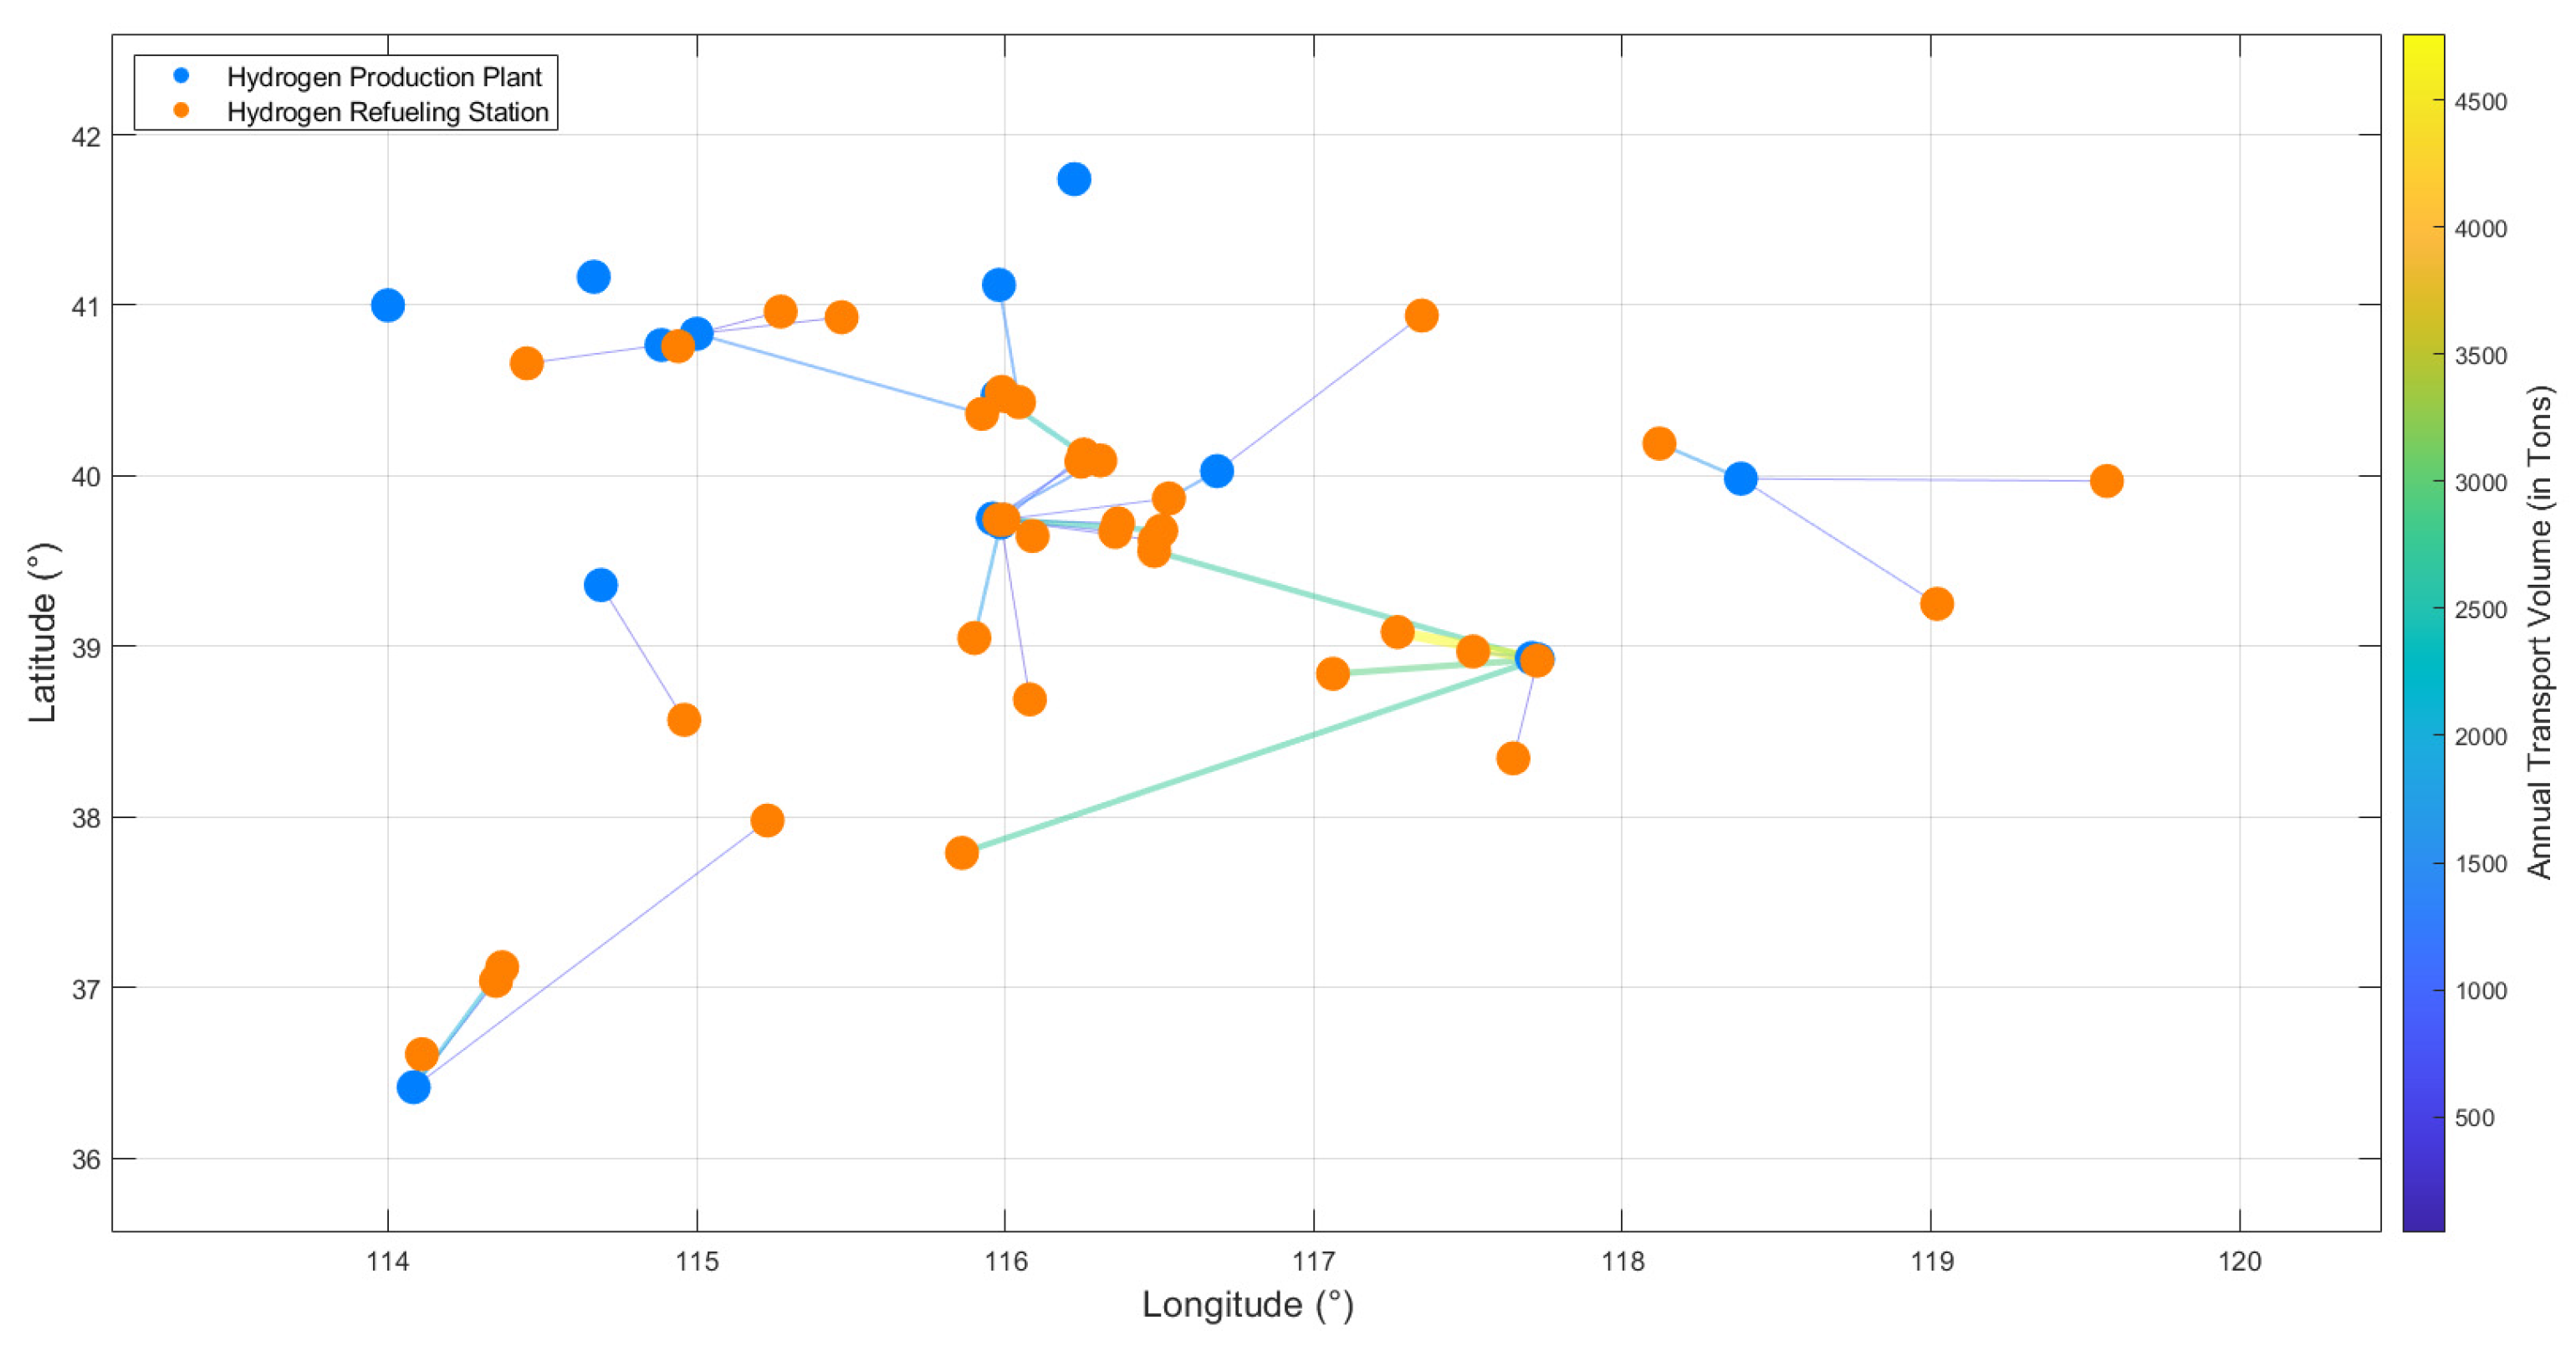
The geographic distribution of these production plants and refueling stations is shown in Figure 4.
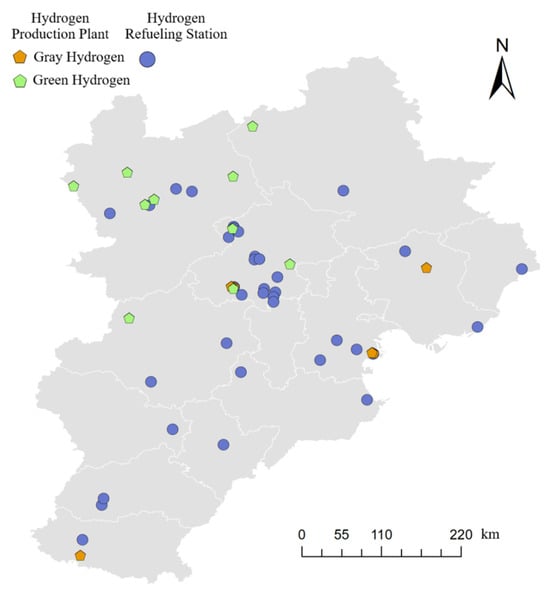
Figure 4.
Distribution of hydrogen production plants and hydrogen refueling stations.
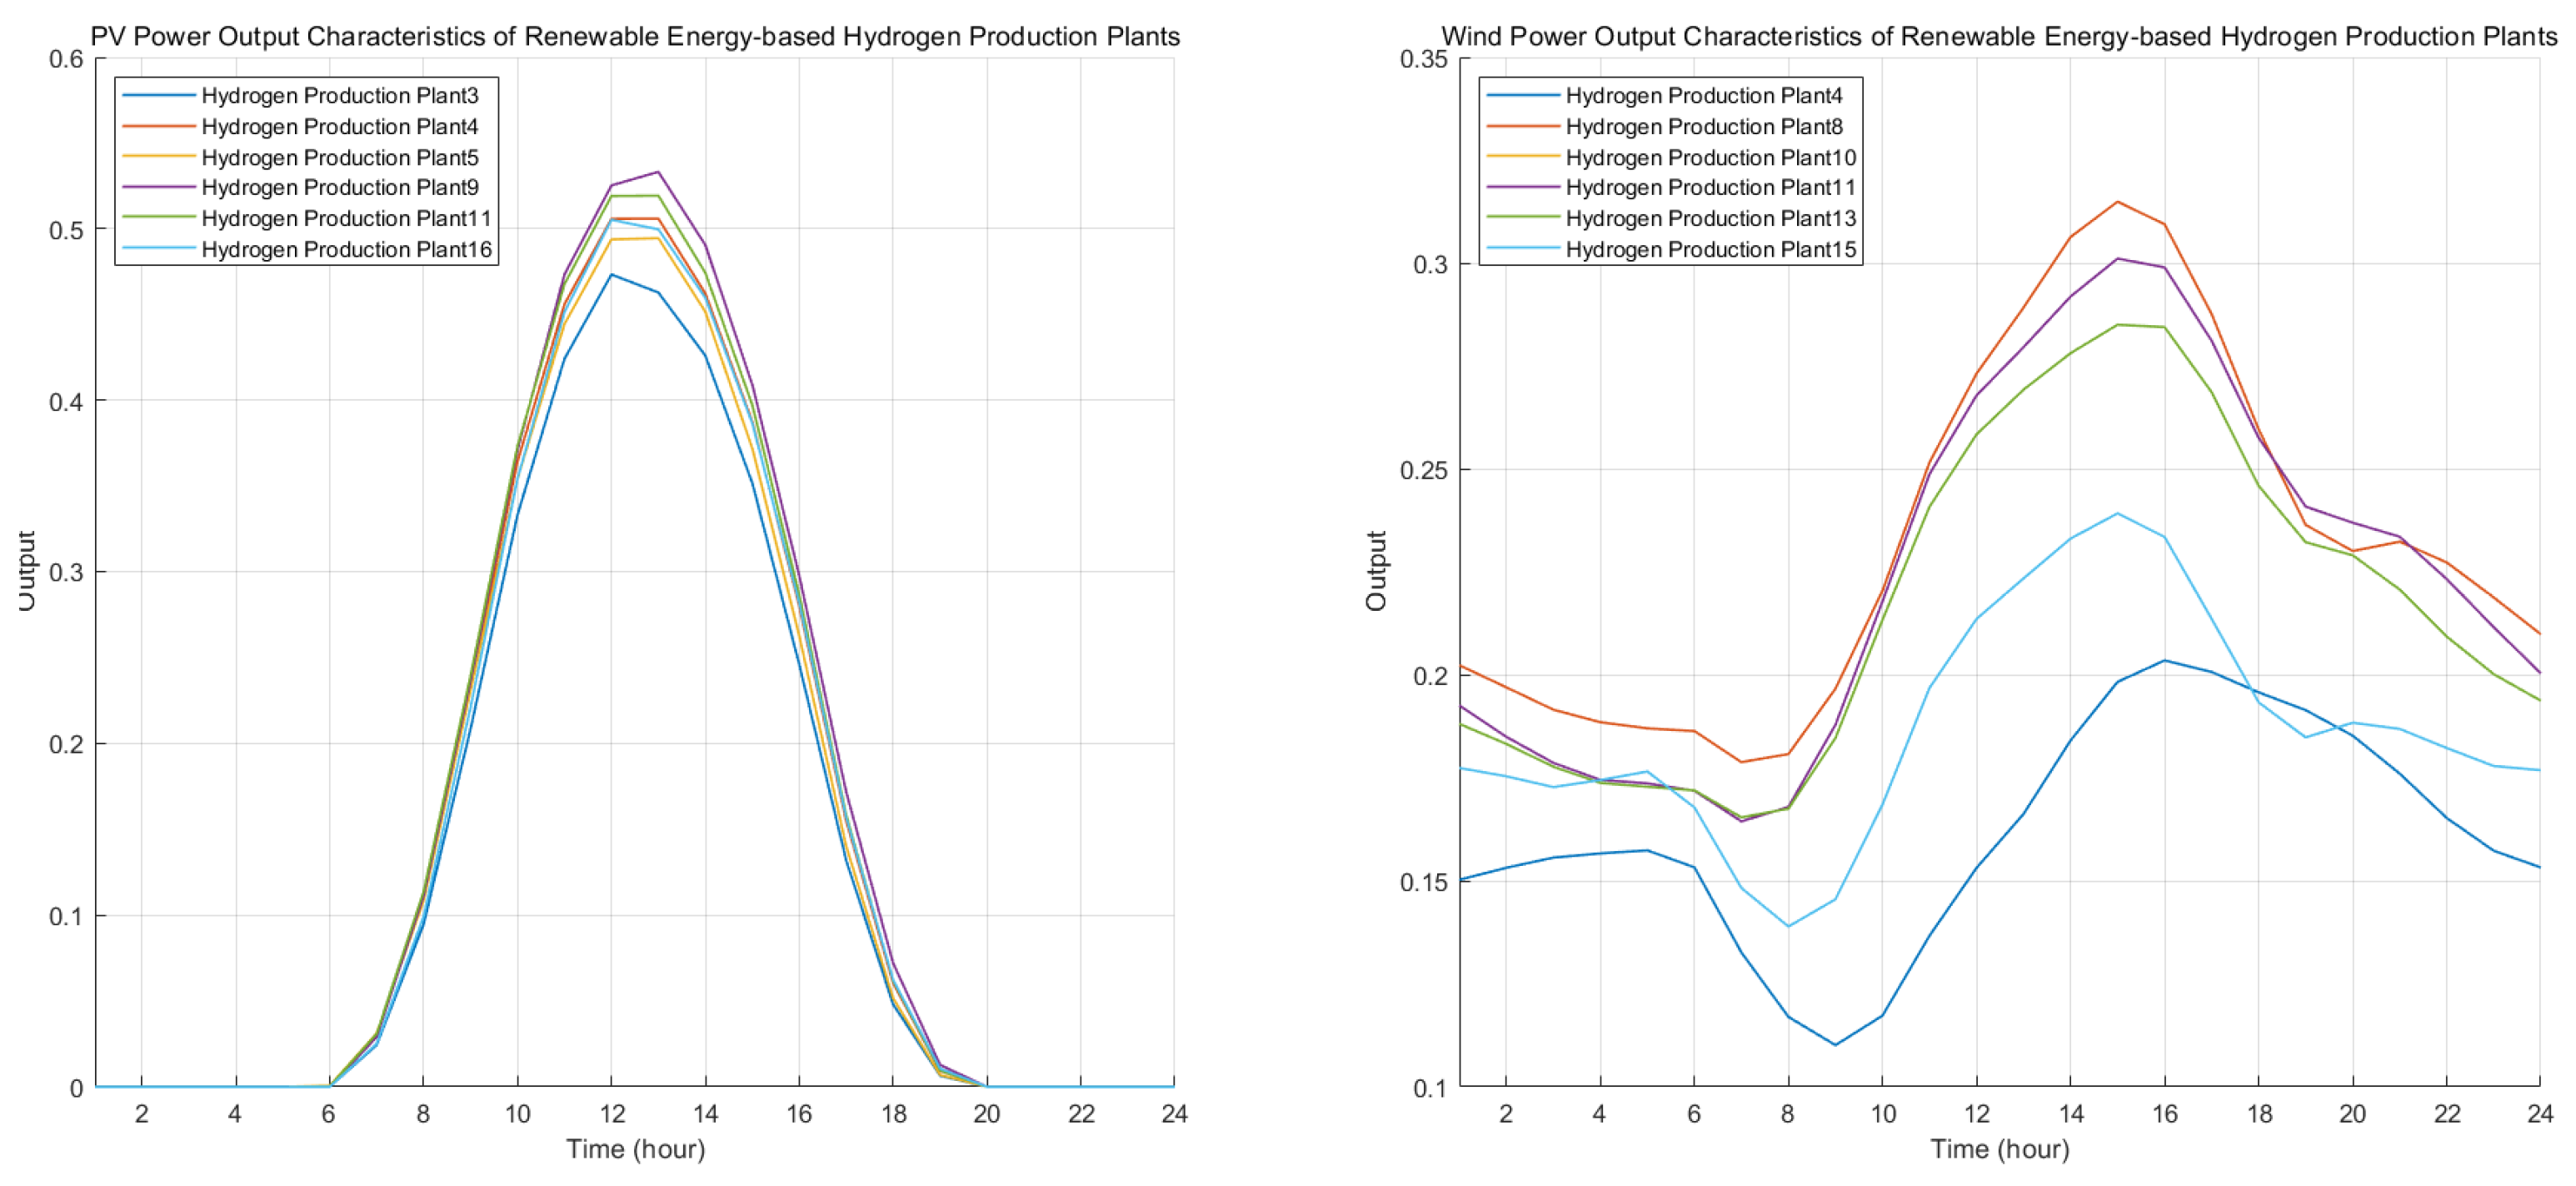
For the hydrogen production side, when simulating the production curve for water electrolysis plants, we first generate realistic wind and solar output profiles based on the local renewable resource conditions at each plant’s actual site. By entering the latitude and longitude of each electrolytic hydrogen plant on the NASA website, we obtain hourly renewable resource data for all 8760 h of the year—specifically, 2 m air temperature, 50 m wind speed, and clear—sky surface shortwave downward irradiance. From these data we derive the typical daily wind and solar power output curves for each electrolytic hydrogen plant, as shown in Figure 5.
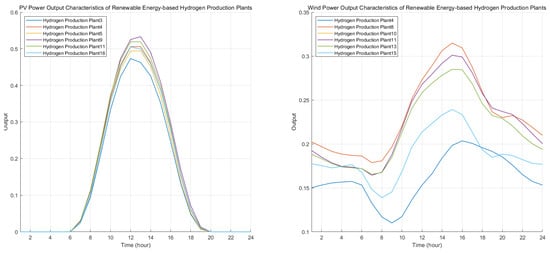
Figure 5.
Typical daily wind and solar power output characteristics of electrolytic water-based hydrogen production plants.
Regarding hydrogen refueling stations, the average daily driving distance and hydrogen consumption per 100 km differ among various types of hydrogen fuel cell vehicles. The parameters associated with each vehicle category are summarized in Table 2 [49].

Table 2.
Parameter Settings for Different Hydrogen Fuel Cell Vehicle Types.
In terms of pipeline network transportation, the hydrogen pipeline parameters are set as shown in Table 3.

Table 3.
Hydrogen Pipeline Parameter Settings.
The key parameters of this model—including hydrogen demand, renewable energy generation, and cost data—are derived from statistical sources, published literature, and internal data of Southern Power Grid, ensuring both representativeness and reliability.
The hydrogen demand is projected for 2025–2030 using the GM(1,1) grey prediction model based on 2021–2024 data from the BTH region, with a prediction error below 10%. Renewable generation data are taken from the NASA POWER database (8760 h wind and solar data), processed through MATLABR2024a simulations. Cost parameters, covering hydrogen production, storage, and pipeline construction, come mainly from Southern Power Grid’s internal statistical data, which reflect actual project-level costs and are consistent with real operating conditions.
A ±20% perturbation test on these key parameters shows limited influence on overall trends, and the optimal network configuration remains stable, confirming the robustness and reliability of the model.
5.2. Hydrogen Production Simulation Results from Hydrogen Production Plants
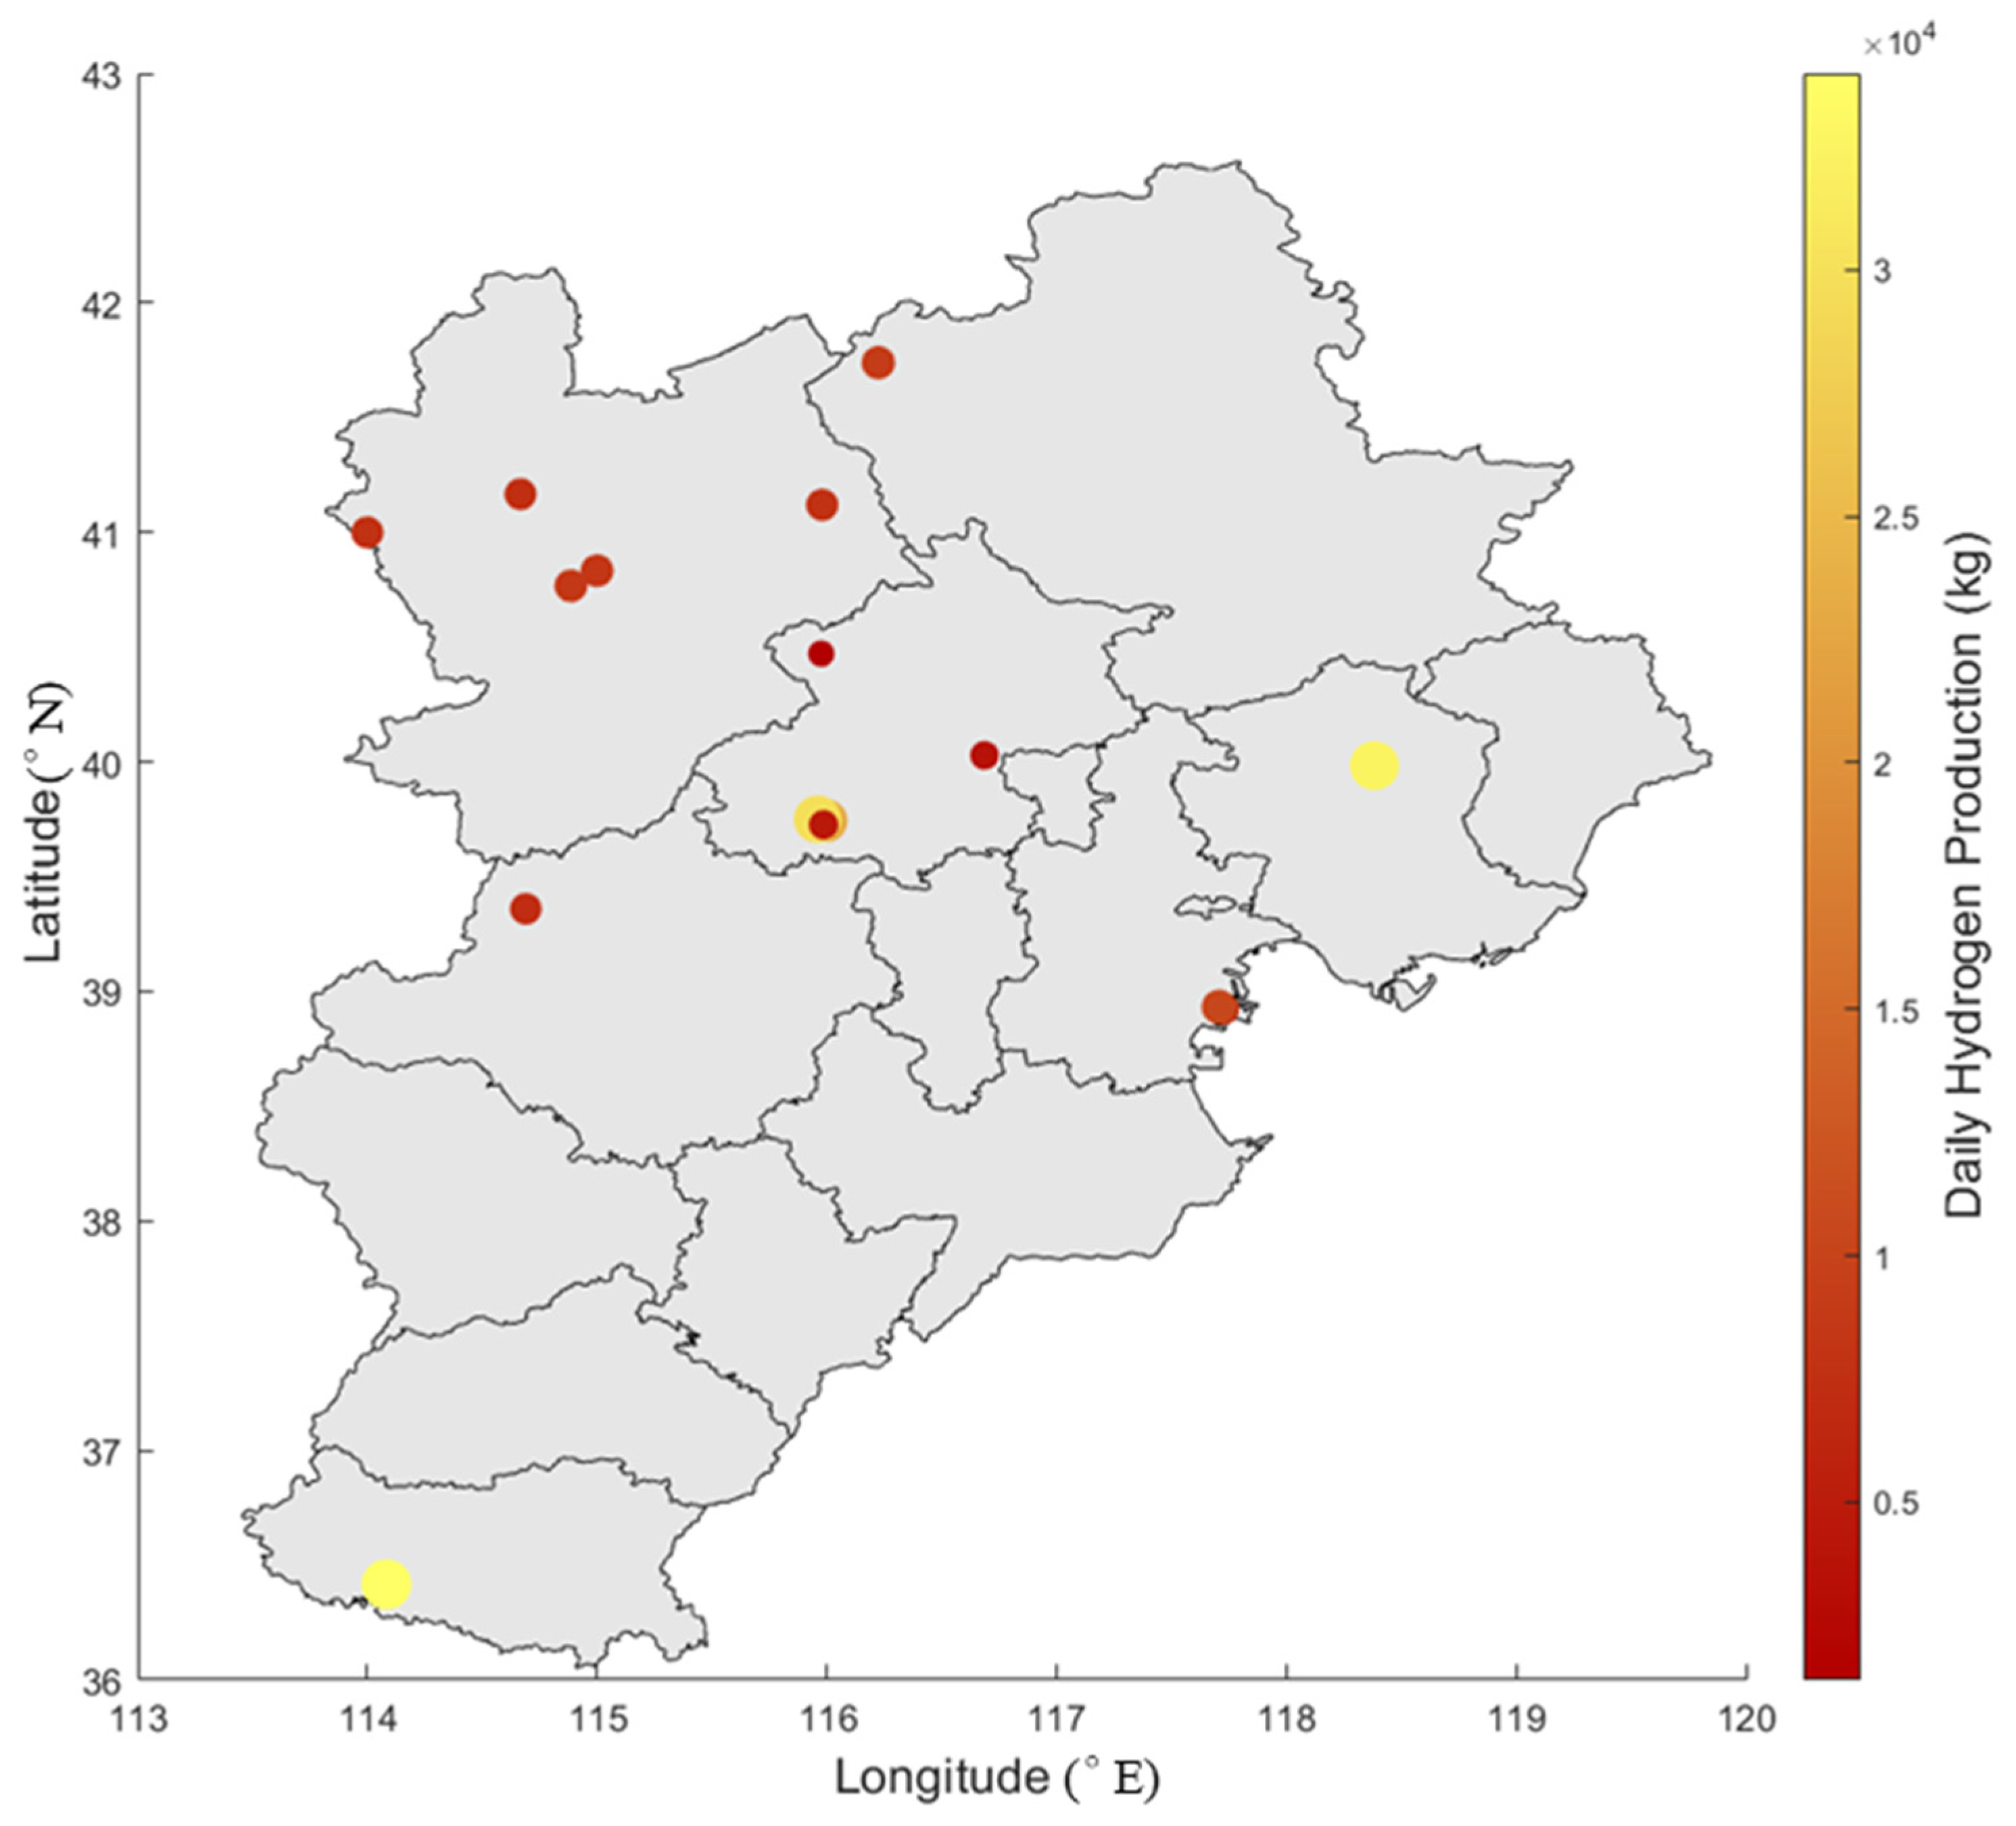
Figure 6 shows the distribution of hydrogen production in hydrogen production plants. Hebei has a relatively high hydrogen supply, but it is more dispersed. The main method of hydrogen production is through renewable energy-based water electrolysis, relying on its abundant renewable energy resources. The focus is on planning and building large-scale green hydrogen production bases, with renewable energy-based hydrogen accounting for 88% of the total production. Beijing and Tianjin have fewer hydrogen supply points, mainly relying on chemical enterprises, with hydrogen production primarily based on fossil fuels and industrial by-products.
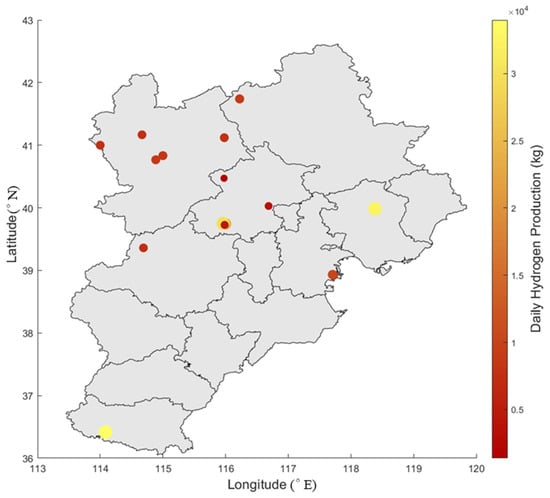
Figure 6.
Hydrogen production distribution of hydrogen production plants.
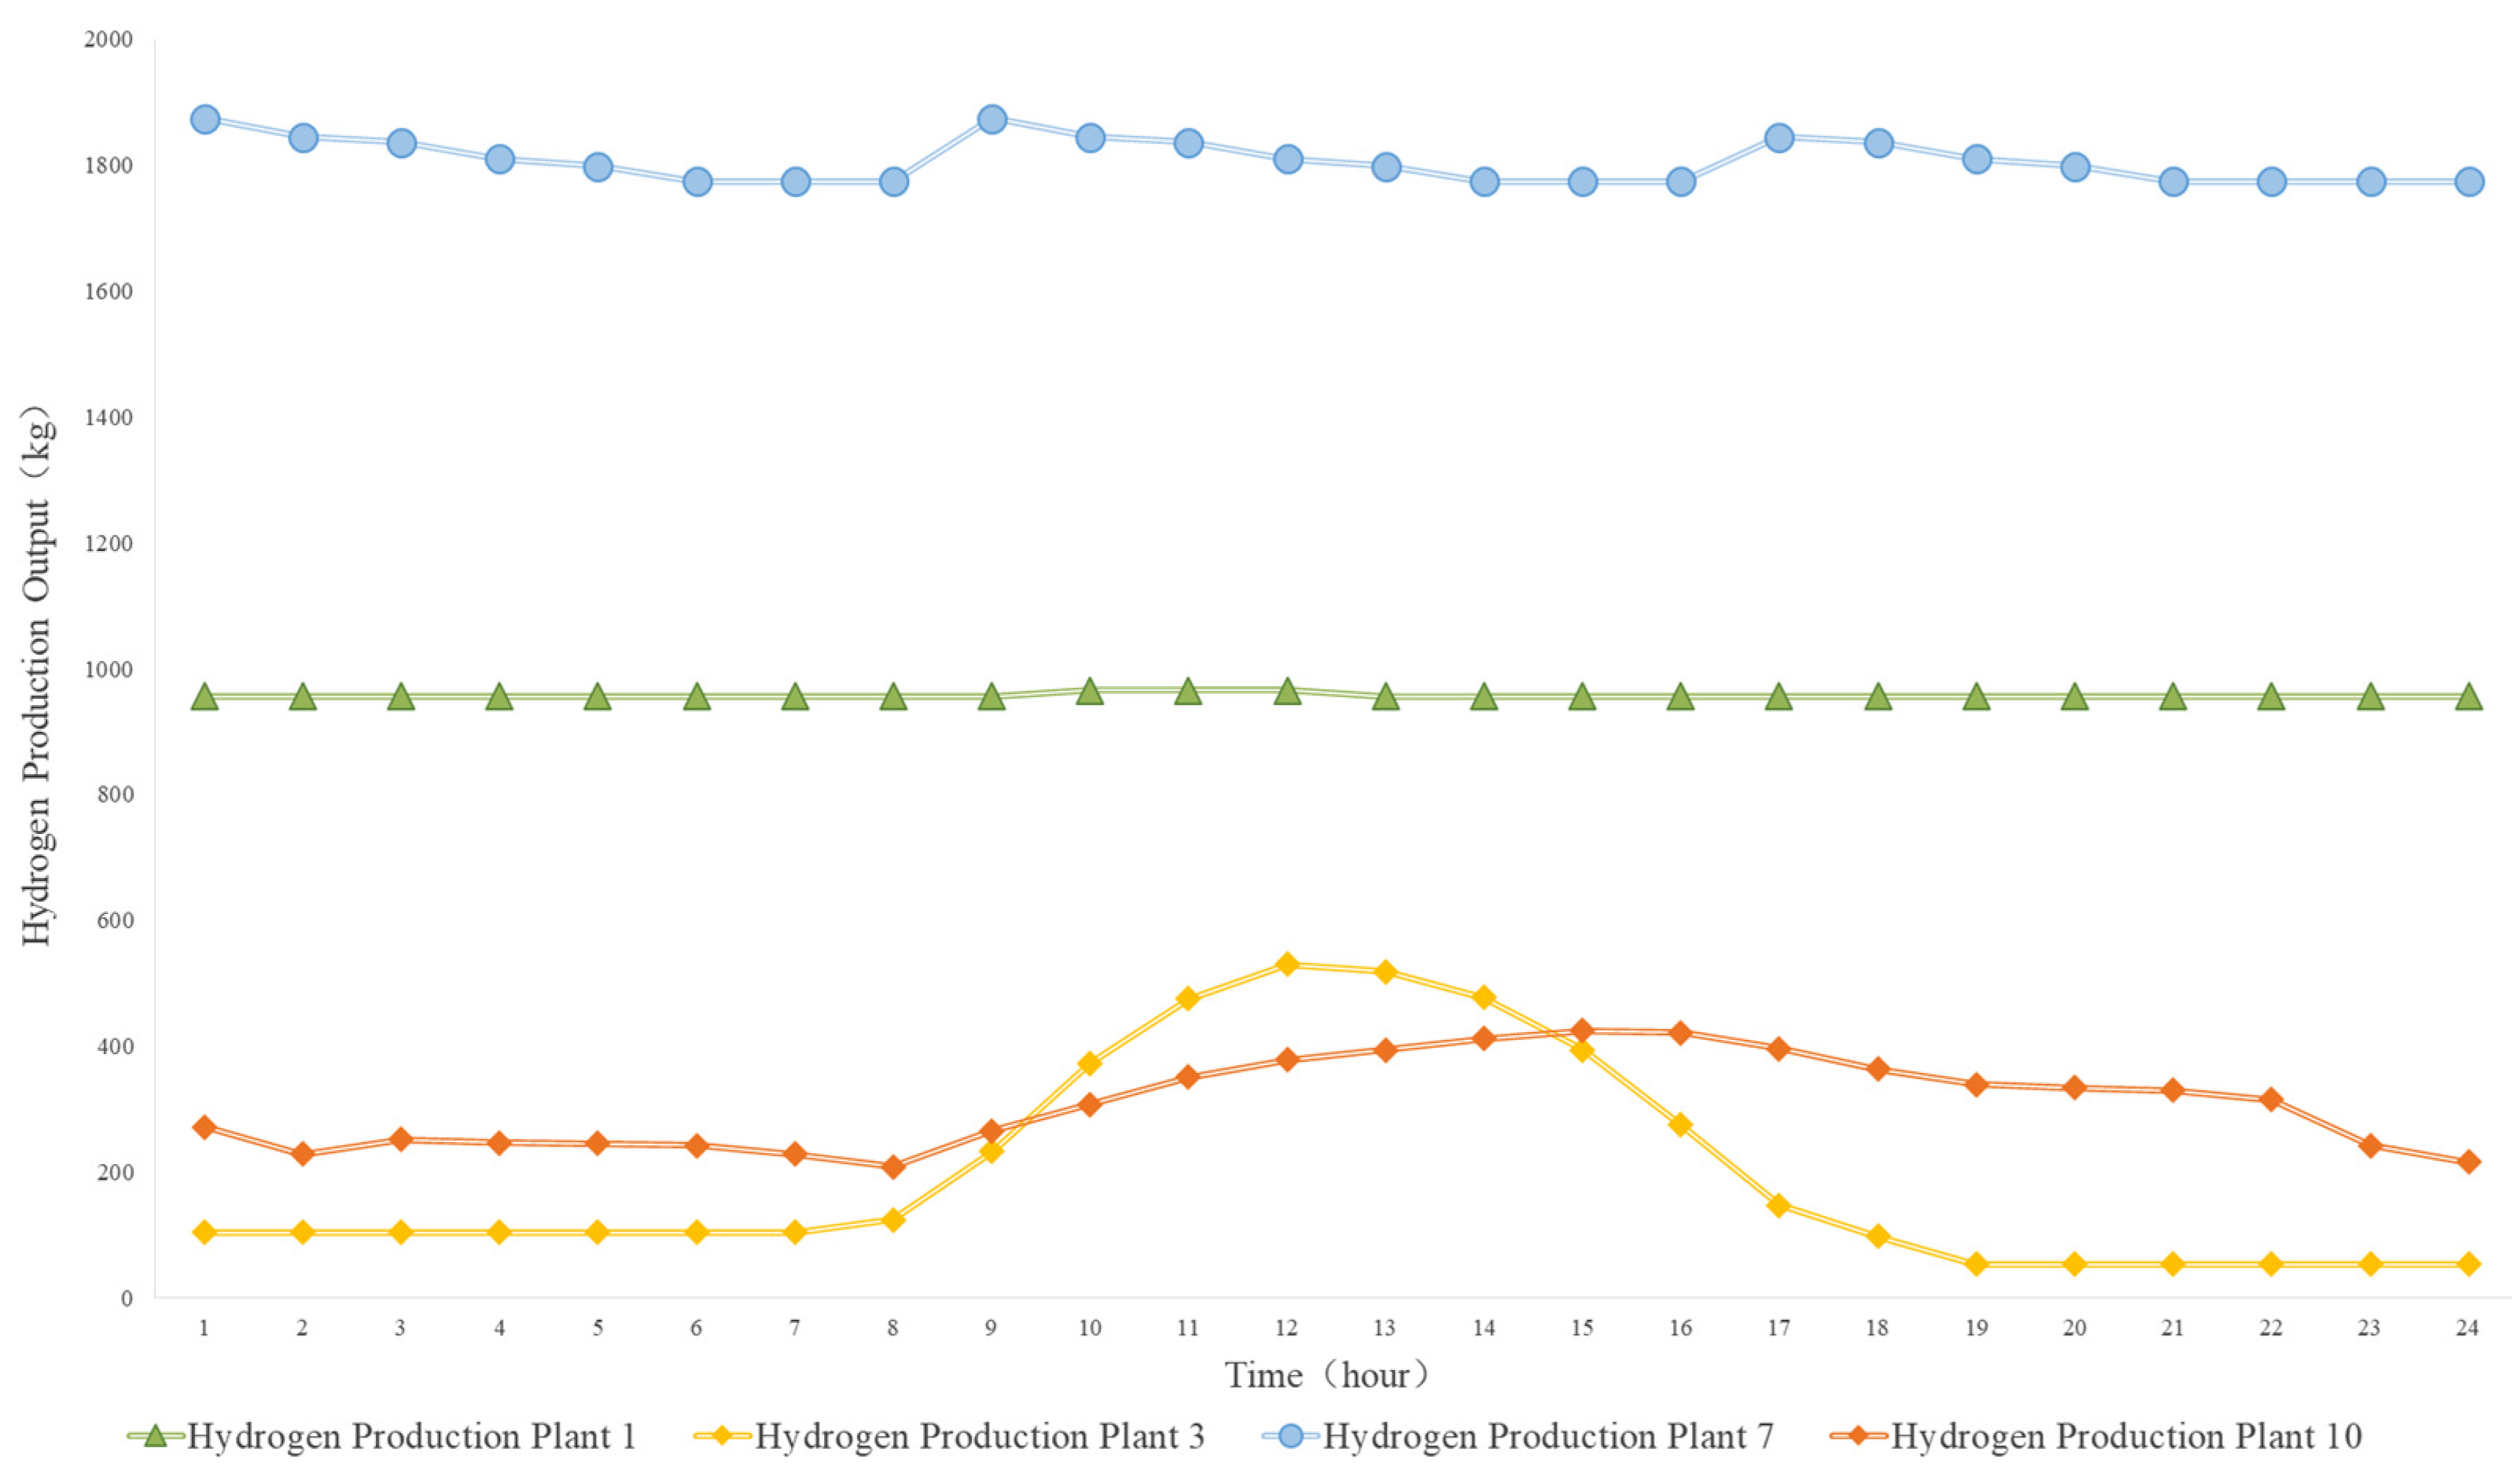
Based on the production curves simulated in Section 3 for the 16 hydrogen plants, we compare the typical daily hydrogen output profiles under three production methods: water electrolysis, industrial by-product, and fossil fuel reforming. Taking four exemplar plants—Plant 3 (off-grid PV-powered electrolysis), Plant 10 (grid-connected wind-powered electrolysis), Plant 7 (industrial by-product hydrogen), and Plant 1 (fossil fuel reforming)—their typical daily hydrogen production curves are shown in Figure 7.
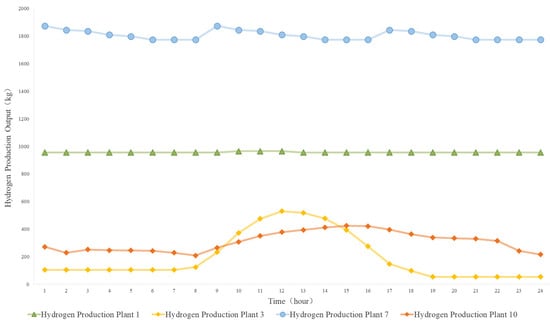
Figure 7.
Hydrogen production curves for some hydrogen production plants.
From the analysis, we observe that in the off-grid electrolysis scenario (Plant 3), hydrogen production closely follows the solar PV output, peaking at 0.5 t/h during the 10:00–15:00 period, and dropping to around 0.1 t/h at night when PV output is insufficient, with a daily fluctuation of 80%. In the grid-connected electrolysis scenario (Plant 10), wind-powered electrolysis shows peak output from 14:00 to 17:00, with the grid compensating for any shortfalls, resulting in a stable daily average of 0.35 t/h and a fluctuation of 42%. In the fossil fuel reforming scenario (Plant 1), production is highly stable with minimal variability. Due to the reliability of fossil fuel supply and the high cost of starting and stopping the equipment, the plant operates near full capacity to maintain economic efficiency, making it suitable as a base load hydrogen source that complements the fluctuating electrolysis plants and improves overall supply reliability. Finally, in the industrial by-product hydrogen scenario (Plant 7), hydrogen production is relatively steady but experiences small, periodic fluctuations due to the cycles of by-product gas availability and purification processes, without sharp peaks or valleys.
The renewable energy generation data used in this model were obtained from the NASA database, providing hourly wind speed and solar irradiance to derive wind–solar power output curves. The simulated hourly hydrogen flow patterns accurately capture the impact of renewable fluctuations on electrolysis dynamics. Moreover, the model-predicted hourly hydrogen production is highly consistent with the large-scale PV–wind hybrid hydrogen system results reported by Mazzeo et al. (2022) [50], showing similar variation trends and stability characteristics. These consistencies verify that the data sources are authoritative, the methodology is reasonable, and the results are aligned with existing experimental findings.
5.3. Refueling Station Hydrogen Demand Forecast Results
Based on the spatiotemporal distribution-based simulation of hydrogen demand at refueling stations, we generated daily demand curves for the 38 selected stations in the BTH region. First, we forecast the regional hydrogen fuel cell vehicle fleet sizes to estimate total regional hydrogen demand; then, by applying our spatiotemporal distribution model, we derive the individual hourly demand profiles for each station.
5.3.1. Hydrogen Fuel Cell Vehicle Fleet Size Forecast Results
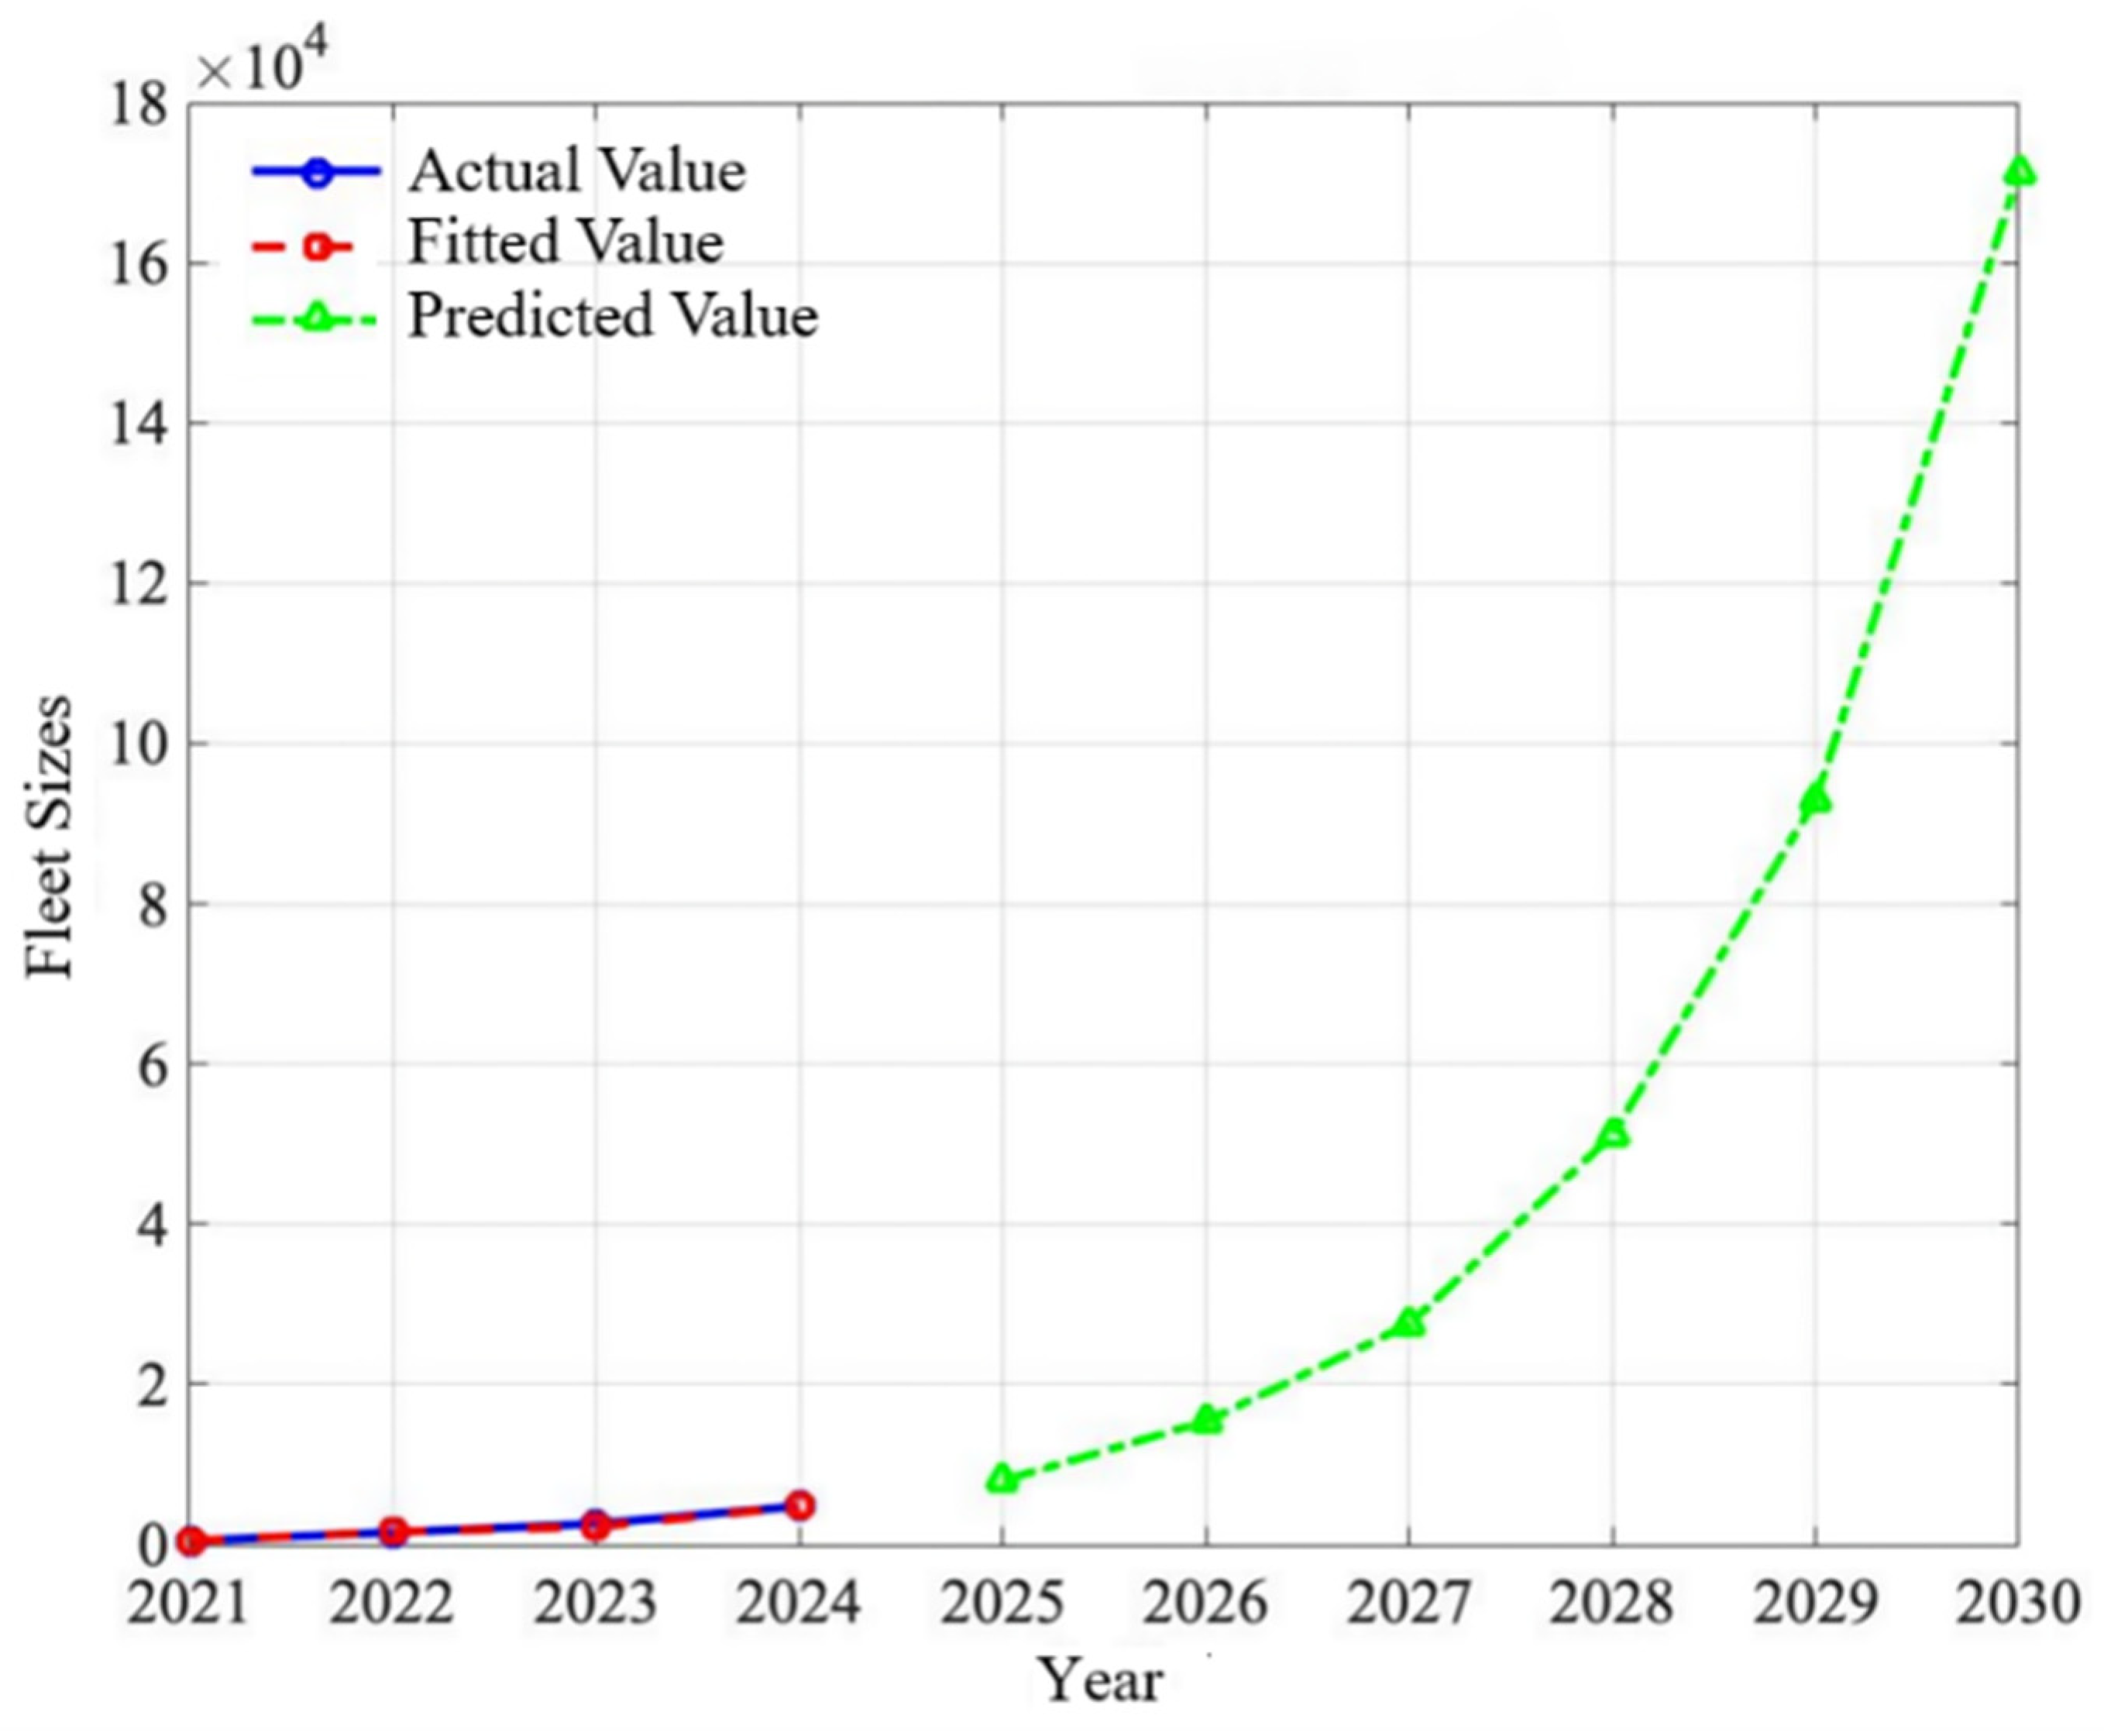
Using the hydrogen fuel cell vehicle fleet sizes in the BTH region from 2021 to 2024 as the baseline data, we compare the forecasted values with the actual figures and plot the model’s fit curves. Taking Beijing as an example, Figure 8 shows the actual, fitted, and forecasted hydrogen fuel cell vehicle ownership curves for the Beijing area.
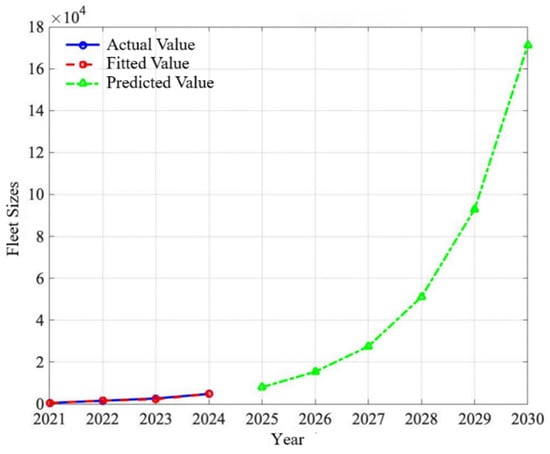
Figure 8.
GM(1,1) model fitting curve chart.
From Table 4, the model produces a posterior difference ratio (C-value) of 0.0988 and a small error probability (p-value) of 1.000. According to the GM(1,1) model accuracy criteria, this corresponds to an “excellent” precision rating. The projected hydrogen fuel cell vehicle fleet sizes in the BTH region for 2025–2030 are listed in Table 5.

Table 4.
Analysis of Model Construction Results.

Table 5.
Forecast of Hydrogen Fuel Cell Vehicle Fleet Sizes in the BTH Region for 2025–2030 (vehicles).
According to the forecast, the hydrogen fuel cell vehicle fleet in the BTH region will continue to grow, reaching about 15,000 vehicles in total by 2025—7987 in Beijing, 5659 in Tianjin, and 1814 in Hebei. The overall design logic of the hydrogen supply network in this study follows a similar framework to [51], and the obtained results are consistent with the development characteristics and urban types of the three cities analyzed.
5.3.2. Hydrogen Refueling Station Demand Simulation Results
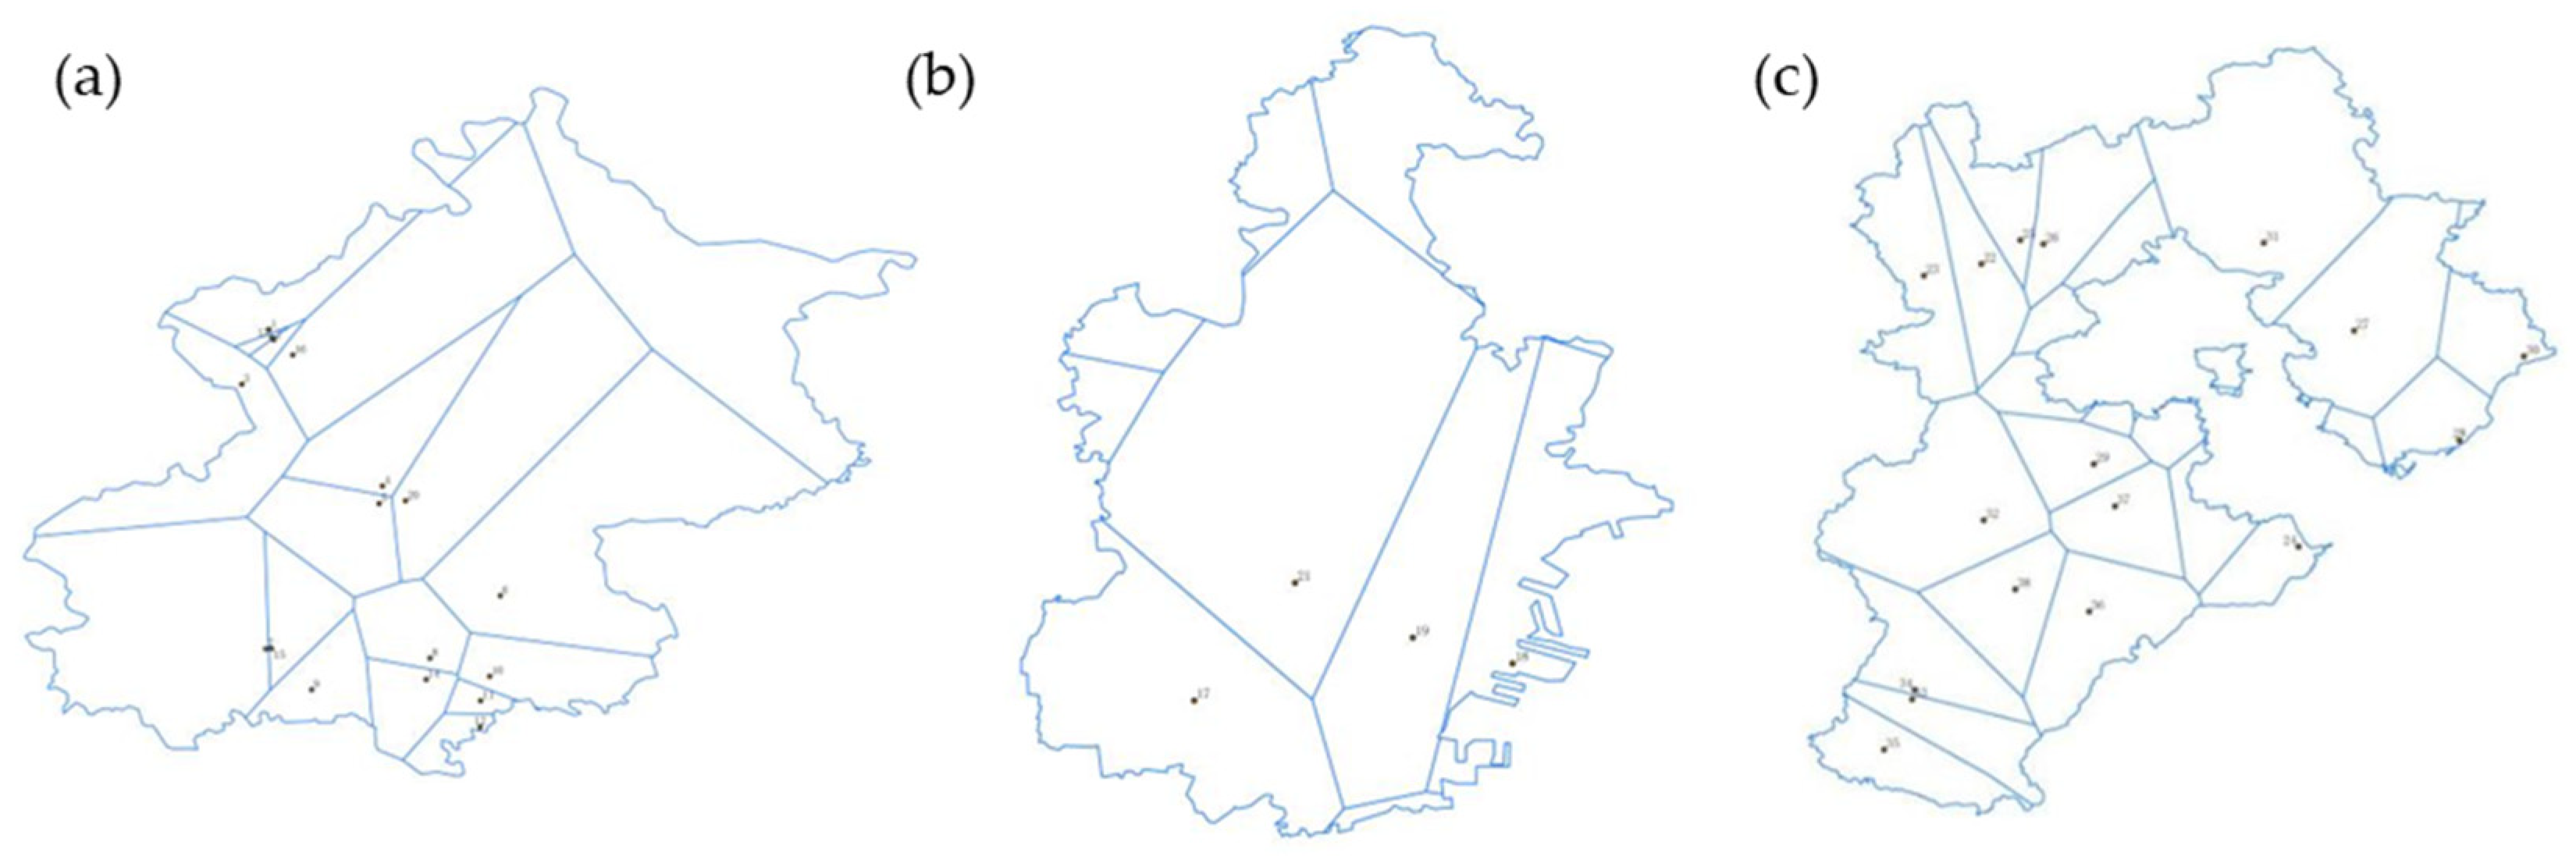
Based on the hydrogen fuel cell vehicle fleet data from Section 5.3.1, with 2025 as the target year, and combined with the daily hydrogen consumption per vehicle, the total daily hydrogen refueling demand for hydrogen fuel cell vehicles in Beijing, Tianjin, and Hebei is calculated to be 62,470 kg, 32,361 kg, and 42,127 kg, respectively. Then, based on the constructed spatiotemporal distribution model, the hydrogen refueling station service areas in the BTH region are divided using a Voronoi diagram, as shown in the Figure 9.
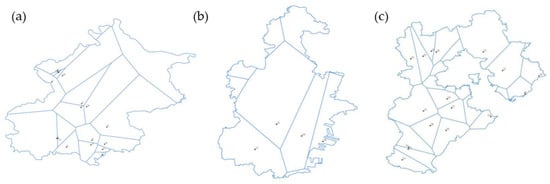
Figure 9.
(a) Voronoi service areas of hydrogen refueling stations in Beijing; (b) Voronoi service areas of hydrogen refueling stations in Tianjin; (c) Voronoi service areas of hydrogen refueling stations in Hebei.
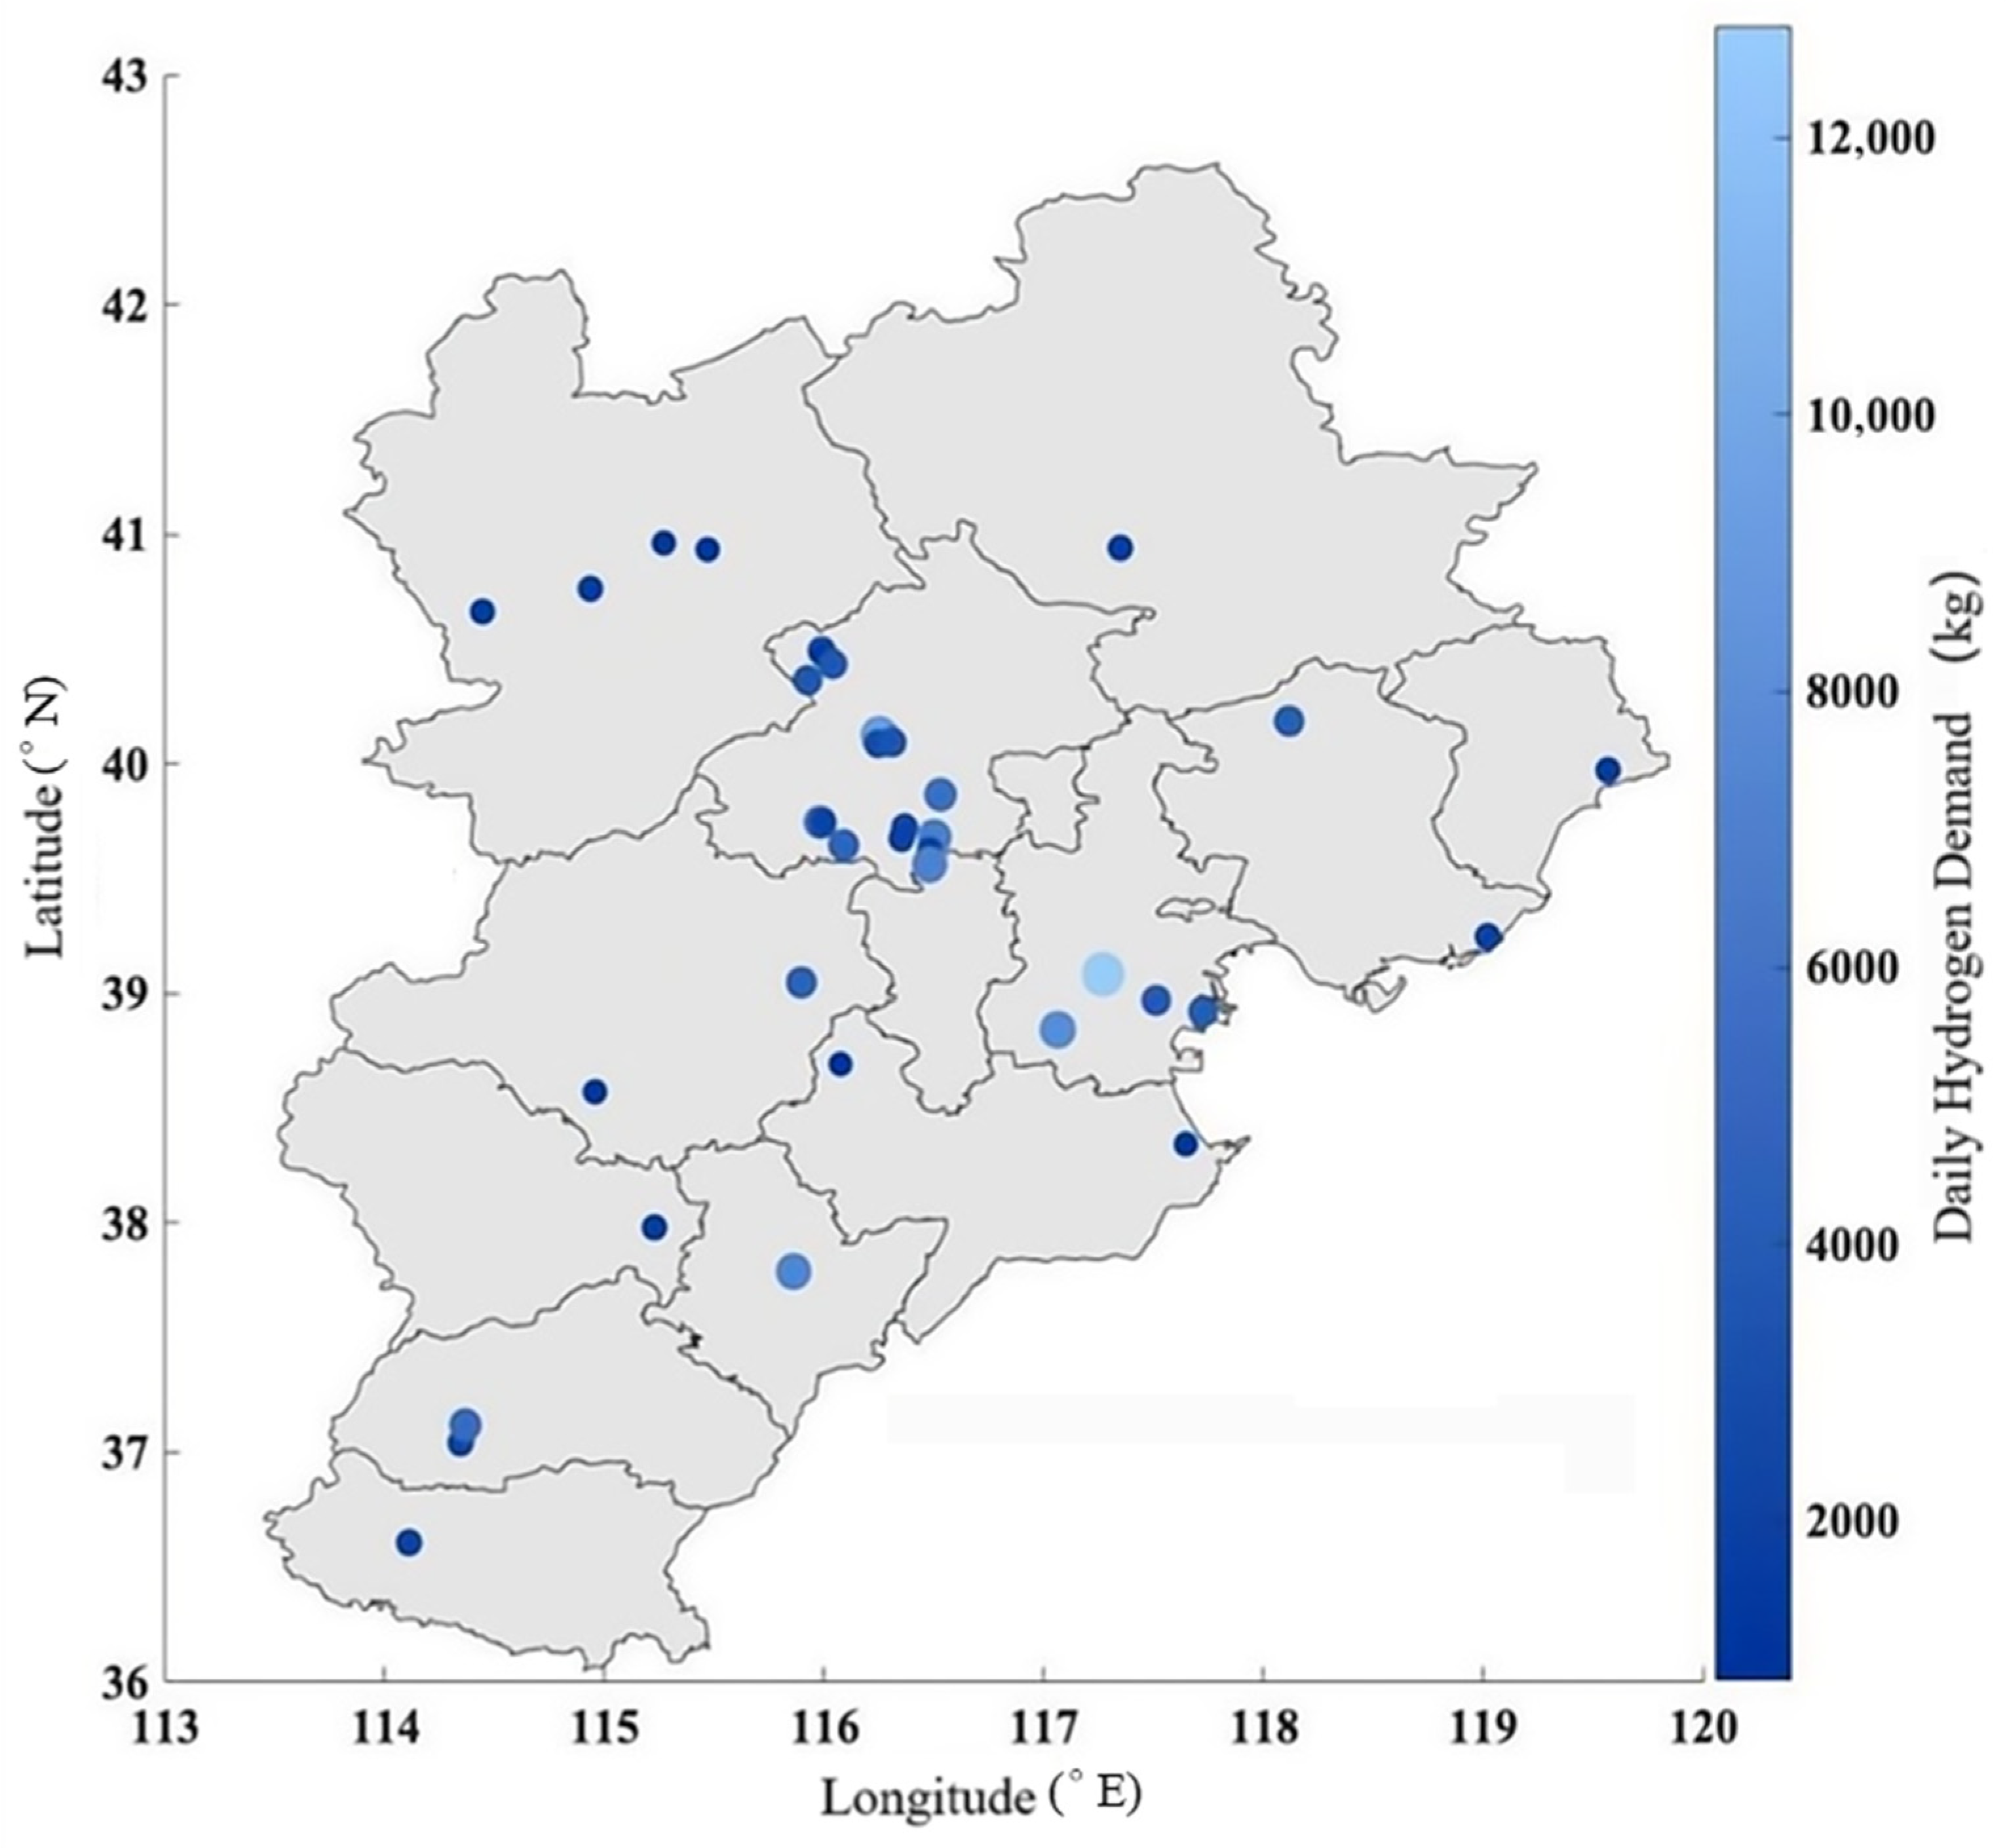
Based on the delineated Voronoi service areas of the refueling stations, the daily hydrogen demand distribution for 38 stations was obtained, as shown in Figure 10. The refueling station demand across the BTH region exhibits a “concentrated head, dispersed tail” pattern: high-demand stations are primarily clustered in Beijing and Tianjin—together accounting for 70% of the stations’ annual hydrogen demand—and are mostly situated near hydrogen-energy industrial parks and transport hubs such as Yanqing and the Binhai New Area. In Hebei, however, station demand is more scattered; in areas like Zhangjiakou and Xingtai, where hydrogen vehicles are still in early promotion, demand remains relatively low, with each station’s annual demand reaching only 20–30% of that at Beijing’s high-demand sites.
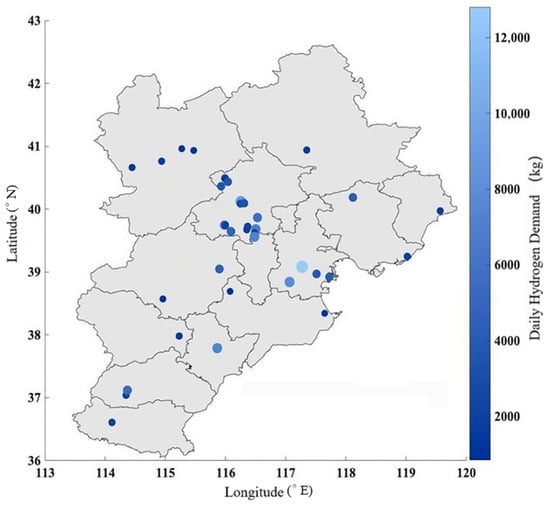
Figure 10.
Total daily hydrogen demand of the refueling stations.
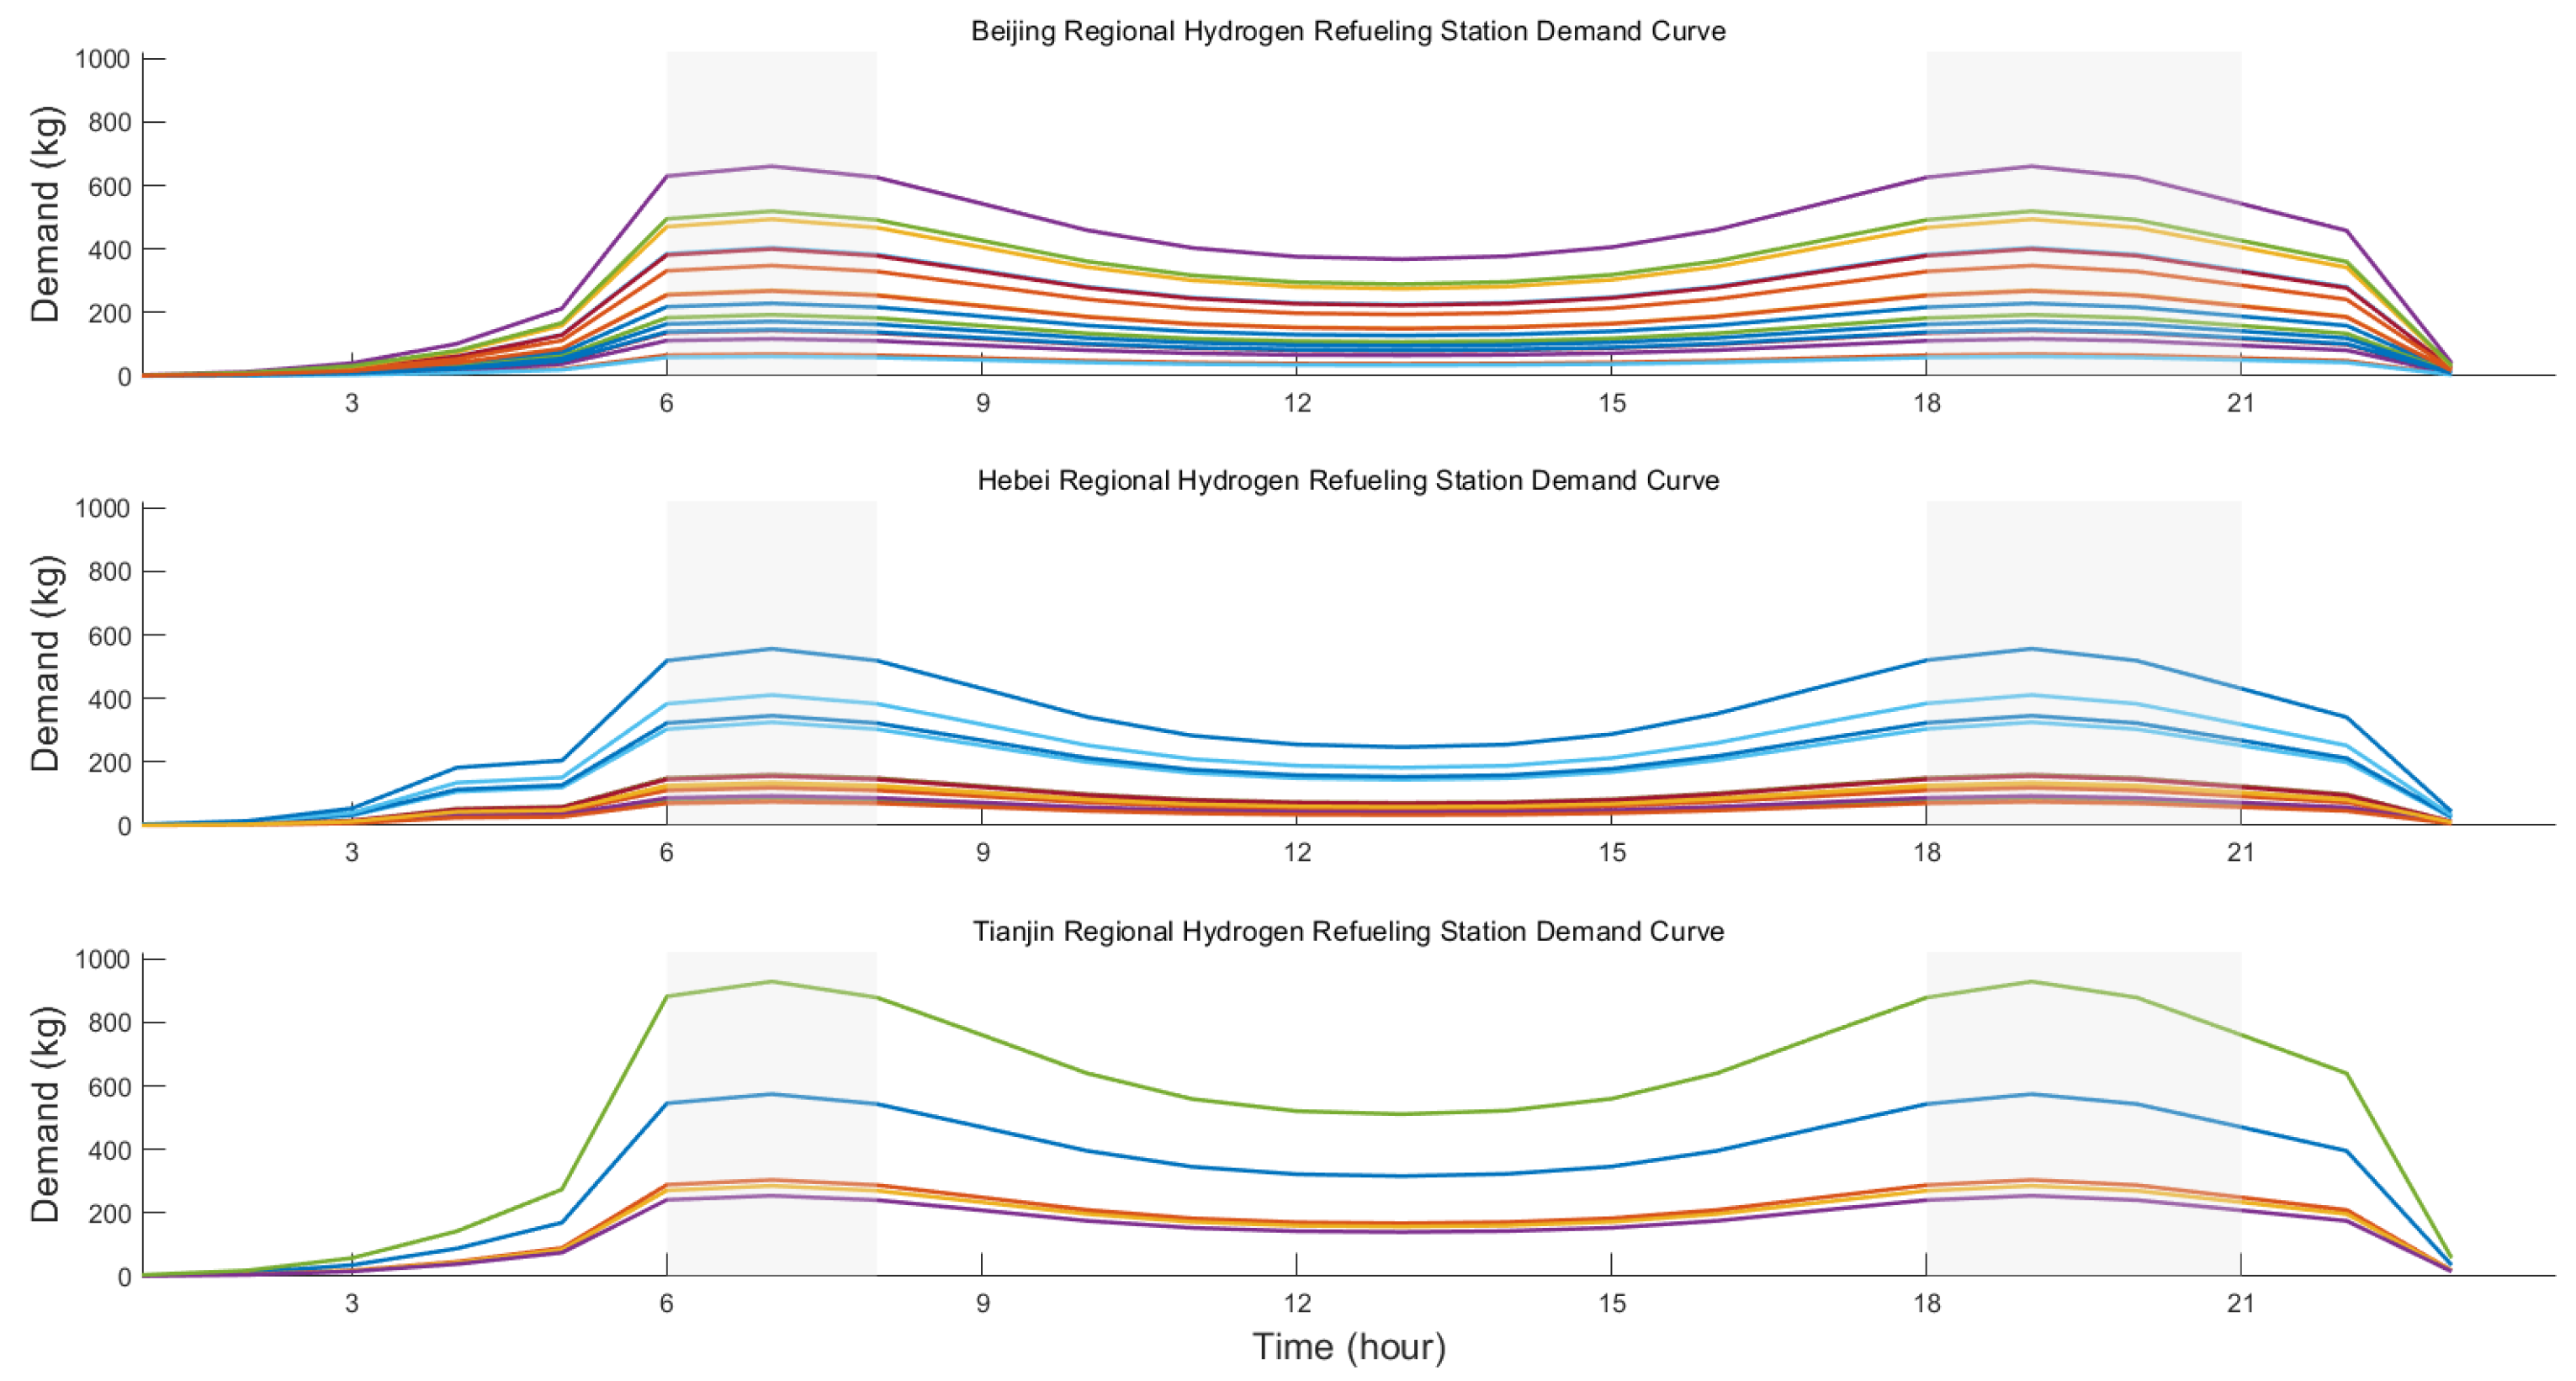
Based on the simulated temporal distribution of refueling, the daily hydrogen demand curves for each refueling station are shown in Figure 11. Demand peaks occur in the 06:00–08:00 and 18:00–21:00 time windows (as shown in the shaded area of Figure 11.), while demand around midday and in the afternoon is relatively uniform. This is mainly because hydrogen fuel cell logistics vehicles typically load and unload in the morning and evening, so their refueling needs concentrate before and after these operations, accounting for 60–70% of the peak demand in those periods. Sanitation trucks refueling masse before their early morning routes—partially overlapping the logistics vehicle peaks—further drives the morning and evening station demand peaks. In contrast, refueling demand from buses and emergency vehicles is evenly distributed throughout the day, with no pronounced peaks.
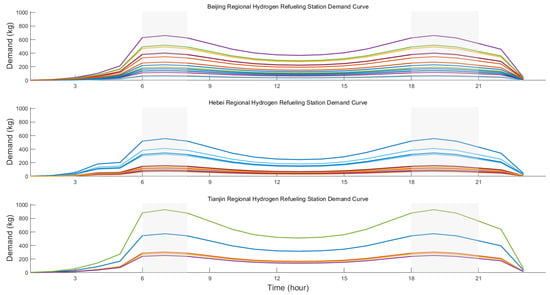
Figure 11.
Daily hydrogen demand curves for the 38 refueling stations.
A comparison of the demand fluctuation trends at refueling stations across Beijing, Tianjin, and Hebei shows the following:
Tianjin, as a major port and logistics hub, experiences intensive logistics activity concentrated around the Binhai New Area industrial parks and port environs. Its stations primarily serve logistics trucks, so the hydrogen demand curve is most heavily influenced by these vehicles, exhibiting pronounced peak–valley fluctuations. Beijing has a dense mix of logistics, public transit, and service vehicles. The refueling demands of logistics trucks, sanitation trucks, and buses partially overlap, further amplifying the morning and evening peaks. Hebei Province’s stations presently serve mainly buses, resulting in a relatively smooth hydrogen demand curve with less pronounced fluctuations.
5.4. Optimization Results for Hydrogen Pipeline Network Configuration and Transportation
By comparing the hydrogen production curves of the hydrogen plants with the daily hydrogen demand curves of the refueling stations, it is clear that there is a spatial and temporal mismatch between supply and demand within the study area. Spatially, high-demand stations are concentrated in Beijing and Tianjin, whereas the bulk of hydrogen supply is located in Hebei. Temporally, demand peaks occur during the morning and evening rush hours, while production peaks fall around midday and in the afternoon. To resolve these spatiotemporal imbalances, hydrogen is routed via pipelines from resource-rich areas to demand centers, and the network is used to dynamically align the supply and demand curves—smoothing out production fluctuations and meeting refueling peaks and troughs. Below is an analysis of the optimized pipeline configuration and transportation scheduling between selected hydrogen plants and refueling stations in the BTH region.
5.4.1. Constraints
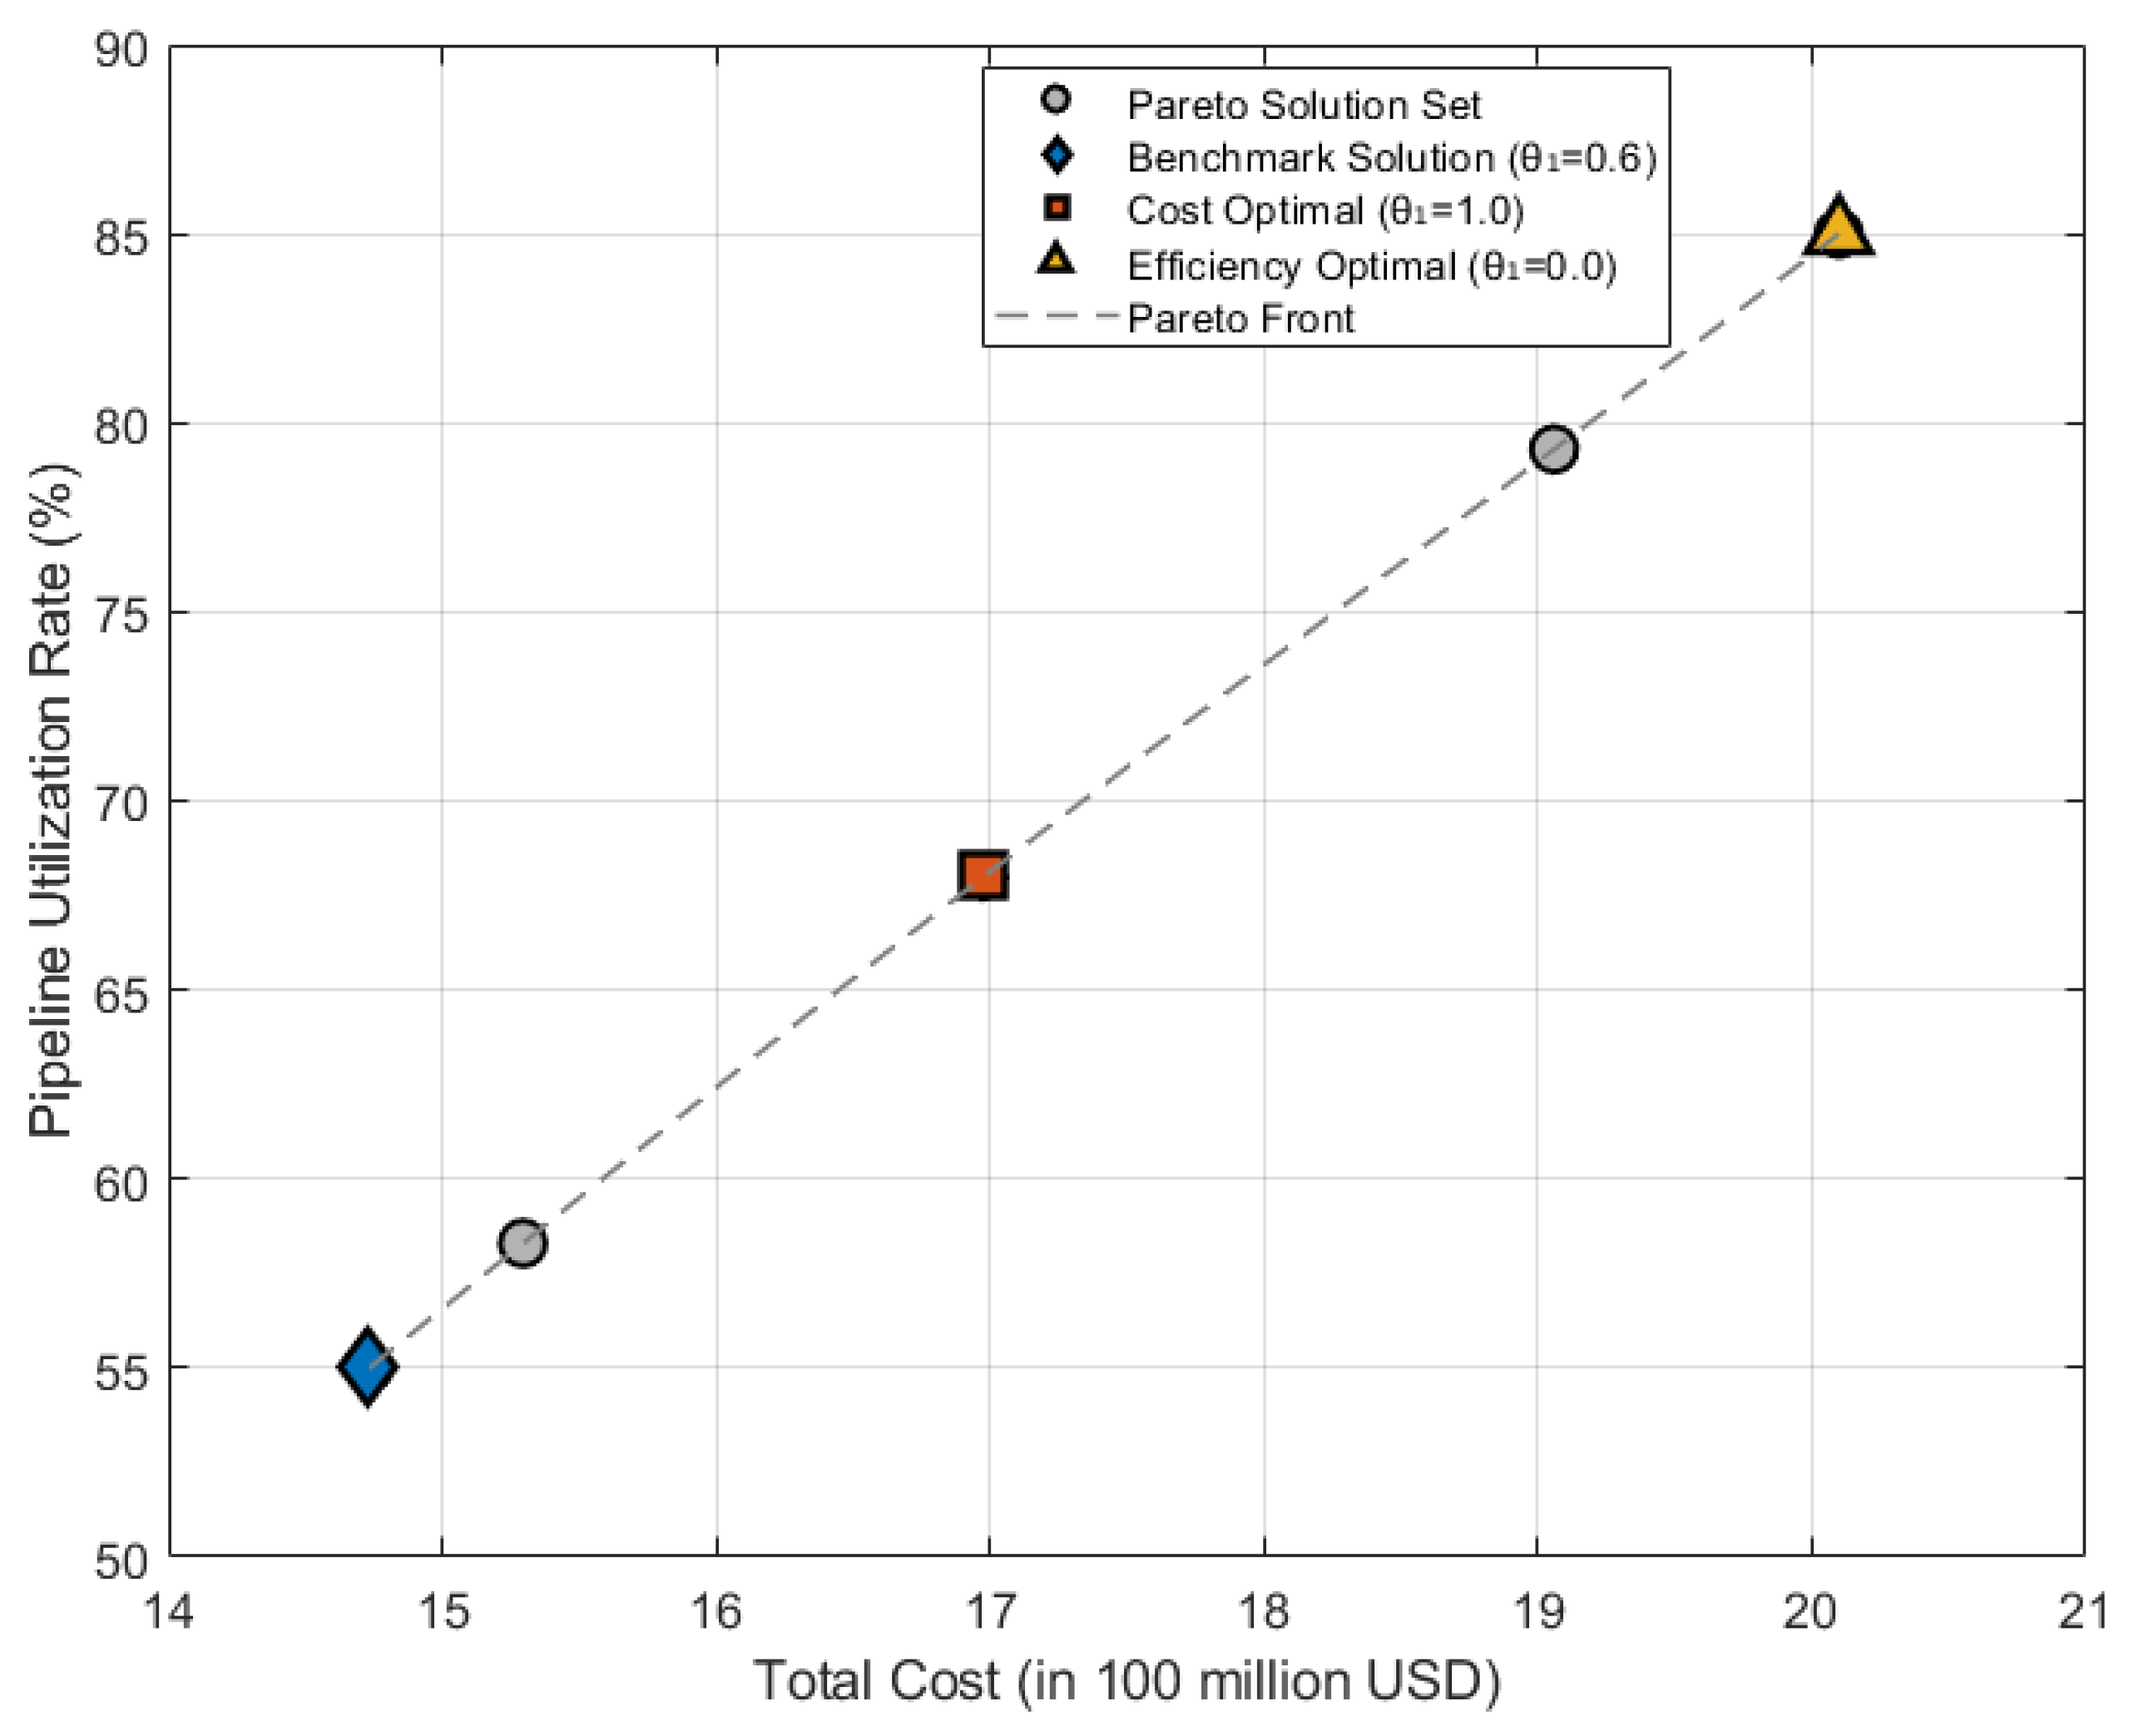
By sweeping the weight parameter combination—letting θ1 vary from 0 to 1 in increments of 0.1—and solving the model with MATLABR2024a calling the CPLEX12.10.0 solver at each step, we observe that total cost and pipeline utilization are negatively correlated. The resulting Pareto frontier (Figure 12) exhibits a smooth transition from the upper-left region (high cost, high utilization) to the lower-right region (low cost, low utilization). Moreover, for each 0.1 increase in θ1, total cost decreases by approximately 6%, while pipeline utilization falls by roughly 5%.
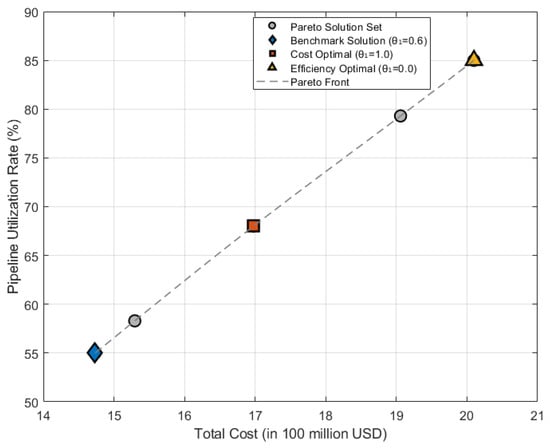
Figure 12.
Pareto frontier illustrating the trade-off between total system cost and pipeline utilization rate.
When θ1 increases from 0.5 to 0.7, the reductions in cost and in utilization decline at nearly a linear ratio; however, once θ1 exceeds 0.7, the rate of cost reduction tapers off while utilization drops more sharply. Thus, θ1 = 0.6 marks the marginal benefit inflection point—further increasing the cost weight would lead to a significant deterioration in utilization. Consequently, we select θ1 = 0.6 as the balanced solution and extract three representative solutions—cost-optimal, efficiency-optimal, and balanced—for comparison of their key metrics, as shown in Table 6.

Table 6.
Comparison of representative solution schemes.
The pipeline network topology under the baseline scenario is shown in Figure 13. Hydrogen is supplied from 13 production plants to 38 refueling stations via 43 pipelines, connecting the clusters of hydrogen plants in Zhangjiakou, Chengde, and other areas of Hebei with the demand centers in Beijing and Tianjin. Due to the high upfront cost of pipeline construction, the total system cost amounts to RMB 12.088 billion, with an overall pipeline utilization rate of 68%. The network transports 50,767 tons of hydrogen per year. The supply relationships between the hydrogen plants and refueling stations are listed in Table 7.
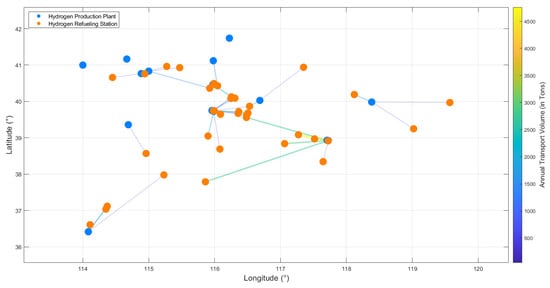
Figure 13.
Pipeline network topology and annual transport volume between hydrogen production plants and refueling stations.

Table 7.
Supply relationship between hydrogen production plants and refueling stations.
Based on the analysis of Figure 13 and Table 7, the hydrogen transport pattern in the BTH region can combine both local and cross-regional supply through pipeline transportation. For local supply, Hydrogen Production Plants No. 6 and No. 7 in Tianjin primarily serve local refueling stations, with an annual hydrogen transport volume of 15,040 tons. Hydrogen Production Plants No. 9 and No. 12 in Hebei prioritize supplying refueling stations in areas such as Zhangjiakou and Xingtai, with station numbers 22–26, to reduce pipeline transportation costs, and their annual hydrogen transport volume is 5424 tons. In terms of cross-provincial hydrogen transportation, a hydrogen supply network is being built through pipeline infrastructure to balance the spatial distribution of hydrogen supply and demand in the BTH region. For example, Hydrogen Production Plant No. 1 in Beijing will supply hydrogen to Refueling Station No. 20 in Tianjin via pipeline; Hydrogen Production Plant No. 8 in Hebei will supply hydrogen to Refueling Stations No. 4 and No. 13 in Beijing, and Refueling Station No. 21 in Tianjin, forming regional coordination.
Based on an analysis of pipeline transportation distances, the current pipeline network in the BTH region is dominated by short-distance transport. Transport distances of less than 50 km account for approximately 40%, primarily serving local chemical supply. For example, Industrial By-product Hydrogen Production Plant No. 6 in Tianjin supplies seven local refueling stations via five short-distance pipelines, with an annual throughput of 12,500 t and a pipeline utilization rate of 82%. Medium-distance pipeline transport (50–200 km) follows, representing about 35%, while long-distance transport (over 200 km) remains underdeveloped, currently accounting for roughly 25%. Although long-distance pipelines entail high initial capital investment, they offer lower long-term operating costs. For instance, Wind-Powered Hydrogen Production Plant No. 9 in Chengde (Hebei) delivers hydrogen via three long-distance pipelines to Hydrogen Production Plant No. 13 in Beijing and Refueling Station No. 21 in Tianjin. Table 8 presents selected pipeline transportation distances.

Table 8.
Transport distances along sections of the pipeline network.
5.4.2. Hourly-Scale Transportation Scheme for Hydrogen Pipeline Networks
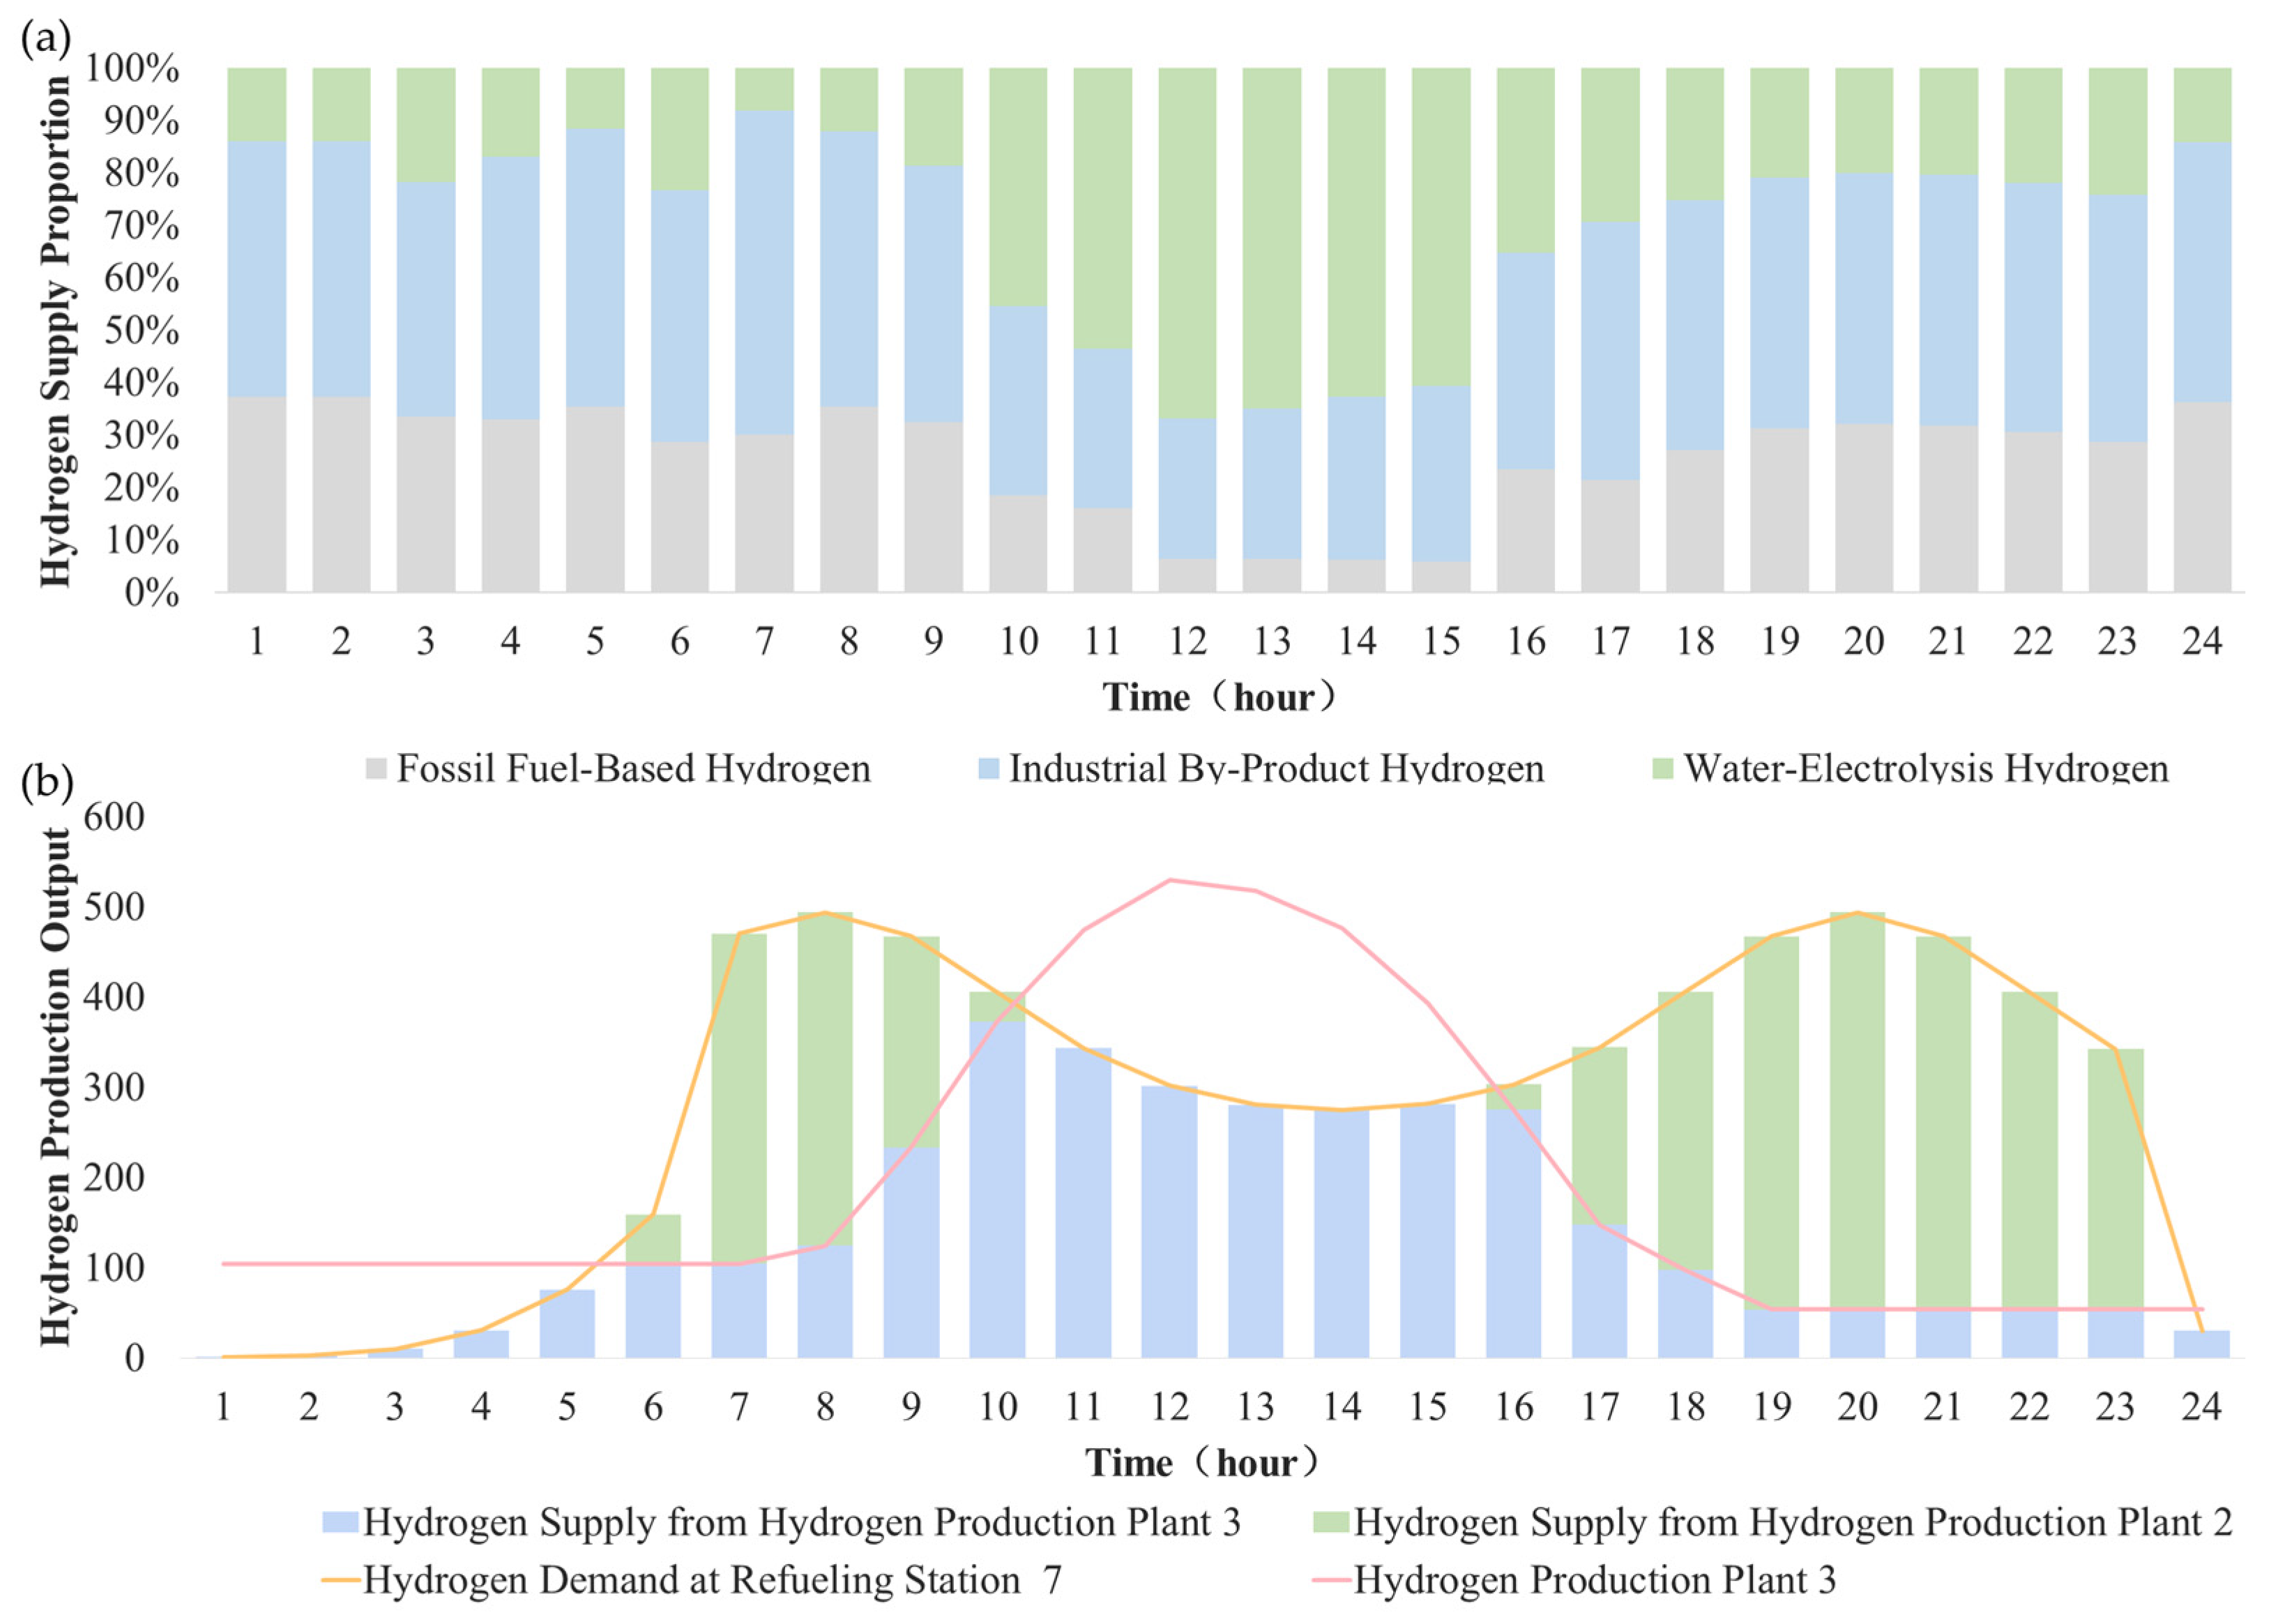
At the system level, the contribution of different hydrogen production pathways was further analyzed to clarify their respective roles in the daily supply structure. The results indicate that by-product hydrogen accounts for approximately 63% of total daily hydrogen supply, serving as a stable base load source. Electrolysis contributes around 20%, with its share peaking at up to 65% during midday when renewable output is high, while fossil-based hydrogen accounts for about 17%, functioning as a supplementary source during renewable shortfalls. Overall, industrial by-product hydrogen currently represents the largest portion of hydrogen supply; however, green hydrogen, as a key pathway for energy transition, demonstrates significant development potential and an increasingly important role in the regional hydrogen system.
As illustrated in Figure 14a, the overall hydrogen supply mix remains relatively stable for both fossil-fuel-based and industrial by-product-based production routes. During periods of peak wind and solar generation (10:00–15:00), water electrolysis output accounts for approximately 65% of total pipeline throughput. Conversely, in the early morning and nighttime hours—when renewable output is insufficient—electrolytic hydrogen production must rely on energy storage systems and grid-sourced electricity, resulting in lower yields. Under these conditions, refueling stations predominantly draw on fossil-fuel-derived hydrogen and industrial by-product hydrogen to meet demand shortfalls.
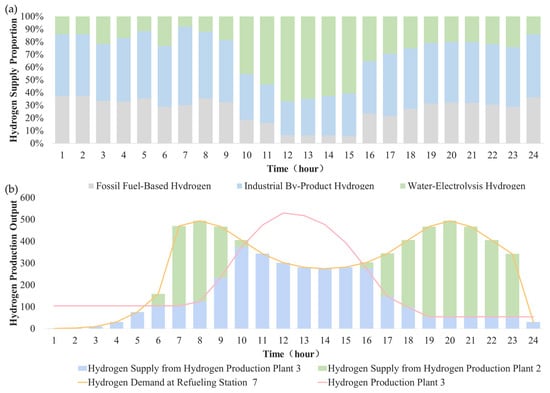
Figure 14.
(a) Distribution of hydrogen transport volumes by production method. (b) Hydrogen demand and supply situation at Hydrogen Refueling Station No. 7.
From the perspective of the refueling station’s demand satisfaction, because hydrogen supply and demand are mismatched in time—and, coupled with spatial distance differences—it is difficult for any single hydrogen production plant to fully meet the station’s needs during certain periods. Therefore, the pipeline network transport scheme is dynamically adjusted. Taking Refueling Station No. 7 as an example, the optimization results show that Station 7 will establish pipeline connections with Hydrogen Production Plants No. 2 and No. 3 to satisfy its hydrogen requirements. Plant No. 3 is a photovoltaic water electrolysis hydrogen plant and is the closest to Station 7. Based on the objectives of minimum cost and maximum pipeline utilization, hydrogen is preferentially transported from Plant No. 3 to Station 7. As shown in Figure 14b, during Plant No. 3’s production peak period (11:00–15:00), Station 7’s demand is entirely met by photovoltaic hydrogen production from Plant 3; however, during the station’s morning and evening demand peaks (7:00–9:00 and after 18:00), when photovoltaic electrolysis output is at a low ebb and cannot fully satisfy Station 7’s needs, hydrogen is transported from Plant No. 2 (a fossil-fuel-based hydrogen plant) to meet the shortfall.
5.4.3. Sensitivity Analysis
To further validate the model’s reliability, this section conducts a sensitivity analysis of the hydrogen pipeline network configuration and transportation optimization model for the BTH region from two perspectives: pipeline construction cost and the proportion of green hydrogen supply. The sensitivity analysis conducted in this section adopts a similar methodological approach to [51], and the resulting trends in key parameters show high consistency with their findings.
- (1)
- Impact of pipeline construction cost
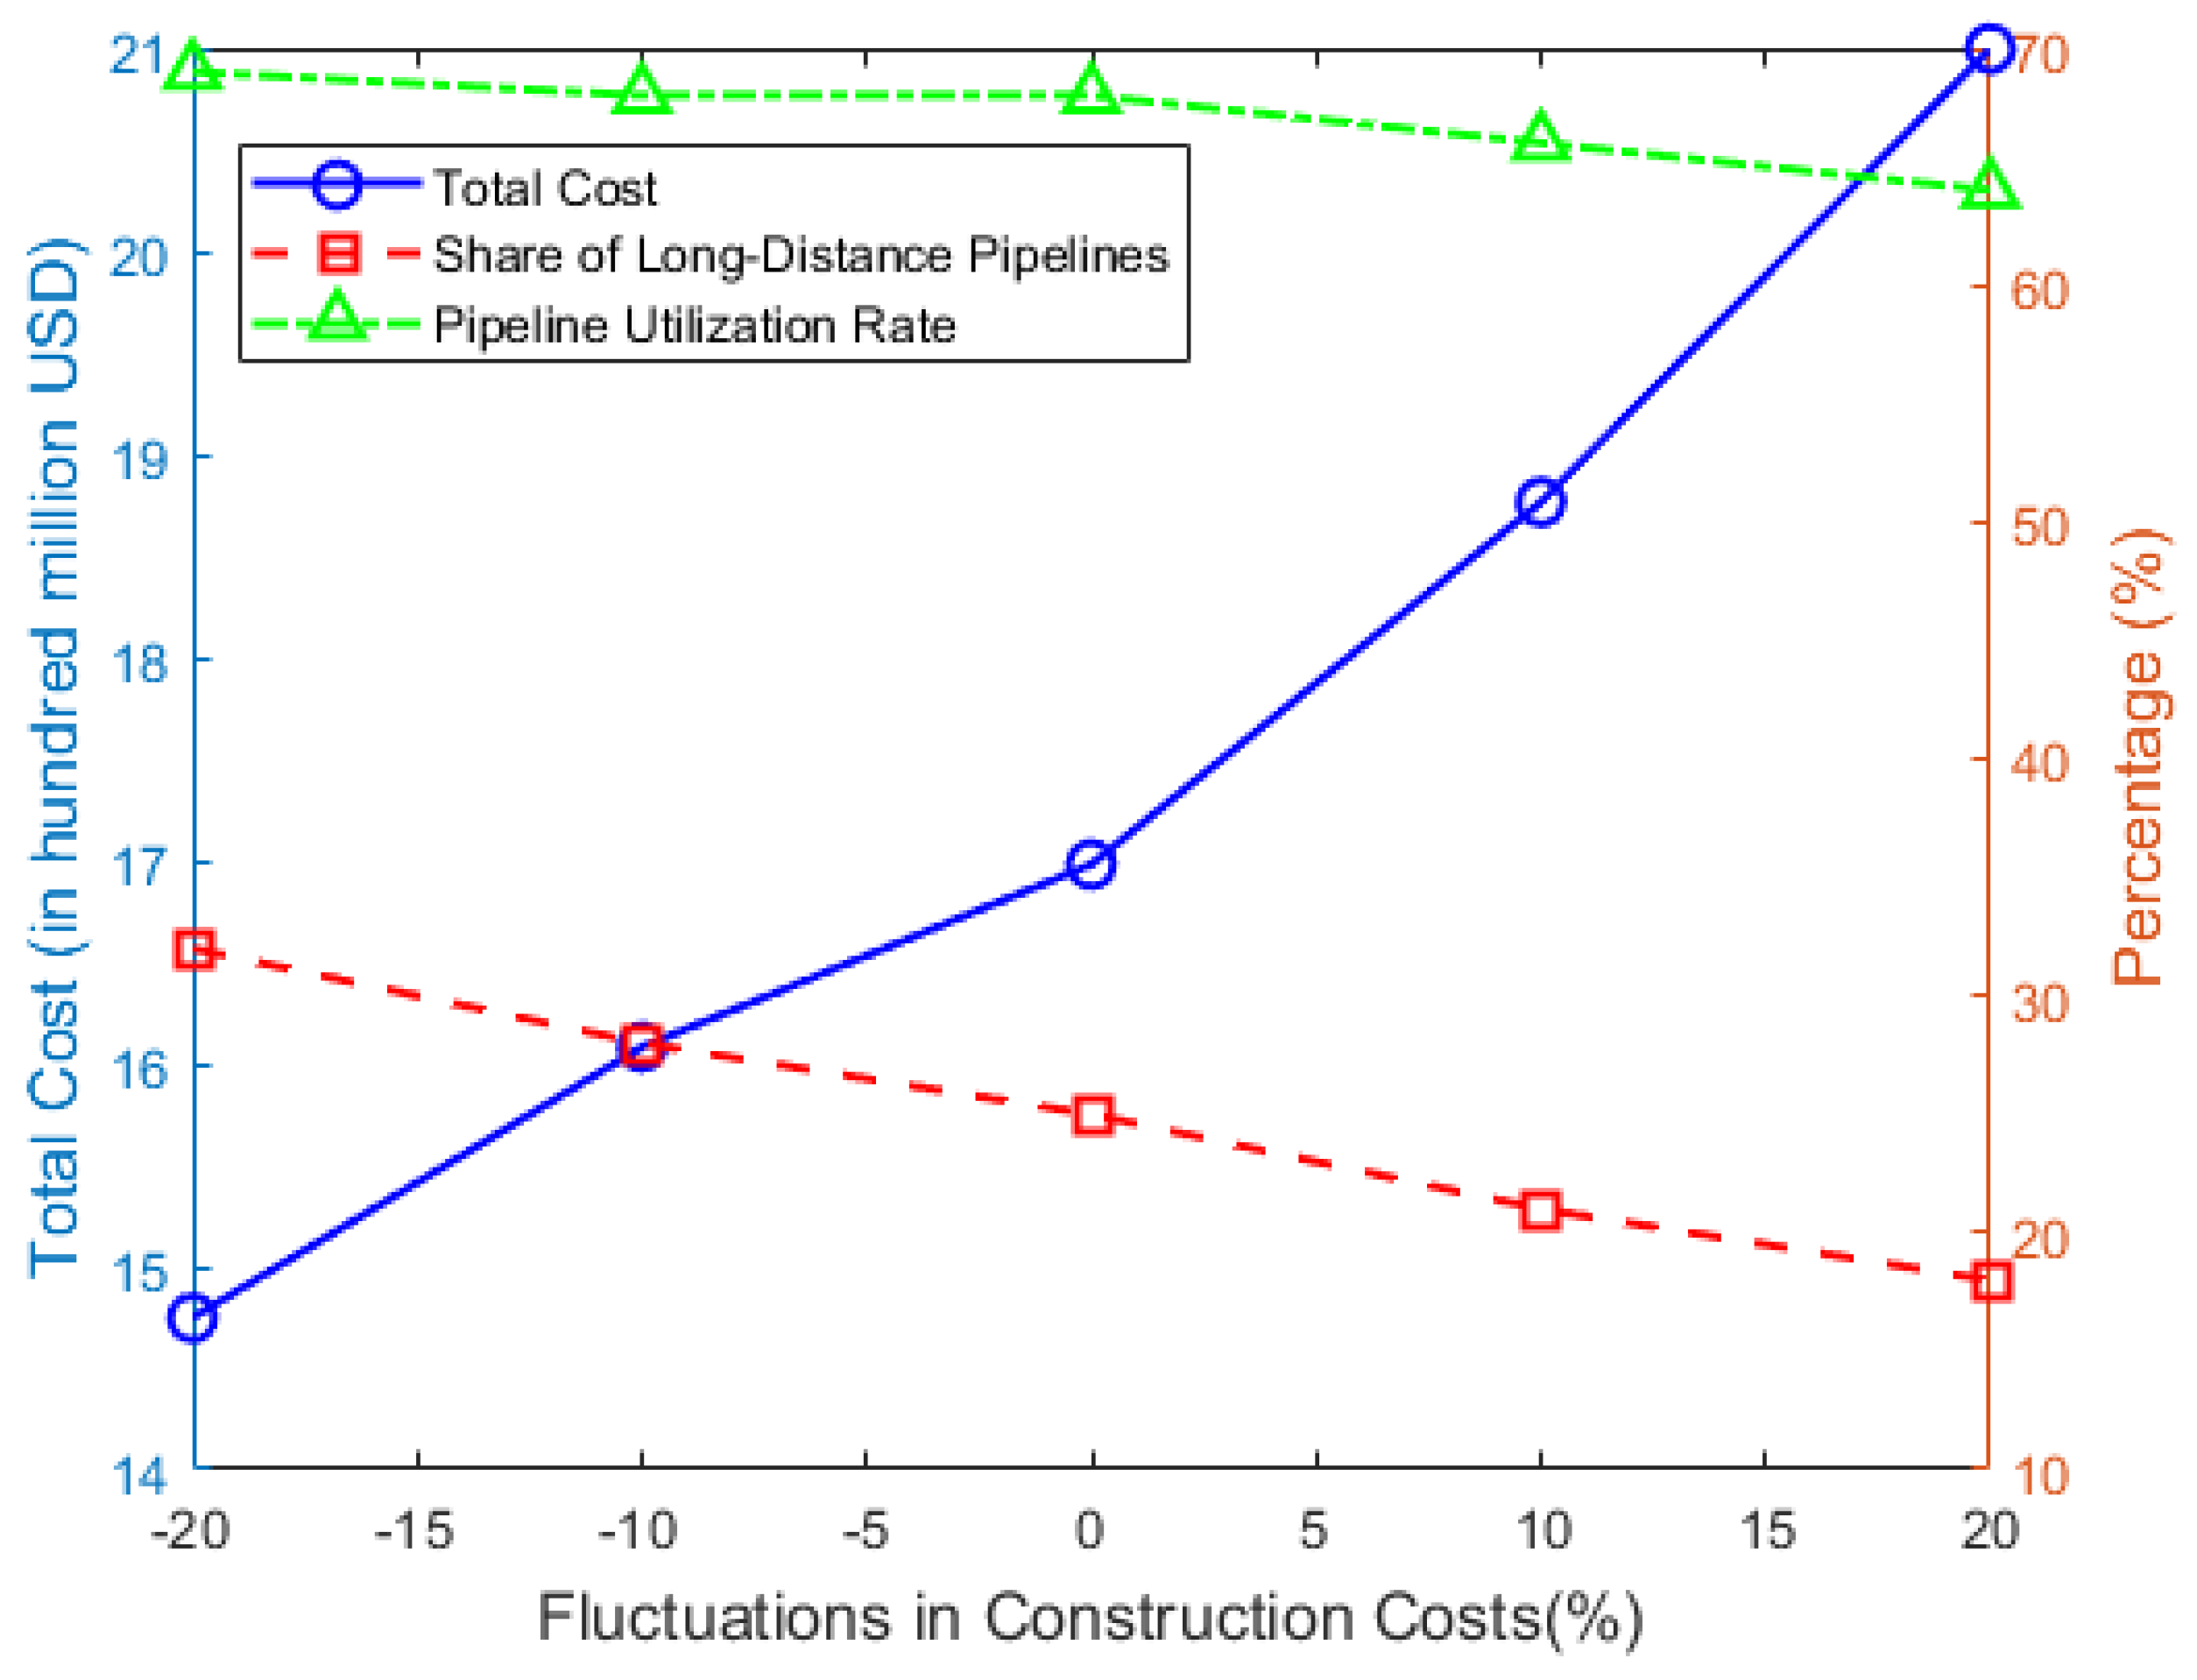
The current cost of constructing hydrogen pipelines is a critical factor affecting subsequent network configuration and transportation decisions. To investigate its specific effect on the model’s optimization results, we adjust the baseline data so that pipeline construction costs vary by ±10% and ±20%, respectively. The comparison of the resulting optimization outcomes is shown in Figure 15.
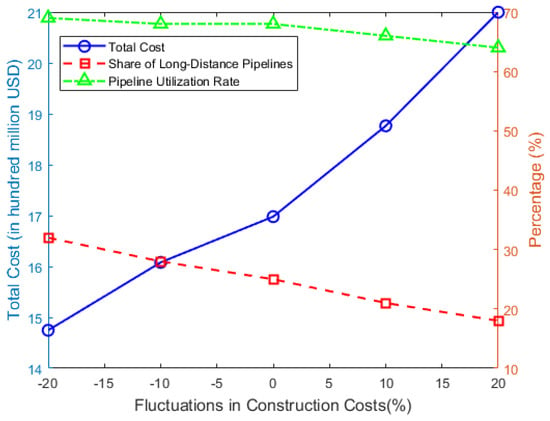
Figure 15.
Impact of construction cost fluctuations on total cost, the proportion of long-distance pipelines, and utilization rate.
Figure 15 shows the impact of fluctuations in unit construction cost on total cost, the share of long-distance pipelines, and utilization rate. As the cost of building hydrogen pipelines rises, the total cost of the hydrogen network also increases. At the same time, long-distance pipelines—whose costs are more sensitive to increases—make up a smaller share of the network, while changes in utilization rate remain relatively modest. Dispatch optimization can partially offset the adverse effects of higher costs, but overall utilization still declines. The chart reveals a clear substitution effect: a 20% rise in construction cost prompts a “many-short-pipes” layout—long-distance links shrink by 28%, overall cost still grows 24%, and utilization stalls at roughly 65%. In contrast, a 20% cost reduction extends the economic reach of pipelines; long-distance share climbs to 32%. Demand ceiling effects, however, erode the benefit: total cost falls only 13% and utilization edges up 1.5% above baseline, illustrating diminishing marginal returns to cheaper transmission capacity.
- (2)
- Impact of Green Hydrogen Supply Ratio
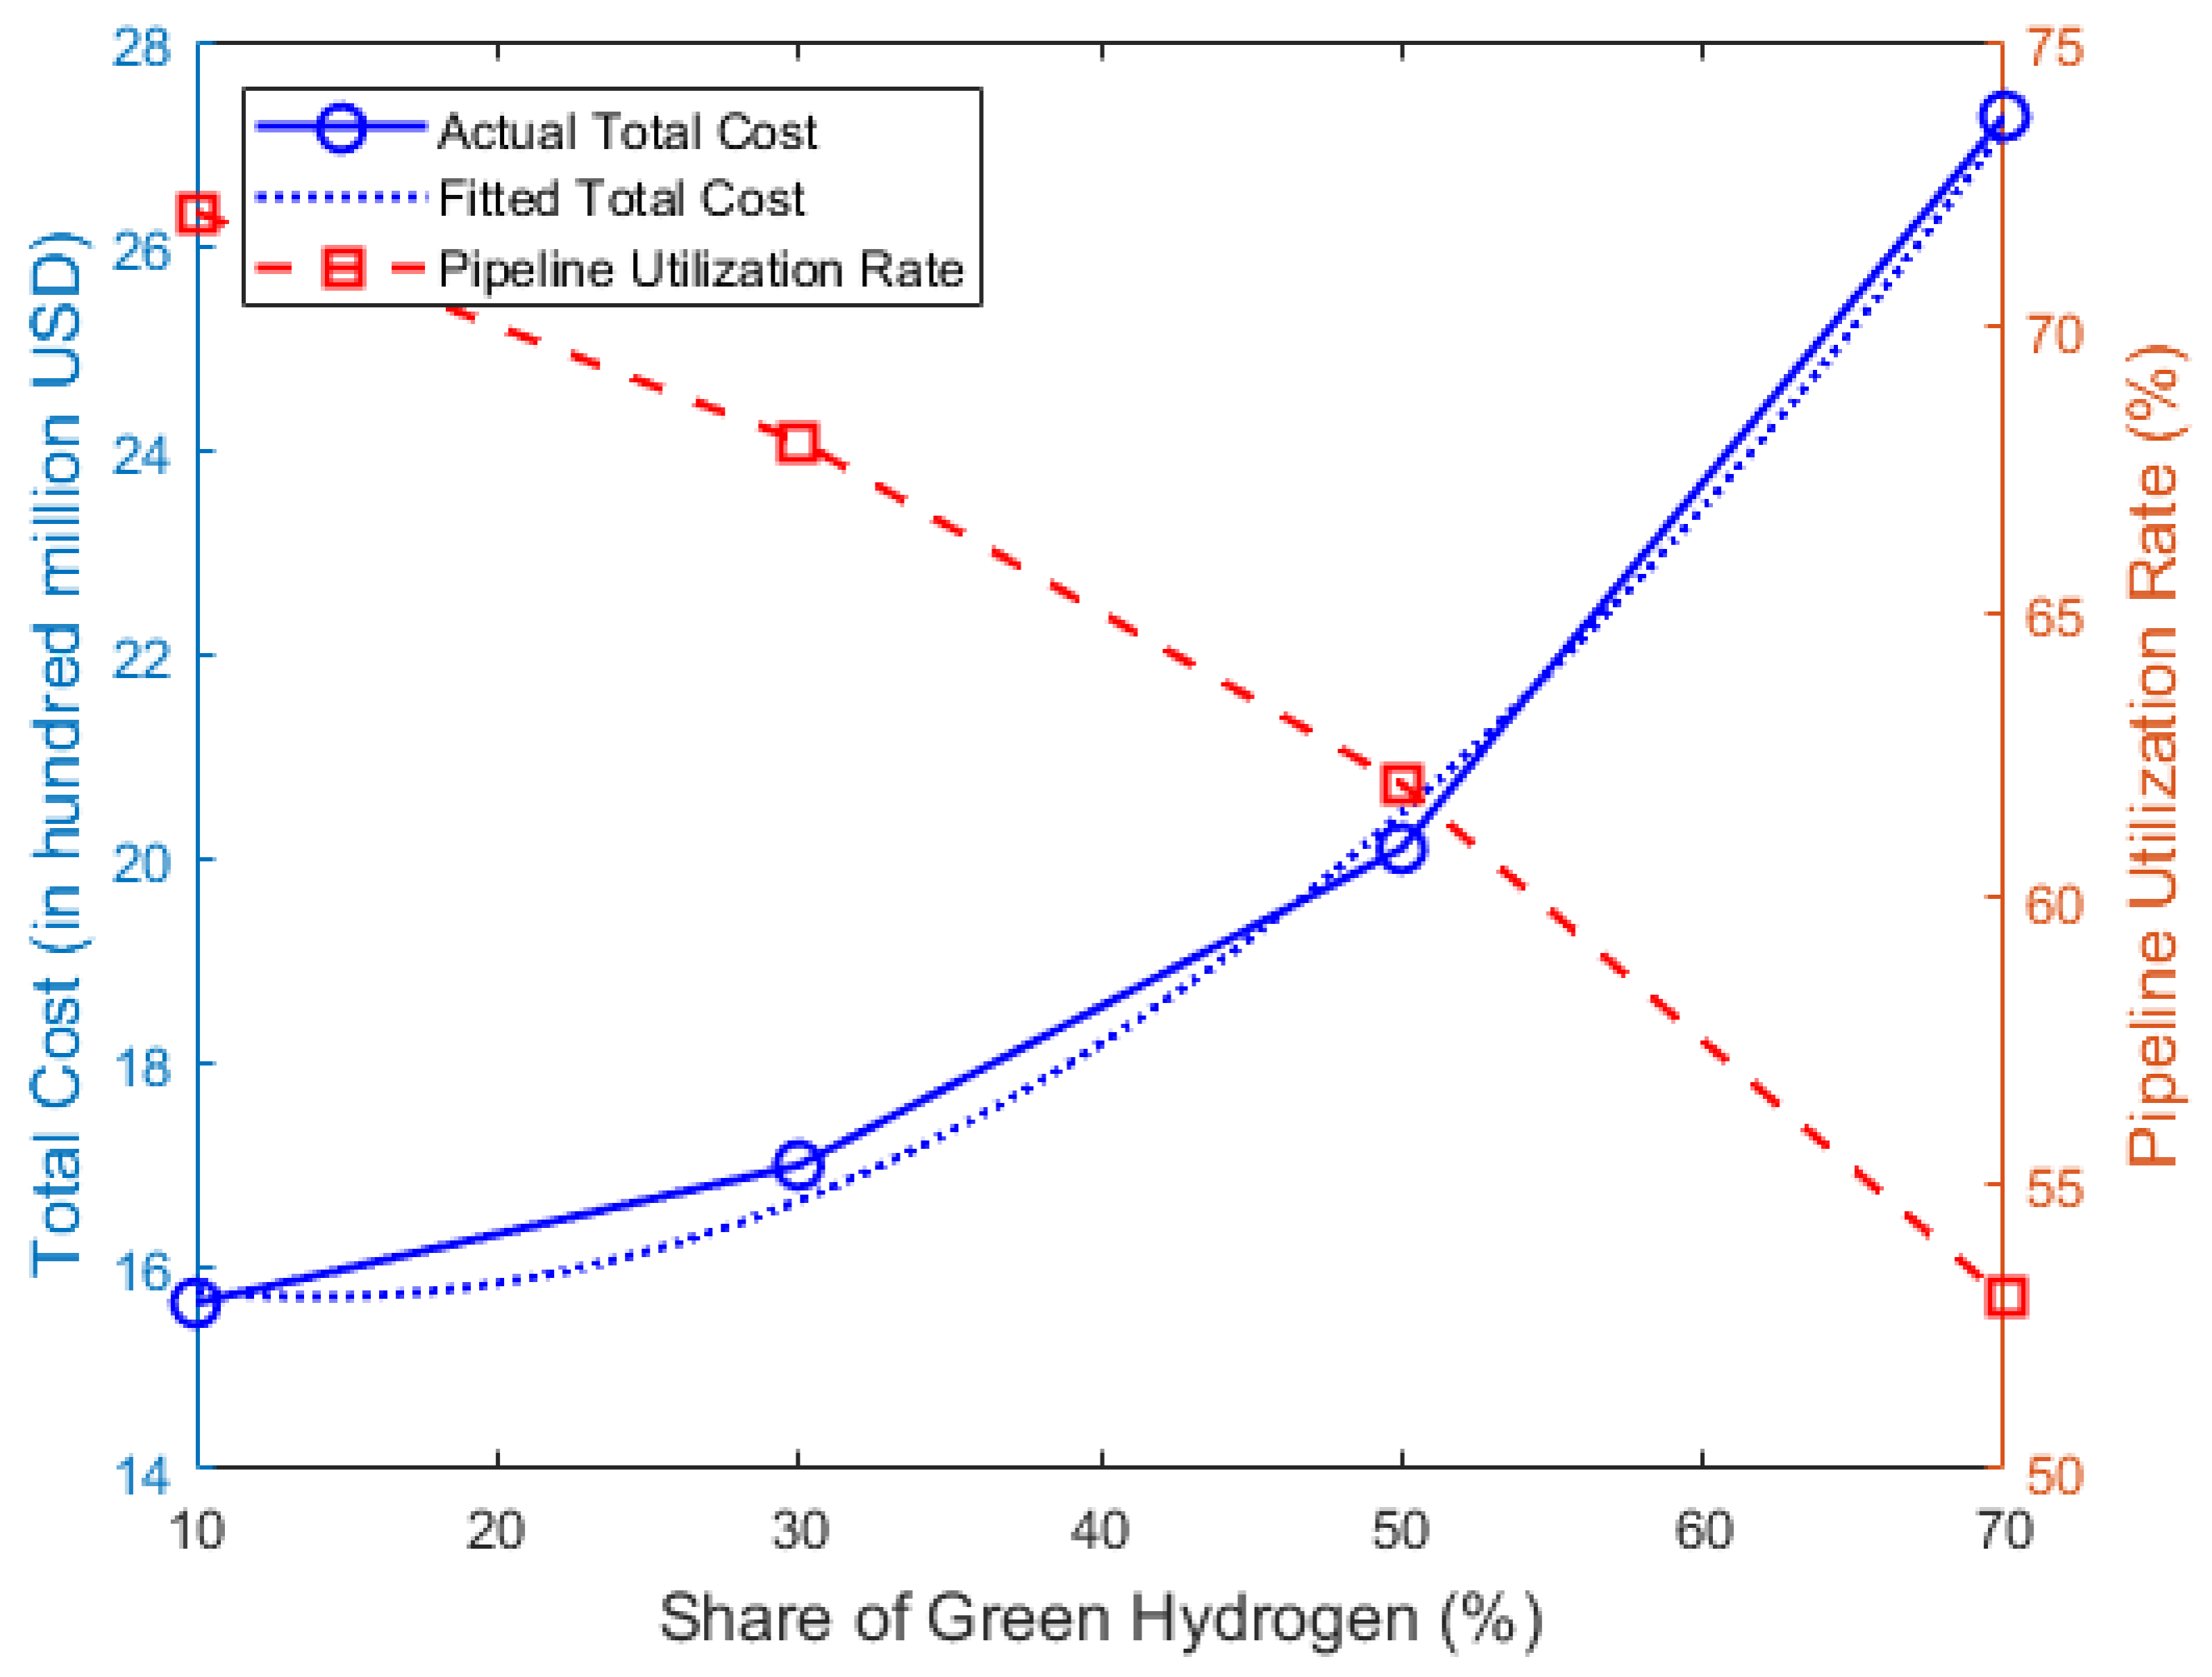
To enhance the model’s environmental performance, the green hydrogen supply ratio is varied. The range of this ratio is expanded from 10% to 70% in order to comprehensively assess its multidimensional effects on the hydrogen pipeline network. The specific results are shown in Table 9.

Table 9.
Results of Sensitivity Analysis on the Green Hydrogen Supply Ratio.
Figure 16 shows the relationship between the share of green hydrogen and the total cost. From the above charts, we can see that when the green hydrogen supply ratio is set low (10–30%), hydrogen refueling demand is met primarily by fossil-fuel-based and industrial by-product hydrogen, with pipeline construction focused on short-distance transport and localized supply, resulting in relatively low total network cost. When the ratio is raised to a medium-high level (50–70%), inter-regional pipelines must be built to transport green hydrogen, and supporting energy storage facilities are required to balance supply–demand fluctuations. As the green hydrogen share increases, priority is given to transporting green hydrogen from renewable energy hydrogen plants to meet refueling demand. Because these plants tend to be located farther away, inter-regional long-distance pipeline construction rises, driving up total network cost—though this can be offset through appropriate subsidy policies. At the same time, the variability and intermittency of renewable energy introduce greater fluctuation in the hydrogen production profile, exacerbating supply–demand mismatches on an hourly scale; this makes real-time balancing more challenging and causes pipeline utilization rates to decline.
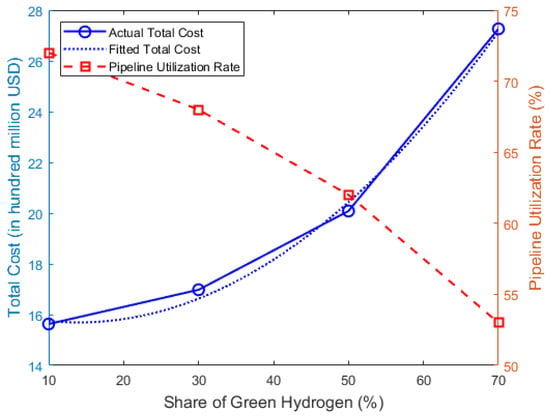
Figure 16.
Impact of green hydrogen supply ratio on total cost and carbon emissions.
5.5. Model Validation and Reliability Assessment
To verify the solvability and reliability of the proposed model, a systematic evaluation of the bi-objective mixed-integer linear programming (MILP) framework was conducted.
First, in terms of logical consistency, the model was tested over a full-year (8760 h) simulation using the IBM CPLEX12.10.0 optimizer. All runs successfully converged to optimal solutions without infeasibility or divergence, demonstrating the model’s structural completeness and computational stability.
Second, regarding result validity, the simulated hourly hydrogen flow showed a strong correlation (R = 0.83) with wind–solar generation output, and electrolytic hydrogen accounted for approximately 65% of total transport during renewable energy peaks (10:00–15:00), consistent with actual operational patterns. Moreover, the Pareto frontier generated by the model exhibited a smooth, monotonic decreasing trend, clearly illustrating the trade-off between total cost and pipeline utilization. These characteristics align well with findings reported in relevant literature [46,47], further confirming the robustness and credibility of the proposed framework.
6. Conclusions
This study established a spatiotemporal coupling and pipeline optimization model for the hydrogen supply chain in the BTH region, involving 16 hydrogen production plants and 38 refueling stations. By integrating wind–solar resource-to-hydrogen production curves with vehicle demand-to-station temporal curves, an hourly closed-loop simulation was achieved, revealing the spatial and temporal dynamics of regional hydrogen supply and demand.
The results indicate a significant spatiotemporal mismatch between production and consumption. Hydrogen supply is concentrated in Hebei (green hydrogen share ≈ 88%), while demand centers are located in Beijing and Tianjin. Renewable-based electrolysis peaks at 10:00–15:00, whereas hydrogen demand peaks at 6:00–8:00 and 18:00–21:00.
Comparative analysis of off-grid/on-grid electrolysis, fossil-based, and by-product hydrogen production demonstrated the complementarity between fluctuating green hydrogen and stable gray hydrogen, supporting a “stable base load + fluctuating green supply” strategy to enhance overall reliability.
Under the balanced scheme (θ1 = 0.6), the optimized network includes 13 production plants, 38 stations, and 43 pipelines, with a total cost of 1.7 billion USD, utilization of 68%, and annual transport of 50,767 t H2.
Sensitivity analysis shows that a 20% increase in pipeline cost reduces long-distance links by 28%, while utilization remains near 65%. Increasing the green hydrogen share from 10% to 70% lowers carbon emissions from 14.2 to 5.1 Mt yr−1 but raises total cost to 2.72 billion USD. The findings highlight that large-scale green hydrogen deployment requires long-distance pipelines, energy storage integration, and policy incentives to balance economic and environmental performance.
To enhance the practical applicability of the proposed model, future research can be extended in three directions.
First, policy incentive mechanisms such as subsidies, carbon taxes, or green certificate revenues can be integrated into the objective function to assess economic optima under different policy scenarios.
Second, energy storage constraints can be incorporated to capture the dynamic role of hydrogen storage systems in peak shaving and energy balancing.
Third, dynamic market mechanisms—including time-varying electricity prices, hydrogen costs, and carbon prices—can be embedded to represent realistic market conditions.
These extensions will make the model more aligned with real-world decision-making processes and provide quantitative insights for policymakers when designing hydrogen infrastructure strategies and incentive schemes.
Author Contributions
Methodology, X.L. and Y.L. (Yinliang Liu); investigation, S.D.; data curation, L.Y. (Lvzerui Yuan); writing—original draft, L.Y. (Lei Yu) and X.W.; writing—review and editing, Q.L. and L.Y. (Lei Yu); visualization, Q.L. and Y.L. (Yiyong Lei); supervision, Q.L. All authors have read and agreed to the published version of the manuscript.
Funding
This work was funded by the Science and Technology Project of China Southern Power Grid (ZBKJXM20240021).
Data Availability Statement
The original contributions presented in the study are included in the article; further inquiries can be directed to the corresponding author.
Conflicts of Interest
Authors Lei Yu, Xinhao Lin, Yinliang Liu, Shuyin Duan, Lvzerui Yuan, Xueyan Wu and Qingwei Li were employed by the company CSG Electric Power Research Institute Co., Ltd. Author Yiyong Lei was employed by the company China Southern Power Grid Co., Ltd. The authors declare that this study received funding from China Southern Power Grid. The funder was not involved in the study design, collection, analysis, interpretation of data, the writing of this article, or the decision to submit it for publication. The authors declare no conflicts of interest.
Appendix A
- (1)
- Model Construction
Assume that the raw data series for the stock of hydrogen fuel cell vehicles is
In the formula, denotes the original data value at time point t, namely the stock of hydrogen fuel cell vehicles at time t. Next, we introduce a first-order weakening operator into the original data series to dampen randomness, by defining.
According to the formula, construct the first-order accumulated generating sequence to smooth out the random fluctuations in the original data and highlight its trend. By cumulative generation, an originally irregular data series is transformed into a more regular sequence that approximates exponential growth, thereby making it easier to build a grey model for prediction.
Construct a differential equation for the accumulated sequence established above to describe its rate of change over time, where a controls the growth rate and b represents external excitation.
Its discrete (difference) form is:
The predicted value for the hydrogen fuel cell vehicle at k + 1 is:
- (2)
- GM(1,1) Model Accuracy Test
Evaluating the accuracy of the GM(1,1) model is a crucial step in gray prediction research. The post-fitting residual ratio and the small error probability are commonly used accuracy test indicators. Both provide important feedback on the quality of the model and help in determining its reliability and applicability.
The post-fitting residual ratio is an important indicator used to assess the model’s fitting effect. It reflects the degree of deviation between the model’s predicted values and the actual observed values. Generally, the smaller the value, the better the model’s fitting effect, meaning the model can more accurately predict the variation trend of the actual data. The post-fitting residual ratio is the ratio of the residual variance S2 to the variance S1 of the original data sequence.
The small error probability is another metric used to evaluate the model’s accuracy, typically for testing the randomness of the residual sequence. In the GM(1,1) model, the residual sequence should behave as a random sequence, meaning it should not exhibit any significant patterns or trends. The small error probability can be calculated using statistical methods, and it represents the degree of difference between the observed residual sequence and a random sequence under the assumption that the residual sequence is purely random. Typically, the smaller the value, the less the non-random component in the residual sequence, indicating a better fitting effect of the model. The specific formulas for calculating the residuals and relative residuals are as follows:
Calculate the mean and standard deviation of the residuals:
Subsequently, compute the mean and standard deviation of :
From the above calculations, the posterior error ratio C value and the small error probability p-value are obtained, as expressed in the following formulas:
Here, denotes the i element of the residual sequence, represents the mean of the residual sequence, denotes the i element of the original data sequence, and n is the sample size. The model accuracy levels are presented in Table A1.

Table A1.
Accuracy Test Table of the Grey Prediction GM(1,1) Model.
Table A1.
Accuracy Test Table of the Grey Prediction GM(1,1) Model.
| Posterior Error Ratio C Range | Small Error Probability p Range | Accuracy Grade |
|---|---|---|
| C < 0.35 | p > 0.95 | Excellent |
| 0.35 ≤ C < 0.5 | p > 0.8 | Good |
| C ≥ 0.65 | p ≤ 0.7 | Unqualified |
The posterior error ratio C value and the small error probability p-value are crucial indicators for evaluating the accuracy and reliability of the GM(1,1) model. They provide a comprehensive assessment of both the model’s fitting performance and the randomness of the residual sequence, thereby validating the reliability of the forecasted results for the number of hydrogen fuel cell vehicles. This, in turn, offers an important basis for subsequent predictions of hydrogen refueling station demand.
Appendix B
Basic Assumptions
This study focuses on the configuration and transportation optimization of the hydrogen pipeline network under the consideration of supply–demand matching between hydrogen production plants and hydrogen refueling stations. In order to improve the computational efficiency of the model constructed in this chapter, the following assumptions are made:
- (1)
- The locations of all hydrogen production plants and hydrogen refueling stations are known.
- (2)
- Hydrogen is transported from upstream production plants to downstream refueling stations exclusively through pipelines.
- (3)
- Pipelines are assumed to have a uniform specification and size.
- (4)
- Each hydrogen production plant adopts only one hydrogen production method by default.
- (5)
- The hydrogen produced by each plant is primarily used to meet the demand of hydrogen refueling stations.
- (6)
- The total hydrogen production capacity of all plants is sufficient to satisfy the aggregate demand of all refueling stations.
- (7)
- The length of each hydrogen pipeline is assumed to be the straight line distance between the production plant and the refueling station, without considering environmental or topographical factors.
Description of Parameters and Variables
This subsection provides explanations of the parameters, variables, and sets involved in the model. The specific parameters are presented in the following table.

Table A2.
Parameter Symbols and Their Definitions.
Table A2.
Parameter Symbols and Their Definitions.
| Notation | Description |
|---|---|
| Set of Hydrogen Production Plants, M = {1, 2, 3……, m}, m M | |
| Set of Hydrogen Refueling Stations, N = {1, 2, 3……, n}, n N | |
| Set of Hydrogen Production Methods, I = {1, 2……, i}, I I | |
| Binary decision variable: equals 1 if a hydrogen pipeline is constructed between production plant m and refueling station n; equals 0 otherwise | |
| Total amount of hydrogen supplied from production plant m to refueling station n (kg) | |
| Distance between production plant m and refueling station n (km) | |
| Unit fixed cost of constructing a hydrogen pipeline (CNY/km) | |
| Unit transportation cost of hydrogen pipeline (CNY/km·kg) | |
| Material permeability rate of the pipeline (%) | |
| Operating pressure of the pipeline (MPa) | |
| Transportation time of hydrogen in the pipeline (h) | |
| Unit cost of hydrogen (CNY/kg) | |
| Basic leakage rate of the pipeline (%) | |
| Aging coefficient of the pipeline | |
| Service life of the pipeline (years) | |
| Single leakage amount of the pipeline | |
| Leakage coefficient of the pipeline | |
| Pipeline diameter (mm) | |
| Actual arrival time of hydrogen | |
| Deadline of hydrogen arrival | |
| Delay time in hydrogen transportation | |
| Unit penalty coefficient for violation | |
| Set of time periods | |
| Hydrogen supply of production plant m at time t | |
| Hydrogen production capacity of production plant m at time t | |
| Lower bound of hydrogen transported from production plant m to refueling station n through pipelines | |
| Upper bound of hydrogen transported from production plant m to refueling station n through pipelines | |
| Hydrogen transported from production plant m to refueling station n at time t | |
| Design capacity of the pipeline between production plant m and refueling station n | |
| Hydrogen demand of refueling station n at time t | |
| Minimum proportion of green hydrogen supply | |
| Minimum operating time of the pipeline | |
| Maximum downtime of the pipeline | |
| Binary variable for pipeline startup/shutdown status | |
| State variable of hydrogen pipeline transportation | |
| Objective function weight | |
| Total number of weight combinations |
Appendix C
The detailed information on the geographical locations, production methods, and hydrogen types of the specific hydrogen production plants is presented in the following table.

Table A3.
Hydrogen Production Plants: Locations and Methods.
Table A3.
Hydrogen Production Plants: Locations and Methods.
| Plant ID | Coordinates (Latitude, Longitude) | Production Method | Hydrogen Type | Plant ID | Coordinates (Latitude, Longitude) | Production Method | Hydrogen Type |
|---|---|---|---|---|---|---|---|
| 1 | (115.99, 39.74) | Fossil-fuel-based | Grey hydrogen | 9 | (114.00, 41) | Electrolysis—Wind and PV | Grey hydrogen |
| 2 | (115.96, 39.54) | Fossil-fuel-based | Grey hydrogen | 10 | (114.88, 40.76) | Electrolysis—Wind | Grey hydrogen |
| 3 | (115.98, 39.72) | Electrolysis—PV | Green hydrogen | 11 | (114.66, 41.16) | Electrolysis—Wind and PV | Green hydrogen |
| 4 | (115.97, 40.47) | Electrolysis—Wind and PV | Green hydrogen | 12 | (115.00, 40.83) | Industrial by-product | Green hydrogen |
| 5 | (116.68, 40.02) | Electrolysis—PV | Green hydrogen | 13 | (114.08, 36.41) | Electrolysis—Wind | Green hydrogen |
| 6 | (117.72, 38.92) | Industrial by-product | Grey hydrogen | 14 | (115.98, 41.12) | Industrial by-product | Grey hydrogen |
| 7 | (117.70, 38.93) | Industrial by-product | Grey hydrogen | 15 | (118.38, 39.98) | Electrolysis—Wind | Grey hydrogen |
| 8 | (114.00, 41.00) | Electrolysis—Wind | Green hydrogen | 16 | (116.22, 41.73) | Electrolysis—PV | Green hydrogen |
With the promotion of hydrogen fuel cell vehicles, the number of hydrogen refueling stations in the BTH region, which serves as a demonstration area for hydrogen fuel cell vehicles, has been steadily increasing. Based on the actual construction and development plans, 38 refueling stations are selected as the research objects. The location information of these stations is presented in Table A4.

Table A4.
Hydrogen Refueling Station Location Information.
Table A4.
Hydrogen Refueling Station Location Information.
| Plant ID | Longitude | Latitude | Plant ID | Longitude | Latitude |
|---|---|---|---|---|---|
| 1 | 115.9888 | 40.4922 | 20 | 116.3084 | 40.0905 |
| 2 | 116.0000 | 40.4677 | 21 | 117.2718 | 39.0847 |
| 3 | 115.9251 | 40.3639 | 22 | 114.9400 | 40.7602 |
| 4 | 116.2543 | 40.1252 | 23 | 114.4500 | 40.6600 |
| 5 | 116.2467 | 40.0838 | 24 | 117.6466 | 38.3446 |
| 6 | 116.5305 | 39.8682 | 25 | 115.2724 | 40.9633 |
| 7 | 115.9813 | 39.7435 | 26 | 115.4700 | 40.9300 |
| 8 | 116.3658 | 39.7214 | 27 | 118.1200 | 40.1900 |
| 9 | 116.0888 | 39.6477 | 28 | 119.0200 | 39.2500 |
| 10 | 116.5058 | 39.6792 | 29 | 115.9000 | 39.0500 |
| 11 | 116.4842 | 39.6217 | 30 | 119.5700 | 39.9700 |
| 12 | 116.4830 | 39.5600 | 31 | 117.3500 | 40.9400 |
| 13 | 115.9955 | 40.4739 | 32 | 114.9600 | 38.5700 |
| 14 | 116.3567 | 39.6716 | 33 | 114.3500 | 37.0400 |
| 15 | 115.9950 | 39.7439 | 34 | 114.3700 | 37.1200 |
| 16 | 116.0446 | 40.4323 | 35 | 114.1100 | 36.6100 |
| 17 | 117.0621 | 38.8396 | 36 | 115.8600 | 37.7900 |
| 18 | 117.7238 | 38.9169 | 37 | 116.0800 | 38.6900 |
| 19 | 117.5165 | 38.9706 | 38 | 115.2300 | 37.9800 |
References
- Zhang, G.; Jiang, Z. Overview of hydrogen storage and transportation technology in China. Unconv. Resour. 2023, 3, 291–296. [Google Scholar] [CrossRef]
- National Development and Reform Commission; National Energy Administration. Medium- and Long-Term Plan for the Development of Hydrogen Energy Industry (2021–2035). Energy 2022, 18, 2024. [Google Scholar]
- Zou, C.; Li, J.; Zhang, X.; Jin, X.; Xiong, B.; Yu, H.; Liu, X.; Wang, S.; Li, Y.; Zhang, L.; et al. Industrial status, technological progress, challenges, and prospects of hydrogen energy. Nat. Gas Ind. B 2022, 9, 427–447. [Google Scholar] [CrossRef]
- Yan, X.; Zheng, W.; Wei, Y.; Yan, Z. Current status and economic analysis of green hydrogen energy industry chain. Processes 2024, 12, 315. [Google Scholar] [CrossRef]
- Chang, L.I.U.; Hanchen, L.I.N.; Chenfangda, S.H.I.; Mingyue, H.U. Development status and outlook of hydrogen powered fuel cell vehicle market in China. South. Energy Constr. 2024, 11, 162–171. [Google Scholar]
- Cao, J.W.; Qin, X.F.; Geng, G.; Zhang, W.; Yu, B. Current status and prospects of hydrogen storage and transportation technology. Acta Pet. Sin. (Pet. Process. Sect.) 2021, 37, 1461–1478. [Google Scholar]
- Aminaho, E.N.; Aminaho, N.S.; Aminaho, F. Techno-economic assessments of electrolyzers for hydrogen production. Appl. Energy 2025, 399, 126515. [Google Scholar] [CrossRef]
- Miltner, A.; Wukovits, W.; Pröll, T.; Friedl, A. Renewable hydrogen production: A technical evaluation based on process simulation. J. Clean. Prod. 2010, 18, S51–S62. [Google Scholar] [CrossRef]
- Fereidooni, M.; Mostafaeipour, A.; Kalantar, V.; Goudarzi, H. A comprehensive evaluation of hydrogen production from photovoltaic power station. Renew. Sustain. Energy Rev. 2018, 82, 415–423. [Google Scholar] [CrossRef]
- Jang, D.; Kim, J.; Kim, D.; Han, W.-B.; Kang, S. Techno-economic analysis and Monte Carlo simulation of green hydrogen production technology through various water electrolysis technologies. Energy Convers. Manag. 2022, 258, 115499. [Google Scholar] [CrossRef]
- Yang, B.; Zhang, R.; Shao, Z.; Zhang, C. The economic analysis for hydrogen production cost towards electrolyzer technologies: Current and future competitiveness. Int. J. Hydrogen Energy 2023, 48, 13767–13779. [Google Scholar] [CrossRef]
- Wang, J.; Yang, J.; Feng, Y.; Hua, J.; Chen, Z.; Liao, M.; Zhang, J.; Qin, J. Comparative experimental study of alkaline and proton exchange membrane water electrolysis for green hydrogen production. Appl. Energy 2025, 379, 124936. [Google Scholar] [CrossRef]
- Chen, Y.F. Research on hydrogen production process for fuel cell vehicle based on biogas project. Appl. Chem. Ind. 2022, 51 (Suppl. S2), 247–250. [Google Scholar]
- Yan, P.; Cheng, Y. Design and operational considerations of packed-bed membrane reactor for distributed hydrogen production by methane steam reforming. Int. J. Hydrogen Energy 2022, 47, 36493–36503. [Google Scholar] [CrossRef]
- Wang, X.; Du, X.; Liu, Y. Simulation of solar driven chemical looping steam methane reformingsystem for co-production of hydrogen and methanol. China Sci. 2019, 14, 403–409. [Google Scholar]
- Peng, X.; Jin, Q. Molecular simulation of methane steam reforming reaction for hydrogen production. Int. J. Hydrogen Energy 2022, 47, 7569–7585. [Google Scholar] [CrossRef]
- Zeng, L.; He, F.; Li, F.; Fan, L.-S. Coal-direct chemical looping gasification for hydrogen production: Reactor modeling and process simulation. Energy Fuels 2012, 26, 3680–3690. [Google Scholar] [CrossRef]
- Yuan, Y.; Zhou, Y.; Lin, Z.; Jin, K. Prediction of PEV adoption with agent-based parameterized bass network diffusion model. arXiv 2023, arXiv:2303.15313. [Google Scholar] [CrossRef]
- Noori, M.; Tatari, O. Development of an agent-based model for regional market penetration projections of electric vehicles in the United States. Energy 2016, 96, 215–230. [Google Scholar] [CrossRef]
- Gately, J.; Dargay, D. Incomes Effect on Car and Vehicle Ownership. Transp. Res. Part A Policy Pract. 1999, 33, 101–138. [Google Scholar]
- Hymans, S.H.; Ackley, G.; Juster, F.T. Consumer durable spending: Explanation and prediction. Brook. Pap. Econ. Act. 1970, 1970, 173–206. [Google Scholar] [CrossRef]
- Guo, X.; Li, W.; Ren, D.; Chu, J. Prospects for the development of hydrogen fuel cell vehicles in China. Renew. Energy 2025, 240, 122231. [Google Scholar] [CrossRef]
- İnci, M. Future vision of hydrogen fuel cells: A statistical review and research on applications, socio-economic impacts and forecasting prospects. Sustain. Energy Technol. Assess. 2022, 53, 102739. [Google Scholar] [CrossRef]
- Zhou, Z.; Miao, S.; Yuan, T. Prediction of hydrogen demand in transportation field based on system dynamics. Electr. Power Autom. Equip 2024, 44, 33–39. [Google Scholar]
- Peng, S.; Sun, C.; Tuo, J.; Yuan, T. Medium and Long-Term Hydrogen Load Forecast for Unified Energy System. Electr. Power 2022, 55, 84. [Google Scholar]
- Zhang, H.; Yuan, T.; Tan, J. Medium and long-term forecast of hydrogen load in unified energy system. Proc. CSEE 2021, 41, 3364–3372. [Google Scholar]
- Muratori, M.; Bush, B.; Hunter, C.; Melaina, M.W. Modeling hydrogen refueling infrastructure to support passenger vehicles. Energies 2018, 11, 1171. [Google Scholar] [CrossRef]
- Grüger, F.; Hoch, O.; Hartmann, J.; Robinius, M.; Stolten, D. Optimized electrolyzer operation: Employing forecasts of wind energy availability, hydrogen demand, and electricity prices. Int. J. Hydrogen Energy 2019, 44, 4387–4397. [Google Scholar] [CrossRef]
- Deng, Z.; Jiang, Y. Optimal sizing of wind-hydrogen system considering hydrogen demand and trading modes. Int. J. Hydrogen Energy 2020, 45, 11527–11537. [Google Scholar] [CrossRef]
- Shirizadeh, B.; Ailleret, A.; Cartry, C.; Douguet, S.; Gehring, T.; Maden, S.; Mais, B.; Mross, L.; Theis, J.; Cabot, C.; et al. Climate neutrality in European heavy-duty road transport: How to decarbonise trucks and buses in less than 30 years? Energy Convers. Manag. 2024, 309, 118438. [Google Scholar] [CrossRef]
- Gao, J.; Zhang, R.; Yu, X. Investigating diffusion and convergence trajectory of hydrogen storage technology based on patent analysis. Int. J. Hydrogen Energy 2024, 57, 844–855. [Google Scholar] [CrossRef]
- Cao, Q.; Wang, H.; Qin, Y.; Wang, M. Current status and analysis of the development of pure hydrogen pipeline hydrogen transmission technology. Mech. Eng. 2024, 46, 18–27. [Google Scholar]
- Jia, M.R.; Zhang, R.R.; Li, X.H.; Liu, Y.Z.; Han, Z.Y. Molecular dynamics simulation study on microscopic failure of hydrogen pipeline. J. Saf. Sci. Technol. 2023, 19, 123–128. [Google Scholar]
- Kong, Y.Y.; Cui, J.T.; Han, H.; Liu, C.W.; Duan, P.F.; Han, J.K.; Li, Y.X. Comparative analysis and discussion on domestic and foreign technical standards for hydrogen pipeline transportation. Oil Gas Storage Transp. 2023, 42, 944–951. [Google Scholar]
- Yang, R.; Schell, C.A.; Rayasam, D.; Groth, K.M. Hydrogen impact on transmission pipeline risk: Probabilistic analysis of failure causes. Reliab. Eng. Syst. Saf. 2025, 257, 110825. [Google Scholar] [CrossRef]
- Cheng, D.; Lin, J.; Wei, N.; Yu, W.; Dang, C.; Tian, H. Review of hydrogen transmission pipeline technology development. You-Qi Chuyun 2024, 43, 624–631. [Google Scholar]
- Liu, C.; Ma, G.; Sun, D. Research progress for technology of hydrogen transportation by pipeline. Acta Energiae Solaris Sin. 2023, 44, 451–458. [Google Scholar]
- Yu, Q.; Hao, Y.; Ali, K.; Hua, Q.; Sun, L. Techno-economic analysis of hydrogen pipeline network in China based on levelized cost of transportation. Energy Convers. Manag. 2024, 301, 118025. [Google Scholar] [CrossRef]
- Van den Boomen, M.; Van der Meulen, S.; Van Ekris, J.; Spanjers, R.; Ten Voorde, O.; Mulder, J.; Blommaart, P. Optimized expansion strategy for a hydrogen pipe network in the port of rotterdam with compound real options analysis. Sustainability 2021, 13, 9153. [Google Scholar] [CrossRef]
- Cerniauskas, S.; Junco, A.J.C.; Grube, T.; Robinius, M.; Stolten, D. Options of natural gas pipeline reassignment for hydrogen: Cost assessment for a Germany case study. Int. J. Hydrogen Energy 2020, 45, 12095–12107. [Google Scholar] [CrossRef]
- Solomon, M.D.; Heineken, W.; Scheffler, M.; Birth-Reichert, T. Cost optimization of compressed hydrogen gas transport via trucks and pipelines. Energy Technol. 2024, 12, 2300785. [Google Scholar] [CrossRef]
- Lahnaoui, A.; Wulf, C.; Heinrichs, H.; Dalmazzone, D. Optimizing hydrogen transportation system for mobility by minimizing the cost of transportation via compressed gas truck in North Rhine-Westphalia. Appl. Energy 2018, 223, 317–328. [Google Scholar] [CrossRef]
- Reuß, M.; Dimos, P.; Léon, A.; Grube, T.; Robinius, M.; Stolten, D. Hydrogen road transport analysis in the energy system: A case study for Germany through 2050. Energies 2021, 14, 3166. [Google Scholar] [CrossRef]
- Cheng, W.; Cheng, Y.F. A techno-economic study of the strategy for hydrogen transport by pipelines in Canada. J. Pipeline Sci. Eng. 2023, 3, 100112. [Google Scholar] [CrossRef]
- Wang, X.; Wu, Y.; Wen, Z.; Cui, Z.; Wang, Y. A New Transportation Route Planning Method for Wind-Based Hydrogen Supply Chains. ACS Sustain. Chem. Eng. 2024, 12, 8436–8452. [Google Scholar] [CrossRef]
- Johnson, N.; Ogden, J. A spatially-explicit optimization model for long-term hydrogen pipeline planning. Int. J. Hydrogen Energy 2012, 37, 5421–5433. [Google Scholar] [CrossRef]
- Li, B.; Li, J.; Jian, B. Price-guided cooperation of combined offshore wind and hydrogen plant, hydrogen pipeline network, power network, and transportation network. IEEE Access 2023, 11, 124368–124385. [Google Scholar] [CrossRef]
- Qi, S.; Zhao, W.; Qiu, R.; Liu, C.; Li, Z.; Lan, H.; Liang, Y. Capacity allocation method of hydrogen-blending natural gas pipeline network based on bilevel optimization. Energy 2023, 285, 129417. [Google Scholar] [CrossRef]
- Günaydın, Ö.F.; Topçu, S.; Aksoy, A. Hydrogen fuel cell vehicles: Overview and current status of hydrogen mobility. Int. J. Hydrogen Energy 2025, 142, 918–936. [Google Scholar] [CrossRef]
- Mazzeo, D.; Herdem, M.S.; Matera, N.; Wen, J.Z. Green hydrogen production: Analysis for different single or combined large-scale photovoltaic and wind renewable systems. Renew. Energy 2022, 200, 360–378. [Google Scholar] [CrossRef]
- Zhou, Y.; Qin, X.; Mei, W.; Yang, W.; Ni, M. Multi-period urban hydrogen refueling stations site selection and capacity planning with many-objective optimization for hydrogen supply chain. Int. J. Hydrogen Energy 2024, 79, 1427–1441. [Google Scholar] [CrossRef]
Disclaimer/Publisher’s Note: The statements, opinions and data contained in all publications are solely those of the individual author(s) and contributor(s) and not of MDPI and/or the editor(s). MDPI and/or the editor(s) disclaim responsibility for any injury to people or property resulting from any ideas, methods, instructions or products referred to in the content. |
© 2025 by the authors. Licensee MDPI, Basel, Switzerland. This article is an open access article distributed under the terms and conditions of the Creative Commons Attribution (CC BY) license (https://creativecommons.org/licenses/by/4.0/).

