Abstract
Stray currents leaking from electrified DC rail systems cause the greatest corrosion risk to underground metal gas pipelines and can lead to pipeline wall perforation in a very short time. Leakage and gas explosion, and other direct and indirect effects, can even disrupt the stability of the energy system. Maintaining the reliability of gas pipelines, therefore, requires protecting them against corrosion caused by stray currents. It is therefore necessary to conduct field studies to identify sections of gas pipelines at risk and where protective installations should be installed. The paper discusses the most important field methods for assessing the risk of stray currents to gas pipelines: the potential of rail traction relative to ground, electric field gradients in the ground associated with stray current flow, correlation of gas pipeline potential and voltage of pipeline vs. the rail, and time-frequency analysis of the pipeline and rail potentials. A typical application case for each method is indicated, and the advantages and disadvantages of each research technique are identified. The criterion for selecting methods for this review was a short measurement duration (tens of minutes), after which it is possible to determine the level of the hazard to the gas pipeline caused by stray currents in the examined location. This is why these methods have an advantage over other research techniques that require long-term monitoring or exposure of probes or sensors. The review will be useful for cathodic protection personnel involved in the operation of gas pipelines and may be helpful in developing new methods for assessing the impact of stray currents.
1. Introduction
This paper provides a comprehensive review of field methods used to evaluate the corrosion hazard posed by stray DC currents from rail systems to underground gas pipelines. Gas transmission pipelines are one of the key elements of critical infrastructure, ensuring stable supplies of natural gas to industrial, municipal, and individual customers. The importance of gas transmission pipelines is growing in the context of the energy transition, in which natural gas plays the role of a bridge fuel, supporting the process of moving away from high-emission energy sources.
Corrosion of gas pipelines is absolutely critical in terms of the reliability of the energy system. Failures in gas transmission infrastructure can lead to disruptions in the operation of power, heating, and industrial systems. This requires the use of advanced methods for assessing and maintaining the reliability of gas pipelines, including anticorrosion protection.
The greatest corrosion hazard for underground pipelines is stray currents flowing from electrified DC rail systems: tram, railway, and subway. Therefore, national and international legal and technical requirements for gas networks include mandatory protection of gas pipelines against the harmful effects of stray currents. For example, in Poland, corrosion protection of steel gas pipelines is mandatory and regulated, among others, by the Regulation of the Minister of Economy of 26 April 2013—the use of insulating coatings, cathodic protection, and protection against stray currents is required. Internationally, procedures such as ECDA (External Corrosion Direct Assessment) are used [1]. Its purpose is to detect and assess areas of the pipeline exposed to external corrosion, identify sections with an increased risk of corrosion, e.g., in areas with high soil moisture and those suffering from stray currents, and then plan corrective and preventive measures. Therefore, it is necessary to evaluate the possible corrosion risk of gas pipelines in the analyzed area. The main causes of current leakage are connected with the fact that the rails are not electrically isolated from the ground. Consequently, some return currents (flowing along the rails to the negative pole of the supply substation) flow from the rails to the ground. The magnitude of leakage increases when the longitudinal resistance of the rails increases due to technical faults in the return circuits, for example, damage to the longitudinal connectors between successive rail sections or to the transverse connectors between the left and right rails. Stray currents flow from the ground into the metal walls of gas pipelines because, in practice, pipelines with flawless insulation do not exist, and the number of defects increases over time.
The actual impact of stray currents on a gas pipeline can be examined using coupon corrosion testing [2]. The coupons are buried next to the pipeline and connected to it with an electrical cable, which exposes them to stray currents in the same way as the gas pipeline at the tested location. The risk of electrolytic corrosion is determined on the basis of an analysis of the currents flowing through the coupons, changes in their potentials, and the mass loss of the coupons [3]. Although this method provides reliable test results, it is cumbersome to use as it requires the coupons to be buried and a long exposure time of at least several months.
Therefore, cathodic protection personnel use other methods that allow the risk to gas pipelines to be determined immediately. The results are not the corrosion rate of the structure, but a determination of whether stray currents in the measurement area can cause intense electrolytic corrosion of the gas pipeline at the site of the external insulation defect.
The purpose of this paper is to discuss field research methods employed to assess the corrosion risk of gas pipelines due to the impact of stray currents flowing from DC traction (the review does not apply to AC interference). Identifying areas of gas pipelines at risk of electrolytic corrosion allows appropriate anticorrosion measures to be taken. These measures result in the reliability of gas transmission pipelines and increase energy security and the high level of safety of gas network operation. The presented overview will be useful for cathodic protection personnel involved in the operation of gas pipelines. It may also help develop new field methods for assessing the effects of stray currents. The need to elaborate field techniques arises with the development of technologies for the gas pipelines with a tight coating (like 3LPE: three-layer polyethylene coating), as this affects the flow of stray currents in the gas network through a small number of coating defects (with an area of several mm2) [4].
2. Corrosive Impact of Stray Currents Leaking from DC Electric Rail Traction Systems on Gas Pipelines
The leakage of stray currents from DC electric traction rails to the ground is widely described in scientific literature, e.g., [5,6,7,8]. Their intensity can be estimated based on mathematical models developed and presented in the articles such as [9,10,11,12]. From the operational experience of underground pipelines and measurements of the intensity of the current flowing in them, it is known that in the vicinity of tram and railway traction, the instantaneous intensity of stray currents flowing through pipelines with decades-old external insulation can reach up to several dozen amperes [13,14,15,16]. In DC traction systems, stray currents are estimated to be about 5% of the return currents [17]. For example, measurements made by Vranešić et al. [18] on the tramway traction in Ostrava (Czech Republic) showed instantaneous return currents of almost 700 A, so the maximum stray current intensity can be estimated at ca. 35 A.
The mechanism of corrosion caused by stray currents on underground metal pipelines and reinforced concrete structures is well described in scientific literature, e.g., [6,19,20]. The flow of current through the metal/electrolyte interface causes polarization of the metal, i.e., a change in its potential. In areas where current flows from the ground to the pipeline (at points where the insulation is defective), cathodic polarization of the pipeline occurs. This results in a lowering of the potential of the pipeline and no risk of corrosion—a reduction reaction takes place on the metal surface. In natural environments, this is the reduction of oxygen dissolved in water (O2 + 2H2O + 4e → 4OH−). In turn, the current flowing from the pipeline to the ground causes the anodic polarization of the metal, which increases the potential of the pipeline—oxidation and metal dissolution reactions occur (Fe → Fe2+ + 2e).
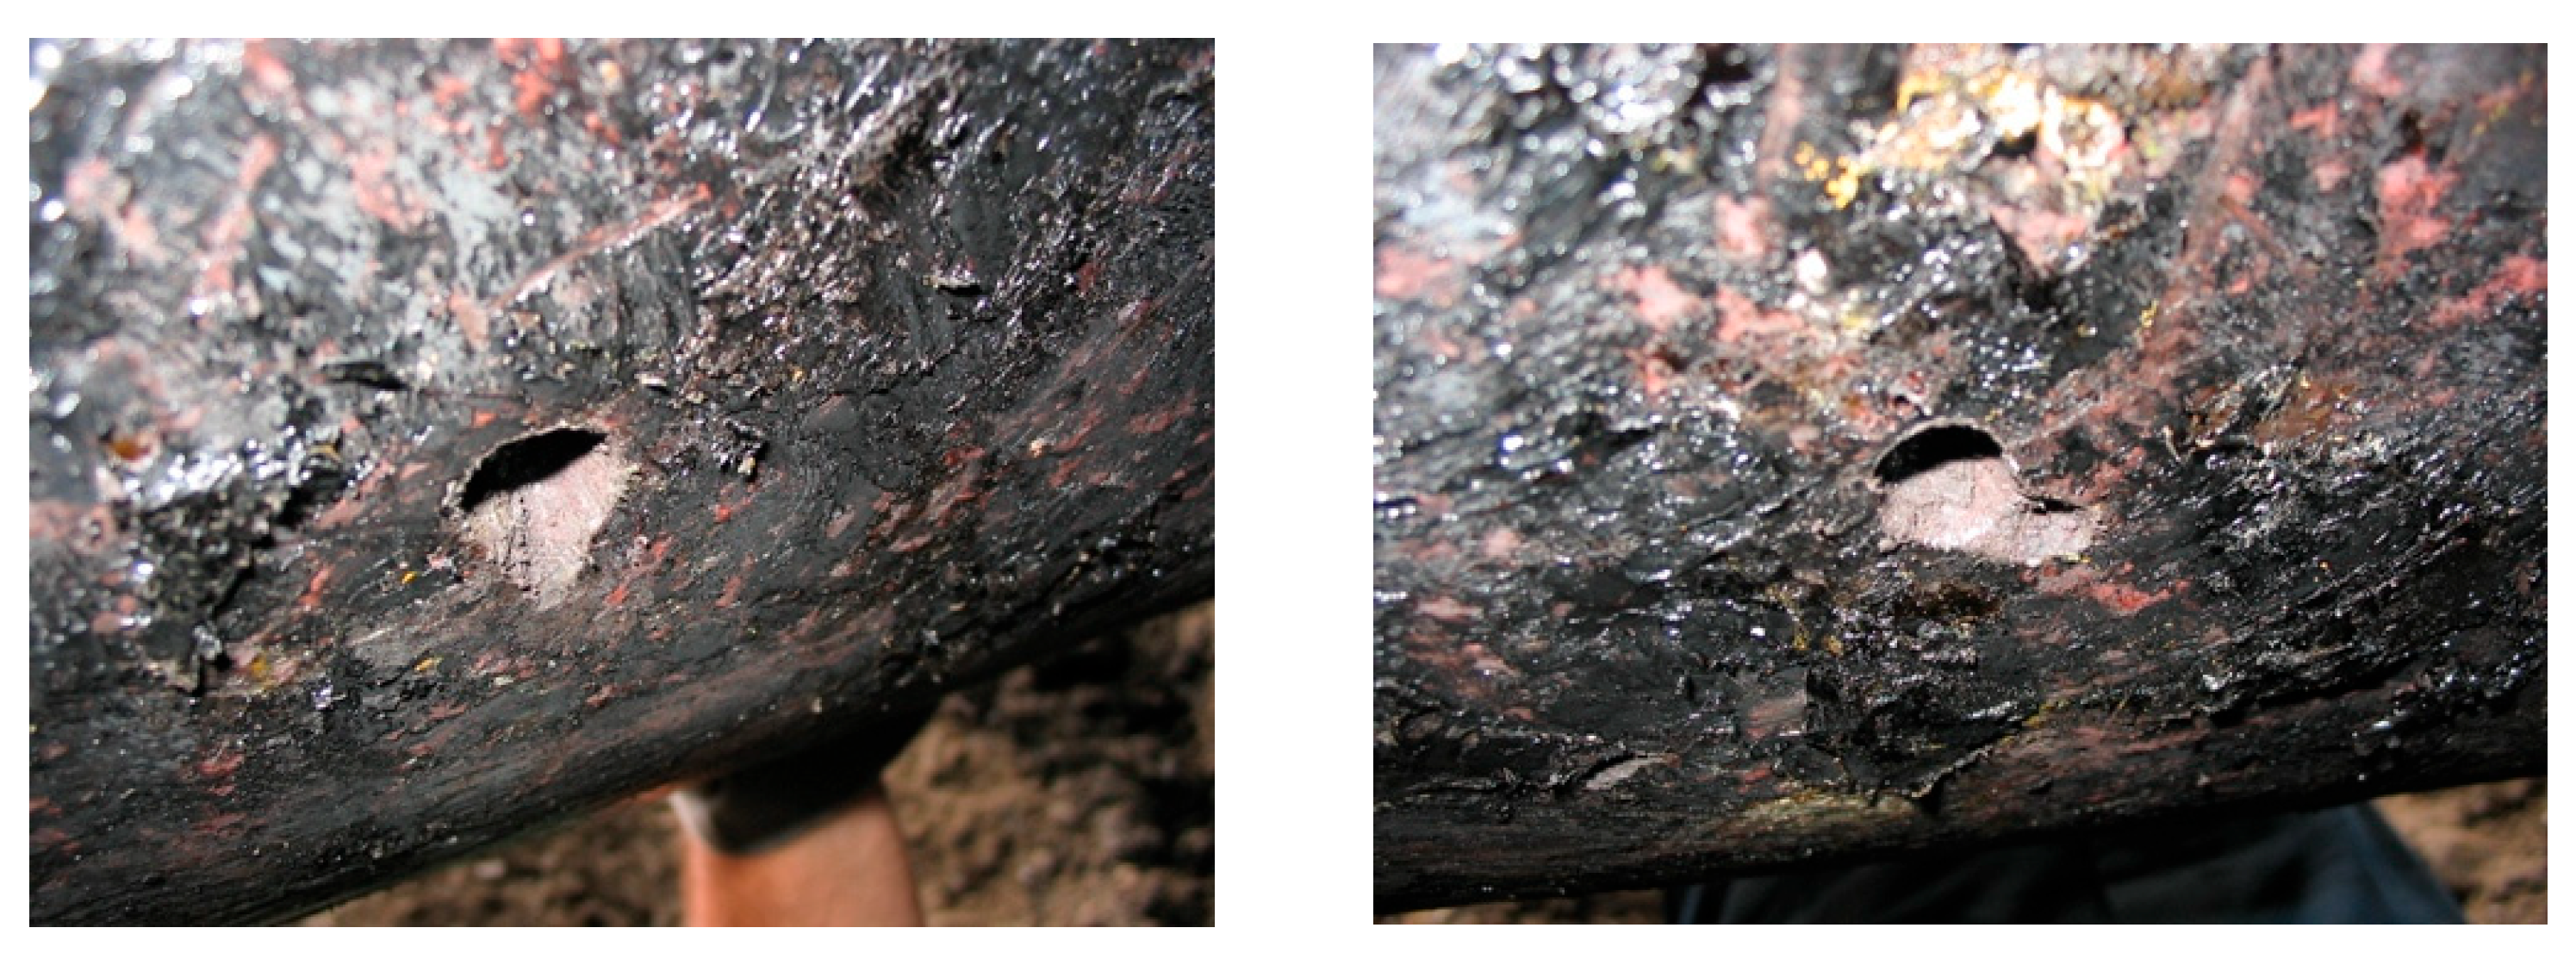
Metal loss can be calculated using Faraday’s Law [21]; e.g., a direct current with an intensity of 1 A dissolves approximately 9.6 kg of steel per year. So, electrolytic corrosion caused by stray currents can be very intense, even several mm/year. If the surface area where the current flows from the pipeline into the ground is small (a few cm2), then the density of the current dissolving the metal is very high, and perforation of the pipeline wall may occur after only a few months, even at a distance of several hundred meters from the tram traction [22]. Examples of electrolytic corrosion of underground pipelines are shown in the photos in Figure 1. The corrosion defects presented occurred on a DN300 (diameter nominal 300 mm) medium-pressure gas pipeline with bituminous insulation, running near the tram traction.
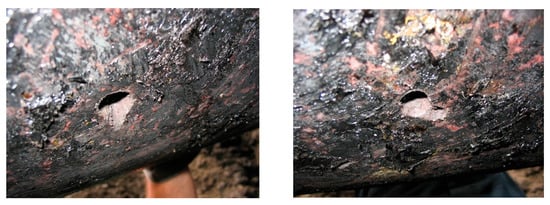
Figure 1.
Examples of corrosion damage of pipelines caused by stray currents (from the authors’ photographic archives).
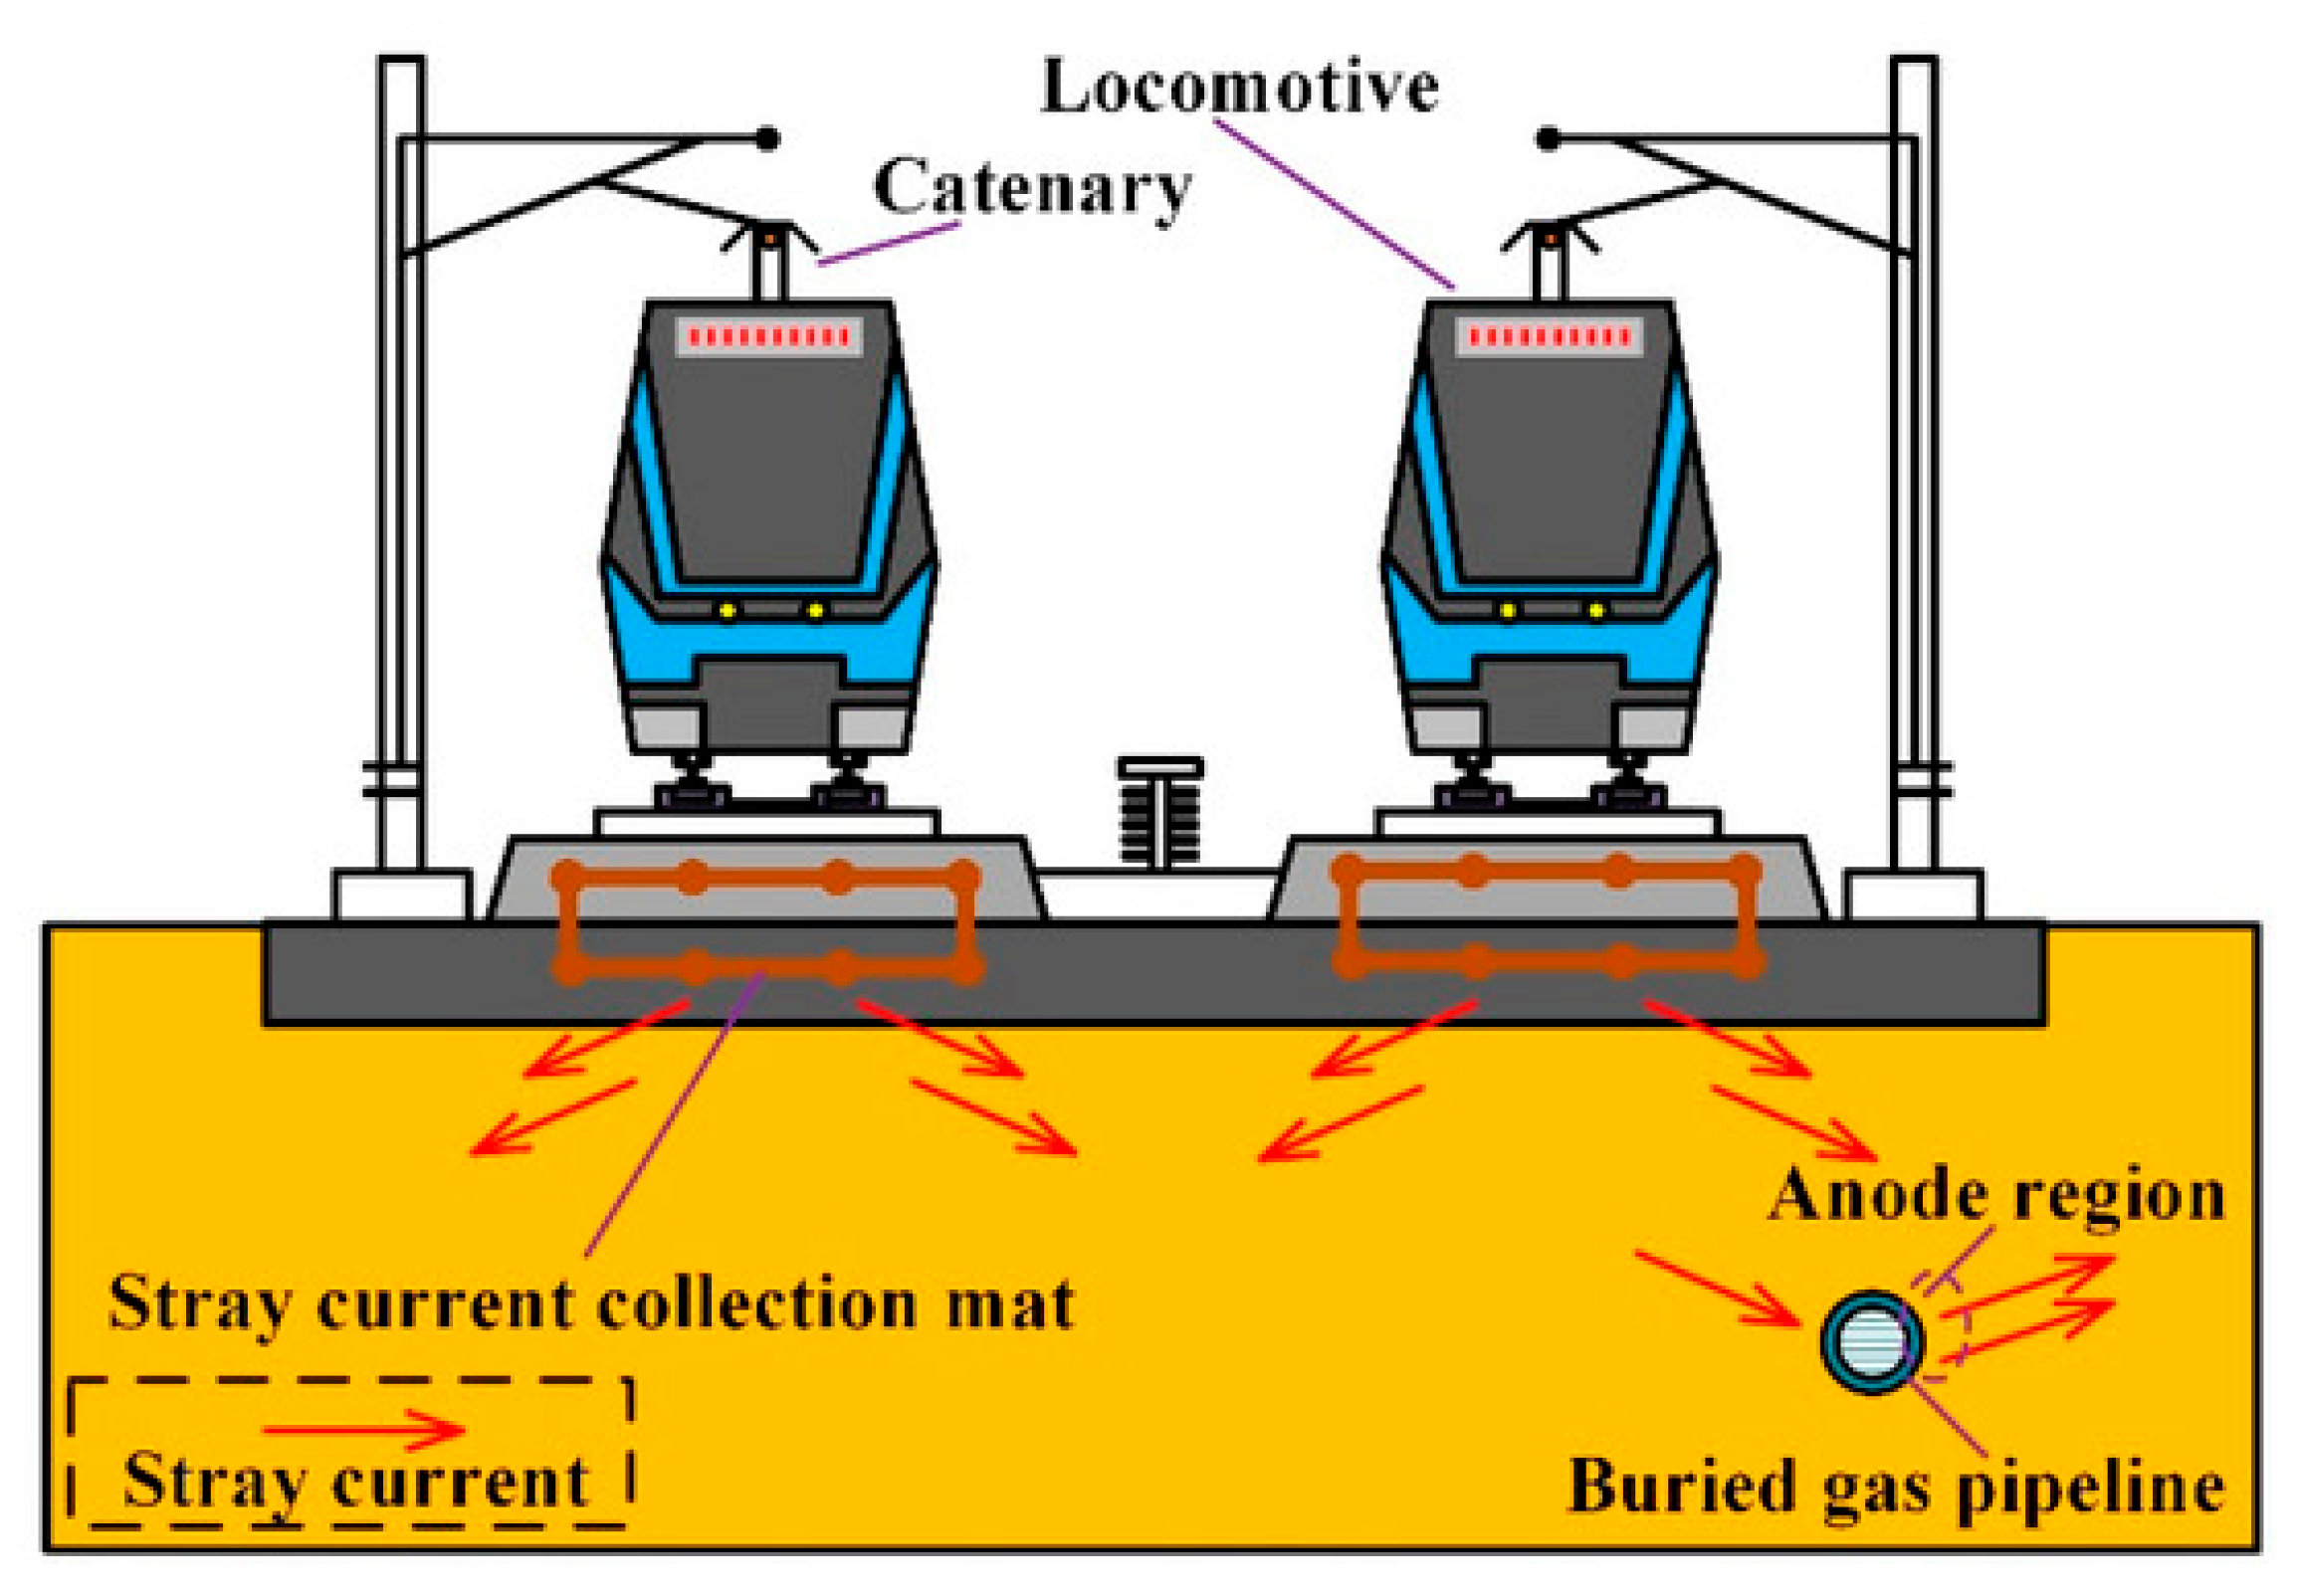
The leakage of stray currents from the rails can be reduced by rail fastening systems and increasing rail-to-ground resistance [23,24,25]. This is regulated by guidelines and standards that are applied at the design stage of new traction lines [26,27]. It is also possible to limit stray currents flowing through the ground to pipelines by using a stray current collection system [25,28]. This is a metal mesh installed under the track that traps stray currents and directs them to the return point of the power substation (negative pole of the DC substation) [29].
However, no measures can eliminate stray currents completely, as evidenced by numerous scientific papers presenting the corrosion hazard to underground metal and reinforced concrete structures located in the vicinity of electric traction systems (e.g., [30,31,32,33,34]). This is also demonstrated by the articles devoted to calculating stray currents depending on the through-type structure characteristics of the return current system, traction power supply system, multiple trains running, rail resistance to earth, ground resistivity, and other environmental factors [35,36].
It is therefore necessary to protect gas pipelines against stray currents [4] by eliminating the phenomenon of current leakage from the pipeline directly through the metal/electrolyte interface, which causes metal dissolution. Several electrochemical protection methods are used for this purpose. The main ones are shown schematically in Figure 2 [37]. The basic method is the use of polarized electrical drainage. This involves connecting the gas pipeline to the rail with an electrical cable via a diode, which allows stray current to flow through the cable from the pipeline to the rail (instead of from the pipeline to the ground), as shown in Figure 2a. The use of impressed current cathodic protection (ICCP) is shown schematically in Figure 2b. The current from the anode system polarizing the gas pipeline has the opposite direction to the stray current flowing from the gas pipeline to the ground and prevents the corrosive dissolution of the metal. The use of a grounding electrode for the gas pipeline prevents stray currents from flowing from the gas pipeline into the ground, but instead allows them to flow from the grounding electrode connected to the gas pipeline. In each of these methods, the phenomenon of stray currents flowing from the gas pipeline into the ground directly through the metal/electrolyte interface, causing metal dissolution, is eliminated [38,39].

Figure 2.
Reducing the impact of stray currents by implementing: (a) polarized electric drainage, (b) impressed current cathodic protection. (prepared based on the original figure from Ref. [37]).
3. Methods for Testing Gas Pipelines for Electrolytic Corrosion
In the practical operation of gas pipelines, there is often a need to immediately determine the risk of stray currents of traction origin to the pipeline. For this purpose, various testing methods based on the analysis of random signals are used. Since many electric locomotives move on the traction section powered by the traction substation, each with an individual instantaneous traction load, the current load of the traction substation changes randomly, resulting in random changes in the potential of the rails relative to ground [40,41,42]. Stray currents, as part of traction return currents, are therefore also random in nature [43,44]. Their instantaneous intensity and flow direction change randomly and dynamically [45,46]. Since the current polarizing gas pipelines (i.e., stray current) is random in nature, the polarization (potential change) caused by this current is also random. The result is dynamic, random changes in the potential of the gas pipeline, both in the anodic and cathodic directions (depending on the instantaneous value and direction of stray currents), and the duration of the periodic anodic and cathodic polarization is different, and has different proportions of anodic polarization periods during the day. Therefore, studying the impact of dynamic stray currents on underground structures is not a simple matter, unlike the analysis of static stray currents originating from cathodic protection systems of other foreign underground structures. The analysis of the impact of dynamic stray currents should be carried out by qualified personnel with at least a level 4 competence (on a 5-level scale) according to [47].
The purpose of field studies of corrosion hazards caused by stray currents is to locate sections of the gas pipeline where stray currents flow from the pipeline into the ground and cause electrolytic corrosion of the pipeline, and to indicate the location on the pipeline where stray current protection should be applied. In practice, this means that anodic zones (sections) on the gas pipeline and locations where the proportion of anodic polarization periods of the gas pipeline is highest are located.
3.1. Rails Potential Testing Method
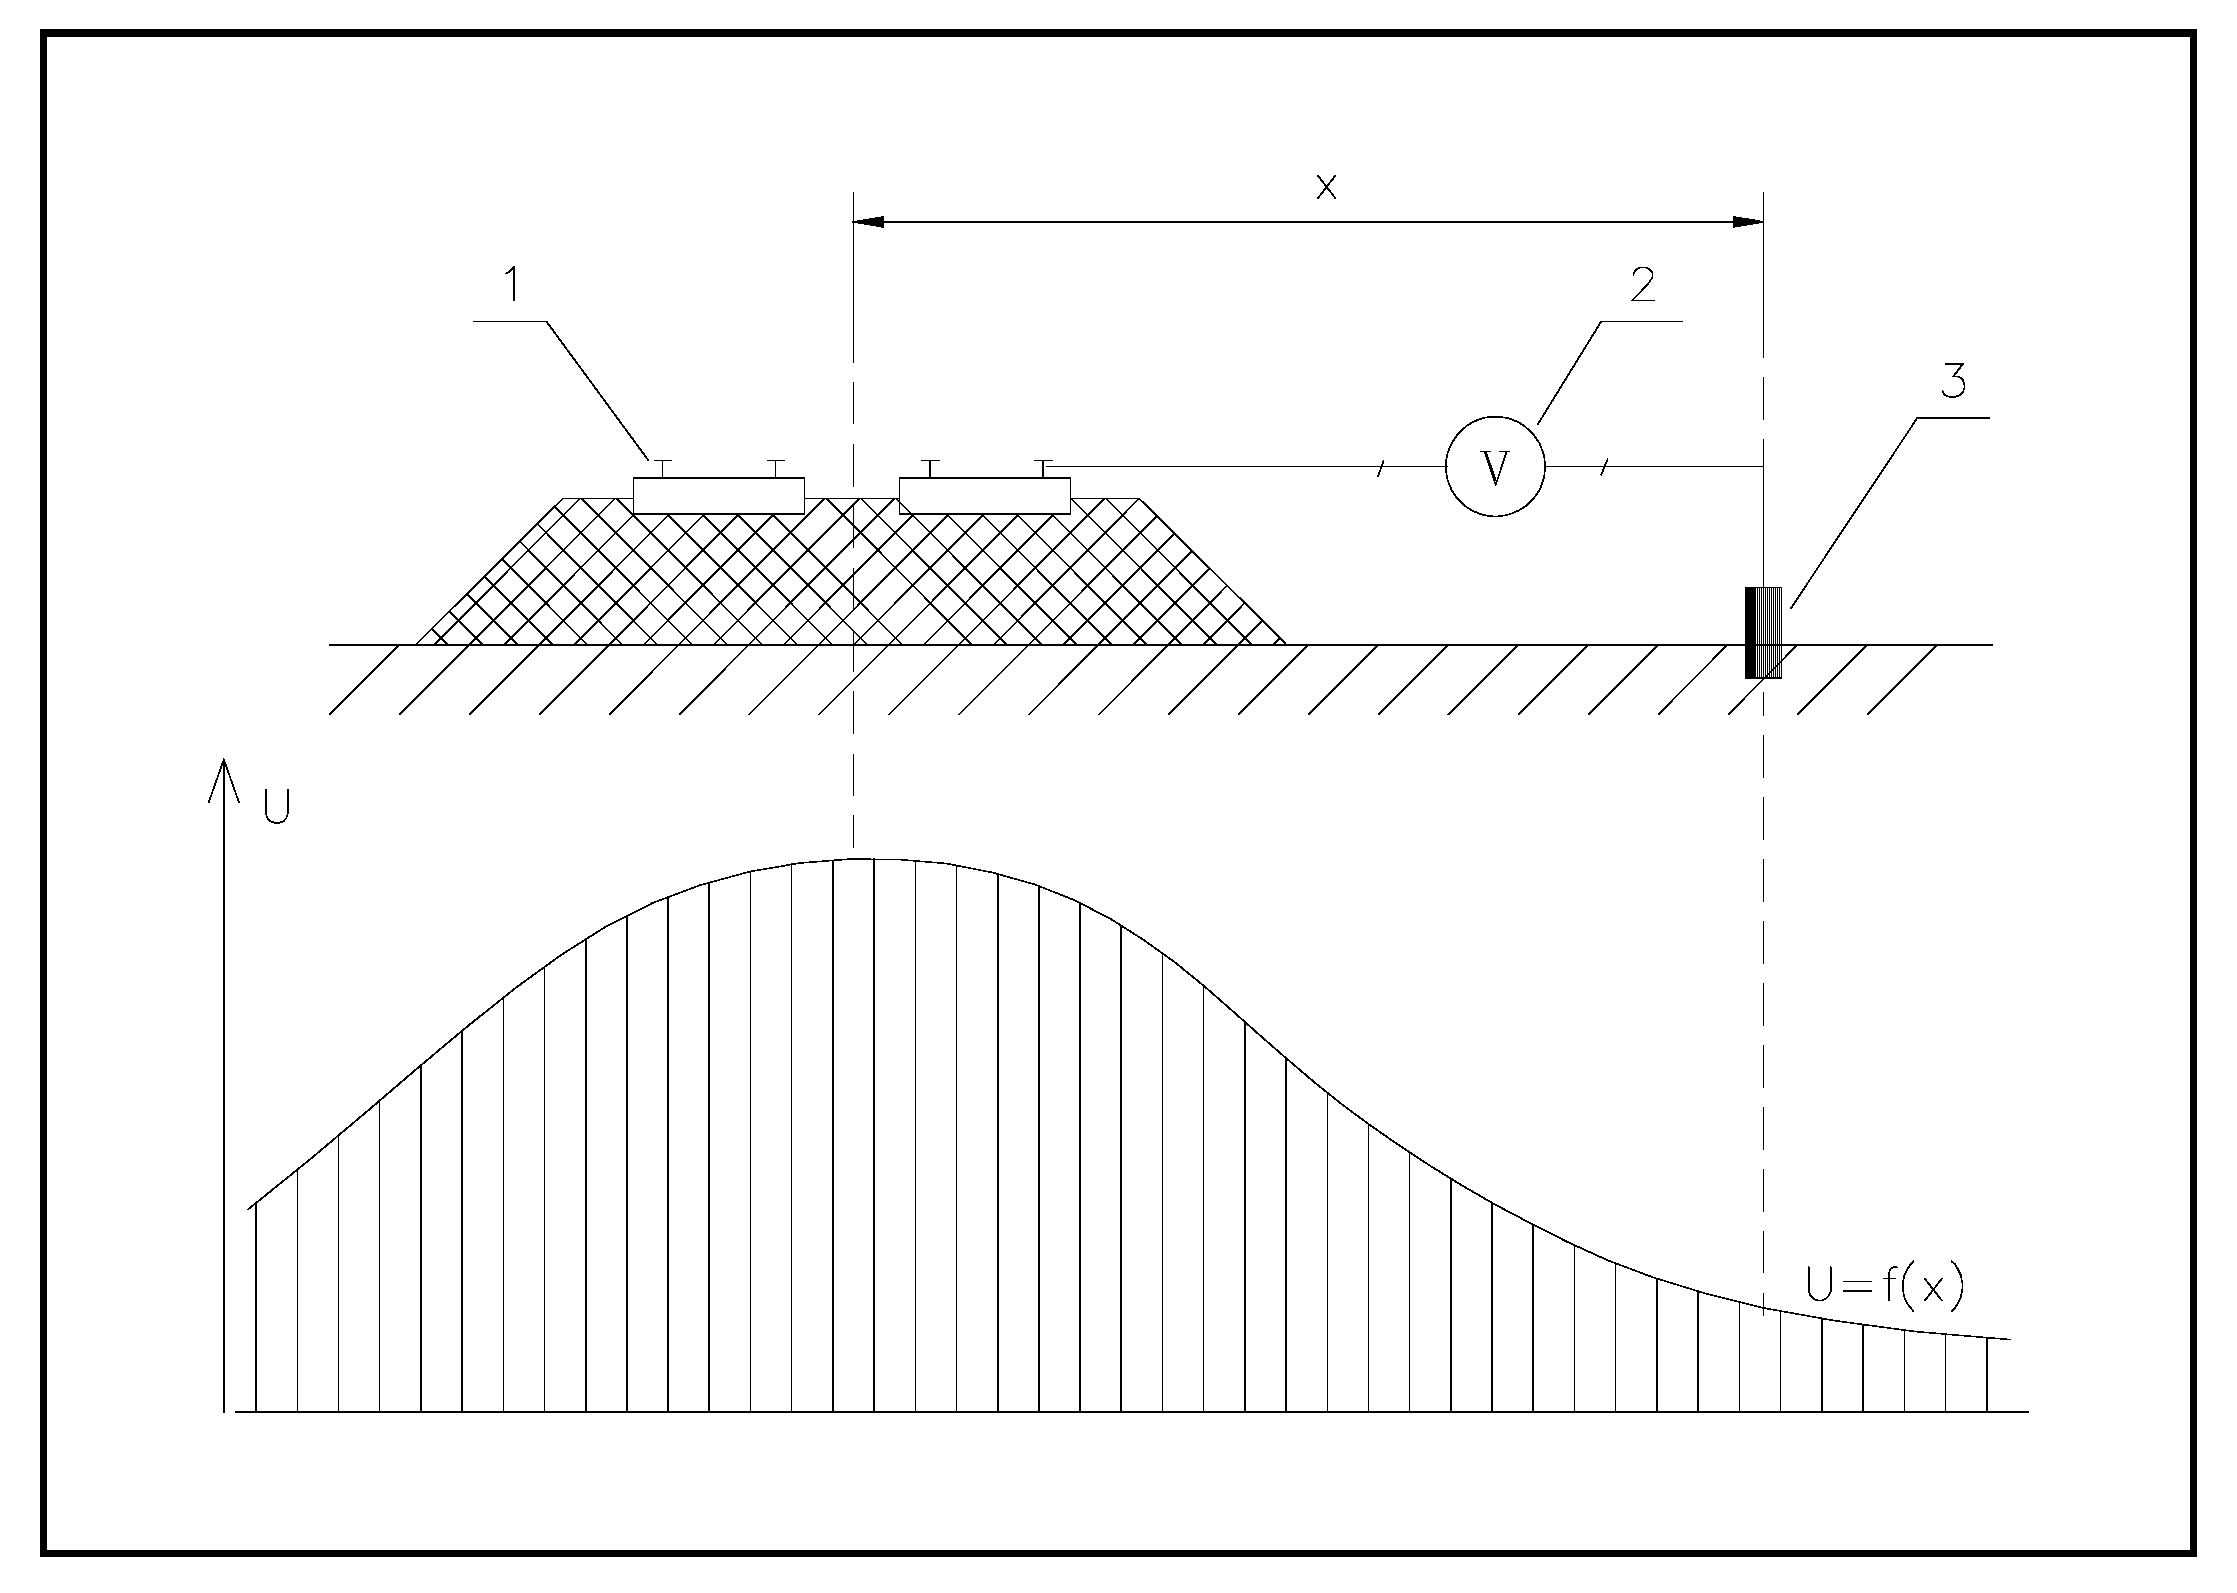
This is the simplest method for determining the zone of probable stray current impact on the gas pipeline in the area of the field measurement site. It does not require connecting measuring instruments (recorders) to the pipeline, but only to the electric traction rails. In this method, the potential of the rails relative to a portable reference electrode (e.g., Cu/CuSO4) is recorded, as schematically shown in Figure 3 [48].
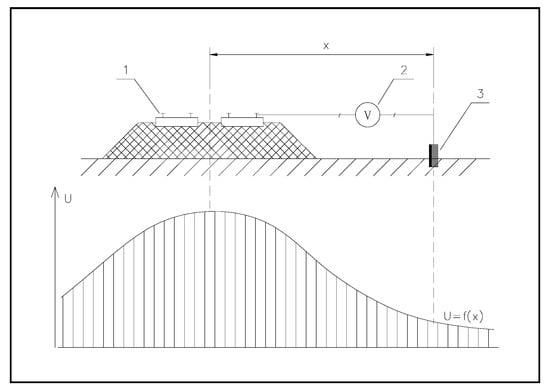
Figure 3.
Scheme of potential measurement of electric traction rails: 1—rail, 2—voltage recorder, 3—reference electrode, and example of instantaneous electric field distribution around the track (by Zakowski and Darowicki [48]).
Based on the analysis of the rail potential record relative to the ground, conclusions can be drawn about the flow of stray currents in the area [49]. In turn, based on the flow of stray currents, it is possible to conclude whether there is an anodic zone on the gas pipeline in the measurement area and a risk of stray currents [50], as illustrated in Figure 4 [51]. The principle of analysis is as follows: positive rail potential values indicate that current is flowing from the rails to the ground (anodic polarization of the rails). Since stray current flows from the rails to the ground, it means that it flows into the underground pipeline in this area, polarizing it cathodically, which means that there is no risk of electrolytic corrosion. The corrosion hazard will occur in another section of the gas pipeline, where stray currents will flow from it into the ground.
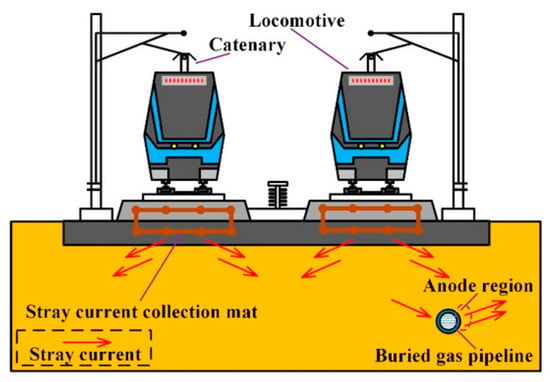
Figure 4.
Stray current in the rail system (by Wang et al. [51]).
Similarly, negative rail potential values indicate that stray current flows from the ground into the rails (cathodic polarization of the rails), and therefore, this current previously flows from the underground pipelines in this area, causing their electrolytic corrosion. There is therefore a correlation: the anodic zone of the rails indicates the cathodic zone of the gas pipeline in this area (no risk of stray currents), while the cathodic zone of the rails indicates the anodic zone on the gas pipeline in this area (risk of electrolytic corrosion of the gas pipeline).
An example of a tram rail potential record is shown in Figure 5. At the measurement site, there is an anodic zone of the rails, as there is a predominance of periods of anodic polarization of the rails (predominance of positive instantaneous values of the rail potential). This means a cathodic zone for underground pipelines in this area, where stray currents flow into underground metal structures, and therefore, there is no risk of stray current corrosion in this area.
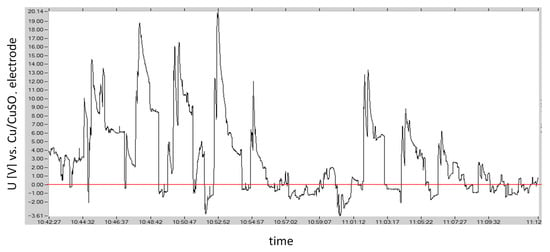
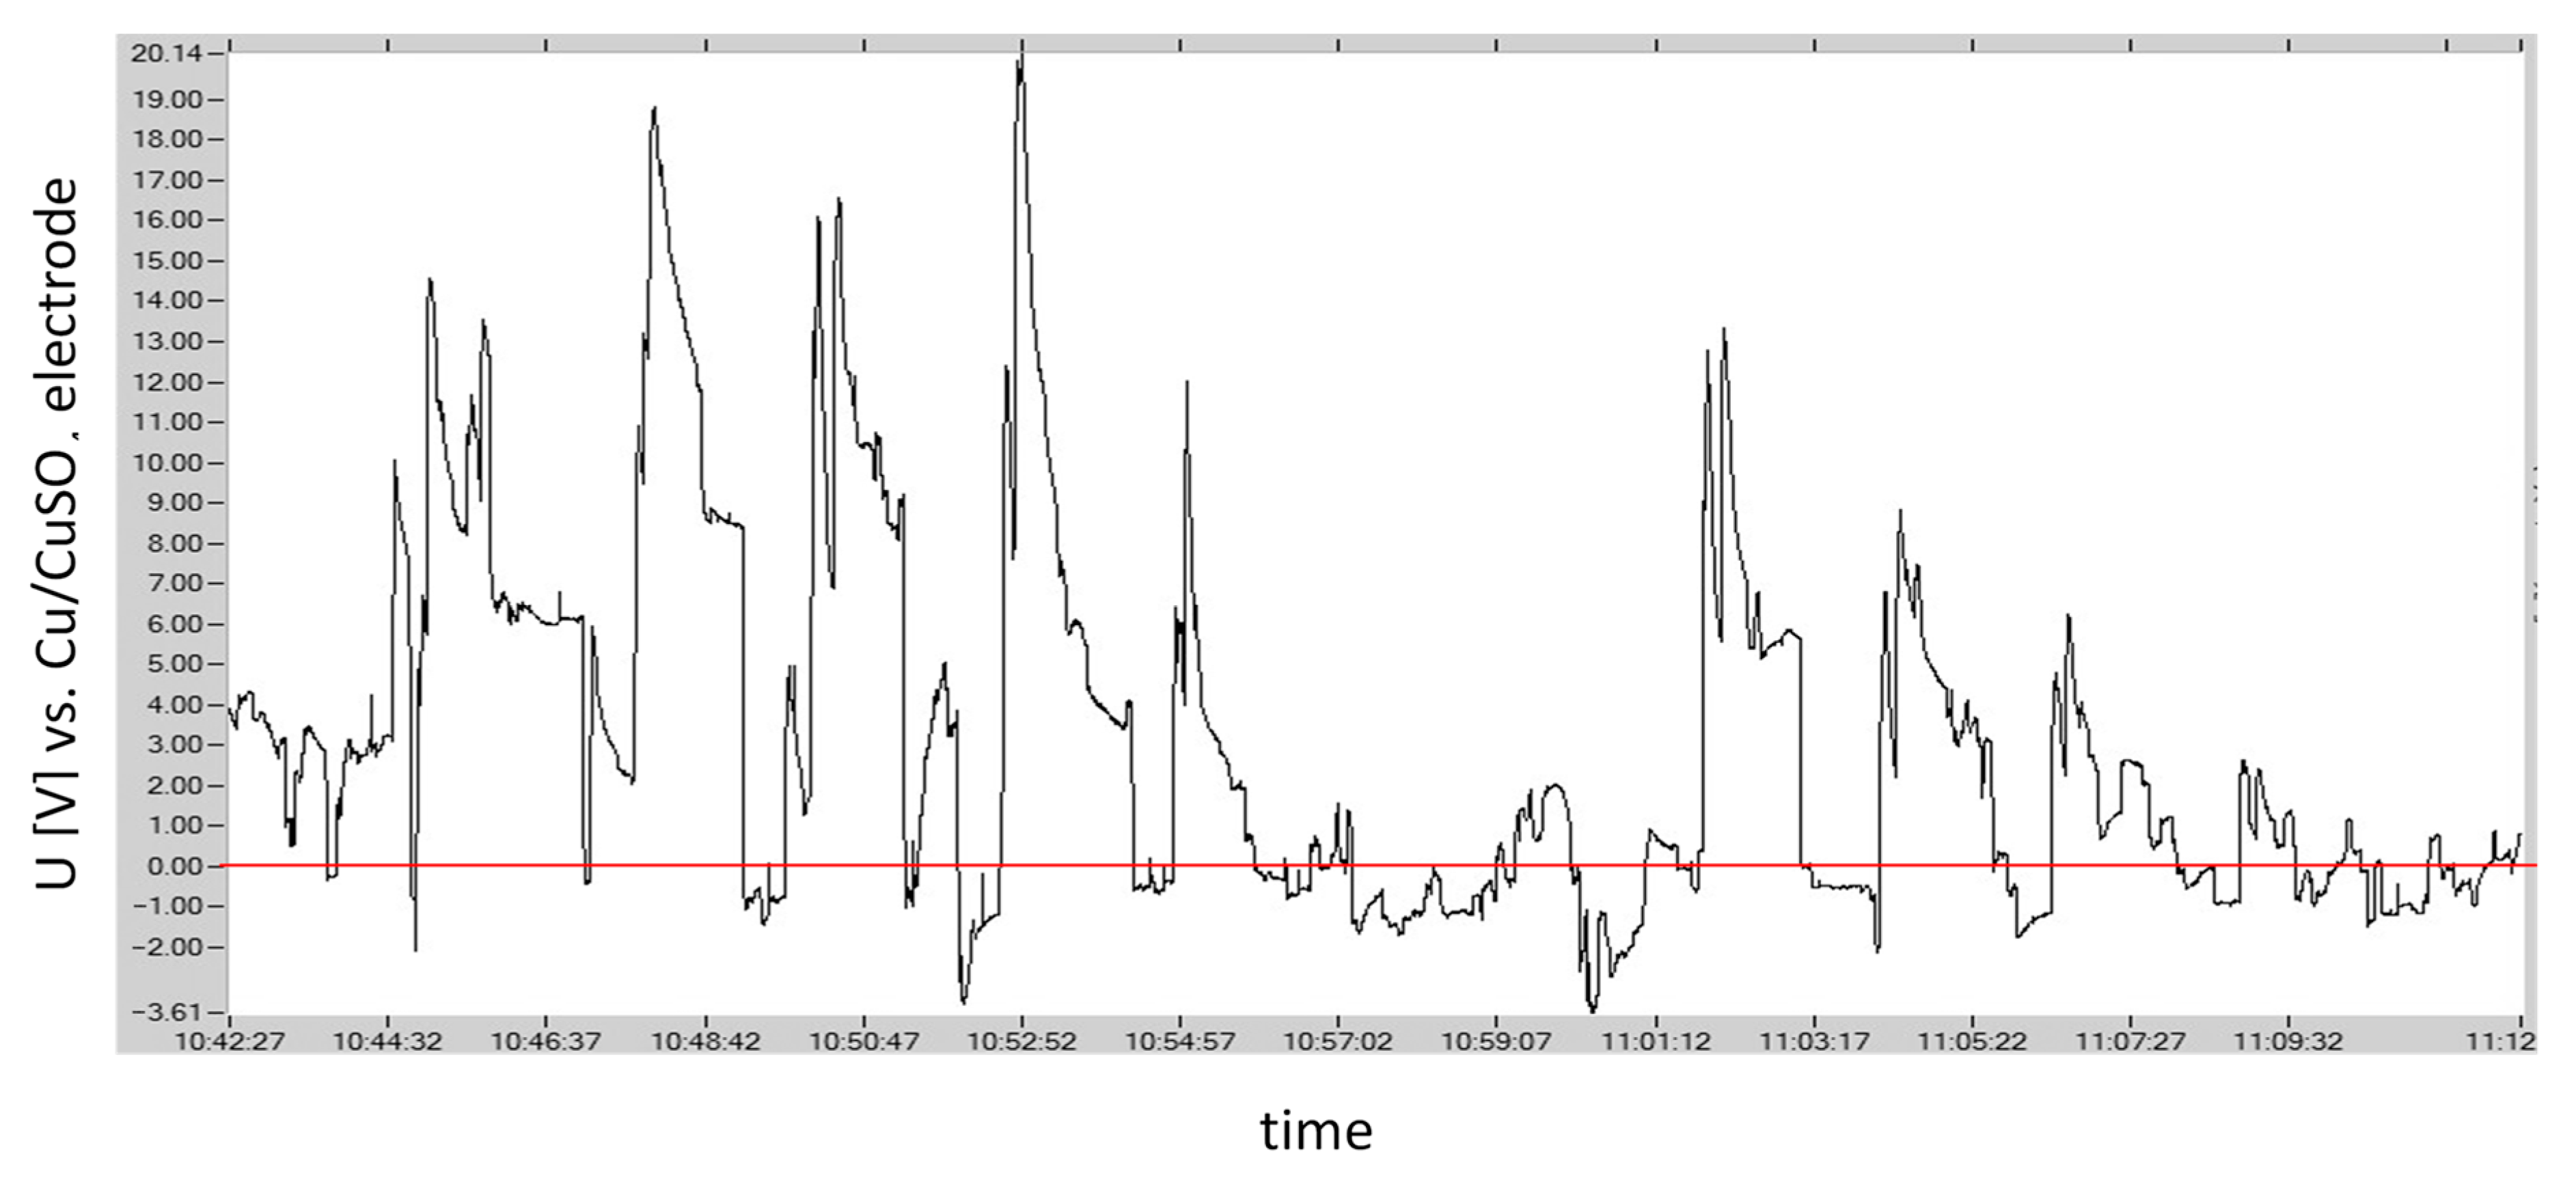

Figure 5.
Example of tram track potential record.
Figure 5.
Example of tram track potential record.

| Method summary | |
| measured quantity: | potential of railway or tram rails |
| measuring equipment: | voltage recorder, Cu/CuSO4 reference electrode, cable connection to the rail |
| what conclusion can be drawn: | determining whether there is an anodic or cathodic zone on the gas pipeline near the rails based on the rails’ potential |
3.2. Method for Determining Electric Field Gradients on the Ground Surface
This method involves measuring the electric field gradient associated with the flow of stray currents through the ground. The gradient is measured at the gas pipeline between two measuring electrodes of the same type, e.g., copper/copper sulfate electrodes commonly used by cathodic protection personnel. The field gradient is measured perpendicularly to the gas pipeline by placing one electrode above the gas pipeline and the other at a distance of approximately 10 m from the pipeline, as shown in Figure 6.
In these tests, it is not the gradient values that are analyzed, but their sign, as it is related to the direction of current flow through the ground. The current flows towards the point with lower potential [52,53]. For example, at the location on the gas pipeline in Figure 6b, a negative average gradient value was recorded. In the shown configuration of the measuring system, this indicates that stray current flows from the gas pipeline into the ground, because at the location of the electrode away from the gas pipeline, the ground potential is lower than the ground potential above the gas pipeline. Therefore, there is a risk of electrolytic corrosion of the gas pipeline at this location. In contrast, in the example shown in Figure 6c, the average value of the electric field gradient is positive, which indicates the flow of stray current from the ground to the gas pipeline. At this point, it is therefore not at risk of harmful stray currents. By measuring the gradient at successive points along the gas pipeline route, it is possible to determine the points of entry and exit of stray currents from the gas pipeline, and thus to identify its cathodic and anodic zones.
Similarly, the electric field gradient in the ground near tram or railway traction can be analyzed. Measurement of the potential gradient of soil can determine the direction and magnitude of stray current [31,54,55], and thus also determine the type of impact of currents on adjacent pipelines, whether there is an anodic zone of interaction or a cathodic zone, similarly to the analysis of traction rail potential relative to the ground (Section 3.1).
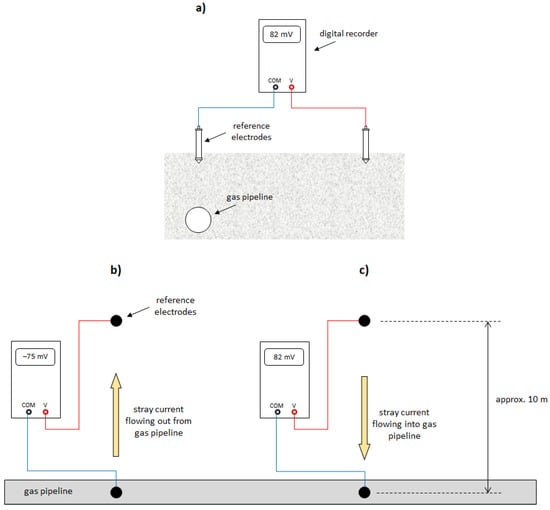
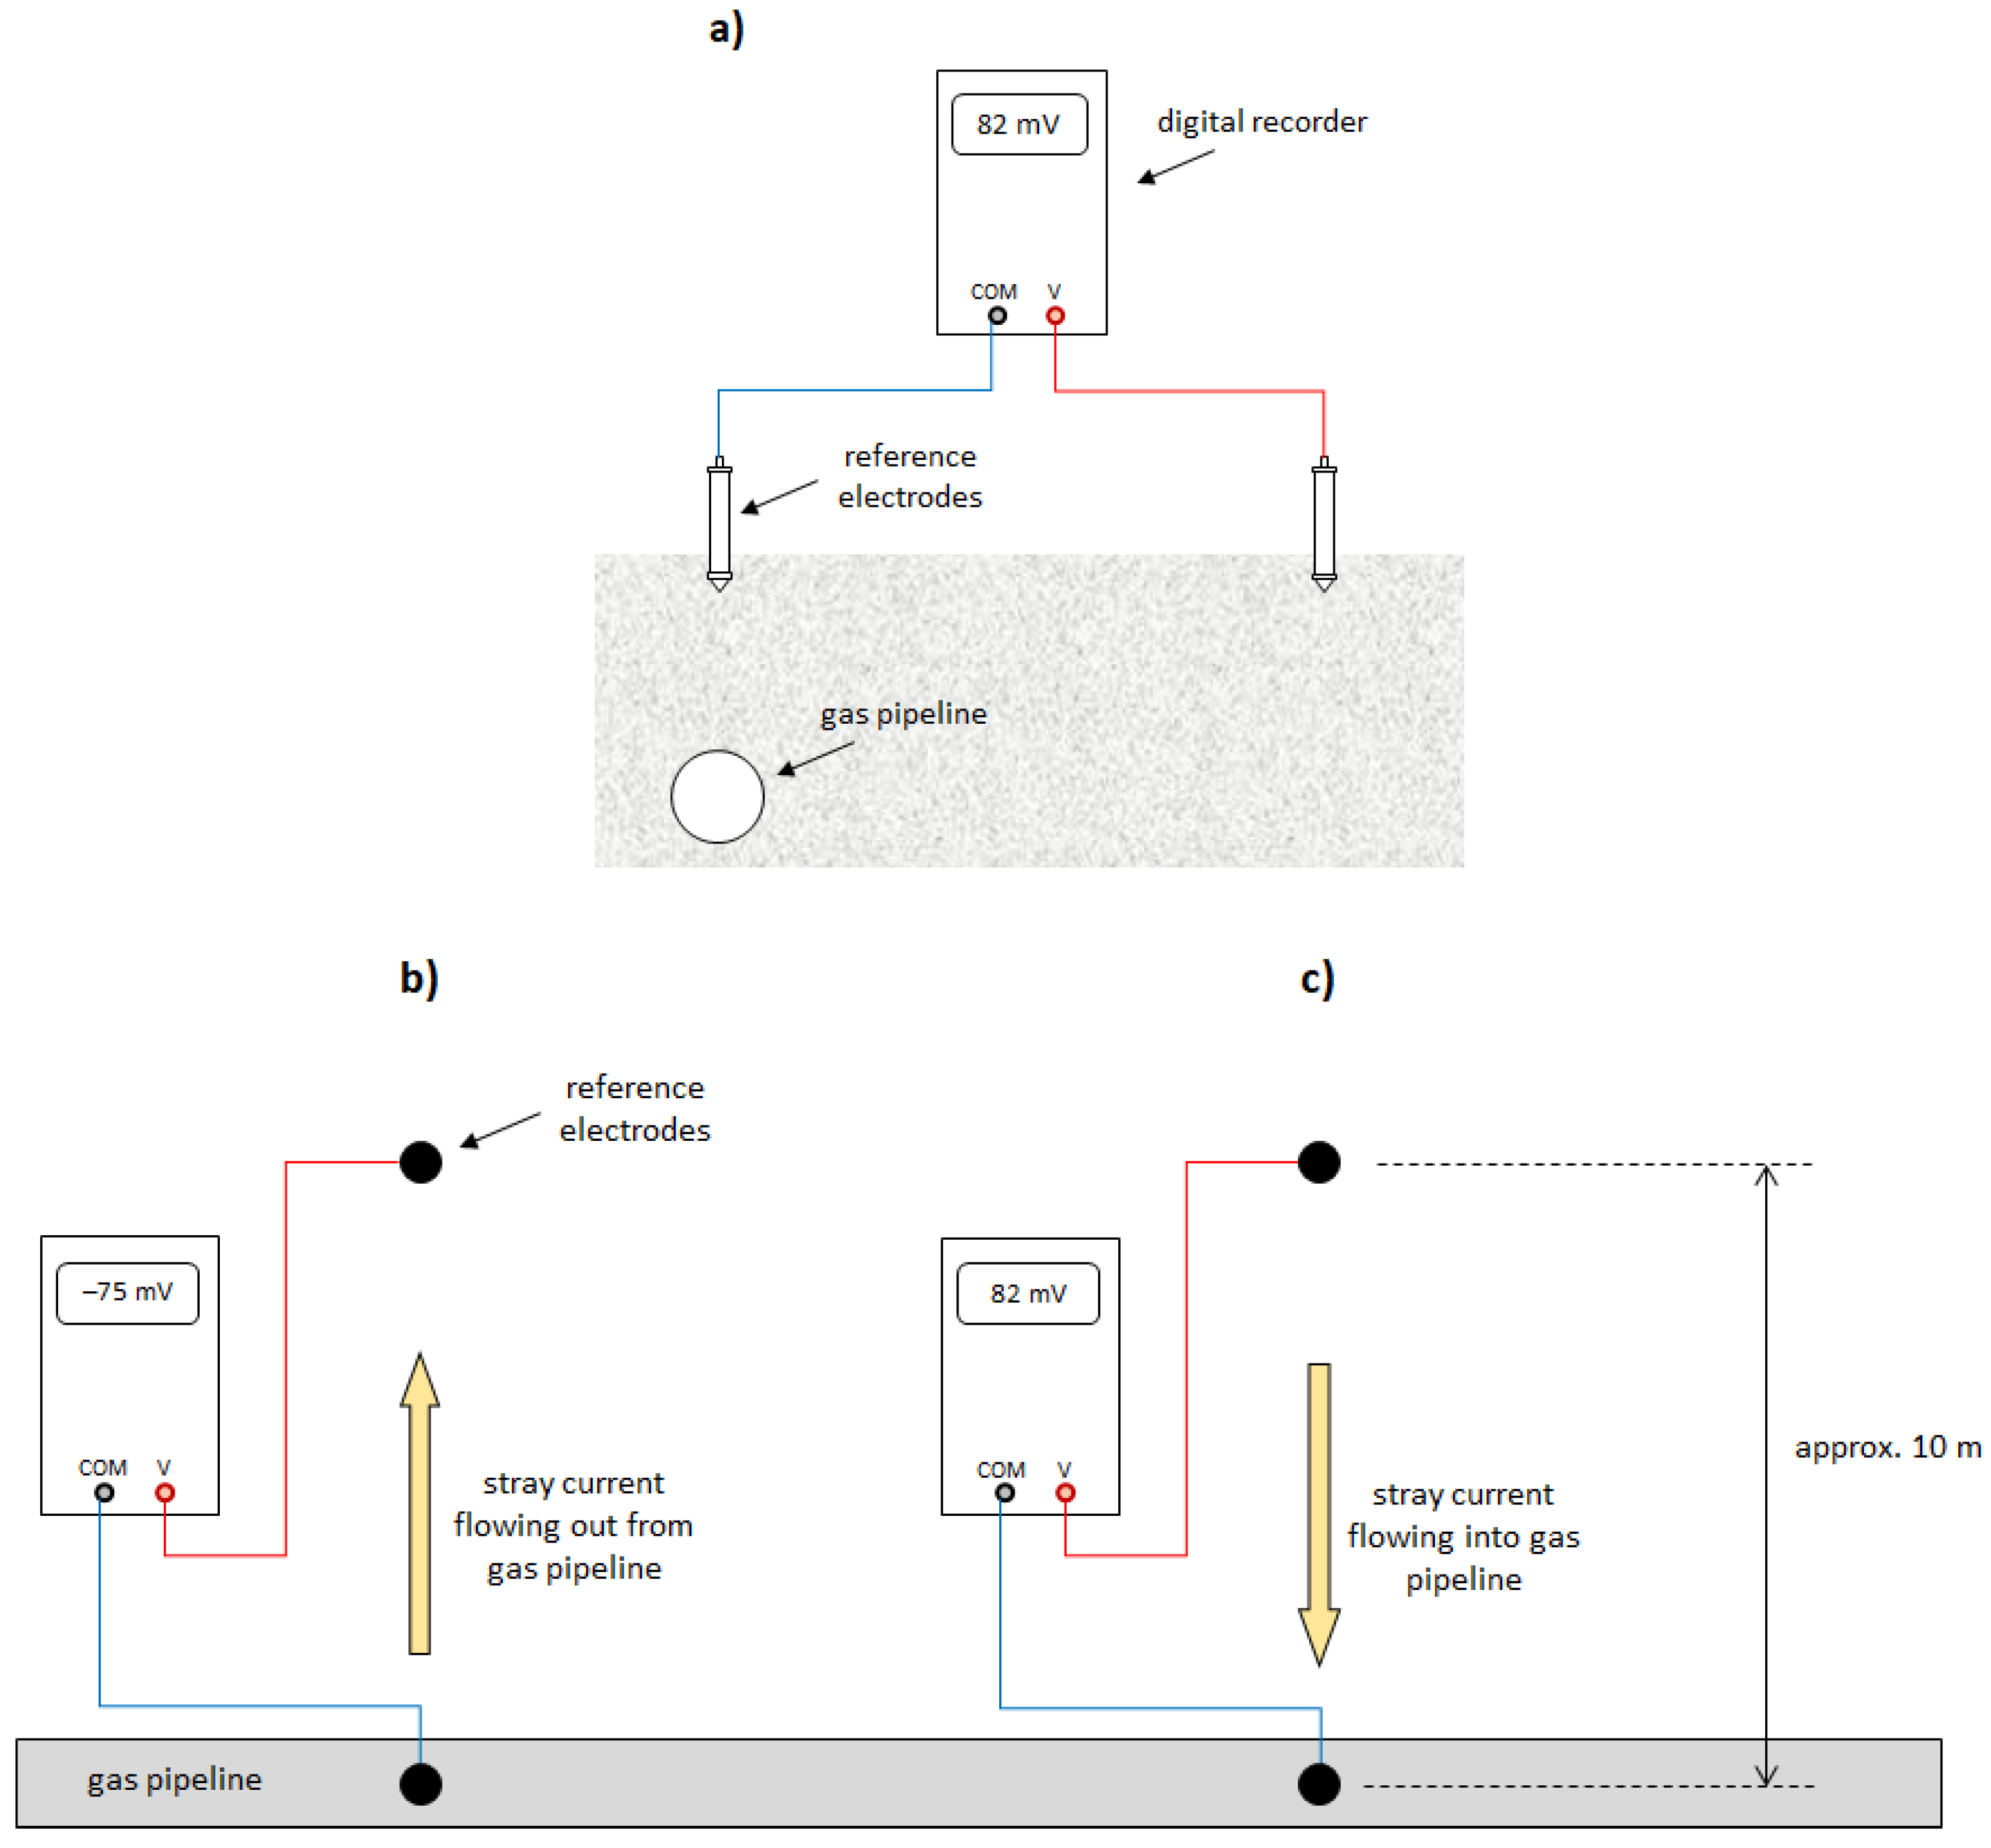

Figure 6.
Scheme of electric field gradient measurement at a gas pipeline: (a) side view, (b,c) top view. Location of: (b) point where current flows out pipeline, (c) point where current flows into the pipeline.
Figure 6.
Scheme of electric field gradient measurement at a gas pipeline: (a) side view, (b,c) top view. Location of: (b) point where current flows out pipeline, (c) point where current flows into the pipeline.

| Method summary | |
| measured quantity: | potential gradient on the ground surface |
| measuring equipment: | voltage recorder, two Cu/CuSO4 reference electrodes |
| what conclusion can be drawn: | determining the locations where stray currents flow from the pipeline into the ground (anodic zones on the pipeline) based on the potential gradient direction |
3.3. Correlation Method ‘E = f(U)’ for Testing the Impact of Stray Currents on Gas Pipelines
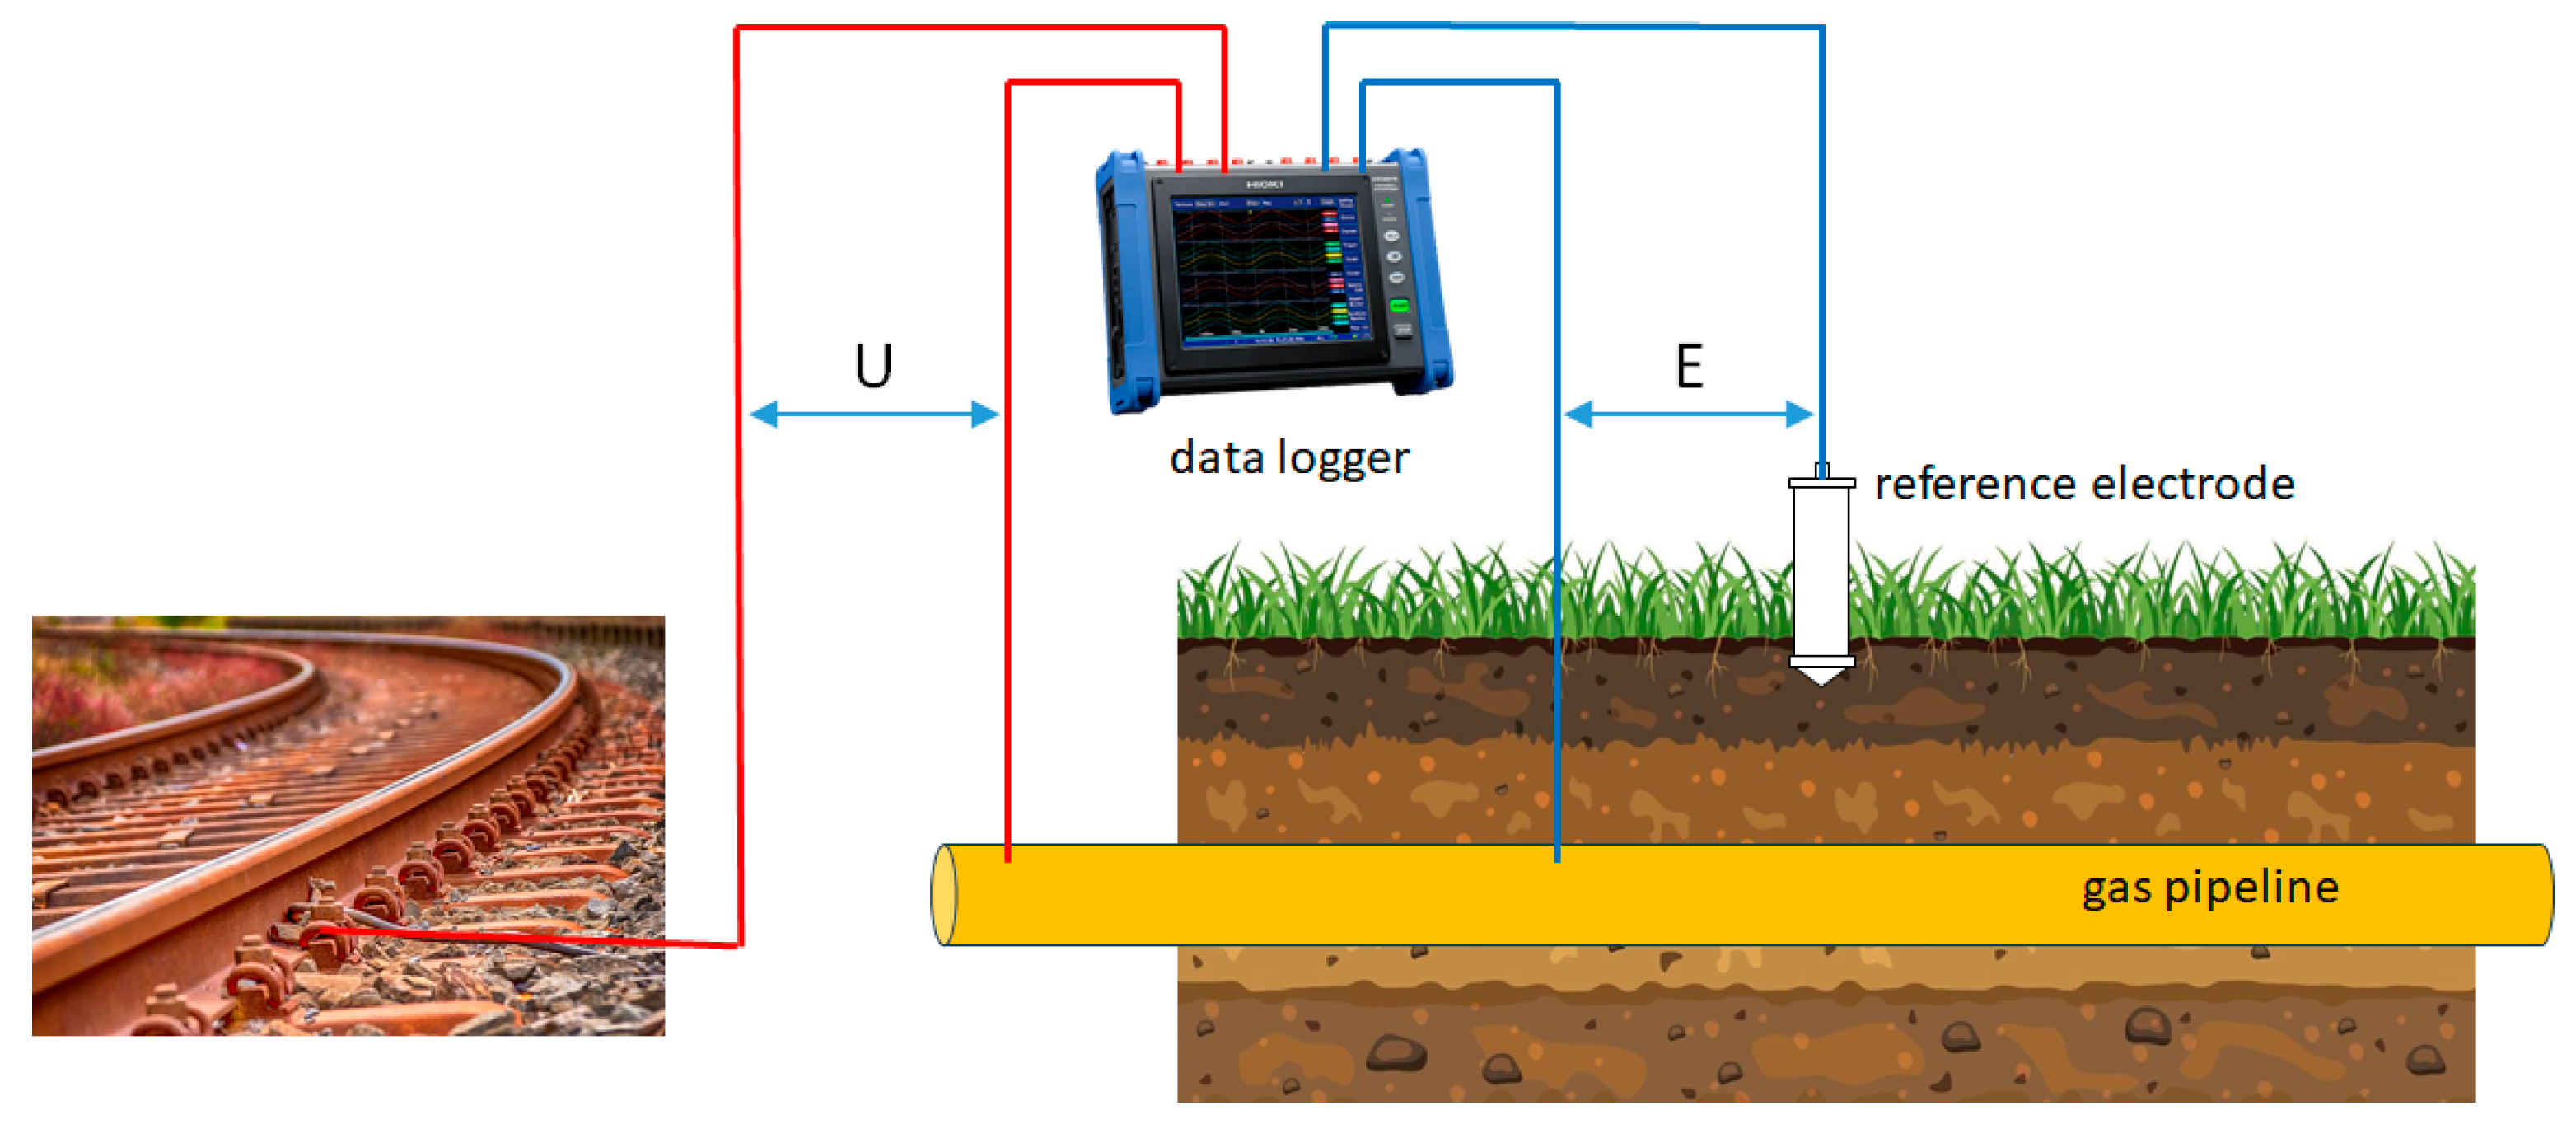
This method examines the correlation between changes in two physical and electrochemical quantities related to the impact of stray currents from DC electric traction systems. One of them is a physical quantity related to the cause of the impact of stray currents on gas pipelines—it is the voltage U of the gas pipeline relative to tram or railway traction rails, which is directly proportional to the intensity of stray currents flowing through the gas pipeline. The second quantity is the electrochemical effect of stray currents, i.e., changes in the potential E of the gas pipeline due to induced cathodic and anodic polarization. Next, the relationship E = f(U) is analyzed. The measurement system scheme is shown in Figure 7. Measurements are taken during periods of maximum impact, i.e., during the morning and afternoon rush hours. The measurement duration should be no less than 20 min for tram traction and 30 min for railway traction. The sampling frequency of the measured signals should be at least 4 readings per second [56]. In special cases, 24-h measurements are carried out [33].

Figure 7.
Scheme of the measurement system in the stray current correlation method.
The risk of corrosion of a gas pipeline due to dynamic stray currents occurs when periods of anodic polarization of the gas pipeline prevail [4,56,57]. If periods of cathodic polarization of the gas pipeline prevail, there is no risk [58,59]. The dynamically changing potential values recorded must therefore be analyzed and compared with the ‘base’ potential value of the gas pipeline, i.e., the potential of the gas pipeline in the absence of stray currents. This value is referred to as the stationary potential ES. One way to determine the ES potential is to measure its value at night when there is no electric locomotive traffic on the tram (or railway) traction. However, this is not necessary in the correlation method, as the ES value is determined by linear regression from the relationship E = f(U) and corresponds to the potential value calculated for zero voltage. At zero voltage, the stray current intensity is also zero, so this is the moment when there is no stray current influence. An example of a 24-h record of the gas pipeline potential in the zone of influence of dynamic stray currents and a correlation graph E = f(U) are shown in Figure 8. The ES value calculated by the linear regression method coincides with the average value of the gas pipeline potential during the night, when there is no electric locomotive traffic on the traction.

Figure 8.
Example of a 24-h record of gas pipeline potential E and correlation graph E = f(U).
The test methodology is as follows: the instantaneous values of voltage Ui and potential Ei are recorded synchronously, then the stationary potential of the gas pipeline ES is determined according to Formula (1), and then the asymmetry coefficient γ of the gas pipeline potential changes relative to the ES value is calculated according to Formula (2). The asymmetry coefficient determines the total contribution of anodic polarization periods of the gas pipeline during the measurements. If its value is greater than 50%, the gas pipeline is at risk of electrolytic corrosion caused by stray currents [51] and requires electrochemical protection.
where ES [V]—stationary potential, Ui [V]—instantaneous value of voltage of pipeline relative to rails of the electric traction, Ei [V]—instantaneous value of potential of gas pipeline, N—number of measured signal samples.
where TA [min]—total anodic polarization time of the pipeline, T [min]—duration of the measurement, P—probability of an event that the potential E assumes a more positive value than the stationary potential ES, NEi>Es—the number of signal samples, for which the instantaneous value of potential Ei is more positive than ES, N—the number of all readings.
The measurement should be performed during peak traffic on the railway or tramway, i.e., during the morning or afternoon rush hour. The length of the rail potential measurement should be equal to the time it takes for an electric locomotive to travel through a section of traction powered by a single substation. In the case of a tram network, the length of a section powered by a single substation is usually 3–4 km. Reducing the distance between electrical substations, i.e., the use of several return cables between the rail and electrical substation, is also recommended as a measure for reducing the quantity of stray currents [60]. It takes a tram about 20 min to travel through such a section (travel, stops, intersections, etc.). The distance between railway substations is usually about 20 km, and it takes a train about 30 min to travel this section. Therefore, it was assumed that the measurement should last 20 or 30 min, respectively.
In practice, stray current impact studies are performed at several measurement points along the gas pipeline route. The area most at risk of electrolytic corrosion is where the asymmetry coefficient γ is the highest. This is where the electrochemical protection system for the gas pipeline is designed and installed.
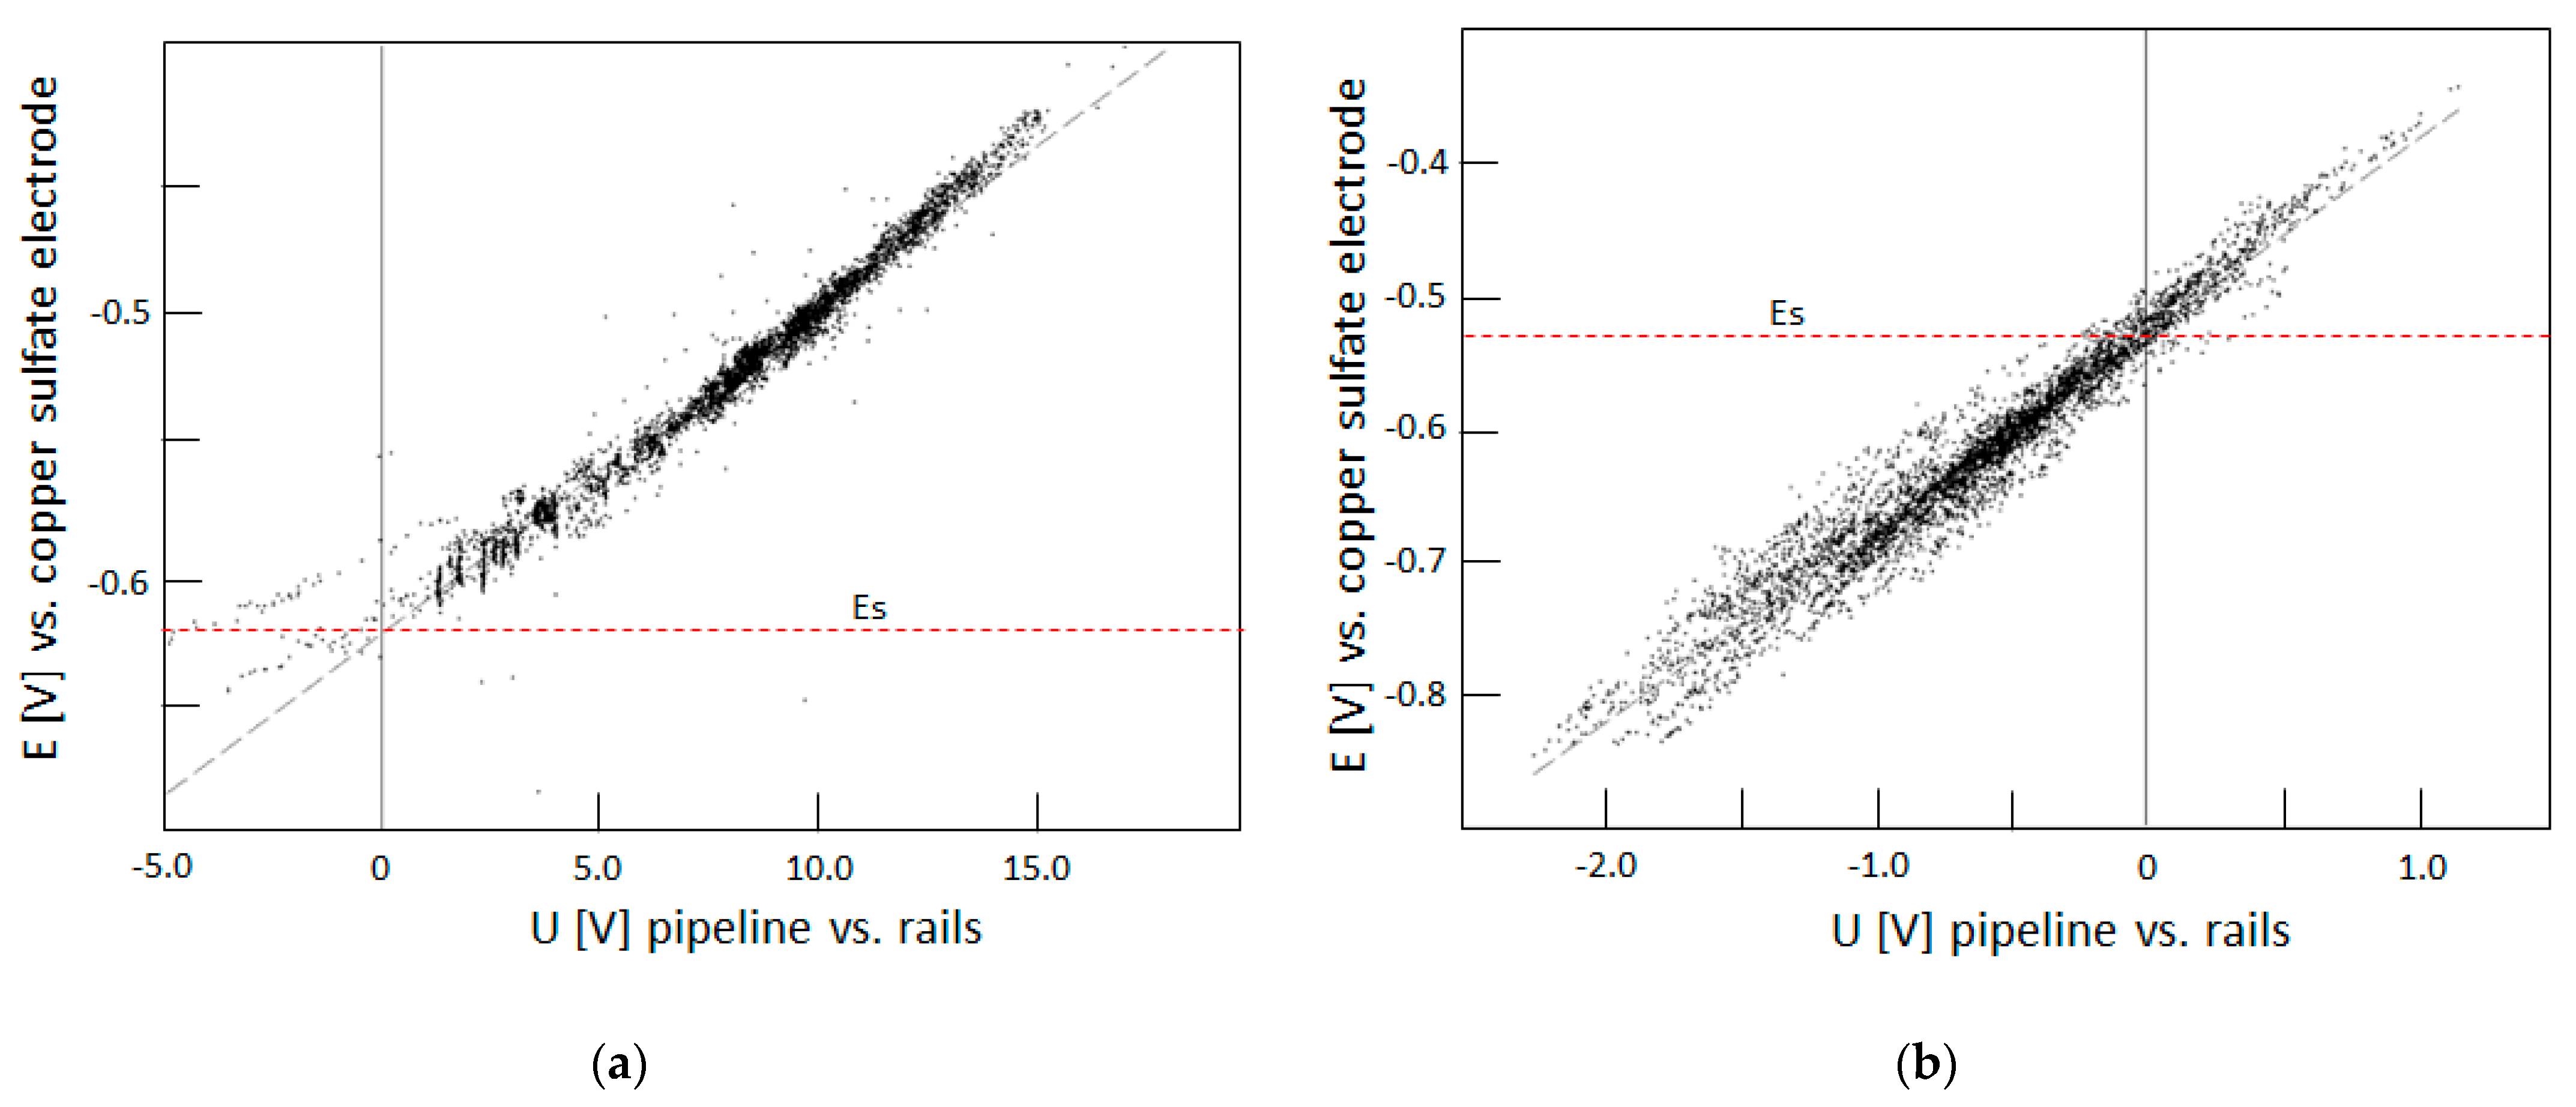
Examples of E = f(U) correlation graphs are shown in Figure 9. The graph in Figure 9a illustrates the high risk of stray currents to the gas pipeline, as there is a very large predominance of periods of anodic polarization of the gas pipeline (potential values higher than the stationary potential ES marked with a red dotted line). In turn, the graph in Figure 9b illustrates the absence of a threat to the gas pipeline at the measurement point—there is a predominance of cathodic polarization periods of the gas pipeline (potential values lower than ES prevail).
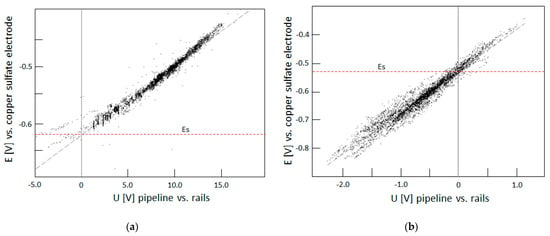
Figure 9.
Examples of correlation charts E = f(U): (a) very high risk of stray currents to the gas pipeline, (b) no risk of stray currents.
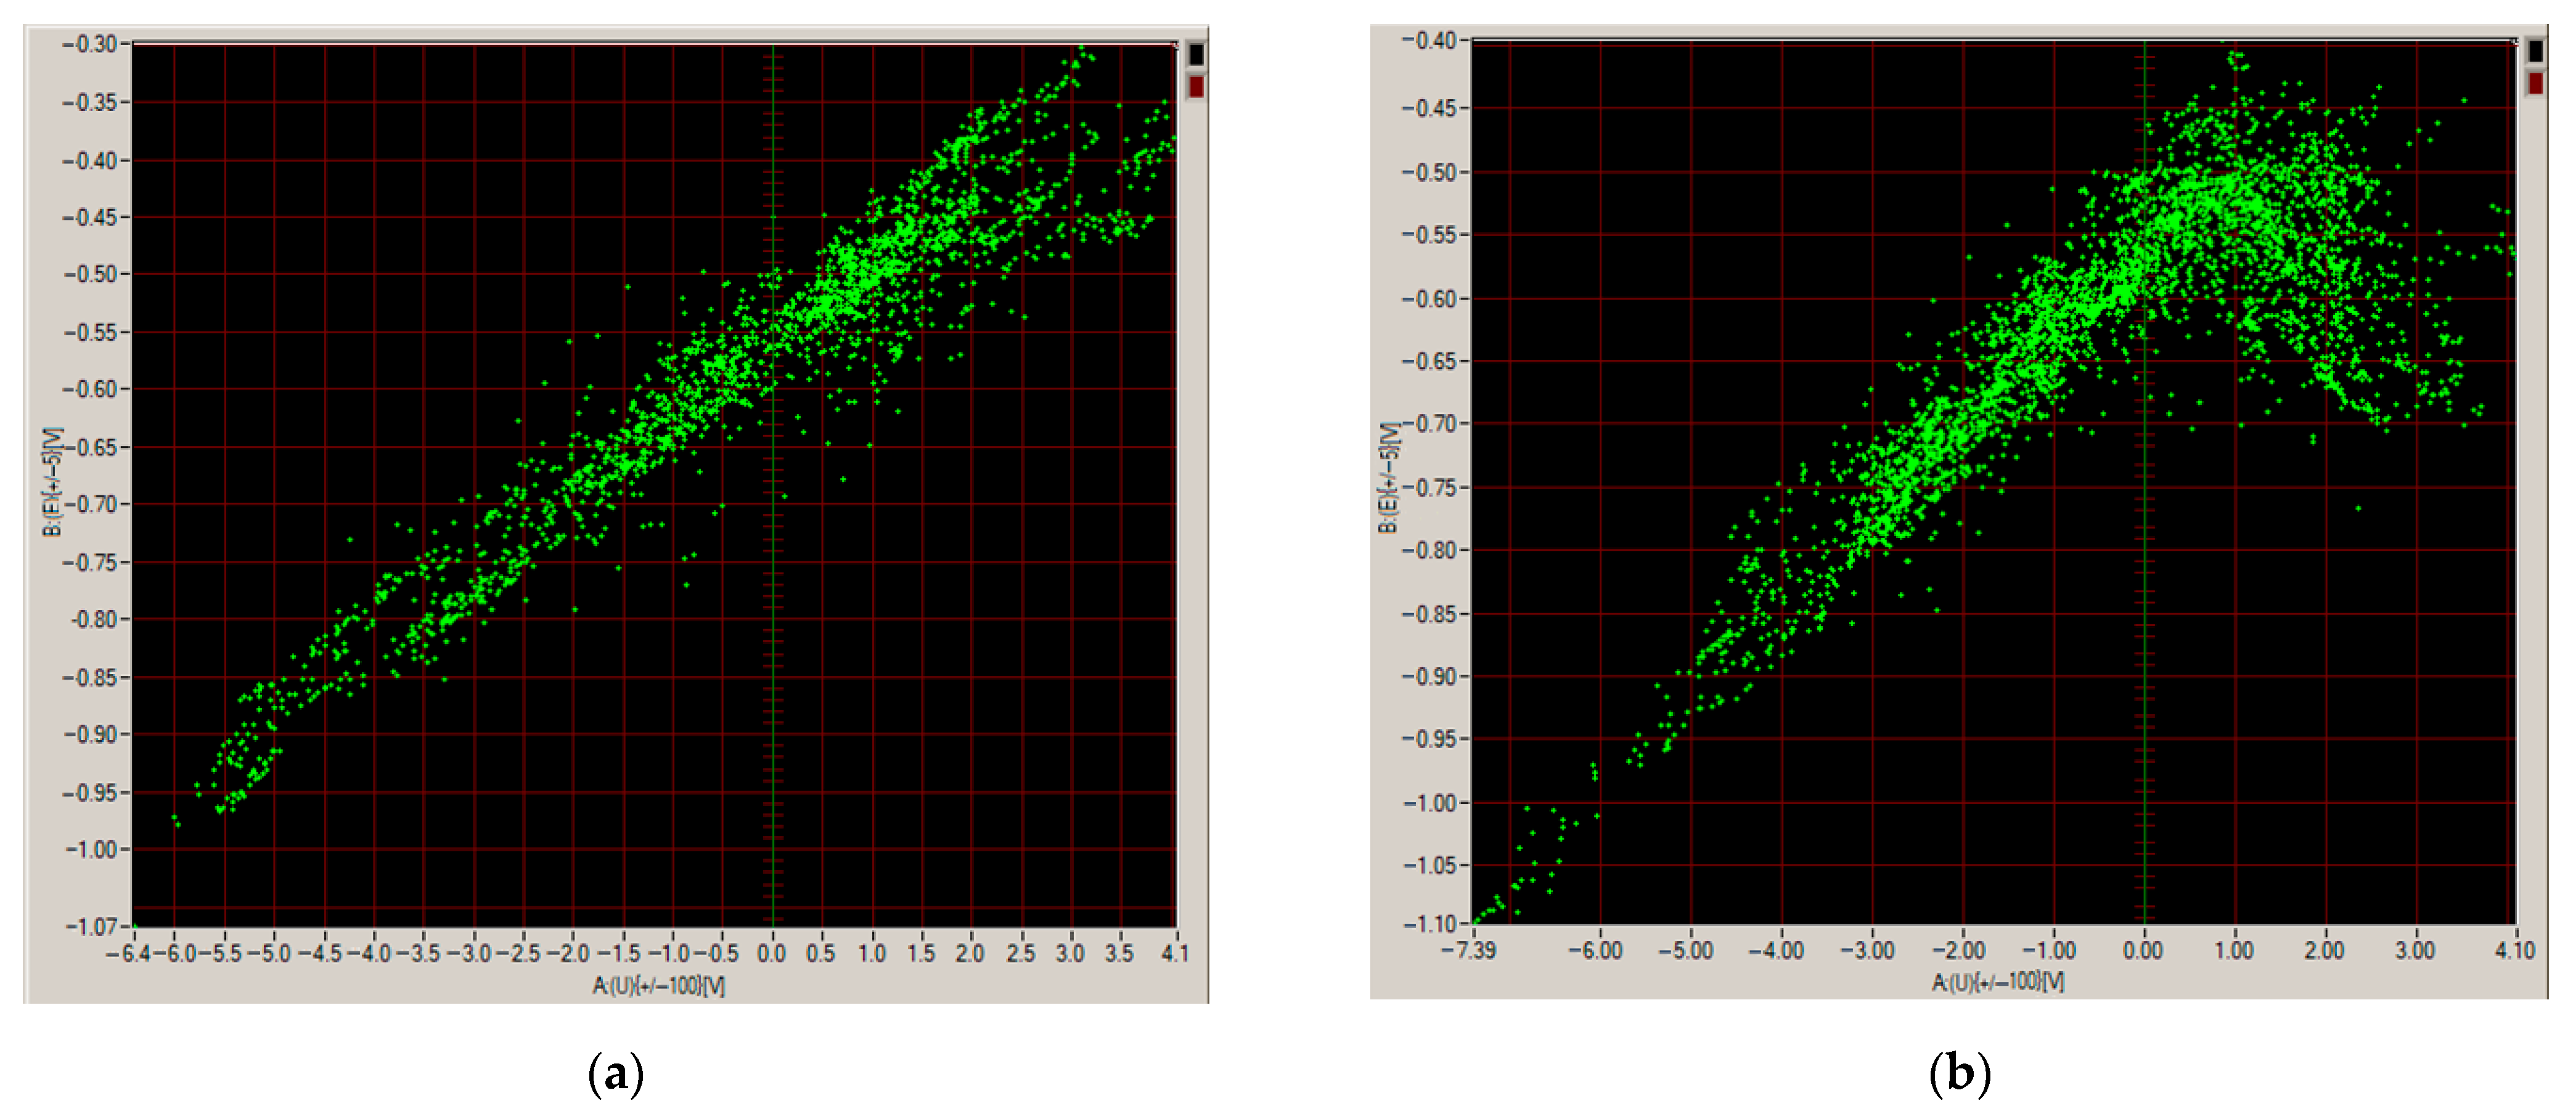
The correlation method allows the assessment of the effectiveness of stray current protection systems, the most basic of which is polarized electrical drainage. The graph in Figure 10a was obtained under conditions without the protection of a gas pipeline, while the graph in Figure 10b was obtained after switching on polarized electrical drainage. In the positive voltage range, after exceeding the forward voltage of the silicon diode (approx. 0.7 V), a typical bend in the correlation graph towards lower potential values is visible. This indicates the correct operation of the diode and the correct operation of the polarized electric drainage, which reduces the risk of corrosion of the gas pipeline caused by stray currents.
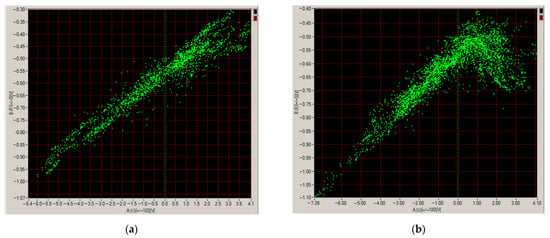
Figure 10.
Typical correlation graphs E = f(U) obtained under the following conditions: (a) without protection, (b) with polarized electrical drainage in operation.
Figure 11 illustrates the effect of switching on the cathodic protection system of a gas pipeline affected by stray currents. Graph (a) was obtained under conditions without electrochemical protection, while graph (b) was obtained after switching on the cathodic protection installation, resulting in a shift in the graph towards lower potential values due to cathodic polarization.
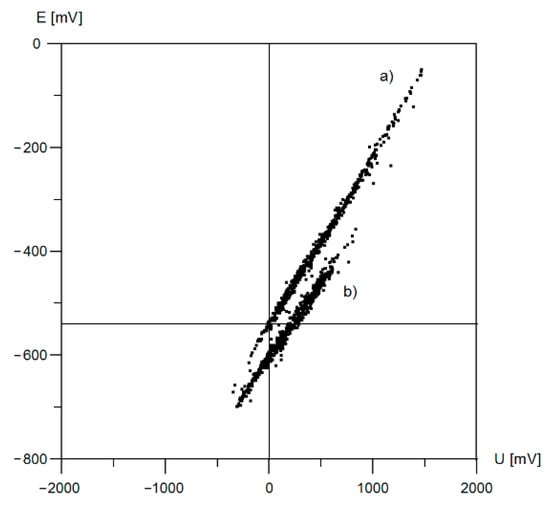
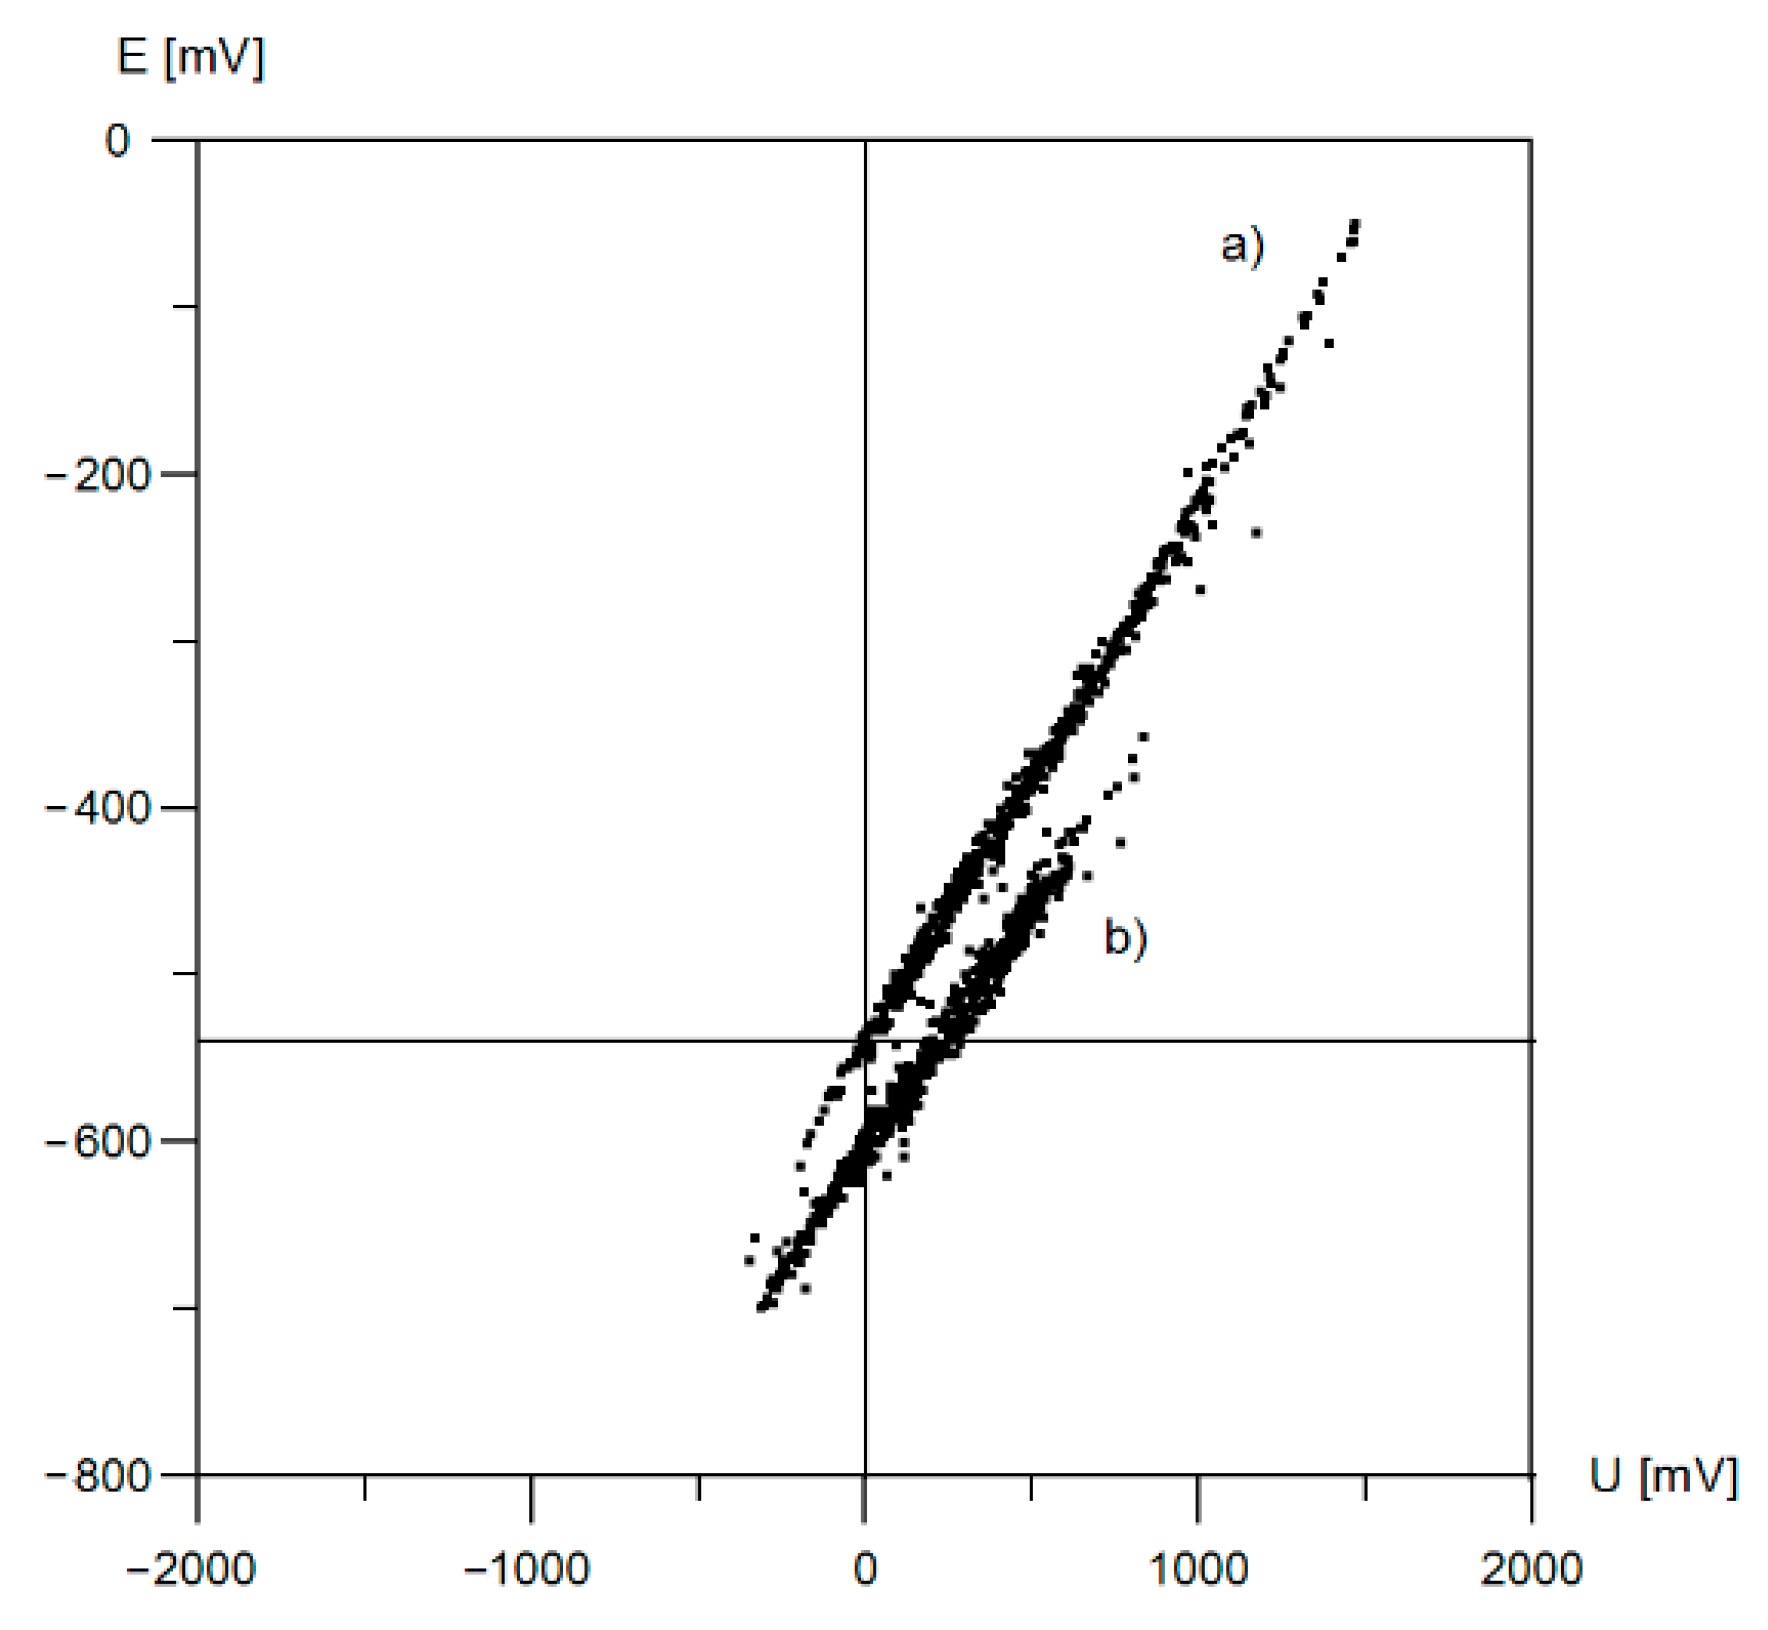

Figure 11.
Correlation graph E = f(U) obtained under the following conditions: (a) without protection against stray current, (b) after switching on the cathodic protection station polarizing the gas pipeline (ICCP).
Figure 11.
Correlation graph E = f(U) obtained under the following conditions: (a) without protection against stray current, (b) after switching on the cathodic protection station polarizing the gas pipeline (ICCP).

| Method summary | |
| measured quantity: | simultaneous measurement: potential of the gas pipeline and voltage of the gas pipeline relative to the rails |
| measuring equipment: | two-channel voltage recorder, Cu/CuSO4 reference electrode, cable connection to the gas pipeline, cable connection to the rail |
| what conclusion can be drawn: | - assessment of the magnitude of the stray current hazard based on the value of the gas pipeline potential asymmetry coefficient at the measurement site, - assessment of the effectiveness of the gas pipeline’s electrochemical protection system based on the shape of the correlation graph E = f(U) and the value of the asymmetry coefficient |
3.4. Correlation Method ‘U = f(E)’ for Testing the Impact of Stray Currents on Gas Pipelines
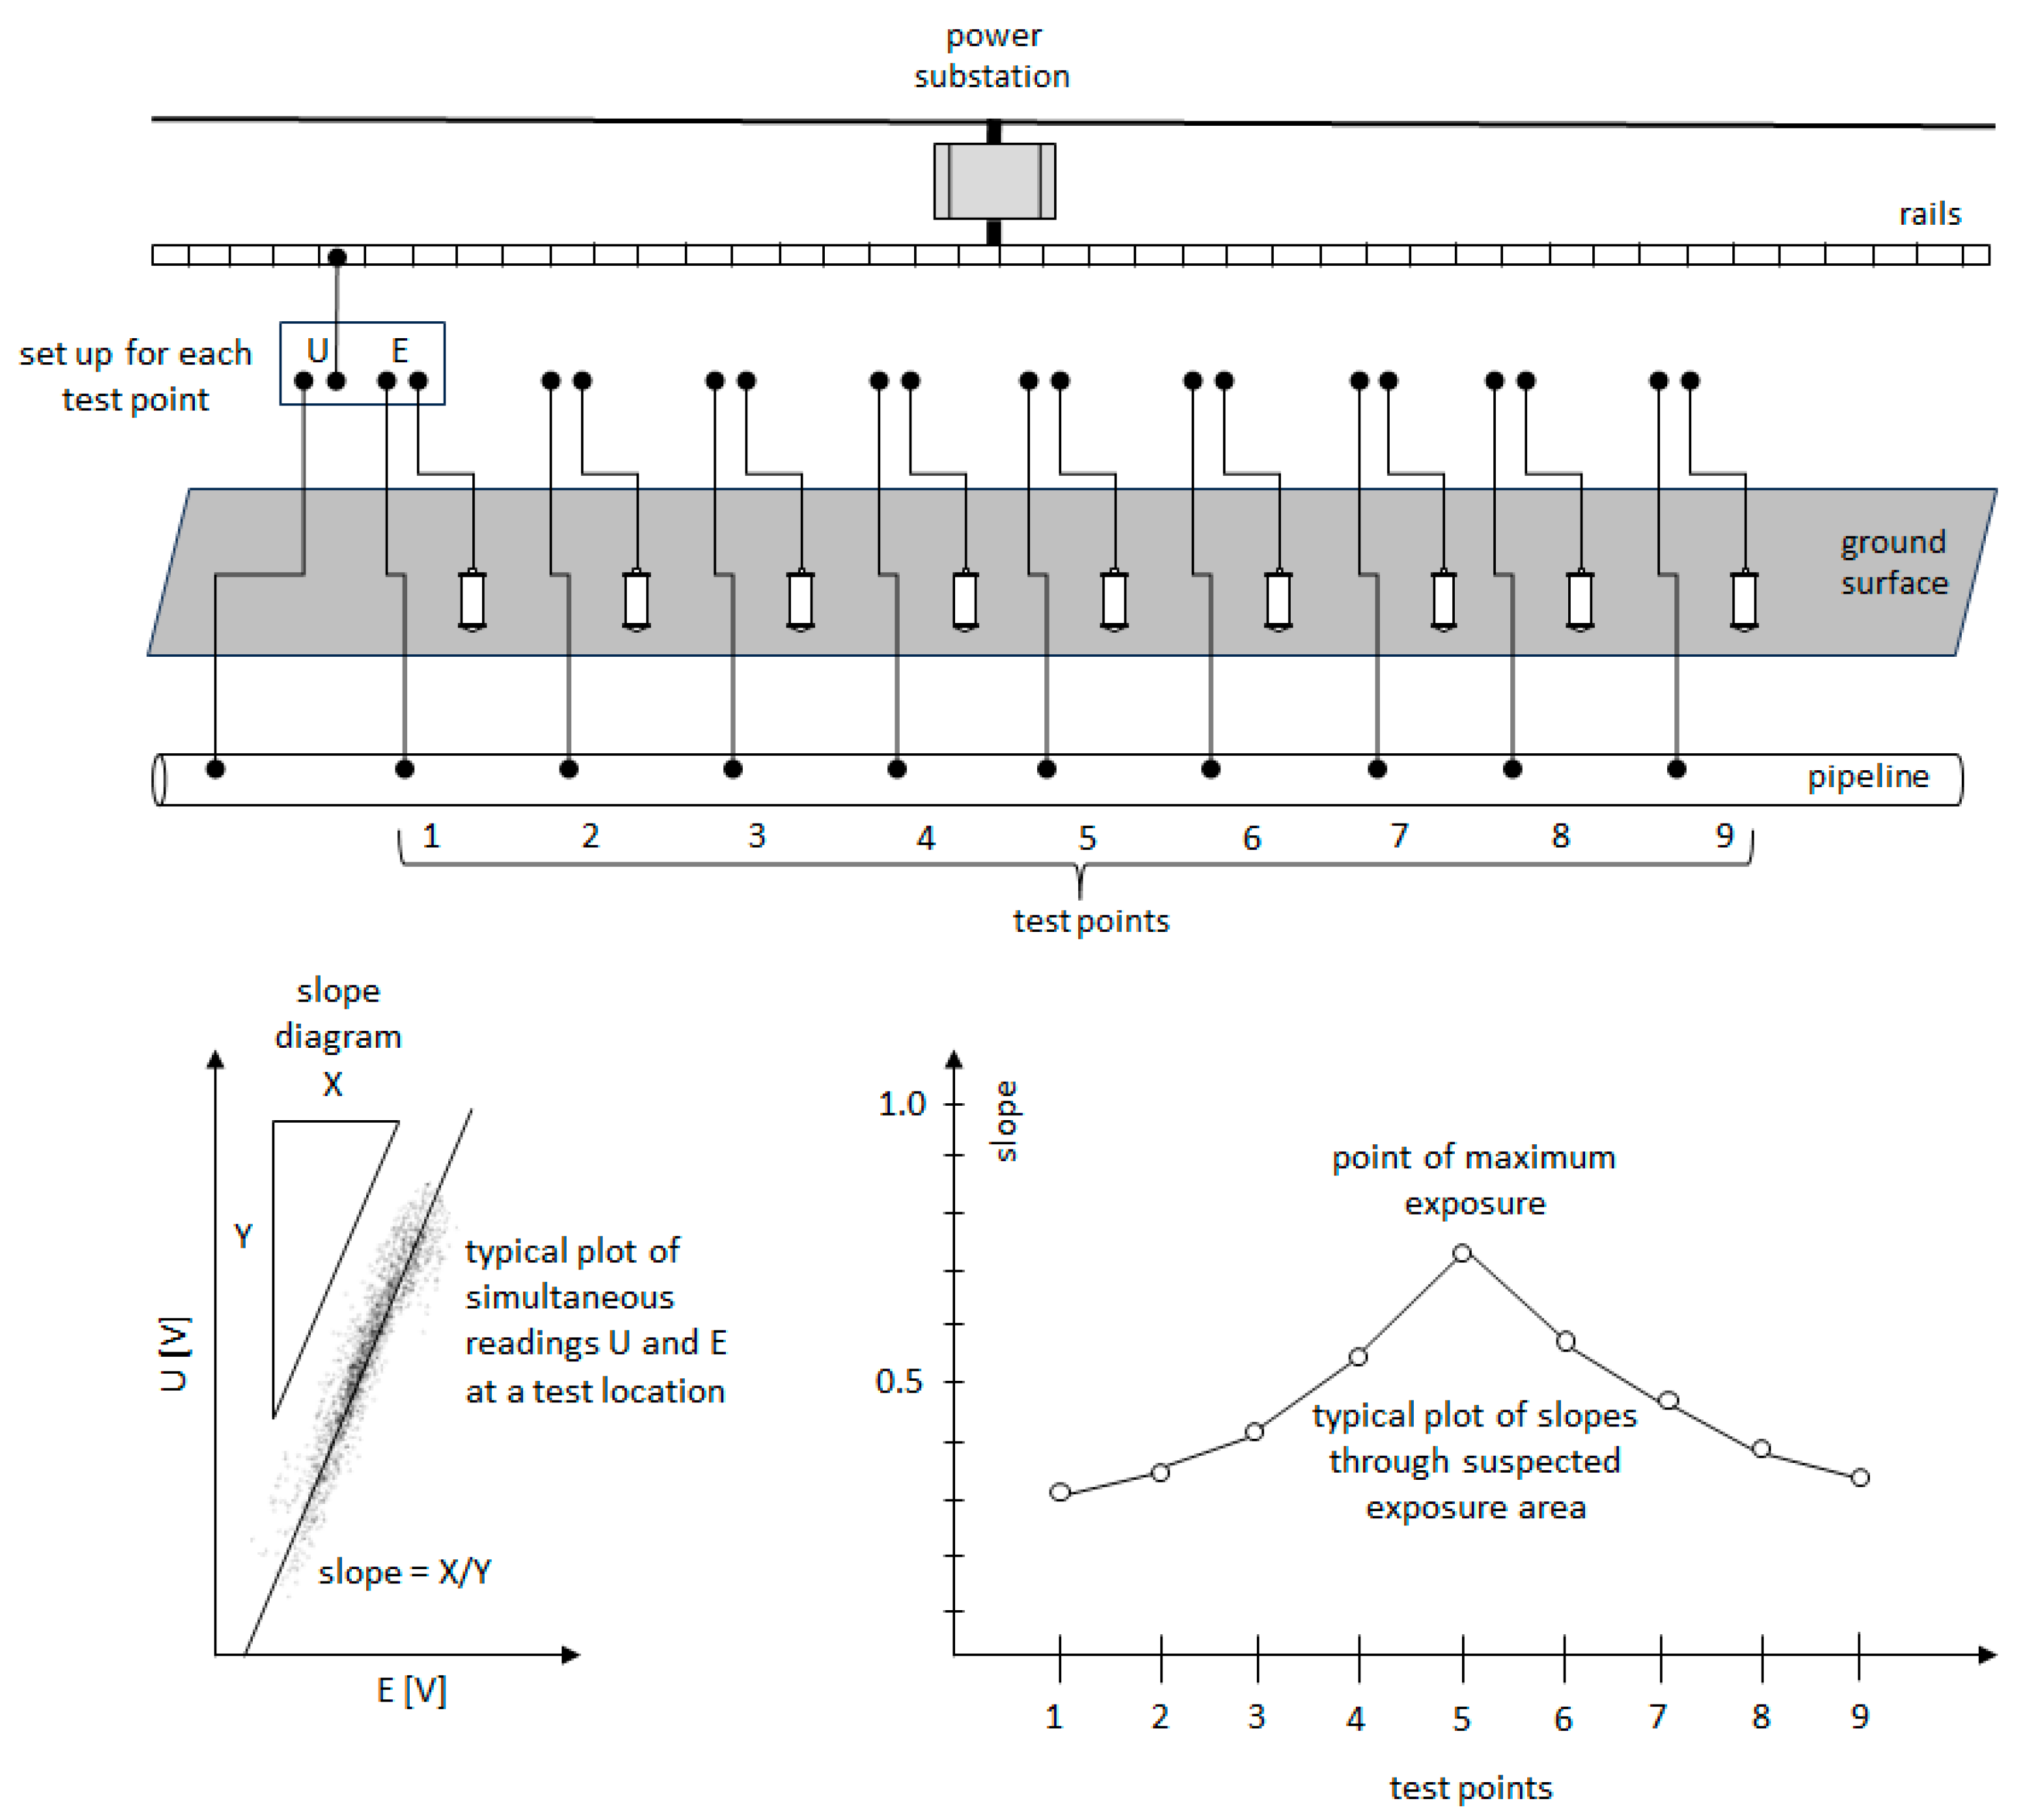
A variation of the correlation method discussed in the previous section is the method presented by Peabody [19]. The same signals are recorded, i.e., the potential of the gas pipeline E and its voltage relative to the traction rails U, but the inverse correlation relationship is analyzed: U = f(E). Conclusions about the intensity of the impact of stray currents on the gas pipeline are drawn based on the slope of the correlation spectrum, i.e., the angle of slope of the linear regression line—the so-called beta coefficient. The slope of the regression line is a measure of exposure: the greater the slope, the greater the exposure. Measurements are taken along the route of the gas pipeline running near the electric rail traction. The result of the research is the so-called ‘beta profile’ along the gas pipeline [20]. The point at which the beta coefficient is the highest is considered to be the place of greatest harmful impact of stray currents. The idea of taking measurements together with the beta profile is illustrated in Figure 12.
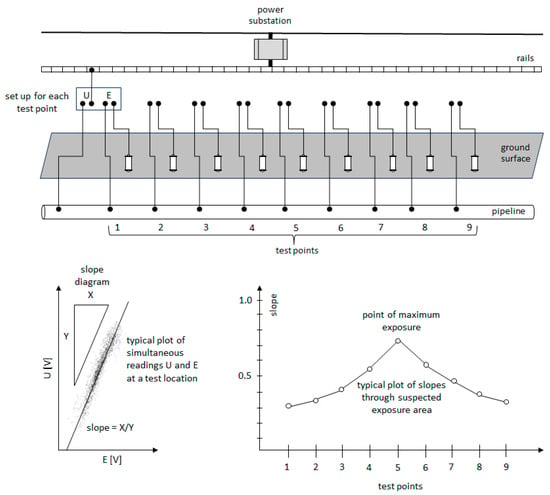
Figure 12.
Determination of the point of maximum stray current exposure (prepared based on the original figure from Ref. [19]).
In the case of gas pipelines with damaged coatings with poor barrier properties and multiple defects (e.g., pipelines over 20 years old with bituminous insulation), measurements taken according to the scheme in Figure 12 will accurately indicate the location of maximum exposure. In the case of pipelines with a coating with high barrier properties (e.g., new gas pipelines with triple LPE insulation), the point of maximum exposure may be located at some distance from the designated location. This may happen when the coating is defect-free here, but there are defects in other distant locations through which stray currents flow from the pipeline into the ground.
The U = f(E) method is also sensitive to changes in soil resistivity along the tested section of the gas pipeline. This affects the measured potential of the pipeline, as it includes an IR component (voltage drop across the resistance between the reference electrode and the pipeline). The value of the IR component increases with increasing soil resistivity. Local soil properties, therefore, affect the slope of the correlation, which can lead to an incorrect determination of the location of the expected greatest impact of stray currents.
In this respect, the correlation method E = f(U) has an advantage, in which the risk criterion refers to the time domain (total length of anodic polarization periods of the gas pipeline) rather than to the potential value. Therefore, in the previous method, changes in soil resistance do not affect the final conclusions regarding the magnitude of the risk of electrolytic corrosion.
| Method summary | |
| measured quantity: | simultaneous measurement: voltage of the gas pipeline relative to the rails and potential of the gas pipeline |
| measuring equipment: | two-channel voltage recorder, Cu/CuSO4 reference electrode, cable connection to the gas pipeline, cable connection to the rail |
| what conclusion can be drawn: | intensity of the impact of stray currents on the gas pipeline based on the slope of the correlation graph U = f(E) |
3.5. Time-Frequency Detection Method of Stray Current Interference on Gas Pipeline
This method is based on comparing changes in power density over time between two recorded signals: the gas pipeline potential and the tram (or railway) rail potential, i.e., the structure subject to interference and the source of interference, respectively. Synchronous records of both potentials are subjected to time-frequency analysis using the short-time Fourier transform (STFT). The obtained spectrograms are compared with each other. If the spectrograms match, this indicates the influence of stray currents on the gas pipeline [61,62,63].
The STFT of the signal u(τ) is described by the relationship given in Formula (3) [64].
where τ—time, g—window function, t—window localization time, f—signal frequency.
The STFT differs from the classical Fourier transform FT described by Formula (4):
The difference lies in the use of the analyzing window function [65] that cuts out a fragment of the signal for analysis. Therefore, not the entire register is analyzed (Fourier transform), but only the part ‘cut out’ by the analyzing window (short-time Fourier transform).
In practical measurements, various analyzing windows are employed [65], including rectangular, Hamming, Hanning, and Blackman ones. However, the Gauss window g(t) is most often utilized, given by Formula (5).
where σ is a parameter characterizing the window width.
The window located at time t cuts out a fragment of the signal (beyond the window frame, the analyzed signal is equal to zero). Next, this fragment is subjected to a classic Fourier transform, and the value |STFT{u(t)}|2 is determined, which is a measure of the energy of the signal components at specific frequencies at a specific moment in time (spectral power density of the analyzed signal). In the next step, the window is moved to the next moment in time. A new portion of the analyzed signal is cut out, for which the spectral power density is determined. By repeating the process of moving the window on the time scale and cutting out subsequent portions of the signal, information about changes in spectral power density as a function of time is obtained. The result of the analysis of the entire measurement record is a spectrogram, which is defined by Formula (6) [66].
A spectrogram is a measure of the energy of signal components at specific frequencies at a specific point in time. The result of the analysis of the entire measurement record is the distribution of the spectral power density of the signal components in the time domain and in the frequency domain, represented as normalized values in the x-y (time-frequency) coordinate grid.
By using the STFT transformation determined in the time domain, the analysis is transferred to the total time and frequency domain. The time resolution and frequency resolution of this analysis depend on the size of the window being cut, i.e., on the parameter σ [67].
The time resolution σt is described by Formula (7):
The frequency resolution σω is described by Equation (8):
where ω = 2πf.
Frequency and time resolution are related to each other by the uncertainty principle (9):
So, increasing the value of σ is equivalent to increasing the size of the analyzing window. This results in a deterioration of time resolution, while frequency resolution increases. Conversely, a deterioration in frequency resolution (reducing the size of the analyzing window) leads to an improvement in time resolution.
In this method, the simultaneously recorded potentials of the gas pipeline and rails should be sampled at an appropriate frequency to obtain data on the power of individual frequency components that make up the analyzed signal. In the case of rail electric traction, the frequency of individual components of the rail potential is usually below 1 Hz and does not exceed 2 Hz [61,68,69,70], so the minimum sampling frequency should be 4 Hz. In accepted practice, the potential value is read 10 times per second.
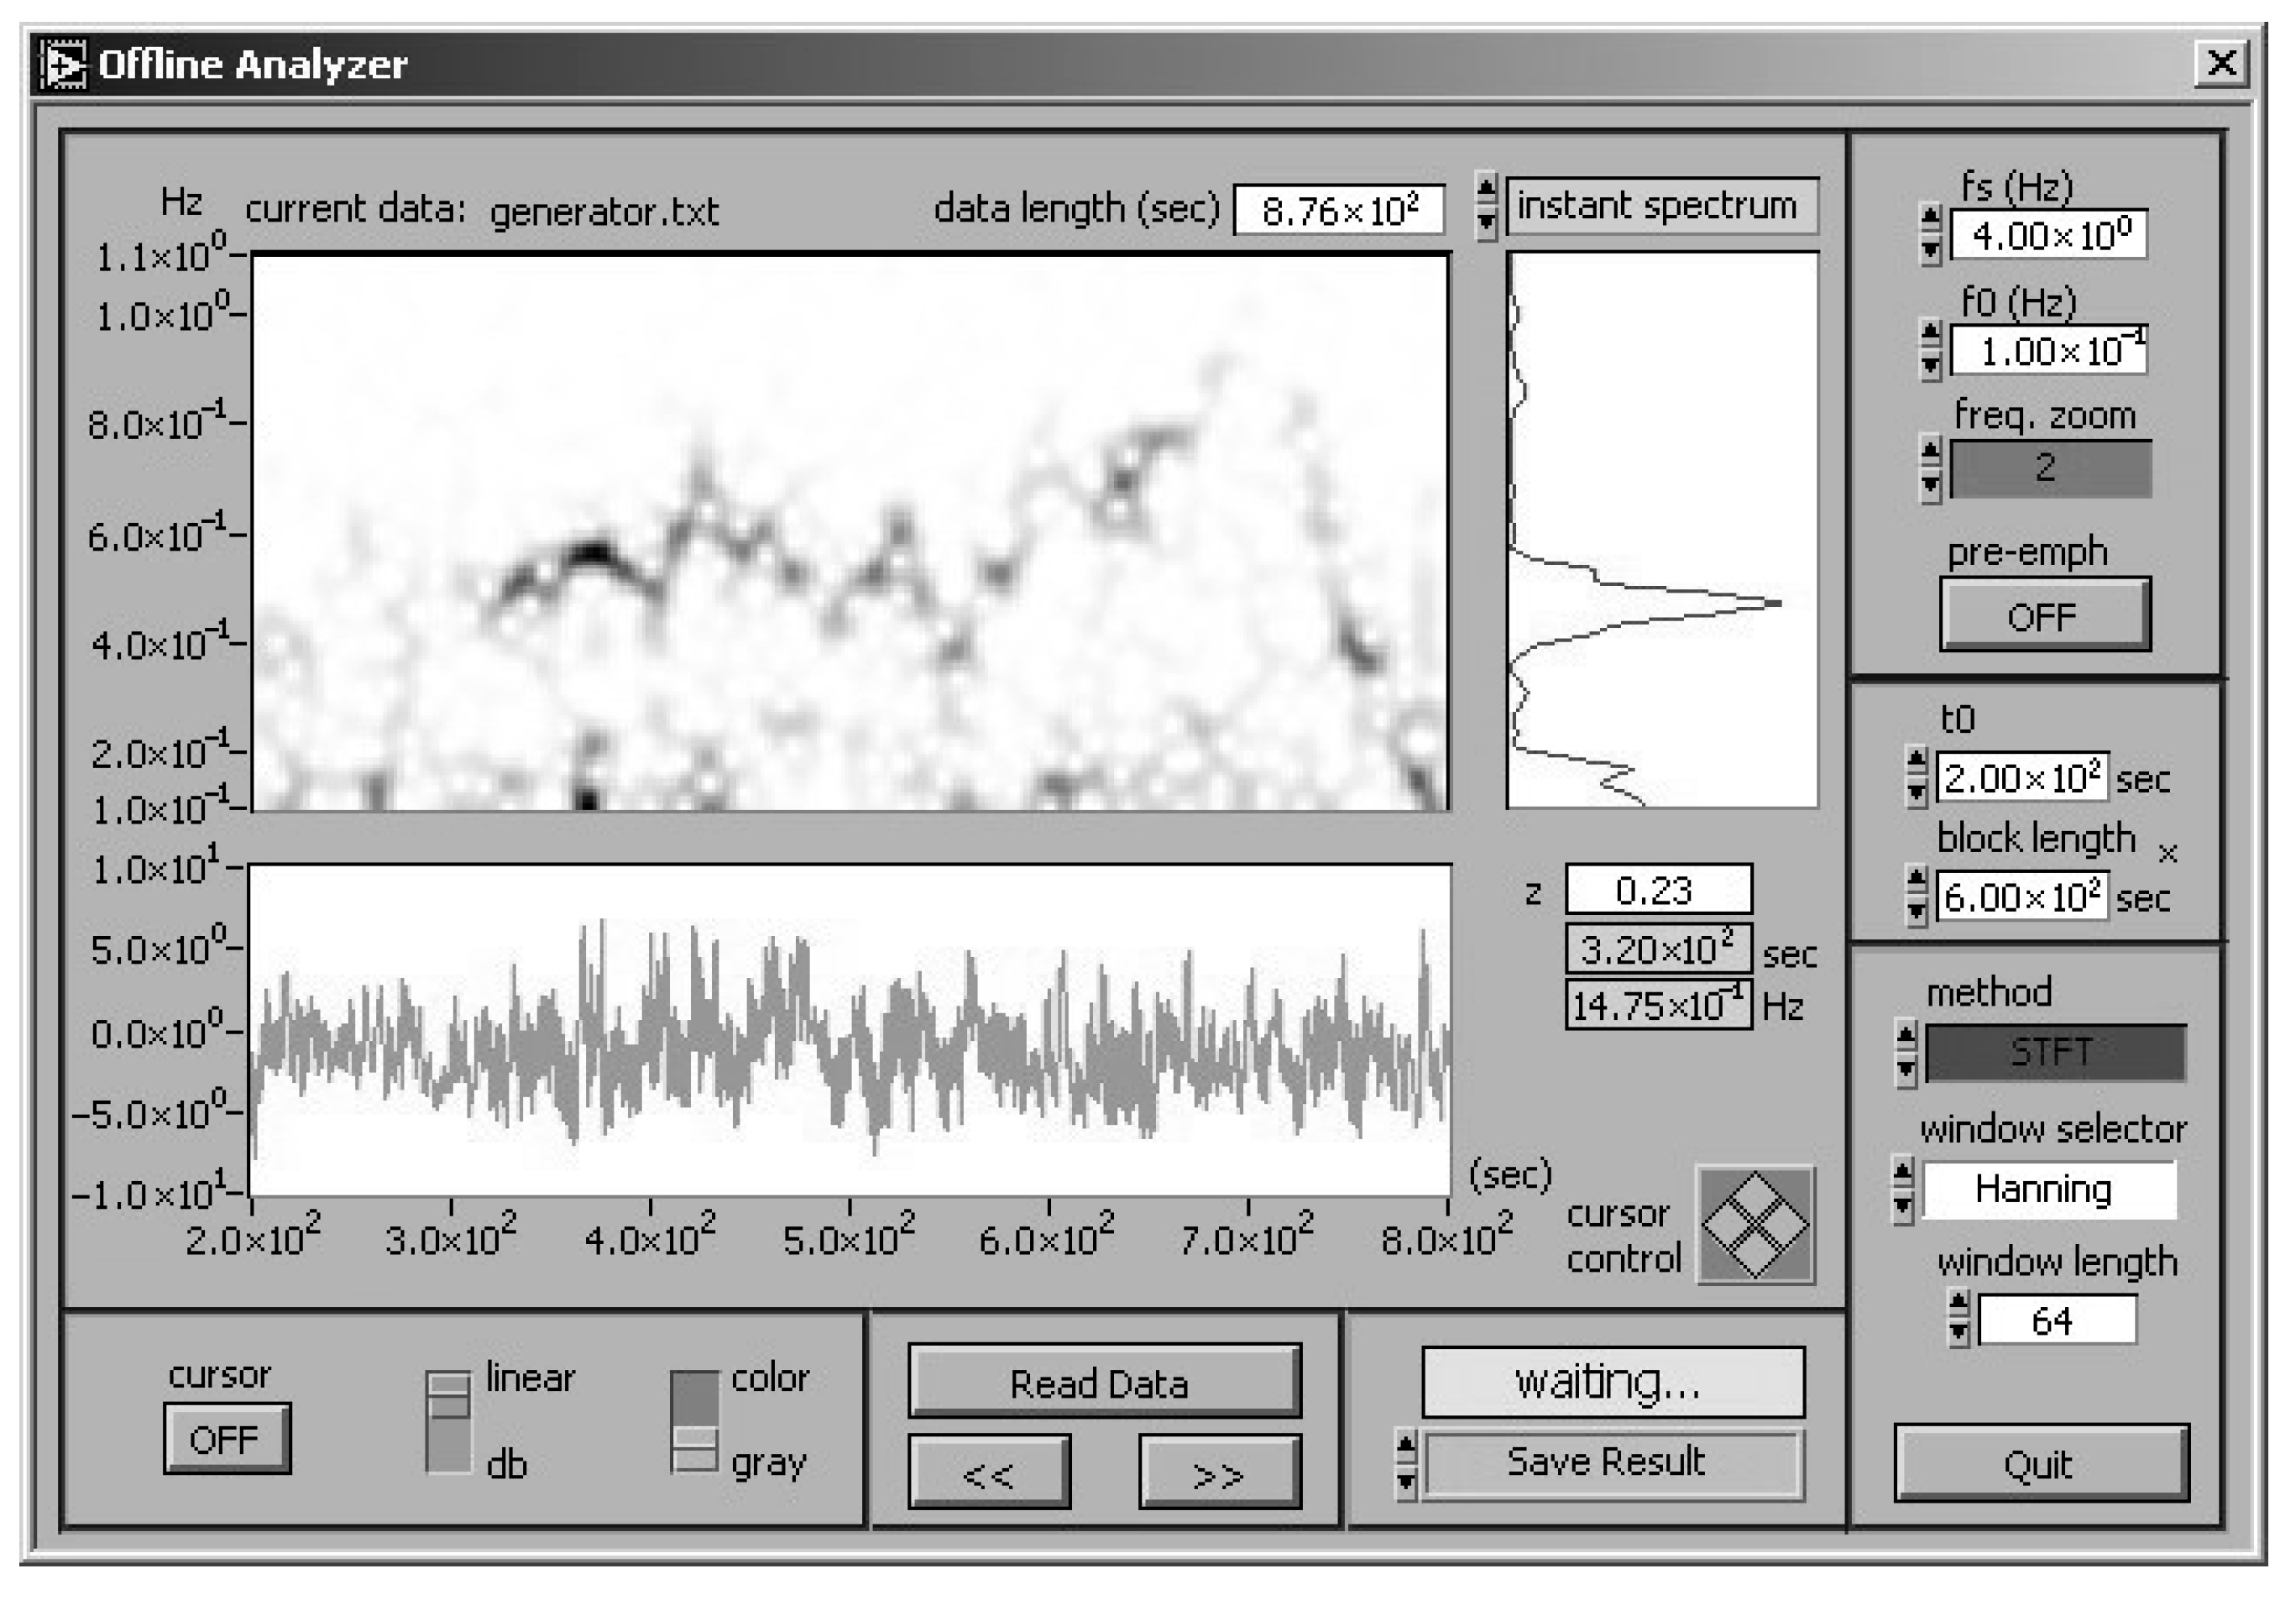
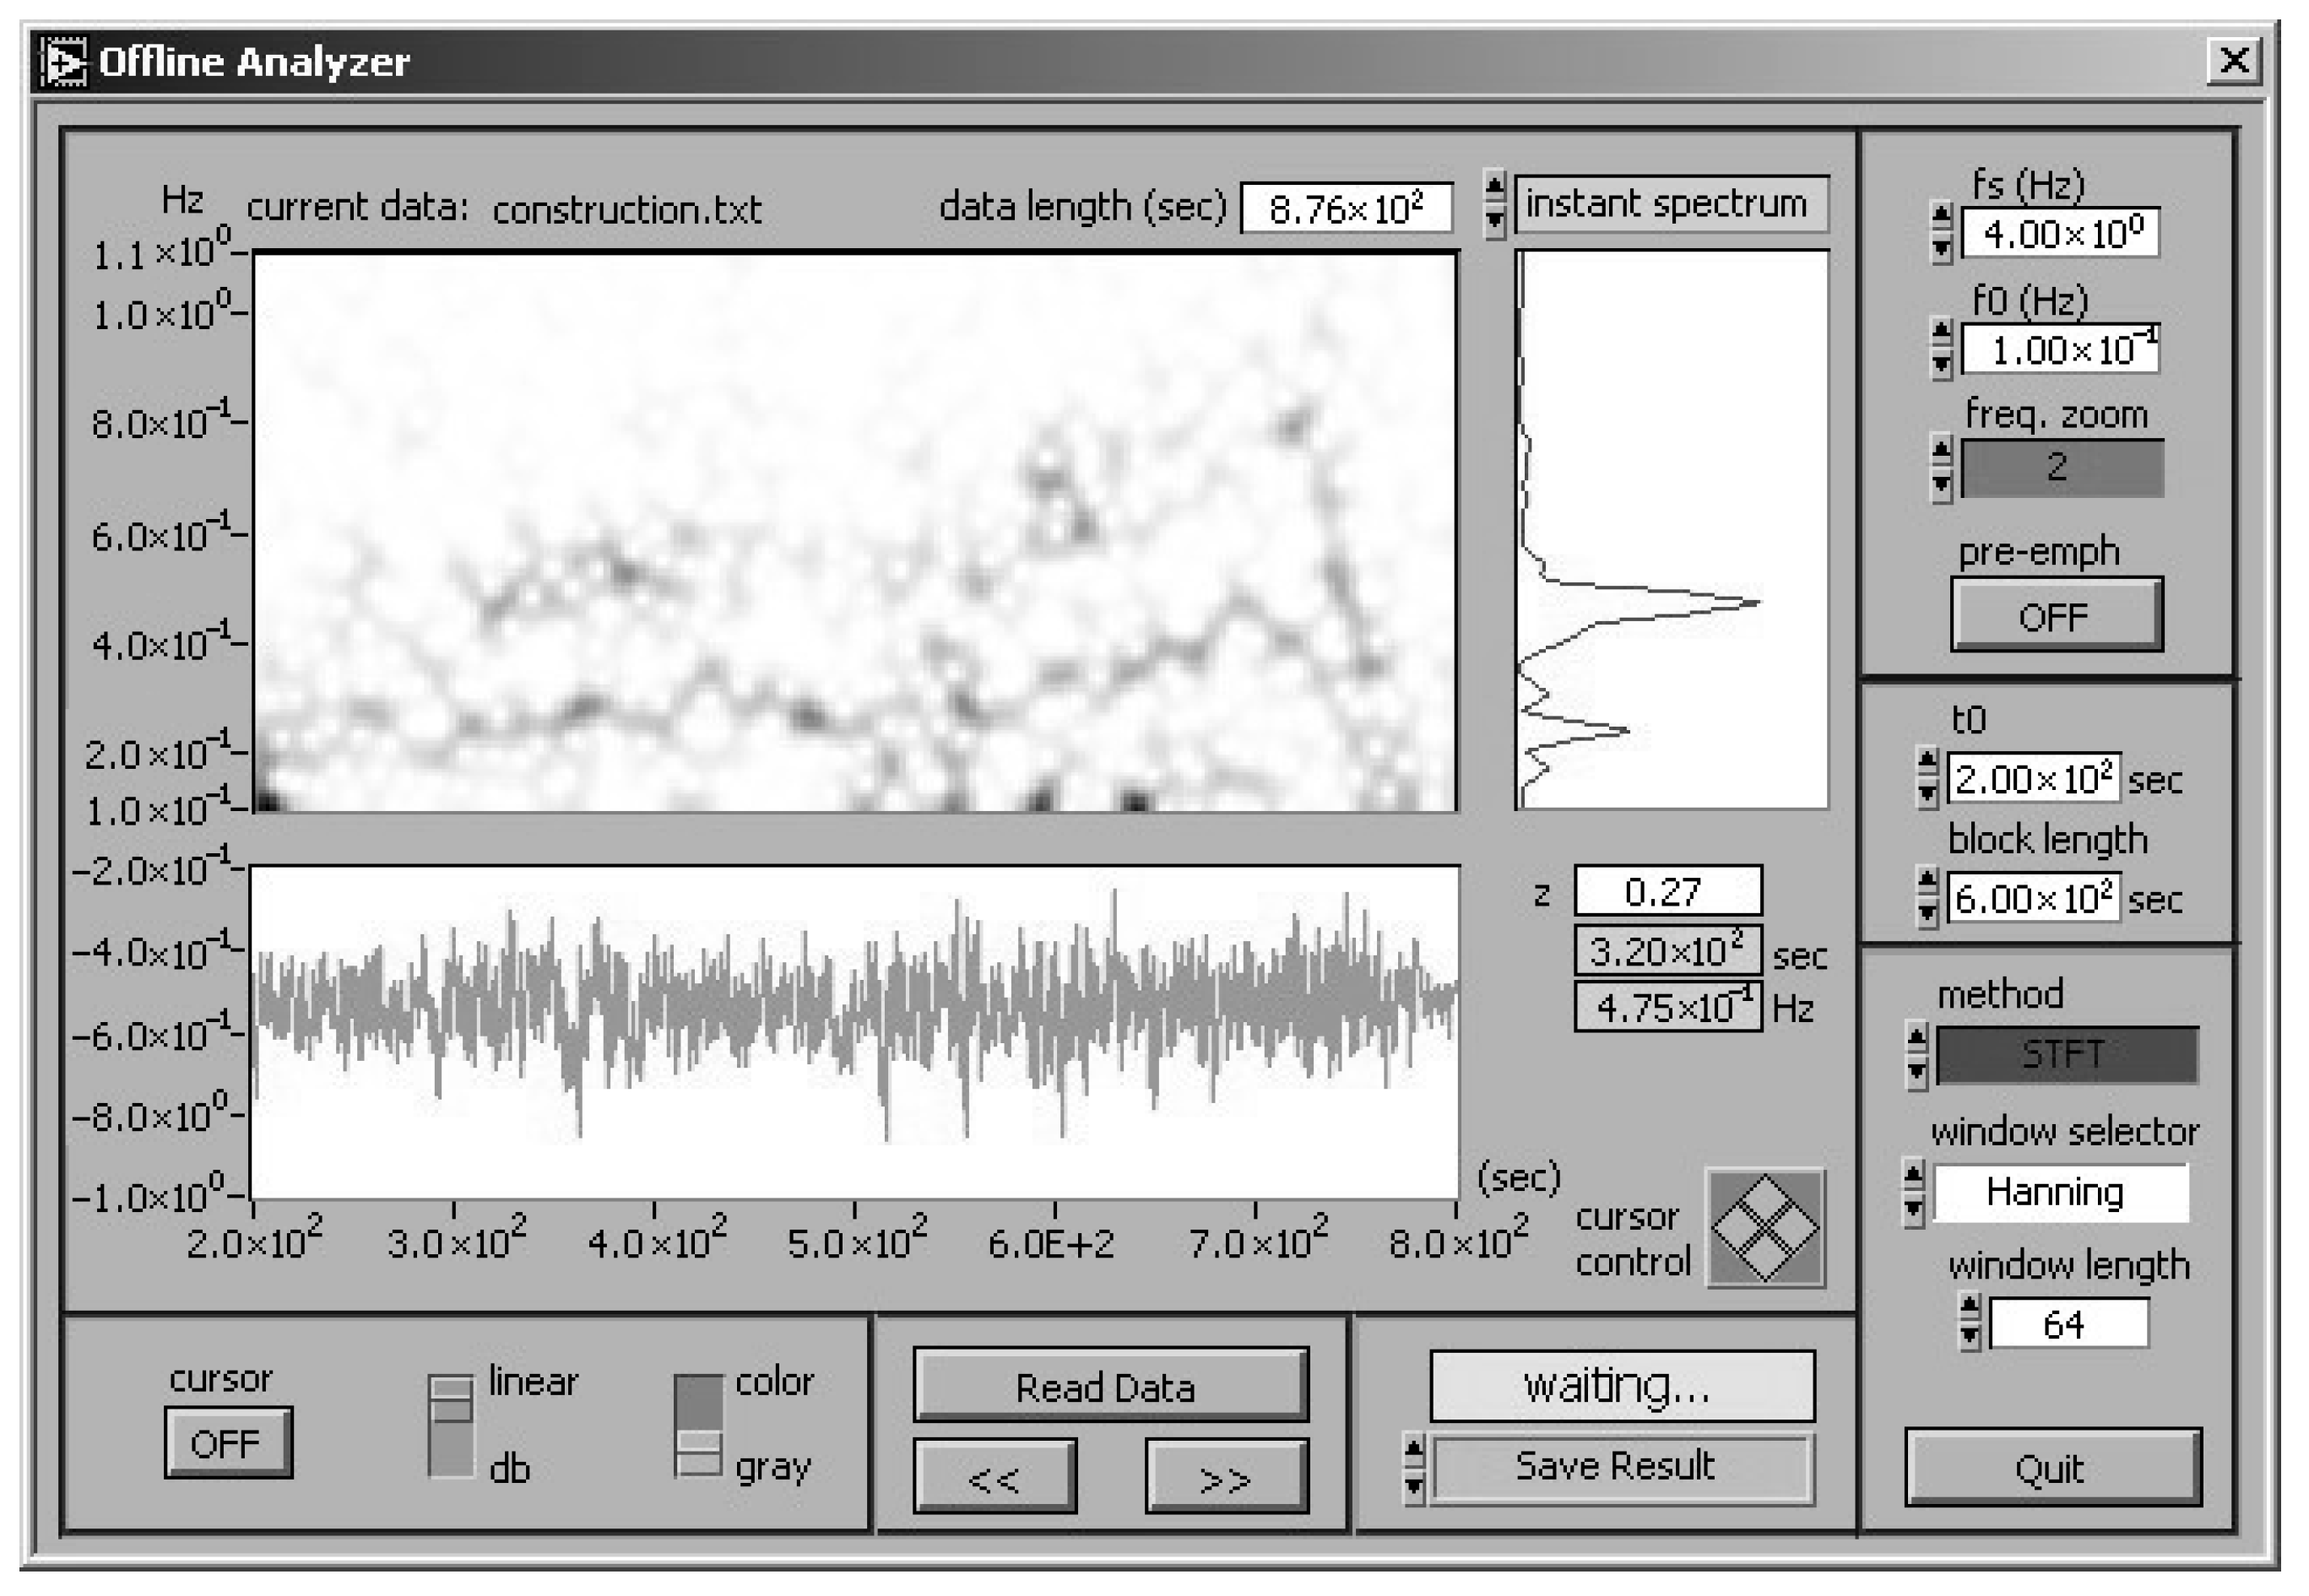
An example of time-frequency analysis is shown in Figure 13 and Figure 14 [71], for the potential of tram rails and the potential of a gas pipeline vs. Cu/CuSO4 reference electrode, respectively. Analysis was performed with LabVIEW 7.1, Joint Time Frequency Analysis software package. A 30-min fragment has been presented of a potential time register and a corresponding STFT spectrogram—they are spectral line compositions of a determined frequency structure. The square of the STFT module yields the spectrogram, which is obtained in the time and frequency domains. Accordingly, it provides a measure of energy leakage from the tram traction. Appropriate time σt and frequency σω resolutions were acquired via selection of the analyzing window’s length according to the uncertainty rule provided by the Formula (9).

Figure 13.
Potential of tram rails versus Cu/CuSO4 reference electrode: fragment of time register (below) and STFT spectrogram (above) (by Zakowski and Darowicki [71]).
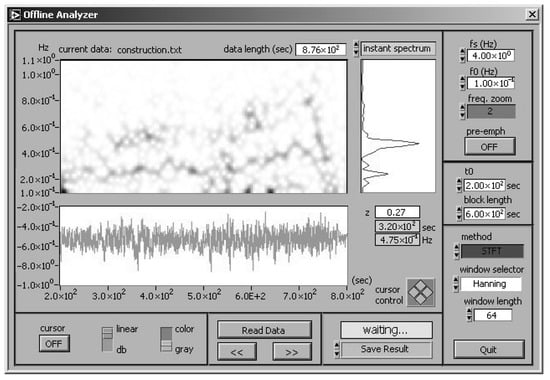
Figure 14.
Potential of gas pipeline versus Cu/CuSO4 reference electrode: fragment of time register (below) and STFT spectrogram (above) (by Zakowski and Darowicki [71]).
In Figure 13 and Figure 14, both potential spectra have a similar form. The signal with the highest energy is recorded for the lowest frequencies, near 0.1 Hz. In the entire time domain, there are small changes in the signal’s energy for these very low frequencies. It is also evident that the signal’s energy takes a minimum at certain time instants beyond 0.2 Hz. At other moments signal’s energy rises in the entire frequency domain (up to 1 Hz range). The shape of the spectrograms (Figure 13 and Figure 14) correlates closely with tram traffic. Signal’s energy is minimum for a no-traffic situation. The energy increases at the passing of the tram.
Accordingly, the presence of spectral lines in the time domain strictly agrees with the times of tram passing. The occurrence of frequency peaks on the spectrogram is a characteristic feature associated with the passing of a tram. The time and frequency location of spectral lines on both spectrograms is unequivocal proof that the stray current generated by passing trams affects the state of the investigated pipeline.
Dong et al. [69] show an example of the analysis of recorded signals using continuous wavelet transform (CWT). CWT transforms signals from the time domain to the frequency domain and allows simultaneous analysis of the signal in both domains. The pipeline potential and the leakage current from the metro station were analyzed. The synchronous changes and similarities between the spectrum of leakage current of the metro station and the spectrum of pipeline potential indicate that the pipeline is subject to stray current interference.
| Method summary | |
| measured quantity: | simultaneous measurement: potential of gas pipeline and potential of rails |
| measuring equipment: | two-channel voltage recorder, two Cu/CuSO4 reference electrodes, cable connection to the gas pipeline, cable connection to the rail |
| what conclusion can be drawn: | whether rail traction affects the gas pipeline, or there is no impact, based on a comparison of the energy spectra of both measured signals in the joint time and frequency domain |
4. Discussion
The methods of assessing the corrosion risk of gas pipelines caused by stray currents discussed in this review and used in practice make it possible to identify which sections of gas pipelines are at risk of electrolytic corrosion and require the application of corrosion protection. However, each method has certain limitations:
Methods based on measurements of rail potential, or electric field gradient near the rail traction, or electric field gradient near the gas pipeline allow determination of the direction of stray current flow in the ground. On this basis, it is possible to identify what kind of impact is expected on the pipeline in this area (anodic or cathodic zone of impact). These methods are therefore useful at the stage of designing the route of the gas pipeline in order to avoid future risks, or in the preliminary phase of identifying the corrosion risk to the gas pipeline. However, they cannot be employed to predict the magnitude of the effects and, consequently, to indicate the most appropriate form of corrosion protection for the gas pipeline (polarized drainage or ICCP).
Methods for testing the correlation between the potential of a gas pipeline and its voltage relative to electric traction rails provide the most information about the hazard caused by stray currents. The criteria for assessing the impact refer to the asymmetry of changes in the potential of the gas pipeline relative to the steady-state potential, i.e., the potential of the gas pipeline in the absence of stray currents. The hazard occurs only when the periods of anodic polarization of the gas pipeline prevail. This is due to the nature of stray currents, which are randomly variable rather than constant. If the current flowing from the pipeline to the ground had a constant intensity, there would be continuous metal dissolution. This phenomenon occurs in the case of stray currents originating, for example, from the cathodic protection system of a foreign object—the intensity and direction of such stray currents are constant [72]. Meanwhile, in the case of electric rail traction, dynamic changes in the intensity and direction of stray currents flowing across the metal/electrolyte interface cause processes related to charge separation reflected by the electrical capacitance of the double layer [73]. Electrochemical processes connected with capacitance are non-Faradaic (non-corrosive) in nature, whereas corrosive processes are related to direct current, known as Faradaic current, which flows across the metal/electrolyte interface with the participation of metal reduction and oxidation processes (metal dissolution, corrosion). Therefore, in practice, corrosive metal loss in pipelines occurs only when anodic polarization periods caused by dynamic stray currents prevail.
Correlation methods give unambiguous results in the case of pipelines with damaged external insulation, with a large number of insulation defects through which stray currents flow between the pipeline and the ground. In the case of gas pipelines with tight insulation (without defects), the results of pipeline potential recording may in fact be changes in the electric field in the ground, rather than changes in the electrochemical potential of the metal in the coating defect. The identified threat of stray currents may therefore only be probable and not actual, i.e., it will appear with the formation of an insulation defect. In locations where measurement results indicate a high probability of harmful stray current effects and the gas pipeline has highly tight insulation, protection against stray currents is not necessary until stray currents enter the pipeline. Further action by cathodic protection personnel should therefore involve periodic monitoring of the current flowing through the gas pipeline wall. Such measurements are routinely performed by personnel [4,19,74]. They are conducted at special measuring points (posts) routinely installed along the gas pipeline route during its construction, typically spaced every 1 or 2 km. Conductors connected to the gas pipeline are fixed to the posts, allowing for indirect current measurement using Ohm’s law. Stray current flowing through the pipeline causes a voltage drop across the resistance of the pipeline section between the connected conductors. Knowing this resistance and the voltage drop, the stray current can be calculated. Stray currents flowing through a gas pipeline will occur when an insulation defect develops. Electrochemical corrosion protection (polarized electrical drainage or cathodic protection, depending on the intensity of stray currents flowing through the gas pipeline wall) will then be necessary.
Methods of time-frequency analysis of signals recorded in the field and related to the impact of stray currents are based on a comparison of power density spectrograms obtained for the stray current source and the pipeline. If both spectrograms reveal identical changes in the power of frequency components in the time domain, it is considered that interaction is present. The lack of clear evaluation criteria raises doubts. They are not parameterized, so the evaluation of interactions cannot be automated and must be based on a visual comparison of spectrograms. The difficulty in applying these methods also lies in the need to skillfully select the width of the analyzing window so that the resulting resolution of the spectrograms shows the frequency components of the analyzed signals as a function of time. Another disadvantage is that the analysis of spectrograms can only determine the presence of stray currents on the pipeline. However, it is not possible to determine the type of this interaction, whether it is cathodic or anodic, which is key information in terms of corrosion protection of the gas pipeline.
All of the methods discussed can be used separately or in combination, in which case the conclusions from the measurements can be confirmed by several methods. The choice of methods depends on the problem and the task to be solved by the cathodic protection personnel, as shown in Table 1, which compares all methods and indicates typical applications, advantages, and disadvantages. Technical aspects are also important, e.g., whether it is possible to connect a cable to the gas pipeline at the measurement site. If not, then the method of testing the potential of the rails or measuring the electric field gradient can be used. However, these are diagnostic methods, so if there is a high probability of harmful effects of stray currents, confirmatory tests should be performed using correlation methods.

Table 1.
Summary of the discussed methods for assessing the risk of stray currents in gas pipelines.
The implementation of the presented methods for measuring rails’ potential, electric field gradient, and correlation methods is easy, unlike time-frequency analysis, mainly due to the complex analysis of signals using the STFT or CWT transforms.
The E = f(U) correlation method has the greatest potential for application to various test cases. It allows for the assessment of stray current hazards at the tested location on the gas pipeline, the determination of the anodic or cathodic zone on the gas pipeline, and the identification of the location of the greatest hazard on the tested section of the gas pipeline. In addition, it can be used to easily determine the effectiveness of corrosion protection systems, mainly polarized electric drainage and impressed current cathodic protection. None of the other methods presented offers such combined possibilities. Another advantage is that it is not sensitive to local changes in soil resistivity. However, the measurement results may be affected by extraneous electric fields in the ground, which may originate, for example, from the cathodic protection system of a neighboring pipeline.
5. Conclusions
Stray currents flowing from DC rail traction systems on underground gas pipelines often fluctuate in a dynamic and random manner, which necessitates effective methods for evaluating their corrosive impact. The paper provided a summary of such tests, including:
- measurements of the potential of electric traction rails or the electric field gradient on the ground surface, which allow identification of the possibility of electrolytic corrosion based on the direction of current flow,
- studies of the correlation between the potential of the gas pipeline and its voltage relative to the electric traction rails, which provide information on the corrosion hazard from anodic areas on the pipeline,
- frequency domain analysis of the pipeline potential, which unequivocally identifies the stray current source that impacts the pipeline.
Routine execution of those tests evaluating the risk for structural integrity due to corrosion contributes to an increase in operational safety of pipelines.
The challenge, which should be faced in the near future, is the induction of alternating voltage in tightly insulated gas pipelines running near high-voltage power lines. In case of coating defect occurrence, intense alternating current corrosion processes may occur [75,76]. There is an increasing number of cases of such corrosion, as reported in scientific papers [77]. Methods and criteria for assessing the risk of alternating current corrosion in gas pipelines have been developed [78]. However, gas pipelines may be subject to the combined effects of DC stray currents and AC current. That is why there is a need to develop methods for testing such synergistic effects in the field.
Author Contributions
Conceptualization, K.Ż.; methodology, K.Ż. and S.K.; writing—original draft preparation, K.Ż., M.S. and S.K.; writing—review and editing, M.S. All authors have read and agreed to the published version of the manuscript.
Funding
This research received no external funding.
Data Availability Statement
No new data were created or analyzed in this study.
Conflicts of Interest
The authors declare no conflicts of interest.
References
- Dakwar, N.; Papavinasam, S.; Hammoud, A. Evaluation of Prediction Techniques in Corrosion Management of Pipelines External Corrosion. In Proceedings of the AMPP Annual Conference + Expo 2025, Nashville, TN, USA, 6–10 April 2025; AMPP: Houston, TX, USA, 2025; pp. 1–14. [Google Scholar] [CrossRef]
- ISO 22426; Assessment of the Effectiveness of Cathodic Protection Based on Coupon Measurements. CENELEC: Brussels, Belgium, 2020.
- Lin, S.; Tang, Z.; Chen, X.; Liu, X.; Liu, Y. Analysis of Stray Current Leakage in Subway Traction Power Supply System Based on Field-Circuit Coupling. Energies 2024, 17, 3121. [Google Scholar] [CrossRef]
- ISO 21857; Petroleum, Petrochemical and Natural Gas Industries—Prevention of Corrosion on Pipeline Systems Influenced by Stray Currents. CENELEC: Brussels, Belgium, 2021.
- Szeliga, M.J. Rail transit stray current control: Then and now. Mater. Perform. 1993, 32, 35–39. [Google Scholar]
- Chen, Z.; Koleva, D.; van Breugel, K. A review on stray current-induced steel corrosion in infrastructure. Corros. Rev. 2017, 35, 397–423. [Google Scholar] [CrossRef]
- Tzeng, Y.; Lee, C. Analysis of rail potential and stray currents in a direct-current transit system. IEEE Trans. Power Deliv. 2010, 25, 1516–1525. [Google Scholar] [CrossRef]
- Zaboli, A.; Vahidi, B.; Yousefi, S.; Hosseini-Biyouki, M.M. Evaluation and control of stray current in DC-electrified railway systems. IEEE Trans. Veh. Technol. 2017, 66, 974–980. [Google Scholar] [CrossRef]
- Wang, C.; Li, W.; Xin, G.; Wang, Y.; Xu, S.; Fan, M. Novel method for prediction of corrosion current density of gas pipeline steel under stray current interference based on hybrid LWQPSO-NN model. Measurement 2022, 200, 111592. [Google Scholar] [CrossRef]
- Lucca, G. Estimating stray current interference from DC traction lines on buried pipelines by means of a Monte Carlo algorithm. Electr. Eng. 2015, 97, 277–286. [Google Scholar] [CrossRef]
- Kim, Y.S.; Jeong, G.J.; Sohn, H.J. Mathematical modeling on the corrosion of unprotected structure due to stray current resulting from cathodic protection system. Met. Mater. Int. 1999, 5, 93–99. [Google Scholar] [CrossRef]
- Wang, C.; Li, W.; Wang, Y.; Xu, S.; Fan, M. Stray Current Distributing Model in the Subway System: A review and outlook. Int. J. Electrochem. Sci. 2018, 13, 1700–1727. [Google Scholar] [CrossRef]
- Vranesic, K.; Serdar, M.; Lakusic, S.; Kolár, V.; Mariscotti, A. Dynamic stray current measuring methods in urban areas. Balt. J. Road Bridge Eng. 2022, 17, 146–170. [Google Scholar] [CrossRef]
- Machczyński, W.; Budnik, K.; Szymenderski, J. Assessment of D.C. traction stray currents effects on nearby pipelines. COMPEL 2016, 35, 1468–1477. [Google Scholar] [CrossRef]
- Ogunsola, A.; Mariscotti, A.; Sandrolini, L. Estimation of stray current from a DC-electrified railway and impressed potential on a buried pipe. IEEE Trans. Power Deliv. 2012, 27, 2238–2246. [Google Scholar] [CrossRef]
- Du, G.; Wang, J.; Jiang, X.; Zhang, D.; Yang, L.; Hu, Y. Evaluation of Rail Potential and Stray Current with Dynamic Traction Networks in Multitrain Subway Systems. IEEE Trans. Transp. Electrif. 2020, 6, 784–796. [Google Scholar] [CrossRef]
- Zaboli, A.; Vahidi, B.; Yousefi, S.; Hosseini Biyouki, M.M. Effect of control methods on calculation of stray current and rail potential in DC-electrified railway systems. In Proceedings of the 4th International Conference on Recent Advances in Railway Engineering (ICRARE2015), Tehran, Iran, 17–18 May 2015. [Google Scholar]
- Vranešić, K.; Lakusic, S.; Kolar, V.; Placek, J. Stray current measurement at the tramway infrastructure in Ostrava, Czech Republic. In Proceedings of the 6th International Conference on Road and Rail Infrastructure, Online, 20–21 May 2021; pp. 575–582. [Google Scholar] [CrossRef]
- Peabody, A.W. Peabody’s Control of Pipeline Corrosion, Ronald, L., Bianchetti, P.E., Eds.; 3rd ed.; NACE International: Houston, TX, USA, 2018. [Google Scholar] [CrossRef]
- Szeliga, M.J. Stray Current Corrosion: The Past, Present, and Future of Rail Transit Systems; NACE International: Houston, TX, USA, 1994. [Google Scholar]
- Siranec, M.; Regula, M.; Otcenasova, A.; Altus, J. Measurement and analysis of stray currents. In Proceedings of the 2019 20th International Scientific Conference on Electric Power Engineering (EPE), Kouty nad Desnou, Czech Republic, 15–17 May 2019; IEEE: Piscataway, NJ, USA, 2019; pp. 1–6. [Google Scholar] [CrossRef]
- Zakowski, K.; Darowicki, K.; Orlikowski., J.; Jazdzewska, A.; Krakowiak, S.; Gruszka, M. Electrolytic corrosion of water pipeline system in the remote distance from stray currents—Case study. Case Stud. Constr. Mater. 2016, 4, 116–124. [Google Scholar] [CrossRef]
- Alamuti, M.M.; Nouri, H.; Jamali, S. Effects of earthing systems on stray current for corrosion and safety behaviour in practical metro systems. IET Electr. Syst. Transp. 2011, 1, 69–79. [Google Scholar] [CrossRef]
- Juybari, E.Z.; Keypour, R.; Niasati, M. Voltage distribution indices method to analyse the performance of various structures of stray current collectors in direct current transit lines. IET Electr. Syst. Transp. 2021, 11, 322–332. [Google Scholar] [CrossRef]
- Cotton, I.; Charalambous, C.A.; Aylott, P.; Ernst, P. Stray current control in DC mass transit systems. IEEE Trans. Veh. Technol. 2005, 54, 722–730. [Google Scholar] [CrossRef]
- EN 50122-2; Railway Applications—Fixed Installations—Electrical Safety, Earthing and the Return Circuit. Part 2: Provisions against the Effects of Stray Currents Caused by DC Traction Systems. CENELEC: Brussels, Belgium, 2022.
- Vranesic, K.; Bhagat, S.; Mariscotti, A.; Vail, R. Measures and Prescriptions to Reduce Stray Current in the Design of New Track Corridors. Energies 2023, 16, 6252. [Google Scholar] [CrossRef]
- Liu, W.; Li, T.; Zheng, J.; Pan, W.; Yin, Y. Evaluation of the Effect of Stray Current Collection System in DC-Electrified Railway System. IEEE Trans. Veh. Technol. 2021, 70, 6542–6553. [Google Scholar] [CrossRef]
- Yang, X.; Wang, M.; Zheng, T.Q.; Sun, X. Modelling and Simulation of Stray Current in Urban Rail Transit—A Review. Urban Rail Transit 2024, 10, 189–199. [Google Scholar] [CrossRef]
- Zhu, Q.; Cao, A.; Zaifend, W.; Song, J.; Shengli, C. Stray current corrosion in buried pipeline. Anti-Corros. Methods Mater. 2011, 58, 234–237. [Google Scholar] [CrossRef]
- Wang, C.; Wang, Y.; Xu, S.; Li, W.; Wang, Y.; Xing, F. Assessment of interference scope induced by stray current in the metro depot for the corrosion risk of buried metal pipeline. Electr. Eng. 2024, 106, 4277–4296. [Google Scholar] [CrossRef]
- Wang, C.; Qin, G. Corrosion of underground infrastructures under metro-induced stray current: A review. Corros. Commun. 2024, 14, 23–38. [Google Scholar] [CrossRef]
- Xu, W.; Li, Y.; Li, H.; Wang, K.; Zhang, C.; Jiang, Y.; Qiang, S. Corrosion mechanism and damage characteristic of steel fiber concrete under the effect of stray current and salt solution. Constr. Build. Mater. 2022, 314, 125618. [Google Scholar] [CrossRef]
- Peng, X.; Huang, Z.; Chen, B.; Liu, D.; Li, H. On the interference mechanism of stray current generated by DC tram on pipeline corrosion. Eng. Fail. Anal. 2020, 116, 104760. [Google Scholar] [CrossRef]
- Lin, S.; Wang, A.; Liu, M.; Lin, X.; Zhou, Q.; Zhao, L. A Multiple Section Model of Stray Current of DC Metro Systems. IEEE Trans. Power Deliv. 2021, 36, 1582–1593. [Google Scholar] [CrossRef]
- Zhou, Q.; Lin, S.; Wu, J. Dynamic stray current evaluation model of metro system considering reversible DC traction power system. Int. J. Rail Transp. 2023, 12, 492–513. [Google Scholar] [CrossRef]
- EN 50162:2004; Protection Against Corrosion by Stray Current from Direct Current Systems. CENELEC: Brussels, Belgium, 2004.
- Liang, H.; Wu, Y.; Han, B.; Lin, N.; Wang, J.; Zhang, Z.; Guo, Y. Corrosion of Buried Pipelines by Stray Current in Electrified Railways: Mechanism, Influencing Factors, and Protection. Appl. Sci. 2025, 15, 264. [Google Scholar] [CrossRef]
- Allahkaram, S.R.; Isakhani-Zakaria, M.; Derakhshani, M.; Samadian, M.; Sharifi-Rasaey, H.; Razmjoo, A. Investigation on corrosion rate and a novel corrosion criterion for gas pipelines affected by dynamic stray current. J. Nat. Gas Sci. Eng. 2015, 26, 453–460. [Google Scholar] [CrossRef]
- Du, G.; Zhang, D.; Li, G.; Wang, C.; Liu, J. Evaluation of rail potential based on power distribution in DC traction power systems. Energies 2016, 9, 729. [Google Scholar] [CrossRef]
- Chuchit, T.; Kulworawanichpong, T. Stray current assessment for DC transit systems based on modelling of earthing and bonding. Electr. Eng. 2019, 101, 81–90. [Google Scholar] [CrossRef]
- Gu, J.; Yang, X.; Zheng, T.; Xia, X.; Chen, M. Rail potential and stray current mitigation for the urban rail transit with multiple trains under multiple conditions. IEEE Trans. Transp. Electrif. 2022, 8, 1684–1694. [Google Scholar] [CrossRef]
- Ormellese, M.; Beretta, S.; Brugnetti, F.; Brenna, A. Effects of non-stationary stray current on carbon steel buried pipelines under cathodic protection. Constr. Build. Mater. 2021, 281, 122645. [Google Scholar] [CrossRef]
- Szymenderski, J.; Machczyński, W.; Budnik, K. Modeling Effects of Stochastic Stray Currents from D.C. Traction on Corrosion Hazard of Buried Pipelines. Energies 2019, 12, 4570. [Google Scholar] [CrossRef]
- Memon, S.A.; Fromme, P. Stray Current Corrosion and Mitigation: A synopsis of the technical methods used in dc transit systems. IEEE Electrif. Mag. 2014, 2, 22–31. [Google Scholar] [CrossRef]
- Wang, Y.Q.; Li, W.; Yang, X.F.; Ye, G.; Fan, Q.G.; Zhang, L.P. Modeling and simulation the distribution of metro stray current. In Proceedings of the 2010 International Conference on Computer Application and System Modeling (ICCASM 2010), Taiyuan, China, 22–24 October 2010; IEEE: Piscataway, NJ, USA, 2010. [Google Scholar] [CrossRef]
- EN ISO 15257:2017-10; Cathodic Protection—Competence Levels of Cathodic Protection Persons—Basis for a Certification Scheme. CENELEC: Brussels, Belgium, 2017.
- Zakowski, K.; Darowicki, K. Methods of evaluation of the corrosion hazard caused by stray currents to metal structures containing aggressive media. Pol. J. Environ. Stud. 2000, 9, 237–241. [Google Scholar]
- Yan, J.; Bai, E.; Xu, J. The calculation of rail potential considering stray current. J. Phys. Conf. Ser. 2024, 2797, 012046. [Google Scholar] [CrossRef]
- Vranešić, K.; Serdar, M.; Lakušić, S. Analysis of electrical potential and stray currents at DC transit system. In Proceedings of the International Conference on Sustainable Materials, Systems and Structures (SMSS 2019), Rovinj, Croatia, 20–22 March 2019. [Google Scholar]
- Wang, C.; Li, W.; Wang, Y.; Xu, S.; Li, K. Evaluation Model for the Scope of DC Interference Generated by Stray Currents in Light Rail Systems. Energies 2019, 12, 746. [Google Scholar] [CrossRef]
- Zhang, J.; Cao, X.; Jin, W.; Zhang, S.; Zhang, B.; Zhang, Y. The Influence of Relative Position on Ground Potential and Electric Field Based on Interfacial Charge Accumulation in HVDC. IEEJ Trans. Elec. Electron. Eng. 2025, 20, 29–40. [Google Scholar] [CrossRef]
- Steinmetz, T.; Helias, M.; Wimmer, G.; Fichte, L.O.; Clemens, M. Electro-Quasistatic Field Simulations Based on a Discrete Electromagnetism Formulation. IEEE Trans. Magn. 2006, 42, 755–758. [Google Scholar] [CrossRef]
- Regula, M.; Siranec, M.; Otcenasova, A.; Hoger, M. Possibilities of the stray current measurement and corrosive risk evaluation. Electr. Eng. 2022, 104, 2497–2513. [Google Scholar] [CrossRef]
- Zhiguang, C.; Chaokui, Q.; Jixu, T.; Yu, Z. Analyzing of Stray Current Interference on Buried Gas Pipeline from Shanghai Urban Rail Transit. Res. J. Appl. Sci. Eng. Technol. 2013, 5, 4421–4426. [Google Scholar] [CrossRef]
- Zakowski, K.; Sokolski, W. 24-hour characteristic of interaction on pipelines of stray currents leaking from tram tractions. Corros. Sci. 1999, 41, 2099–2111. [Google Scholar] [CrossRef]
- Buchler, M.; Joos, D. Assessing the corrosion risk caused by DC interference on cathodically protected pipelines. In Proceedings of the EUROCORR 2019 The Annual Congress of the European Federation of Corrosion, Seville, Spain, 9–13 September 2019. [Google Scholar]
- Chen, Y.; Wang, F.; Zou, G.; Sun, W.; Li, C. Study on corrosion behaviour of X65 steel of buried pipeline under dynamic stray current interference. AIP Adv. 2025, 15, 065005. [Google Scholar] [CrossRef]
- Qin, H.; Du, Y.; Lu, M.; Liu, J.; Zhu, X. Accelerated corrosion of pipeline steel under dynamic DC stray current interference. Corros. Eng. Sci. Technol. 2020, 55, 670–680. [Google Scholar] [CrossRef]
- Vranešić, K.; Lakušić, S.; Serdar, M. Corrosion and stray currents at urban track infrastructure. GRADEVINAR 2020, 72, 593–600. [Google Scholar] [CrossRef]
- Darowicki, K.; Zakowski, K. A new time-frequency detection method of stray current field interference on metal structures. Corros. Sci. 2004, 46, 1061–1070. [Google Scholar] [CrossRef]
- Zakowski, K. The determination and identification of stray current source influences on buried pipelines using time/frequency analysis. Anti-Corros. Methods Mater. 2009, 56, 330–333. [Google Scholar] [CrossRef]
- Mujezinović, A.; Martinez, S. Application of the continuous wavelet cross-correlation between pipe-to-soil potential and pipe-to-rail voltage influenced by dynamic stray current from DC train traction. IEEE Trans. Power Deliv. 2021, 36, 1015–1023. [Google Scholar] [CrossRef]
- Quian, S.; Chen, D. Join Time-Frequency Analysis. Methods and Applications; Prentice Hall PTR: Upper Saddle River, NJ, USA, 2006. [Google Scholar]
- Ramirez, R. The FFT Fundamentals and Concepts; Tektronix Inc.: Englewood Cliffs, NJ, USA, 1985. [Google Scholar]
- Allen, R.L.; Mills, D.W. Signal Analysis. Time, Frequency, Scale, and Structure; IEEE Press (Wiley-Interscience): New York, NY, USA, 2004. [Google Scholar]
- Carmona, R.; Hwang, W.-L.; Torresani, B. Practical Time-Frequency Analysis. In Wavelet Analysis and Its Applications; Academic Press: New York, NY, USA, 1998. [Google Scholar]
- Sun, X.; Yang, X.; Zhao, R.; Wang, Z.; Chen, M.; Zheng, T.Q. S-Transform Based Time-Frequency Evaluation of Dynamic Stray Current in Zero-Resistance Converter System. Energies 2025, 18, 1594. [Google Scholar] [CrossRef]
- Dong, L.; Zhang, S.; Gan, T.; Qiu, Y.; Song, Q.; Zhao, Y. Frequency characteristics analysis of pipe-to-soil potential under metro stray current interference using continuous wavelet transform method. Constr. Build. Mater. 2023, 407, 133453. [Google Scholar] [CrossRef]
- Machczyński, W. Simulation model for drainage protection of earth-return circuits laid in stray currents area. Electr. Eng. 2002, 84, 165–172. [Google Scholar] [CrossRef]
- Zakowski, K.; Darowicki, K. Detection of stray current field interference on metal constructions using STFT. In Proceedings of the 6th International Conference on Damage Assessment of Structures (DAMAS 2005), Gdansk, Poland, 4–6 July 2005; Volume 293–294, pp. 785–791. [Google Scholar]
- Guo, Y.; Ding, J.; Li, X.; Li, J. Study of Impressed Current Cathodic Protection (ICCP) on the Steel Pipeline under DC Stray Current Interference. Int. J. Electrochem. Sci. 2021, 16, 210547. [Google Scholar] [CrossRef]
- Kolbadinejad, M.; Zabihollah, A.; Khayyat, A.; Mahmoud, M.O. An equivalent electrical circuit design for pipeline corrosion monitoring based on piezoelectric elements. J. Mech. Sci. Technol. 2013, 27, 799–804. [Google Scholar] [CrossRef]
- EN 13509:2003; Cathodic Protection Measurement Techniques. CENELEC: Brussels, Belgium, 2003.
- Thakur, A.; Kumar, A.; Kumar, A.; Pushpa, S. Prediction and mitigation of AC interference on the pipeline system. Corros. Rev. 2022, 40, 149–157. [Google Scholar] [CrossRef]
- Farahani, E.M.; Su, Y.; Chen, X.; Wang, H.; Laughorn, T.R.; Onesto, F.; Zhou, Q.; Huang, Q. AC corrosion of steel pipeline under cathodic protection: A state-of-the-art review. Mater. Corros. 2024, 75, 290–314. [Google Scholar] [CrossRef]
- Thakur, A.; Kumar, A.; Kumar, A.; Pushpa, S. The science of alternating current-induced corrosion: A review of literature on pipeline corrosion induced due to high-voltage alternating current transmission pipelines. Corros. Rev. 2020, 38, 463–472. [Google Scholar] [CrossRef]
- ISO 18086; Corrosion of Metals and Alloys—Identification of Corrosion Induced by Alternating Current—Protection Criteria. CENELEC: Brussels, Belgium, 2019.
Disclaimer/Publisher’s Note: The statements, opinions and data contained in all publications are solely those of the individual author(s) and contributor(s) and not of MDPI and/or the editor(s). MDPI and/or the editor(s) disclaim responsibility for any injury to people or property resulting from any ideas, methods, instructions or products referred to in the content. |
© 2025 by the authors. Licensee MDPI, Basel, Switzerland. This article is an open access article distributed under the terms and conditions of the Creative Commons Attribution (CC BY) license (https://creativecommons.org/licenses/by/4.0/).

