Abstract
To address the challenge of heat dissipation in electric vehicle in-wheel motors within limited space, this study conducted temperature field analysis and cooling structure optimization based on magnetic–thermal coupling. The three-dimensional finite element model and the magnetic–thermal-coupled mathematical models of synchronous permanent magnet in-wheel motors were established. Using a coupled electromagnetic–thermal finite element analysis method, numerical simulations were performed to investigate the transient temperature fields of the in-wheel motor under different driving conditions. The effects of three different cooling channel structures on the temperature rise and the pressure drop of the in-wheel motor were compared, and a parallel channel structure suitable for the in-wheel motor was selected. The influences of channel quantity, channel width, and coolant flow rate on the temperature field were analyzed. Furthermore, a multi-objective optimization of the cooling structure was carried out using the NSGA-II genetic algorithm. The simulation results demonstrated a significant improvement in the overall thermal performance of the optimized cooling structure. The maximum temperature of the hub motor decreased by 2.25% and 3.32% under the rated and peak speeds, respectively, while the pressure drop in the water channel was reduced by 58.52%. This study provides a theoretical reference for temperature field calculation and cooling structure design of hub motors.
1. Introduction
With the increasing depletion of petroleum resources and the growing stringency of emission regulations, the development of electric vehicle technology has become a crucial pathway to enhance the competitiveness of the automotive industry, ensure national energy security, and promote a low-carbon economy [1]. Currently, many countries, including China, have recognized the vast potential of the electric vehicle industry and have positioned the promotion of its development as one of their national strategic objectives [2]. In-wheel motor electric vehicles integrate the power system, transmission system, and braking system into the hub interior. Compared to traditional centrally driven electric vehicles, they offer advantages such as simplified vehicle structure, reduced mechanical losses, improved operational efficiency, and enhanced capability for complex control, making them a key focus in the development of electric vehicles [3]. However, the integration of multiple systems into the hub results in high structural integration, concentrated heat generation, and poor heat dissipation due to the overall sealed design of the in-wheel motor. Excessive temperature in the in-wheel motor can reduce motor efficiency, cause short circuits in electronic components, accelerate insulation aging, impair motor performance and service life, and even compromise driving safety [4]. Therefore, accurately analyzing the real-time temperature of in-wheel motors and optimizing their cooling structure and heat dissipation performance are essential for improving their operational efficiency and longevity.
Scholars worldwide have conducted extensive research on temperature field analysis and heat dissipation optimization of electric motors. The temperature rise in a permanent magnet dual-rotor motor has been calculated and predicted using two- and three-dimensional finite element models [5]. The transient temperature field of an in-wheel motor under different operating conditions has been simulated using a fluid–solid coupling method [6]. The influence of structural parameters of the water jacket on the thermal performance of a permanent magnet synchronous in-wheel motor has been analyzed, leading to optimized design of the water jacket and slots [7]. A cooling system combining internal oil circulation and external water circulation was proposed for motor heat dissipation, and an algorithmic framework for motor cooling optimization was developed [8]. Multi-objective genetic algorithm was employed to optimize the design parameters of cooling channels in an in-wheel motor, and the improvement in thermal performance was verified through numerical simulation [9]. Based on the coupling of temperature and stress fields, the effect of temperature on the deformation of an outer-rotor in-wheel motor was investigated [10]. To address the temperature rise in the stator windings of permanent magnet synchronous motors, a three-dimensional equivalent heat transfer model was established, and thermal conduction at the stator winding ends was optimized to enhance heat dissipation [11]. For high-speed permanent magnet synchronous motors with forced air cooling, the air friction loss and electromagnetic loss were analyzed, and a coupled electromagnetic–thermal model was developed using finite element and thermal network methods [12]. A computational fluid dynamics model was established for the Tesla-valve cooling channel in a permanent magnet synchronous motor, and the influence of different structural parameters on motor temperature rise was studied [13]. However, there remains limited literature focusing on the coupled electromagnetic–thermal analysis and cooling channel structure optimization specifically for in-wheel motors.
The main contributions of this study are as follows: First, a magneto-thermal coupling method is proposed to numerically simulate the transient temperature field of the in-wheel motor. Second, the effects of different cooling channel structures and their parameters on the thermal performance of the motor are thoroughly analyzed. The cooling structure is optimized, leading to significant improvements in both heat dissipation efficiency and pressure drop reduction in the coolant channels. Lastly, this work provides valuable insights and references for temperature field computation and cooling system design in in-wheel motor applications.
The remainder of this paper is organized as follows. Section 2 introduces the basic parameters of the selected in-wheel motor and establishes its three-dimensional model. Section 3 develops a magneto-thermal-coupled mathematical model for the motor, including the heat conduction equation, heat transfer coefficient calculation, and loss estimation. Section 4 constructs a finite element model of the motor and performs temperature field simulations under both peak speed and rated speed operating conditions. Section 5 compares three typical cooling structures of in-wheel motors, and conducts factor analysis, thermal optimization, and simulation validation specifically on the parallel channel configuration. Finally, a brief conclusion summarizing the study is presented.
2. Parameters and Structural Models
Based on the integrated design requirements of an in-wheel motor and friction braking system for a specific electric vehicle model [14], and considering the performance demands for in-wheel motors such as high power density, excellent torque characteristics, high transmission efficiency, and fast response speed, an external rotor permanent magnet synchronous motor is selected as the in-wheel motor in this paper. The external rotor is directly fixed to the wheel hub, offering advantages such as high output torque and a wide speed regulation range. The basic parameters of the in-wheel motor are listed in Table 1.

Table 1.
Basic parameters of in-wheel motor.
The two-dimensional and three-dimensional models of the in-wheel motor are shown in Figure 1.
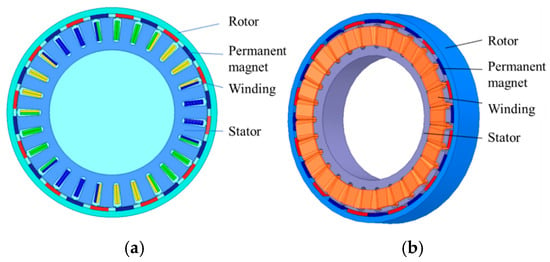
Figure 1.
Structural models of the in-wheel motor. (a) two-dimensional model; (b) three-dimensional model.
The key materials involved in the thermal simulation of the in-wheel motor in this study include copper wire, silicon steel sheets, permanent magnet material, equivalent air gap, and equivalent insulation layer. The physical properties of these materials are presented in Table 2.

Table 2.
Material parameters of key motor components.
3. Magneto-Thermal Coupled Mathematical Models
3.1. Heat Conduction Equations
Considering the complexity of the heat transfer process inside a hub motor, the following reasonable assumptions are made to simplify the simulation analysis of the motor temperature field: (1) The thermal properties of motor components (such as the stator core, windings, and permanent magnets) are assumed to be uniform in all directions. (2) The thermophysical parameters of the materials, such as thermal conductivity and specific heat capacity, are assumed to be constant within the analyzed temperature range and do not vary with temperature. (3) Major heat sources, such as copper losses in the windings and iron losses in the core, are simplified as uniformly distributed heat generation rates within their respective volumes. (4) The microscopic roughness of contact surfaces is neglected, and the contact thermal resistance between components is simplified as an equivalent thermal conductivity or ideal thermal conduction. (5) For analysis under rated operating conditions, the motor is assumed to operate in a thermal steady state, meaning the temperature at each point inside the motor does not change over time. (6) When analyzing the motor cooling conditions, the coolant is treated as an incompressible fluid.
According to heat transfer theory, the heat conduction equations governing the transient temperature field in a permanent magnet synchronous in-wheel motor are expressed as follows [15]:
where kx, ky, kz represent the thermal conductivities of the motor in the x-, y-, and z-directions, respectively. T denotes temperature, q is heat flux density, c is specific heat capacity, ρ is density, τ represents time, Qs denotes external heat sources, S1 represents the adiabatic boundary surface of the motor, S2 represents the heat dissipation boundary surface of the motor, Te is the ambient temperature surrounding surface S2, αs is the heat transfer coefficient of surface S2, kS denotes the normal-direction thermal conductivity of surfaces S1 and S2, k represents the average thermal conductivity, n is the boundary normal vector.
3.2. Calculation of Heat Dissipation Coefficients
Heat convection is a critical mechanism for heat dissipation in electric motors. During the simulation of the motor’s temperature field, it is essential to calculate the heat transfer coefficients at various boundaries. The heat transfer coefficients considered in this study mainly include those of the air gap between the stator and rotor, the winding end surfaces, the outer surface of the rotor, and the end surfaces of the stator and rotor.
3.2.1. Heat Transfer Coefficient of Air Gap
The air between the stator and rotor is in a flowing state. Although air has low thermal conductivity, it significantly influences the internal heat transfer of the motor. Due to the relatively small size of the air gap, accurately determining its flow state is challenging [16]. Therefore, it can be assumed that the air gap is stationary, and the heat transfer coefficient under actual motion conditions is estimated using the following formulas [17]:
where ha is the equivalent heat transfer coefficient of the air gap, Re is the Reynolds number of the air gap, Pr is the Prandtl number, ka is the thermal conductivity of air, δ is the thickness of the air gap.
3.2.2. Heat Transfer Coefficient of Winding End Surface
The heat transfer coefficient at the winding end surface influences the thermal performance and operational efficiency of the motor. The convective heat transfer coefficient of the winding end surface is calculated using the following formulas [18]:
where αd is the heat transfer coefficient of the winding end, Nus is the Nusselt number at the winding end, Ds is the equivalent diameter of the winding end, Res is the Reynolds number at the air gap near the stator end surface, vr is the air velocity over the stator surface, υ is the kinematic viscosity of air, Di1 is the inner diameter of the stator, D1 is the outer diameter of the stator.
3.2.3. Heat Transfer Coefficient of Rotor Outer Surface
The outer surface of the rotor is in contact with air. During rotor operation, the air flows due to the rotation of the rotor outer surface, resulting in heat exchange. The convective heat transfer coefficient at the outer rotor surface can be calculated using the following formulas [19]:
where αca is the heat transfer coefficient at the rotor outer surface, vs. is the linear velocity of the rotor outer wall, Rw is the outer radius of the rotor, ns is the rotational speed of the motor.
3.2.4. Heat Transfer Coefficient of Stator and Rotor End Surfaces
The accuracy of the heat transfer coefficient calculation for the stator and rotor end surfaces directly affects the thermal performance and temperature distribution of the motor. The corresponding formulas can be expressed as follows [19]:
where αs is the heat transfer coefficient of the stator end surface, αy is the heat transfer coefficient of the rotor end surface.
3.3. Loss Calculation
3.3.1. Winding Losses
Winding losses are primarily determined by the conductor’s current intensity and resistance parameters. According to Joule’s law, the thermal power loss in a conductor is proportional to the square of the current and increases linearly with the resistance value. The in-wheel motor designed in this study is a three-phase permanent magnet synchronous motor, and the current is three-phase. The expression for calculating the winding losses is given as follows:
where I is the current per phase winding, R is the winding resistance.
3.3.2. Core Losses
Core losses account for a significant proportion of the total losses in electric motors and primarily consist of hysteresis losses, classical eddy current losses, and excess losses. Currently, the most widely used method for calculating core losses remains the classical separation model proposed by Bertotti et al. [20], expressed as:
where PFe is the core loss, Ph the hysteresis loss, Pe the classical eddy current loss, Pex is the excess loss, Kh is the hysteresis loss coefficient, Bm is the magnetic flux density, α is a constant coefficient, Ke is the eddy current loss coefficient, Kex is the excess loss coefficient, f is the frequency of the magnetic field variation.
3.3.3. Permanent Magnet Eddy Current Losses
According to the law of electromagnetic induction, when the motor operates at high speeds, eddy currents are induced in the permanent magnets due to the influence of harmonic magnetic fields, resulting in permanent magnet eddy current losses. The calculation formula is given as follows [21]:
where Pme is the permanent magnet eddy current loss, La is the length of the permanent magnet, Vm is the volume of the permanent magnet, Lb is the thickness of the permanent magnet, kme is the electromotive force proportionality constant, Bme is the maximum magnetic flux density, ρ1 is the electrical conductivity of the permanent magnet.
Based on the basic parameters of the in-wheel motor shown in Table 1, the material parameters of key motor components in Table 2, and the fundamental structure illustrated in Figure 1, electromagnetic simulations were conducted using Maxwell (2020 R1) to determine the power losses in various components of the motor under both rated and peak speed conditions. Consequently, the heat generation rates of the windings, stator/rotor core, and permanent magnets were derived, with specific values summarized in Table 3.

Table 3.
Heat generation rates of components in the in-wheel motor.
4. Thermal Field Analysis of In-Wheel Motor
The peak speed of an in-wheel motor serves as a key indicator for evaluating the acceleration performance of electric vehicles, while its rated speed is closely related to the vehicle’s driving range. Therefore, this study focuses on investigating both peak and rated speed operating conditions. This paper presents a simulation analysis of the temperature field of an in-wheel motor using ANSYS Workbench (2022 R1). The simulation process for the magneto-thermal coupled temperature field of the in-wheel motor involved is illustrated in Figure 2.
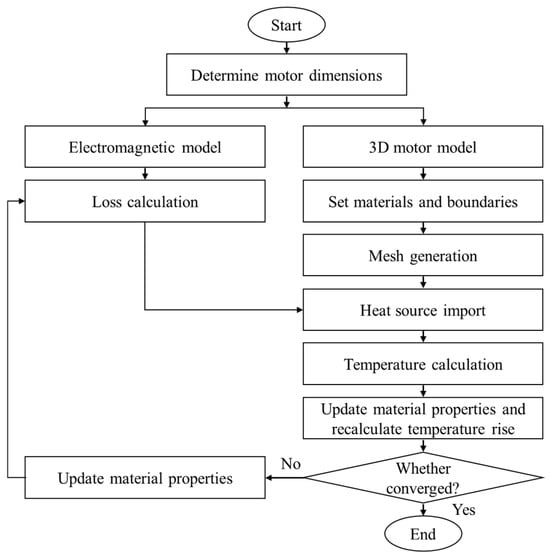
Figure 2.
Procedure for temperature field simulation.
For thermal field simulation of the in-wheel motor under different working conditions, a finite element model of the motor is first established. To verify the grid independence of the motor temperature simulation, the model mesh was progressively refined into four different density schemes. The mesh counts and corresponding simulation results for the four different mesh densities at the rated speed are presented in Table 4.

Table 4.
Maximum temperature of components under different mesh densities.
Based on the computational results in Table 3, the mesh density has a relatively small influence on the motor temperature simulation outcomes, indicating that the mesh division and temperature field simulation approach adopted in this study are reasonable and reliable. To meet the required computational accuracy, local mesh refinement was applied to the windings and air gap regions. Scheme 3 was ultimately selected for the final mesh configuration, with a total of 1,425,971 elements in the temperature field model. The corresponding finite element model of the hub motor is shown in Figure 3.
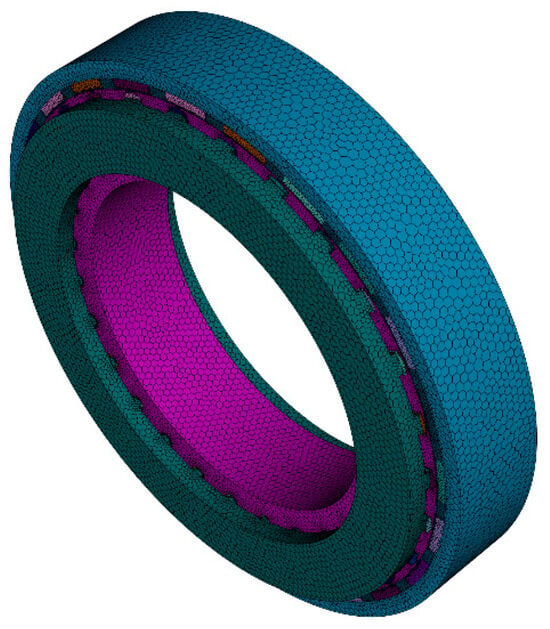
Figure 3.
Finite element model of the in-wheel motor.
After completing the mesh generation, the necessary parameters were configured for the simulation model. Heat sources were applied to their corresponding components, and the boundary conditions were set with an ambient temperature of 20 °C (room temperature). The solution was iterated until the motor temperature reached a stable state, which occurred at 800 iterations.
The simulated temperature distribution of the in-wheel motor under both operating conditions is shown in Figure 4.
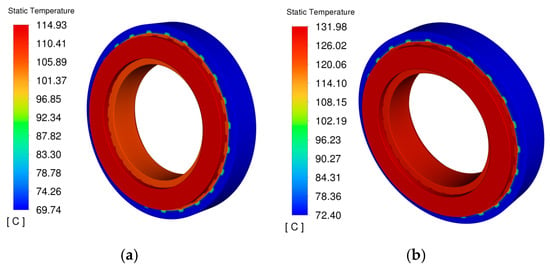
Figure 4.
Thermal distribution diagram of the in-wheel motor. (a) rated speed; (b) peak speed.
Under natural convection cooling conditions, the temperature distribution trends of the motor at rated speed and peak speed are consistent. The rotor region exhibits relatively lower temperatures, while higher temperatures are concentrated in the windings and stator. This phenomenon can be attributed to two main factors: firstly, the windings generate significant heat due to Joule losses; secondly, they are tightly encapsulated by insulation materials with low thermal conductivity. Additionally, the presence of an air gap between the stator and rotor—characterized by very low thermal conductivity—further contributes to the substantial temperature difference between these two regions.
Temperature contours of the key components of the in-wheel motor under the two operating conditions are shown in Figure 5 and Figure 6, respectively.

Figure 5.
Temperature contours of components at rated speed. (a) rotor; (b) stator; (c) windings; (d) permanent magnets.

Figure 6.
Temperature contours of components at peak speed. (a) rotor; (b) stator; (c) windings; (d) permanent magnets.
As shown in Figure 5 and Figure 6, the temperatures of various motor components at the peak speed are higher than those at the rated speed, with the winding temperature exhibiting a more pronounced increase. This is because the peak operating condition requires a larger current, which increases the copper losses and consequently raises the winding temperature. The temperature difference in the rotor under both conditions is relatively small because, although the heat generation in components increases at peak speed, the convective heat transfer coefficient on the rotor surface also improves with higher rotational speed, facilitating faster heat dissipation. As a result, the temperature rise in the rotor and permanent magnets remains limited, maintaining them at a relatively lower temperature.
Under both operating conditions, the windings are the hottest components. The hotspot in the windings is concentrated in the central axial region, with a maximum temperature of 114.93 °C at the rated speed and 131.98 °C at the peak speed. The hotspot is locally distributed over an axial span of approximately 20 mm, with temperatures gradually decreasing from the center toward both axial ends. This distribution results from the combined effects of concentrated electrical losses and inadequate heat dissipation in this region. Excessively high winding temperatures can accelerate the aging of insulation materials, thereby compromising the operational reliability and service life of the in-wheel motor. Therefore, it is essential to enhance the cooling conditions in the hotspot region and optimize the existing cooling structure of the in-wheel motor.
5. Heat Dissipation Optimization of In-Wheel Motor
According to Newton’s law of cooling, the heat dissipated by the cooling structure in an electric vehicle in-wheel motor can be expressed as:
where Pi represents the heat removed by the coolant, αi is the convective heat transfer coefficient, A denotes the heat dissipation area, and ΔT is the temperature difference between the coolant and the inner wall of the motor housing.
From Equation (9), it can be inferred that the heat dissipation performance can be enhanced by increasing the heat dissipation area of the coolant channels and the convective heat transfer coefficient in the cooling structure. Meanwhile, the design of the channel structure must balance cooling efficiency and pressure drop considerations. The number of channels, channel width, channel height, and coolant flow rate are critical factors influencing both aspects. Optimizing these parameters can effectively reduce the pressure drop in the coolant channels while improving cooling efficiency.
5.1. Cooling Channel Structure Selection
When selecting and designing the cooling channel structure for an in-wheel motor, the following principles should be adhered to: (1) The contact area between the fluid and the cooling channels should be maximized with optimal contact to ensure sufficient heat exchange; (2) The number of channel bends should be minimized to reduce pressure losses during fluid flow; (3) The cost should be minimized while considering factors such as manufacturability, operational safety, and reliability.
Based on the dimensions of the in-wheel motor, this study proposes three cooling channel configurations: a spiral channel, a parallel channel, and an axial channel. Their geometric models are illustrated in Figure 7.

Figure 7.
Geometric models of three cooling channels. (a) spiral channel; (b) parallel channel; (c) axial channel.
The three cooling channel structures were individually integrated into the stator of the in-wheel motor. With the initial water flow velocity set uniformly at 1 m/s, the temperature contours of the stator under rated speed conditions were simulated, as shown in Figure 8. Since the cooling channels are in direct contact with the stator, they exhibit the most effective heat dissipation for this component. Although the cooling performance varies slightly among the different channel types, the temperature near the contact area between the stator and the channels is significantly reduced. The highest temperatures in the stator are observed in the teeth and the outer wall regions.

Figure 8.
Temperature contours of the stator. (a) spiral channel; (b) parallel channel; (c) axial channel.
The simulated maximum temperatures of motor components under different cooling structures are summarized in Table 5. Compared to natural cooling, water cooling demonstrates significantly superior heat dissipation performance. Since the cooling jacket is in direct contact with the inner wall of the stator, it exhibits the most pronounced cooling effect on the stator and windings, reducing the stator temperature by approximately 55 °C and the winding temperature by about 40 °C. Among the three water cooling configurations, the differences in thermal performance are relatively small. The axial channel design yields the best heat dissipation results, followed by the parallel channel, while the spiral channel performs relatively less effectively.

Table 5.
Maximum temperatures under different cooling structures.
The pressure contours of different cooling channel configurations are presented in Figure 9. The maximum pressure varies significantly across channel types. The axial channel, characterized by numerous bends, exhibits the highest pressure drop of 9409.77 Pa. In contrast, the spiral channel, with no bends, demonstrates the lowest pressure drop of 3087.78 Pa. The parallel channel shows a slightly higher pressure drop of 3157.24 Pa compared to the spiral design. The “Static Pressure” values shown in the figure are defined relative to a reference pressure, typically the ambient atmospheric pressure. A positive static pressure indicates that the fluid pressure at that point is higher than the reference pressure, while a negative static pressure indicates that the fluid pressure is lower than the reference pressure.

Figure 9.
Pressure contours of different cooling channel configurations. (a) spiral channel; (b) parallel channel; (c) axial channel.
Based on the aforementioned analysis results, for outer-rotor in-wheel motors, water cooling demonstrates significantly superior heat dissipation performance compared to natural air cooling. Although the temperature differences among the three cooling channel configurations are relatively minor, their maximum pressure drops vary considerably. The axial channel exhibits the highest heat dissipation capacity but also the largest pressure loss. Conversely, the spiral channel yields a lower pressure loss but relatively inadequate cooling performance. Taking into account both heat dissipation efficiency and pressure drop, the parallel channel configuration is selected as the optimal cooling structure due to its favorable thermal performance and minimal number of bends.
5.2. Impact of Channel Width on Heat Dissipation Performance
The circumferential parallel cooling channel structure employed in this study is illustrated in Figure 10.
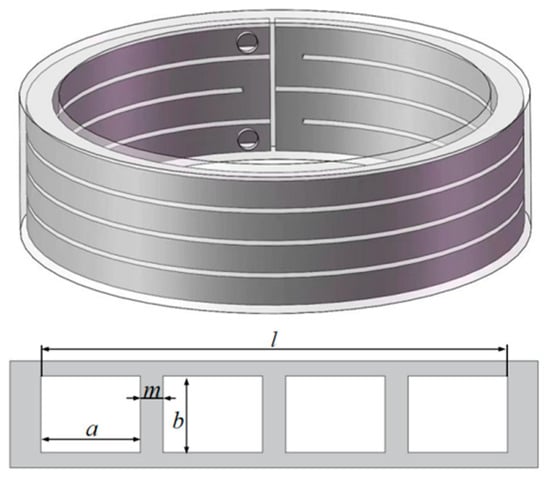
Figure 10.
Parallel channel structure model.
As illustrated in Figure 10, the expression for calculating the convective heat transfer area of the parallel channels can be formulated as follows:
where A represents the heat dissipation area of the channel; a denotes the cross-sectional width of the channel; b indicates the cross-sectional height of the channel, which is constrained by the water jacket structure and set to 10 mm; N is the number of channels, with one circumferential channel considered as a single parallel channel; L represents the circumferential length of a single parallel channel; Li denotes the total length of the channel; D is the average diameter of the channel; and m represents the thickness of the channel divider, which is set to 2 mm considering both structural strength and manufacturing constraints.
The heat dissipation area of the channels increases with the number of channels, meaning that the contact area between the channels and the coolant expands, resulting in improved heat dissipation capacity. The expression for calculating the heat transfer coefficient of the cooling channels is given as follows [22]:
where h is the heat transfer coefficient of the cooling channels; Pr denotes the Prandtl number of water, taken as 7; α1 represents the thermal conductivity of the fluid under static conditions, taken as 0.598 W/(m·K); Q indicates the coolant flow rate; and τ1 symbolizes the kinematic viscosity of water, taken as 1.519 × 10⁻⁶.
The heat transfer coefficient of the parallel channels is closely related to their geometric parameters. Under a fixed inlet flow rate, as the number of channels increases, the width of individual channel decreases accordingly, leading to a significant improvement in the convective heat transfer coefficient and ultimately enhancing the overall thermal performance.
5.3. Impact of Channel Width on Flow Resistance
When coolant flows through the channels, its motion characteristics are influenced by both the channel cross-sectional parameters and fluid viscous effects, resulting in two distinct types of flow resistance: frictional resistance and local resistance.
The magnitude of frictional resistance primarily depends on parameters such as the flow distance, flow velocity, and cross-sectional area of the channel. Its calculation formula is given as follows [23]:
where hy represents the frictional resistance, λ denotes the frictional resistance coefficient, v is the fluid flow velocity, de indicates the equivalent diameter of the channel, and g represents the gravitational acceleration.
The formula for calculating the frictional resistance coefficient varies with the Reynolds number of the fluid. When 2300 < Re < 105, the formula for the frictional resistance coefficient is as follows [24]:
When 105 ≤ Re < 106, the formula for the frictional resistance coefficient is as follows [24]:
Local resistance is primarily influenced by the cross-sectional dimensions and the flow path orientation of the coolant channels. The calculation formula for the local resistance of the channels is expressed as follows [23]:
where hj represents the local resistance, and ζ denotes the local resistance coefficient, taken as 0.8.
Combining the definition of fluid pressure, Equations (12) and (15), the calculation expression for the pressure in the cooling channel can be derived as follows:
where P represents the pressure in the cooling channel, and ρ denotes the density of the coolant.
Based on Equation (16), the variation curves of the pressure generated by the coolant flowing through the parallel channels with respect to the number of channels is shown in Figure 11.
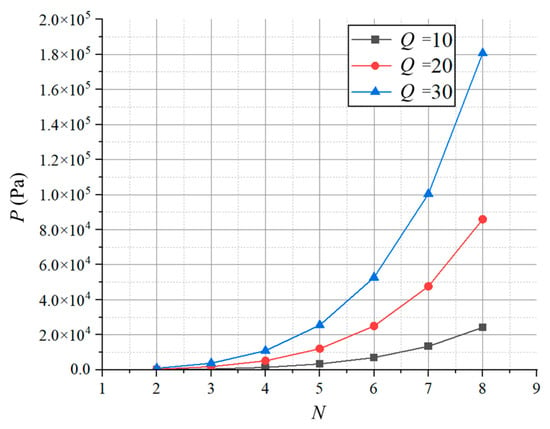
Figure 11.
Relationship curves between P and N.
As illustrated in Figure 11, the pressure drop in the parallel channels exhibits an exponential relationship with the number of channels. The reduction in channel width resulting from an increase in channel quantity leads to a significant rise in pressure drop. This indicates that selecting a smaller number of channels can effectively mitigate the pressure loss in the cooling system.
5.4. Optimization of Cooling Channel Parameters
To obtain the relevant parameters for the optimal heat dissipation capacity of the water channel, this paper employs the NSGA-II non-dominated sorting genetic algorithm for the multi-objective optimization of a circular parallel cooling water channel [25]. From the perspective of thermal performance, under the condition of meeting the dimensional requirements of the water channel, the heat dissipation area and convective heat transfer coefficient should be maximized. From the perspective of flow resistance, the pressure drop in the water channel should be as small as possible. Therefore, the optimization objectives are defined as maximizing the convective heat transfer coefficient and minimizing the pressure drop of the water channel. The width of the water channel and the coolant flow rate are selected as optimization variables to enhance the overall performance of the water channel to the greatest extent. The mathematical model for the multi-objective optimization of the parallel water channel is as follows:
where X is the optimization variable; F(X) is the objective function; A(X) represents the water channel area; H(X) denotes the convective heat transfer coefficient; and P(X) corresponds to the pressure drop of the water channel.
The multi-objective optimization of the aforementioned problem was solved using the NSGA-II genetic algorithm, with real-number encoding employed, a population size of 350, and 300 generations. After iterative computation, the Pareto front for heat dissipation area, convective heat transfer coefficient, and pressure drop was obtained, as shown in Figure 12. Based on a comprehensive consideration of thermal performance and pressure drop, the optimal solution set from the Pareto frontier was selected as the final solution for this multi-objective optimization. The optimized water channel width is 24 mm, the number of channels is 2, and the flow rate is 32.6 L/min.
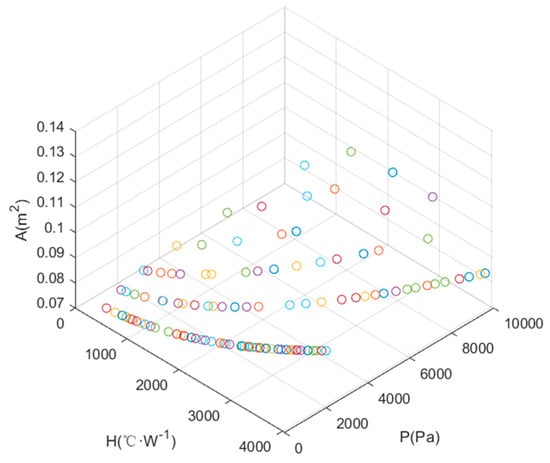
Figure 12.
Pareto front of the optimization objectives.
5.5. Simulation Validation of Optimization Results
The optimized water channel structure was installed in the motor, and temperature field simulations were conducted under different rotational speed conditions. The temperature distribution diagram of the in-wheel motor was obtained, as shown in Figure 13.
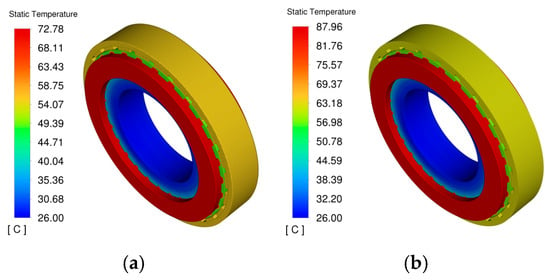
Figure 13.
Thermal distribution diagram of the optimized motor. (a) rated speed; (b) peak speed.
As can be seen from the figure, the overall temperature distribution trend of the motor remains unchanged, with the highest temperature located in the winding region. Compared to the pre-optimized water channel, the maximum temperature of the motor decreased to 72.78 °C under rated speed and to 87.96 °C under peak speed.
The temperature distributions of various components in the motor after water channel optimization under the two operating conditions are shown in Figure 14 and Figure 15, respectively.

Figure 14.
Temperature contours of components at rated speed after optimization. (a) rotor; (b) stator; (c) windings; (d) permanent magnets.

Figure 15.
Temperature contours of components at peak speed after optimization. (a) rotor; (b) stator; (c) windings; (d) permanent magnets.
As shown in Figure 14, under the rated speed condition, after the water channel optimization, the maximum temperature of the stator decreased from 52.83 °C to 50.23 °C, a reduction of 4.9%; the maximum temperature of the windings decreased from 74.46 °C to 72.78 °C, a reduction of 2.25%; the maximum temperature of the permanent magnets decreased from 55.47 °C to 55.40 °C, a reduction of 0.13%; and the maximum temperature of the rotor decreased from 55.43 °C to 55.37 °C, a reduction of 0.11%.
As illustrated in Figure 15, under the peak speed condition, after the water channel optimization, the maximum temperature of the stator decreased from 62.21 °C to 59.15 °C, a reduction of 4.9%; the maximum temperature of the windings decreased from 90.98 °C to 87.96 °C, a reduction of 3.32%; the maximum temperature of the permanent magnets decreased from 66.17 °C to 63.17 °C, a reduction of 4.53%; and the maximum temperature of the rotor decreased from 66.15 °C to 63.15 °C, a reduction of 4.53%.
A comparison of the pressure drop results before and after optimization is presented in Table 6. The optimized pressure drop is 5918.18 Pa, which represents a reduction of approximately 58.52% compared to the pre-optimization value of 14,269.24 Pa.

Table 6.
Comparison of the parameters before and after optimization.
Therefore, the optimized water channel structure demonstrates significantly enhanced thermal performance and a substantial reduction in pressure drop, validating the feasibility and effectiveness of the proposed heat dissipation optimization method for the in-wheel motor.
6. Conclusions
Addressing the thermal management challenges in electric vehicle in-wheel motors, this paper proposes a temperature field analysis method based on magneto-thermal coupling. The three-dimensional model, the magnetic–thermal coupling mathematical model, and the finite element model of the hub motor were established. The effects of different cooling structures and their key parameters on the thermal performance and hydraulic pressure loss of the in-wheel motor were investigated. An optimized cooling structure was designed using the NSGA-II genetic algorithm and validated through simulations. The main conclusions are as follows:
- (1)
- Under natural air-cooling conditions, the temperature distribution trends of the in-wheel motor at both rated and peak speeds are consistent. The rotor exhibits relatively lower temperatures, while the windings and stator experience higher temperatures, indicating the necessity for thermal optimization.
- (2)
- The three different water channel structures result in similar temperature distributions in the hub motor, but significant differences in maximum pressure drop. Considering both cooling effectiveness and pressure loss, the parallel channel structure was selected as the optimal cooling configuration.
- (3)
- The cooling structure optimized by the NSGA-II genetic algorithm demonstrates a reduction in the temperature rise in the in-wheel motor and a substantial decrease in the pressure drop of the cooling channels compared to the pre-optimized design. Under rated speed conditions, the maximum temperatures of the motor stator, rotor, windings, and permanent magnets decreased by 4.9%, 0.11%, 2.25%, and 0.13%, respectively. Under peak speed conditions, the maximum temperatures of the stator, rotor, windings, and permanent magnets decreased by 4.9%, 4.53%, 3.32%, and 4.53%, respectively, while the pressure drop in the water channels was reduced by 58.52%. Compared with the optimized results in Reference [26], the water channel pressure drop here decreased by 16.03%, whereas the maximum motor temperature increased by 0.19%. These results demonstrate the feasibility and effectiveness of the proposed temperature field analysis and cooling optimization method for the hub motor, providing a theoretical reference for temperature field calculation and cooling structure design of hub motors.
Author Contributions
Conceptualization, K.W. and Y.W.; methodology, Y.W.; software, Y.W.; validation, J.T. and C.Z.; formal analysis, S.L.; investigation, C.Z. and S.L.; resources, C.Z. and S.L.; data curation, Y.W.; writing—original draft preparation, Y.W.; writing—review and editing, K.W.; visualization, J.T.; supervision, K.W.; project administration, K.W.; funding acquisition, K.W. All authors have read and agreed to the published version of the manuscript.
Funding
This research was funded by the Industry University Research Cooperation Foundation of Jiangsu Province (grants BY2019062), the Natural Science Research Project for Universities of Jiangsu Province (grants 23KJA580004), and the Doctor Scientific Research Startup Foundation of Jiangsu University of Technology (grants KYY22012).
Data Availability Statement
The original contributions presented in the study are included in the article, further inquiries can be directed to the corresponding author.
Conflicts of Interest
The authors declare that the research was conducted in the absence of any commercial or financial relationships that could be construed as a potential conflict of interest. The funders had no role in the design of the study; in the collection, analyses, or interpretation of data; in the writing of the manuscript; or in the decision to publish the results.
References
- Fu, Y.Q.; Xia, T.T. Modeling and Simulation of Electric Vehicle Industry Development Based on System Dynamics. J. Syst. Simul. 2021, 33, 273–281. (In Chinese) [Google Scholar]
- Deng, Z.W.; Xiao, W.; Li, Y.; Huang, Y.; Jia, J.; Hu, X.S. Cycle Mileage Prediction of Electric Vehicle over Macro Timescale. J. Mech. Eng. 2021, 57, 250–258. (In Chinese) [Google Scholar]
- Chai, F.; Yu, Y.L.; Pei, Y.L. State-of-the-Art Technology and Prospects of Permanent Magnet In-Wheel Motors for Electric Drive Vehicles. Acta Armamentarii 2021, 42, 2060–2074. (In Chinese) [Google Scholar]
- Deepak, K.; Frikha, M.A.; Benomar, M.H.O. In-Wheel Motor Drive Systems for Electric Vehicles: State of the Art, Challenges, and Future Trends. Energies 2023, 16, 3121. [Google Scholar] [CrossRef]
- Mo, L.; Zhu, X.; Zhang, T.; Quan, L.; Wang, Y.; Huang, J. Temperature Rise Calculation of a Flux-Switching Permanent-Magnet Double-Rotor Machine Using Electromagnetic-Thermal Coupling Analysis. IEEE Trans. Magn. 2018, 54, 1–4. [Google Scholar] [CrossRef]
- Chen, L.X.; Liu, J.C.; Zhang, C.; Wang, X.Y. Analysis of Transient Temperature Field of Electric Vehicle Hub Motor Based on Fluid-Solid Coupling. Adv. Electr. Power Technol. 2021, 40, 73–80. (In Chinese) [Google Scholar]
- Liang, P.; Chai, F.; Shen, K.; Liu, W. Water Jacket and Slot Optimization of a Water-Cooling Permanent Magnet Synchronous In-Wheel Motor. IEEE Trans. Ind. Appl. 2021, 57, 2431–2439. [Google Scholar] [CrossRef]
- Li, Y.; Li, C.; Garg, A.; Gao, L.; Li, W. Heat Dissipation Analysis and Multi-Objective Optimization of a Permanent Magnet Synchronous Motor Using Surrogate Assisted Method. Case Stud. Therm. Eng. 2021, 27, 101203. [Google Scholar] [CrossRef]
- Saleem, A.; Park, M.H.; Ambreen, T.; Kim, S.C. Optimization of Oil Flow Distribution Inside the In-Wheel Motor Assembly of Electric Vehicles for Improved Thermal Performance. Appl. Therm. Eng. Des. Process. Equip. Econ. 2022, 201, 117753. [Google Scholar] [CrossRef]
- Zhou, Z.G.; Yang, W.H.; Li, Z.Z.; Li, H.D. Temperature Field and Thermal Stress of External Rotor In-Wheel Motor. J. Chongqing Jiaotong Univ. (Nat. Sci.) 2022, 41, 142–150. (In Chinese) [Google Scholar]
- Wu, S.; Li, Z.; Tong, W. Research on Thermal Calculation and End Winding Heat Conduction Optimization of Low Speed High Torque Permanent Magnet Synchronous Motor. CES Trans. Electr. Mach. Syst. 2023, 7, 397–403. [Google Scholar] [CrossRef]
- Zhou, Z.Y.; Xu, B.W.; Ma, J.E.; Zhang, Z.P.; Qiu, L.; Fang, Y.T. Temperature Field Analysis of High Speed Permanent Magnet Motor Considering Wind Friction Loss. Front. Acad. Forum Electr. Eng. 2025, 1286, 416–429. [Google Scholar]
- Zhou, N.; Wu, H.; Li, Z.; Ma, Y.; Lu, S. Optimization of Tesla Valve Cooling Channels for High-Efficiency Automotive PMSM. World Electr. Veh. J. 2025, 16, 169. [Google Scholar] [CrossRef]
- Chu, B.S.; Wang, K.Y.; Wang, Y.Y. Research on Regenerative Braking and Friction Braking Power Distribution Strategy of Wheel Hub Motor. Intern. Combust. Engine Parts 2024, 15, 1–5. (In Chinese) [Google Scholar]
- Boglietti, A.; Cavagnino, A.; Staton, D.A. Induction Motors Thermal Models: A Parameter Sensitivity Analysis. IEEE Trans. Ind. Appl. 2005, 41, 756–763. [Google Scholar] [CrossRef]
- Han, X.Y.; Qi, K.; Duan, Q.L. Numerical Calculation and Analysis of Three-Dimensional Transient Temperature Field PMSM External Rotor. Electr. Mach. Control 2015, 19, 44–52. [Google Scholar]
- Lu, Q.F.; Zhang, X.M.; Chen, Y. Modeling and Investigation of Thermal Characteristics of a Water-Cooled Permanent-Magnet Linear Motor. IEEE Trans. Ind. Appl. 2015, 51, 2086–2096. [Google Scholar] [CrossRef]
- Wang, C.; Huang, J.; Jiang, M.; Han, J.B.; Zhang, Z.R. Multi-Objective Optimization and Design of Flux-Concentrating Permanent Magnet In-Wheel Motor. Proc. CSEE 2024, 44, 1173–1183. (In Chinese) [Google Scholar]
- Lan, Z.Y.; Wei, X.H.; Li, H.R.; Liao, K.L.; Chen, L.H. Thermal Analysis of PMSM Based on Lumped Parameter Thermal Network Method. J. Electr. Eng. 2017, 12, 17–21. (In Chinese) [Google Scholar]
- Li, T.; Zhang, Y.T.; Liang, Y.X.; Ai, Q.; Dou, H.S. Thermal Analysis and Research of Axial Flux In-wheel Motor. J. Eng. Thermophys. 2021, 42, 1561–1568. (In Chinese) [Google Scholar]
- Wang, Q.S.; Zhang, L.C. Simulation Study on Temperature Field of Permanent Magnet Synchronous Hub Motor for Pure Electric Vehicles. J. Jiangsu Univ. Technol. 2023, 29, 80–86. [Google Scholar]
- Yang, X.W. Integrated Water-Cooled Motor Housing Structure Design and Optimization. Master’s Thesis, Shanghai Jiao Tong University, Shanghai, China, 2017. (In Chinese). [Google Scholar]
- Yang, X.W.; Zhang, X.F. Z-Shaped Cooling Channels of Motor Shell Designs. Electr. Mach. Control Appl. 2016, 43, 62–65. (In Chinese) [Google Scholar]
- Wang, Y.Y.; Wang, K.Y.; Zhu, C.Y. Analysis of Temperature Field and Water Cooling Heat Dissipation for Wheel Motor. Intern. Combust. Engine Parts 2024, 23, 1–4. (In Chinese) [Google Scholar]
- Shirini, K.; Aghdasi, H.S.; Saeedvand, S. Multi-Objective Aircraft Landing Problem: A Multi-Population Solution Based on Non-Dominated Sorting Genetic Algorithm-II. J. Supercomput. 2024, 80, 25283–25314. [Google Scholar] [CrossRef]
- Lou, H.Y.; Yang, X.G.; Zhang, M.; Zou, X.J.; Song, W.; Wang, L.M. Temperature Field Analysis and Cooling Structure Optimization of Wheel Hub Motors for Specialized Vehicles. Chin. J. Automot. Eng. 2025, 15, 155–163. [Google Scholar]
Disclaimer/Publisher’s Note: The statements, opinions and data contained in all publications are solely those of the individual author(s) and contributor(s) and not of MDPI and/or the editor(s). MDPI and/or the editor(s) disclaim responsibility for any injury to people or property resulting from any ideas, methods, instructions or products referred to in the content. |
© 2025 by the authors. Licensee MDPI, Basel, Switzerland. This article is an open access article distributed under the terms and conditions of the Creative Commons Attribution (CC BY) license (https://creativecommons.org/licenses/by/4.0/).