Article

Waste to Energy: Anaerobic Co-Digestion of Microalgal Biomass and Bakery Waste

by
Małgorzata Hawrot-Paw
* and
Jacek Tapczewski
Department of Renewable Energy Engineering, West Pomeranian University of Technology in Szczecin, Pawla VI 1, 71-459 Szczecin, Poland
*
Author to whom correspondence should be addressed.
Energies 2025, 18(20), 5516; https://doi.org/10.3390/en18205516
Submission received: 5 August 2025 / Revised: 3 October 2025 / Accepted: 16 October 2025 / Published: 20 October 2025
(This article belongs to the Special Issue Optimized Production of Bioenergy, Biofuels, and Biogas)

Abstract

Anaerobic digestion is a well-known technology for renewable energy generation. Its efficiency depends on the substrate composition and its biodegradability. Microalgae are considered a promising feedstock due to their rapid growth, high protein and lipid content, and potential for wastewater treatment. However, the mono-digestion is often limited by a low carbon-to-nitrogen (C/N) ratio and a recalcitrant cell wall structure. This study evaluated the potential of co-digesting microalgal biomass with bakery waste under batch conditions. Two types of bakery residues (stale wheat bread and stale wheat rolls), were tested. Each was added to the microalgal biomass at proportions of 25%, 50%, and 75% based on volatile solids (VS). The experiment was carried out in a semi-technical anaerobic digester under mesophilic conditions. During the anaerobic digestion, the biogas volume, gas composition, and the energy potential of the substrates were analysed. The highest biogas yield (494.34 L·kg−1 VS) was obtained from the mixture of microalgae and 75% bread. Although mono-digestion of microalgal biomass resulted in the highest methane concentration, the differences compared to co-digested samples were not significant. The lowest hydrogen sulphide concentration (234.20 ppm) was measured in the 25% rolls variant, while the control sample (100% microalgae) showed the highest H2S levels. From an energy perspective, the most beneficial result was obtained with the addition of 75% bread.

1. Introduction

Progressive climate change requires alternative ways to cover the increasing global energy demand. Biomass represents a renewable solution, offering the potential for heat, electricity, and also biofuel production [1,2,3]. Among biomass sources, waste biomass is most advantageous for biogas production, as it can be successfully utilised in biogas plants. During anaerobic digestion (AD), organic waste is recycled while simultaneously generating energy [4,5]. This process not only eliminates waste but also contributes to the implementation of a circular economy [6].
In Europe, the primary substrates used in anaerobic digestion include animal manure and corn silage [7]. However, these raise environmental and ethical concerns due to their competition with food production and agricultural land use, thus reducing the environmental efficiency of biogas plants [8]. Due to widespread availability, the use of lignocellulosic biomass is promising, but its complex structure requires expensive pre-treatment methods [9]. An alternative is algal biomass [10,11], which does not compete with food. Biogas can be produced from macroalgae and microalgae. Microalgae are defined as photosynthetic single-celled or simpler multicellular microorganisms found in marine and freshwater environments. This functional group includes eukaryotic microalgae such as green algae (Chlorophyta), red algae (Rhodophyta), and diatoms (Bacillariophyta), as well as prokaryotic microalgae (Cyanobacteria), which are often included in this group due to their ecological and physiological similarities [12]. They accumulate high amounts of proteins, carbohydrates, and lipids, making them promising candidates for bioenergy conversion, including anaerobic digestion. Microalgae grow rapidly [13], do not compete with food crops [14], and have significant carbon sequestration potential [15]. Furthermore, they can be cultivated using nutrients recovered from various types of wastewater [16,17]. The energy potential of microalgal biomass is primarily determined by its biochemical composition, especially lipid, carbohydrate, and protein content [18,19]. However, certain structural characteristics, such as a resistant cell wall, limit disintegration and the release of organic components during AD [20,21]. Another limiting factor is the typically low C/N ratio [22], which results from the relatively high protein content [23]. The optimal C/N ratio for stable anaerobic digestion is 20:1 to 30:1 [24], whereas microalgal biomass is protein-rich and typically has a low C/N ratio near ~6 [25]. This can lead to ammonia accumulation and AD instability. The effectiveness and efficiency of the AD process can be increased through co-digestion technology with substrates containing higher amounts of carbohydrates. One of the important areas of development in this energy sector is waste processing [26,27,28]. There is a problem of food waste, and bakery products are one of these bio-waste streams. Food waste is generated at the production stage, during transport, processing, storage, and sale (products that have not been sold and are no longer fit for consumption), as well as in households [29]. Due to its high organic matter content, food waste has high potential for biogas production [30]. Bakery waste contains easily fermentable carbohydrates and has a higher C/N ratio compared to microalgae [31]. According to Unis et al. [32], bread waste showed C/N values between 7.1 and 23.4. This reflects its carbohydrate-rich composition; however, the high sugar content can lead to acidification in the digester. The resulting acidification decreases pH to suboptimal levels for methanogens [33]. During the co-digestion of microalgal biomass and bakery waste, a more suitable ratio of components should be obtained to increase biogas production.
The present study aims to analyse the energy potential of co-digesting microalgal biomass with bakery waste. Microalgae have been widely tested in anaerobic digestion. Most studies use microalgae alone or combine them with mixed food waste or other residues. For instance, Pan et al. [34] demonstrated increased biogas yield through co-digestion with food waste by 2.04–26.86%. Research about microalgae as the main substrate in anaerobic digestion with bakery waste is still limited. This issue is critical because microalgae are protein-rich with low C/N ratios, while bakery waste is carbohydrate-rich and readily degradable. Dubrovskis and Plume [35] reported that damaged bread is highly biodegradable, achieving methane yields of up to 427 L kg−1 DOM, with ~50% CH4 in biogas. These results suggest strong potential but also further investigation is required. To our knowledge, there are no experimental reports in which microalgae served as the main substrate and bakery waste was applied as a defined co-substrate. This novelty is significant because such a configuration allows for C/N balance and supports waste-to-energy conversion. By conducting semi-technical scale experiments, this study provides new process data that better describe real operating conditions. We hypothesise that co-digestion of these substrates will increase biogas yield while reducing hydrogen sulphide concentration. In biogas, H2S arises from a load of sulphur and from sulphate reduction. Protein-rich substrates increase H2S formation, whereas bakery waste is mainly polysaccharides. Co-digestion with such low-sulfur, carbon-rich streams can lower H2S by diluting sulfur inputs and shifting competition away from sulfate reducers. Studies report marked H2S decreases when a low-sulfur co-substrate is used [36]. The study analysed the quantity and qualitative composition of the biogas produced and the energy value of the substrates to the digester.

2. Materials and Methods

2.1. Substrates and Their Preparation

The main substrate used in the experiments was dried and rehydrated biomass of microalgae of the Scenedesmus genus, obtained from our own cultivation. Culture was axenic, and purity was routinely verified by light microscopy. Microalgae were grown in a horizontal tubular photobioreactor (total volume: 850 L) equipped with automatic substrate dosing and a control-measurement system for cultivation parameters, including temperature, light (photoperiod), pH, optical density (OD), flow rates of CO2 and air, and integrated biofilm cleaning cycles. Scenedesmus strain was grown under optimal conditions, including LED lighting (300 µmol m−2 s−1, 18/6 h light/dark cycle) and nutrient dosing (F/2 medium). After 10 days, the biomass was harvested via centrifugation (8000 rpm); dried at 35 °C to minimise crucial component losses, and stored at 4 °C until use. Before loading into the digester, the dried biomass was rehydrated with water and homogenised.
Stale wheat bread and stale wheat rolls were used as co-substrates. After grinding in a laboratory mortar, the samples were dried (105 °C) to determine total solids (TSs) and burned (550 °C) to determine volatile solids (VSs). The biogas plant feedstock (microalgae biomass and individual bakery waste in appropriate doses) was added in a container with water, homogenised, and fed into the digester using a peristaltic pump.

2.2. Equipment and Digester Configuration

The experiments were carried out on a semi-technical scale. A micro-biogas plant with a digester of total capacity 115 L and working capacity 100 L was used (Figure 1).
The digester was equipped with a mechanical stirrer to homogenise the load, prevent substrate sedimentation, and thus increase the efficiency of the methane production. The process parameters are analysed by measuring sensors for the pH of the load, temperature, and oxidation-reduction potential (ORP). The Peltier cell and water jacket are components of the micro-biogas plant responsible for maintaining constant thermal conditions.
A semi-continuous loading regime was used: at the start of each cycle, 10% of the working volume was removed and replaced with fresh load. No additional inoculum mineral medium was added. The load mixture (rehydrated microalgae and bakery waste) was prepared by mixing the dried, milled substrates with water only.

2.3. Anaerobic Digestion Methodology

The AD was carried out under mesophilic conditions. The anaerobic digestion for each load was carried out over 7 days. The amount of biogas, biogas composition, energy value for substrates, and stability of process conditions were analysed. The tests were started on the first day after the load was introduced into the digester, and then after 2, 3, 4, and 7 days. The pH, temperature, and ORP were monitored during the process using the biogas plant’s control and measurement system.

2.4. Analytical Procedures

Biogas volume was measured using a water displacement method. Other parameters monitored during AD, units of measurement, and methods are summarised in Table 1. All experiments were conducted in the same digester.
The following equation was used to calculate the energy efficiency of the substrates [37]:
E e = Q × C v V S ,
where:
Ee—energy efficiency of microalgal biomass [kWh·kg−1 VS];
Q—volume of produced biogas [L];
Cv—unit calorific value of the produced biogas [kWh·L−1];
VS—mass of converted microalgae [kg VS].
The calorific value of the produced biogas (Cv) was obtained directly from the biogas analyser (OPTIMA MRU), which reports the energy values in MJ·m−3. These values were converted to kWh·L−1. The volatile solids (VSs) content of microalgal biomass was determined gravimetrically as the difference between total solids (dried at 105 °C) and ash content (after combustion at 550 °C). The converted VS mass was then calculated based on the amount of substrate introduced into the digester.
The factor for avoided CO2 emissions from biogas energy production compared to fossil fuels was calculated using the following formula:
C O 2   a v o i d e d = E × E F f o s s i l ,
where:
E—energy recovered from 1 kg of substrate (biomass) in the anaerobic digestion process [kWh·kg−1 VS];
EFfossil—CO2 emission factor for fossil fuel [kg CO2·kWh−1].
The CO2 emission factors (EFs) for conventional fuels (coal, heating oil, and natural gas) were determined based on data published by the UK Department for Environment, Food, and Rural Affairs (DEFRA) [38]. For biogas, CO2 emissions were assumed to be zero (biogenic origin).
The Statistica computer program (version 13.3, 2016; Dell Inc., Tulsa, OK, USA) was used to analyse the averages from biogas production and the average amount of hydrogen sulphide. An analysis of variance and Tukey’s post hoc tests were carried out to identify significant differences.

3. Results and Discussion

3.1. Biogas Production from Bakery Waste

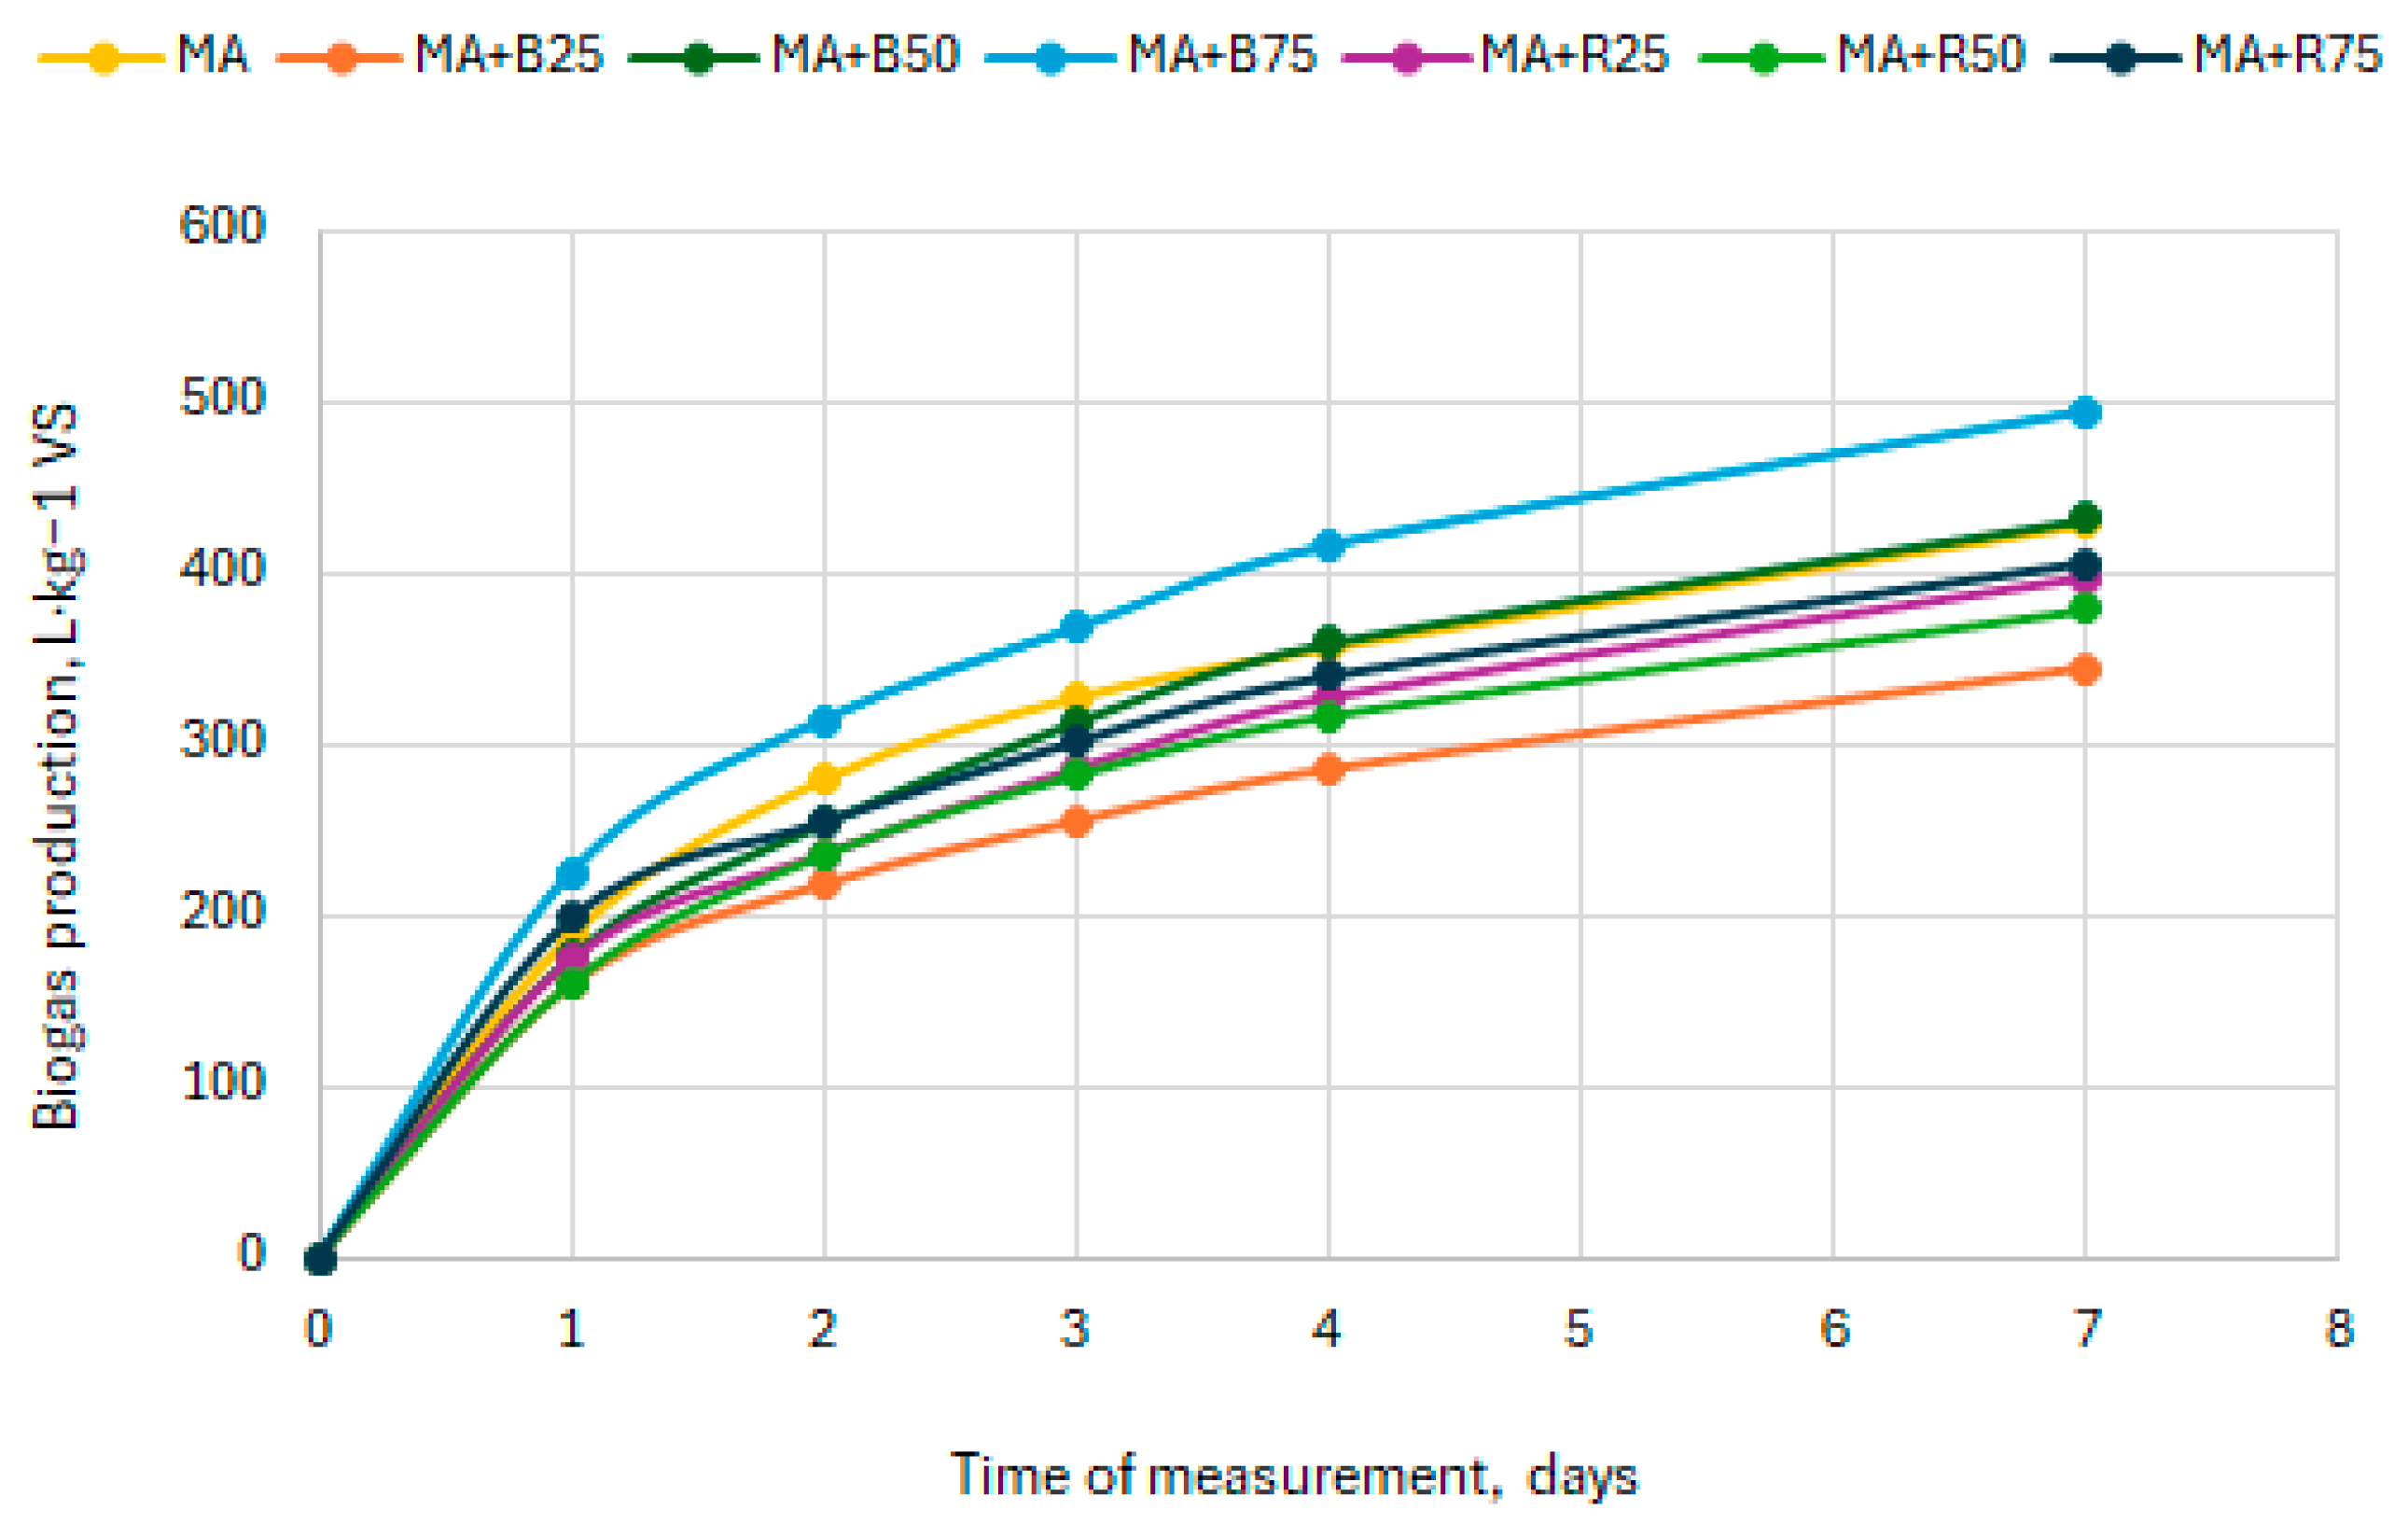
The volume of biogas produced in the methane production process varied depending on the substrate composition. Mono-digestion of microalgal biomass yielded the lowest biogas volume, while the addition of bakery waste as a co-substrate increased total biogas output (L) compared to the control variant. After converting the production to volatile solids (L·kg−1 VS), the total amount of biogas gradually increased in all variants (Figure 2). For the control load (MA), the values ranged from 188.00 L·kg−1 VS on the first day of measurement to 428.00 L·kg−1 VS after 7 days. Mussgnug et al. [39] found that the potential for biogas production depended on the species and on the pretreatment. Based on the summary provided by Murphy et al. [40], the specific biogas yields from microalgae range from 287 to 611 L·kg−1 VS In all co-digestion variants, except for MA + B75, the measured values were lower compared to the biogas yield for mono-digestion. After adding 75% bread to microalgal biomass, 494.34 L·kg−1 VS biogas was obtained after 7 days. Dubrovskis and Plume [35] confirmed that damaged bread can be used for biogas production, and the biogas yield in their studies depended on the type of bread. In the presented study, the amount of biogas in the MA + B75 variant was more than 15% higher than in microalgal mono-digestion. The positive effect of using waste wheat and rye bread in co-digestion with biological waste is also confirmed by Li et al. [41].

3.2. Methane Content in Biogas

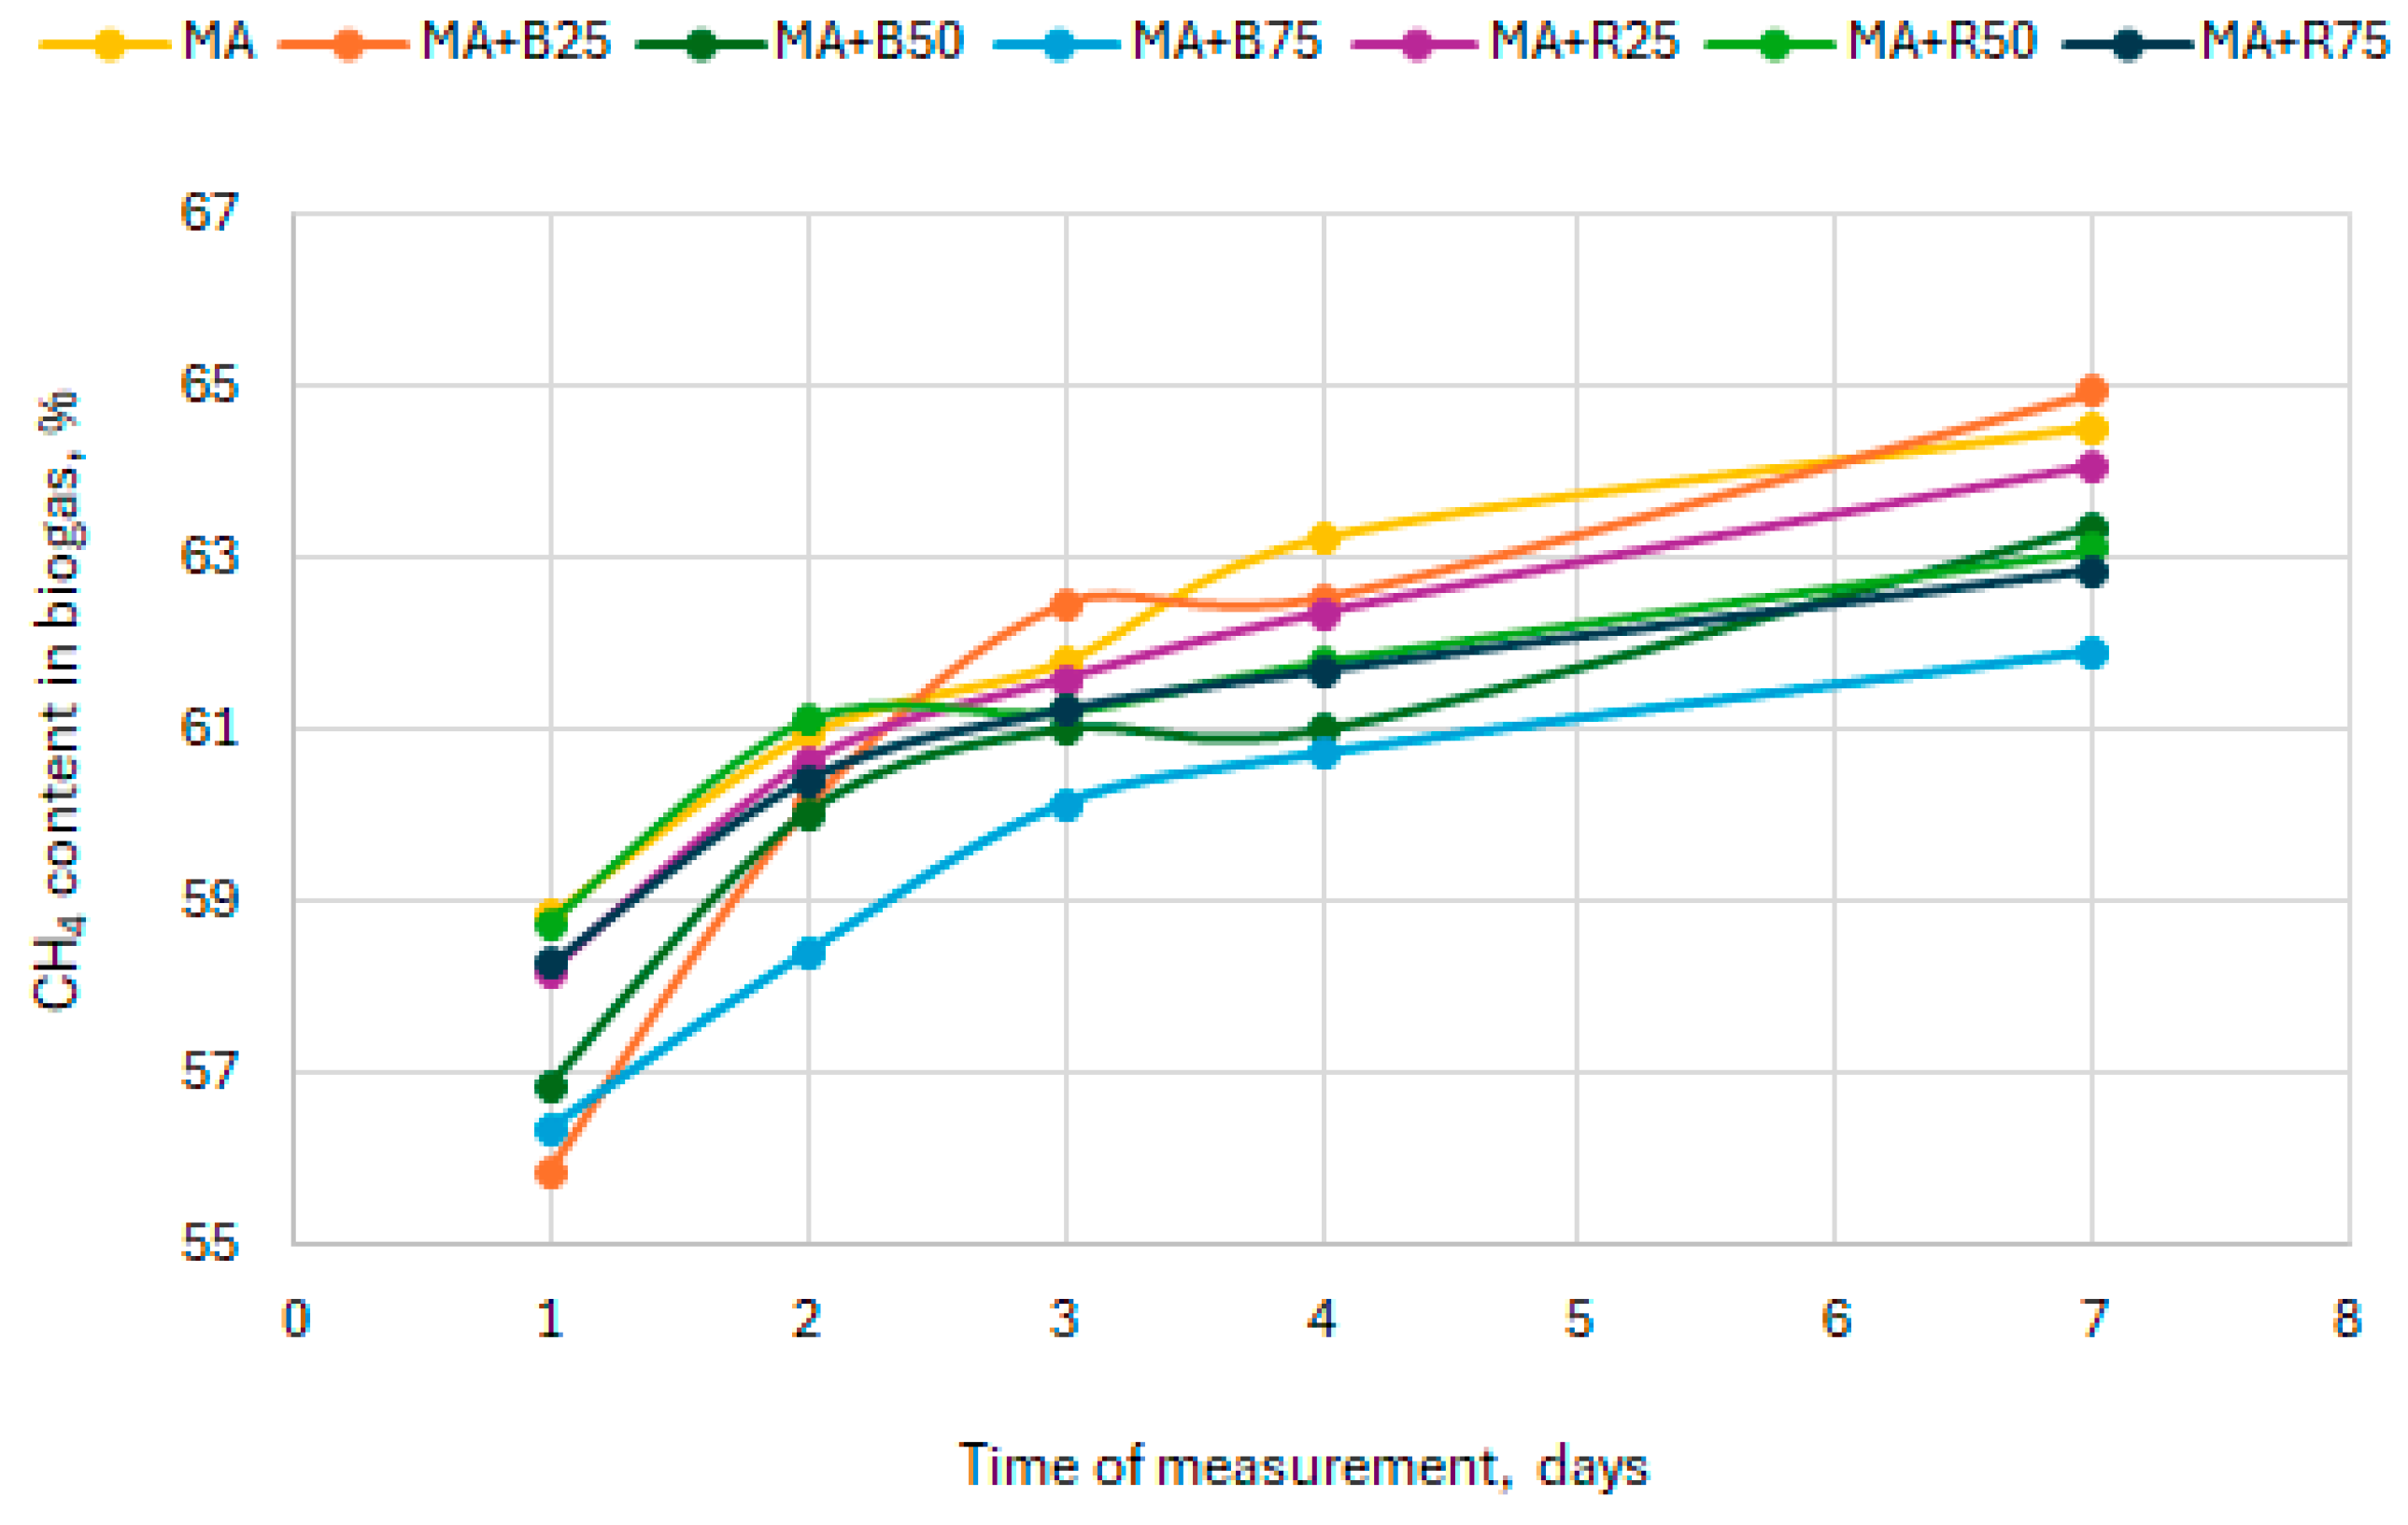
Methane concentration in biogas was presented in Figure 3. The CH4 content changed throughout the experiment, especially between the first and fourth measurement days. The lowest values were observed during the AD of a mixed substrate containing microalgae and bread in a 75% dose, where the initial methane content was 56.63%. The methane value increased in the following days, up to 61.92% after 7 days. Similar changes were also observed in the other AD variants. Calbry-Muzyka et al. [42] analysed biogas composition data from agriculture and the organic fraction of municipal solid waste. They found that the typical methane content in biogas ranges between 45 and 70%, depending on the AD conditions and the type of substrate used. In the presented studies, a maximum CH4 (64.53%) was obtained during mono-digestion of microalgal biomass. In batch BMP assays, Scenedesmus obliquus has been reported to reach an ultimate methane yield of 332 ± 24 mL CH4 g−1 VS [43]. This value illustrates the relatively high anaerobic biodegradability of biomass. In batch experiments with Scenedesmus obtusiusculus biomass pretreated at 98 °C for 6 h, methane yield ranged from 109.3 to 192.7 mL CH4·g−1 VS at 1–10 g tCOD·L−1, indicating that conversion depends on loading and pre-treatment [44]. In studies conducted by Roberts et al. [45], Scenedesmus sp. achieved a BMP of 0.261 L CH4·g−1 VS, which highlights the variability depending on the strain. The above results indicate that Scenedesmus biomass is capable of generating biogas with a high methane fraction and a notable volumetric methane yield. It confirms its potential as a substrate for anaerobic digestion. According to Murphy et al.’s [40] data compilation, microalgae exhibit methane yields between 100 and 450 L/kg VS. Variability in methane content when digesting Scenedesmus biomass can be related to its biochemical properties. The species is characterised by a recalcitrant, rigid cell wall [46] and high cell protein content [47]. During anaerobic digestion of microalgal biomass, increased nitrogen content can cause ammonia release, affecting methanogenic activity [48]. For co-digestion, the highest methane content was observed for the MA + B25 variant (64.94%). We can increase methane yield by optimising the composition of the digester load. That is indicated by research carried out by Barros et al. [49], who obtained a maximum of 311 mL/g VS, with a methane yield of 252 mL/g VS.
Although the average biogas yield was highest in the MA + B75 variant, its CH4 content was slightly lower (Figure 4). The mono-digestion of microalgal biomass generated a lower total volume of biogas, but it resulted in the highest methane content, reaching 61.88%.
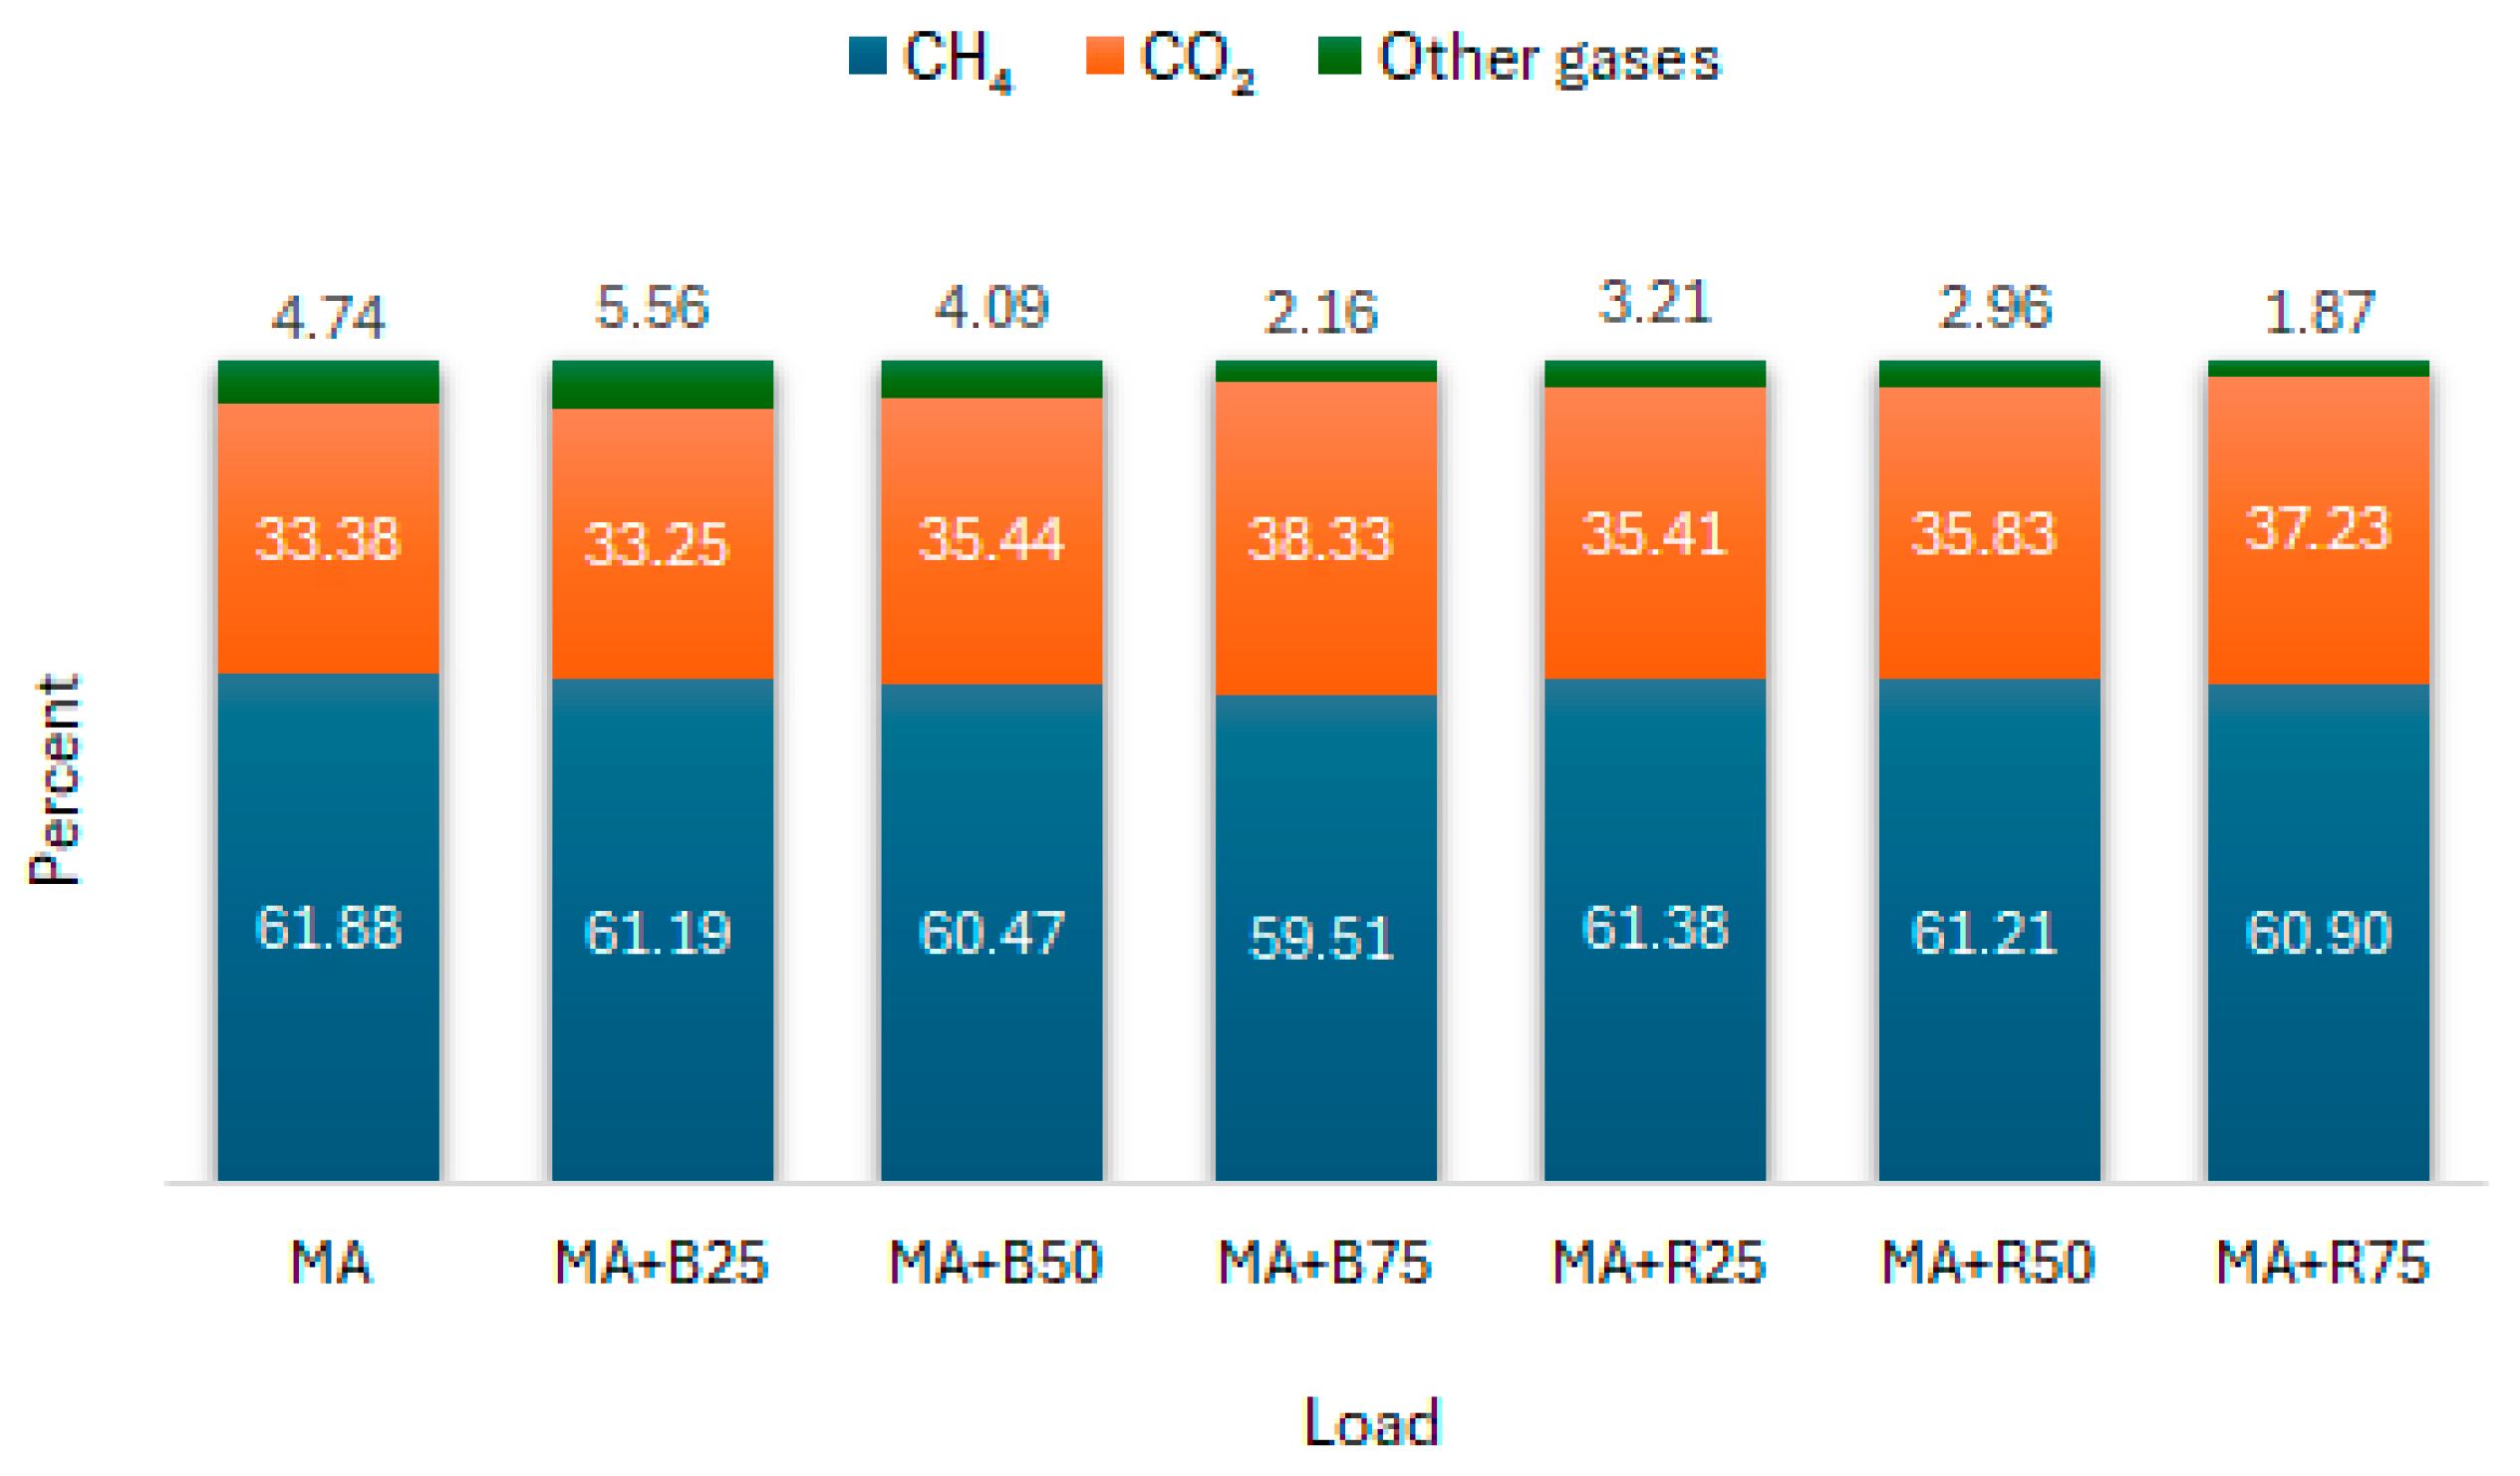
The average content of methane and other gases in biogas is shown in Figure 5. The methane content ranged from 59.51% (MA + B75) to 61.68% (MA). The CO2 content in biogas varied from 33.25% to 38.33%. The proportion of other gases in biogas, depending on the substrate for the AD, ranged from 1.87% for MA + R75 to 5.56% for MA + B25.

3.3. Hydrogen Sulphide Content in Biogas

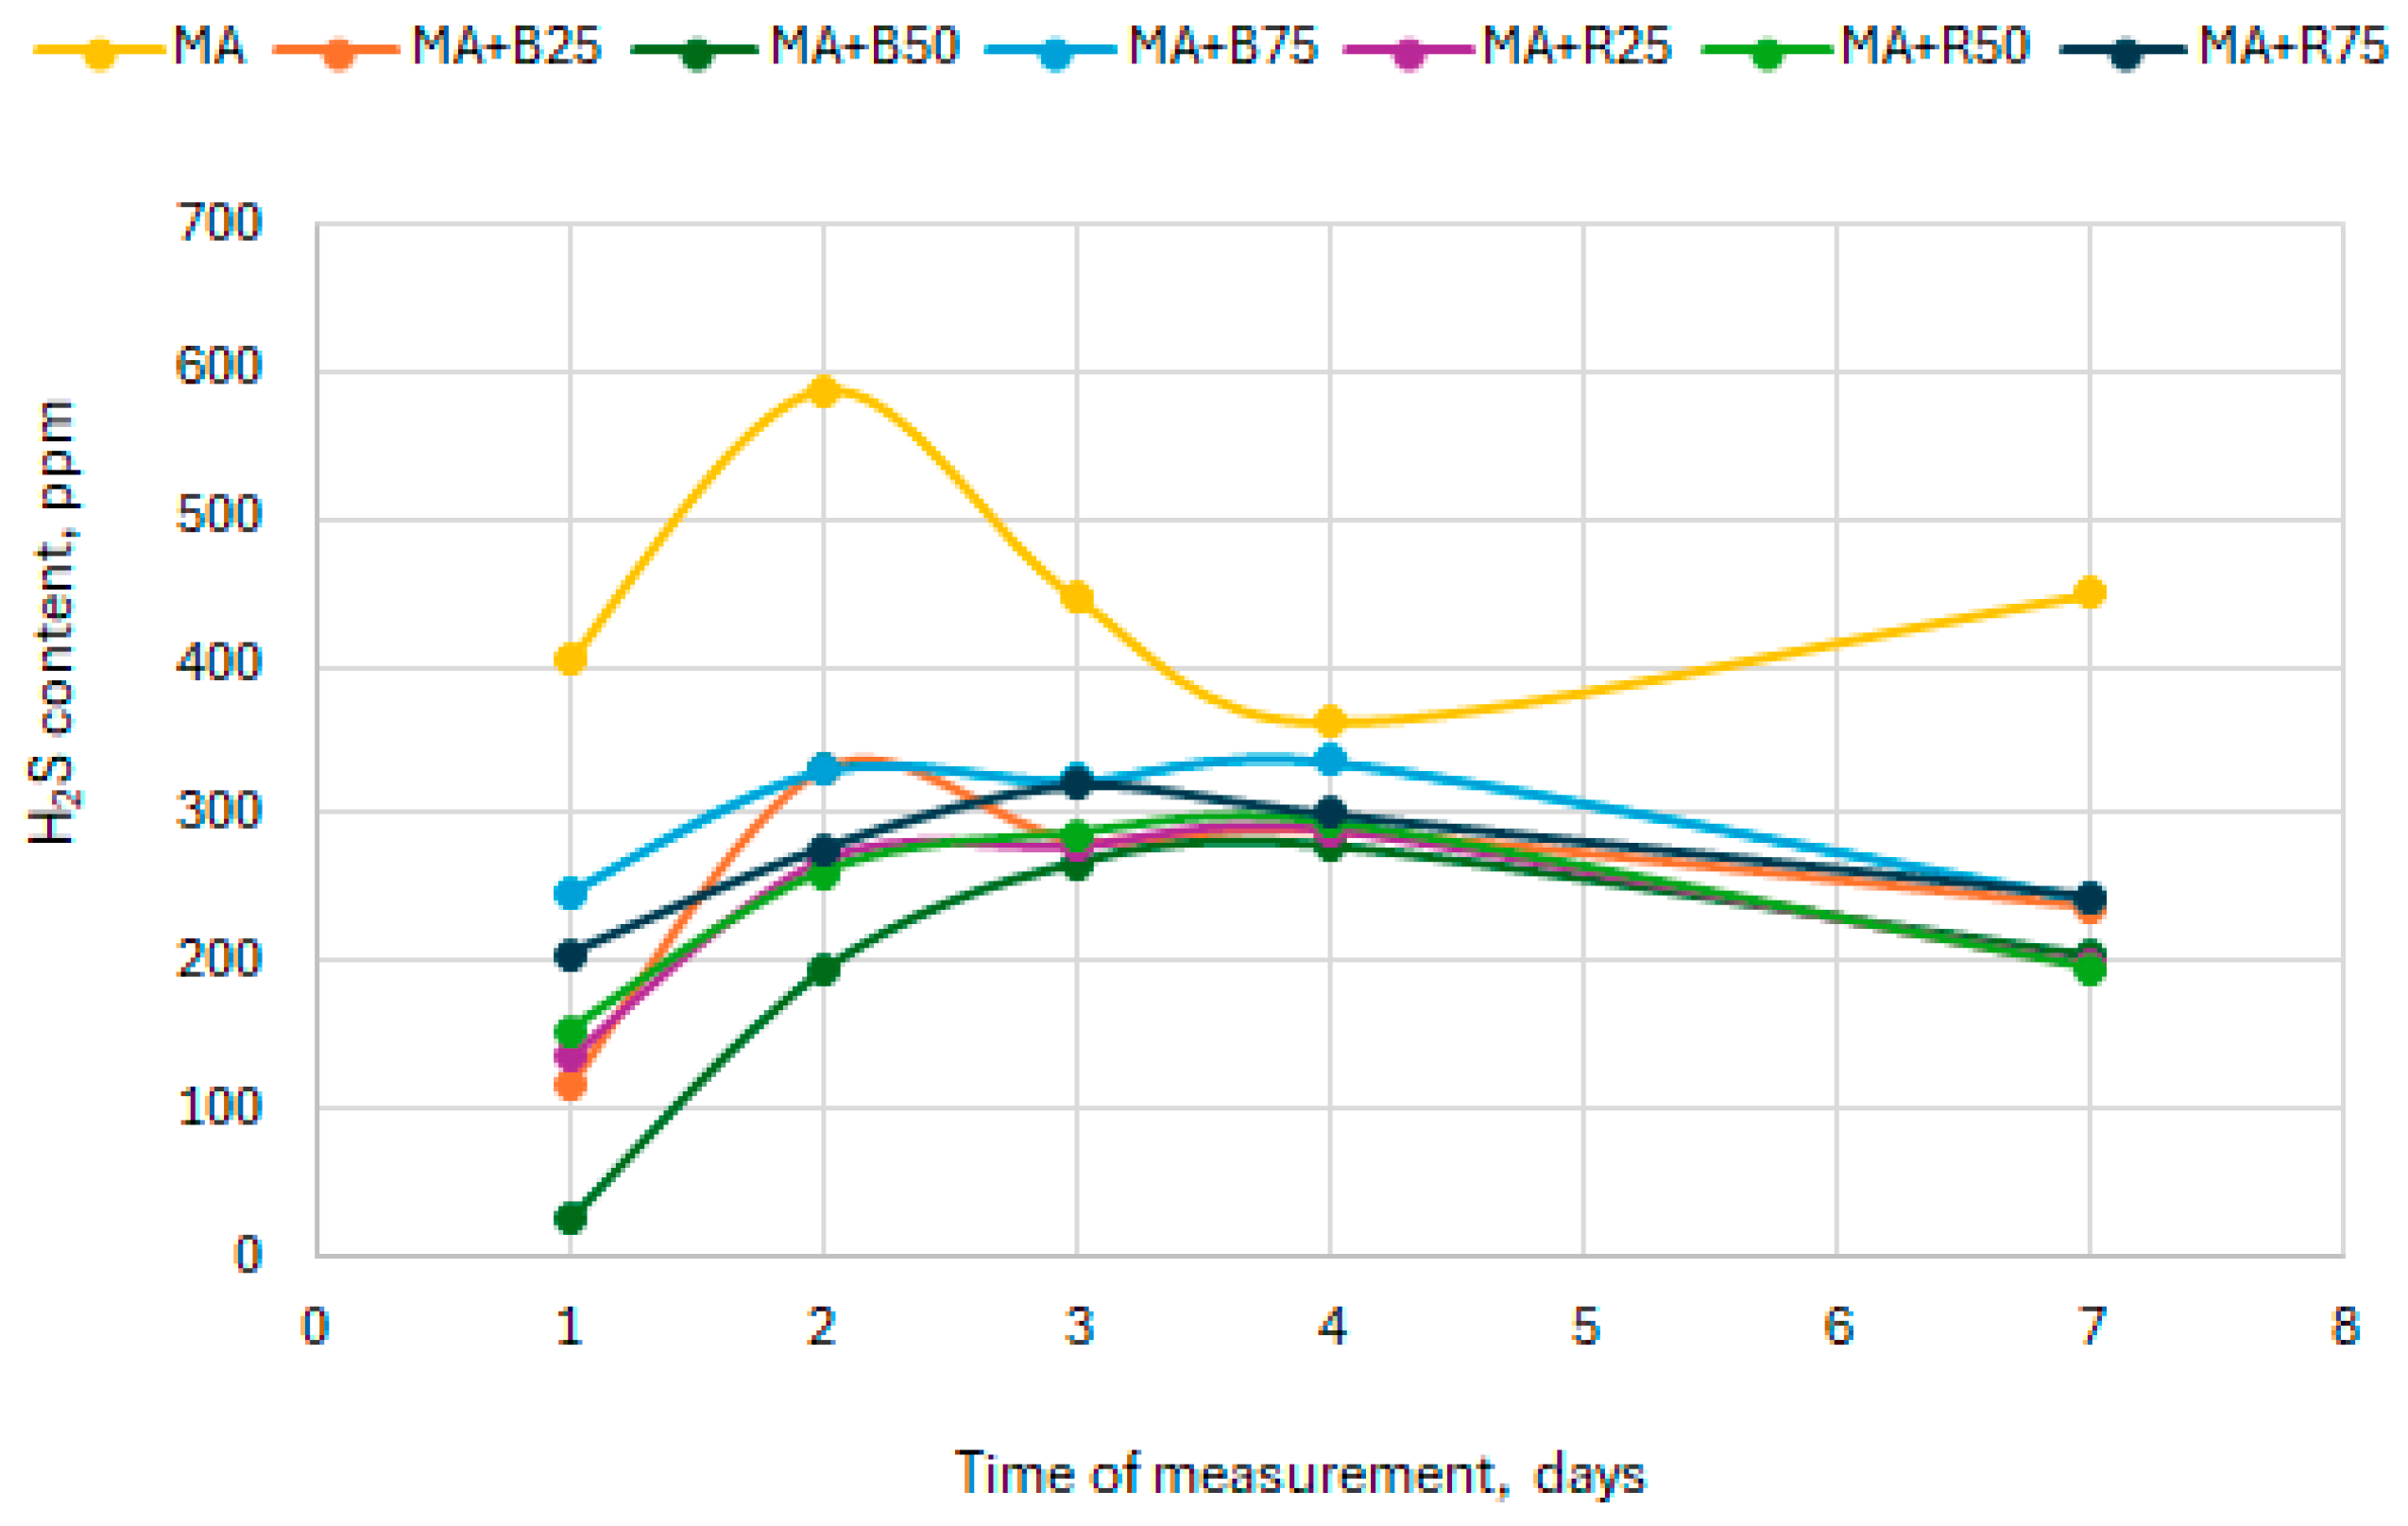
Changes in hydrogen sulphide content during the AD are presented in Figure 6. The concentration of hydrogen sulphide in biogas varied significantly based on the substrate, ranging from 0 ppm to approximately 20,000 ppm [50]. In the control variant (100% microalgal biomass), the hydrogen sulphide content increased from approx. 400 ppm on day one to over 580 ppm on the following day. However, this peak was a short-term one; by day three, the H2S content decreased to around 450 ppm, and by day four, it further declined to 363 ppm. After seven days, the H2S level returned to 450 ppm, which remained higher than in the other tested variants. In studies carried out by Kisielewska et al. [51], the average H2S content varied depending on the taxonomic composition of the algal biomass, ranging from 921 ppm for Bacillariophyceae to 2014 ppm for Cyanoprokaryota, and 1439 ppm for Chlorophyta. These findings indicate that the biochemical composition of different algal groups significantly affects H2S production. Elevated sulphur concentrations in co-substrates (e.g., food waste) increase the risk of H2S accumulation in biogas [52]. In the present experiment, biogas obtained from the co-digestion of microalgal biomass and bakery waste exhibited varying H2S levels throughout the AD process. The highest values were recorded between the second and fourth days of digestion. According to Khoshnevisan et al. [53], the recommended hydrogen sulphide concentration in biogas ranges from 200 to 500 ppm (0.02–0.05% w/w), as exceeding this range can compromise gas quality and protect energy conversion equipment. In this study, the measured levels remained within the recommended range throughout the entire duration of the experiment. However, for food waste anaerobic digestion, the hydrogen sulphide level should be monitored to prevent corrosion and ensure process stability.
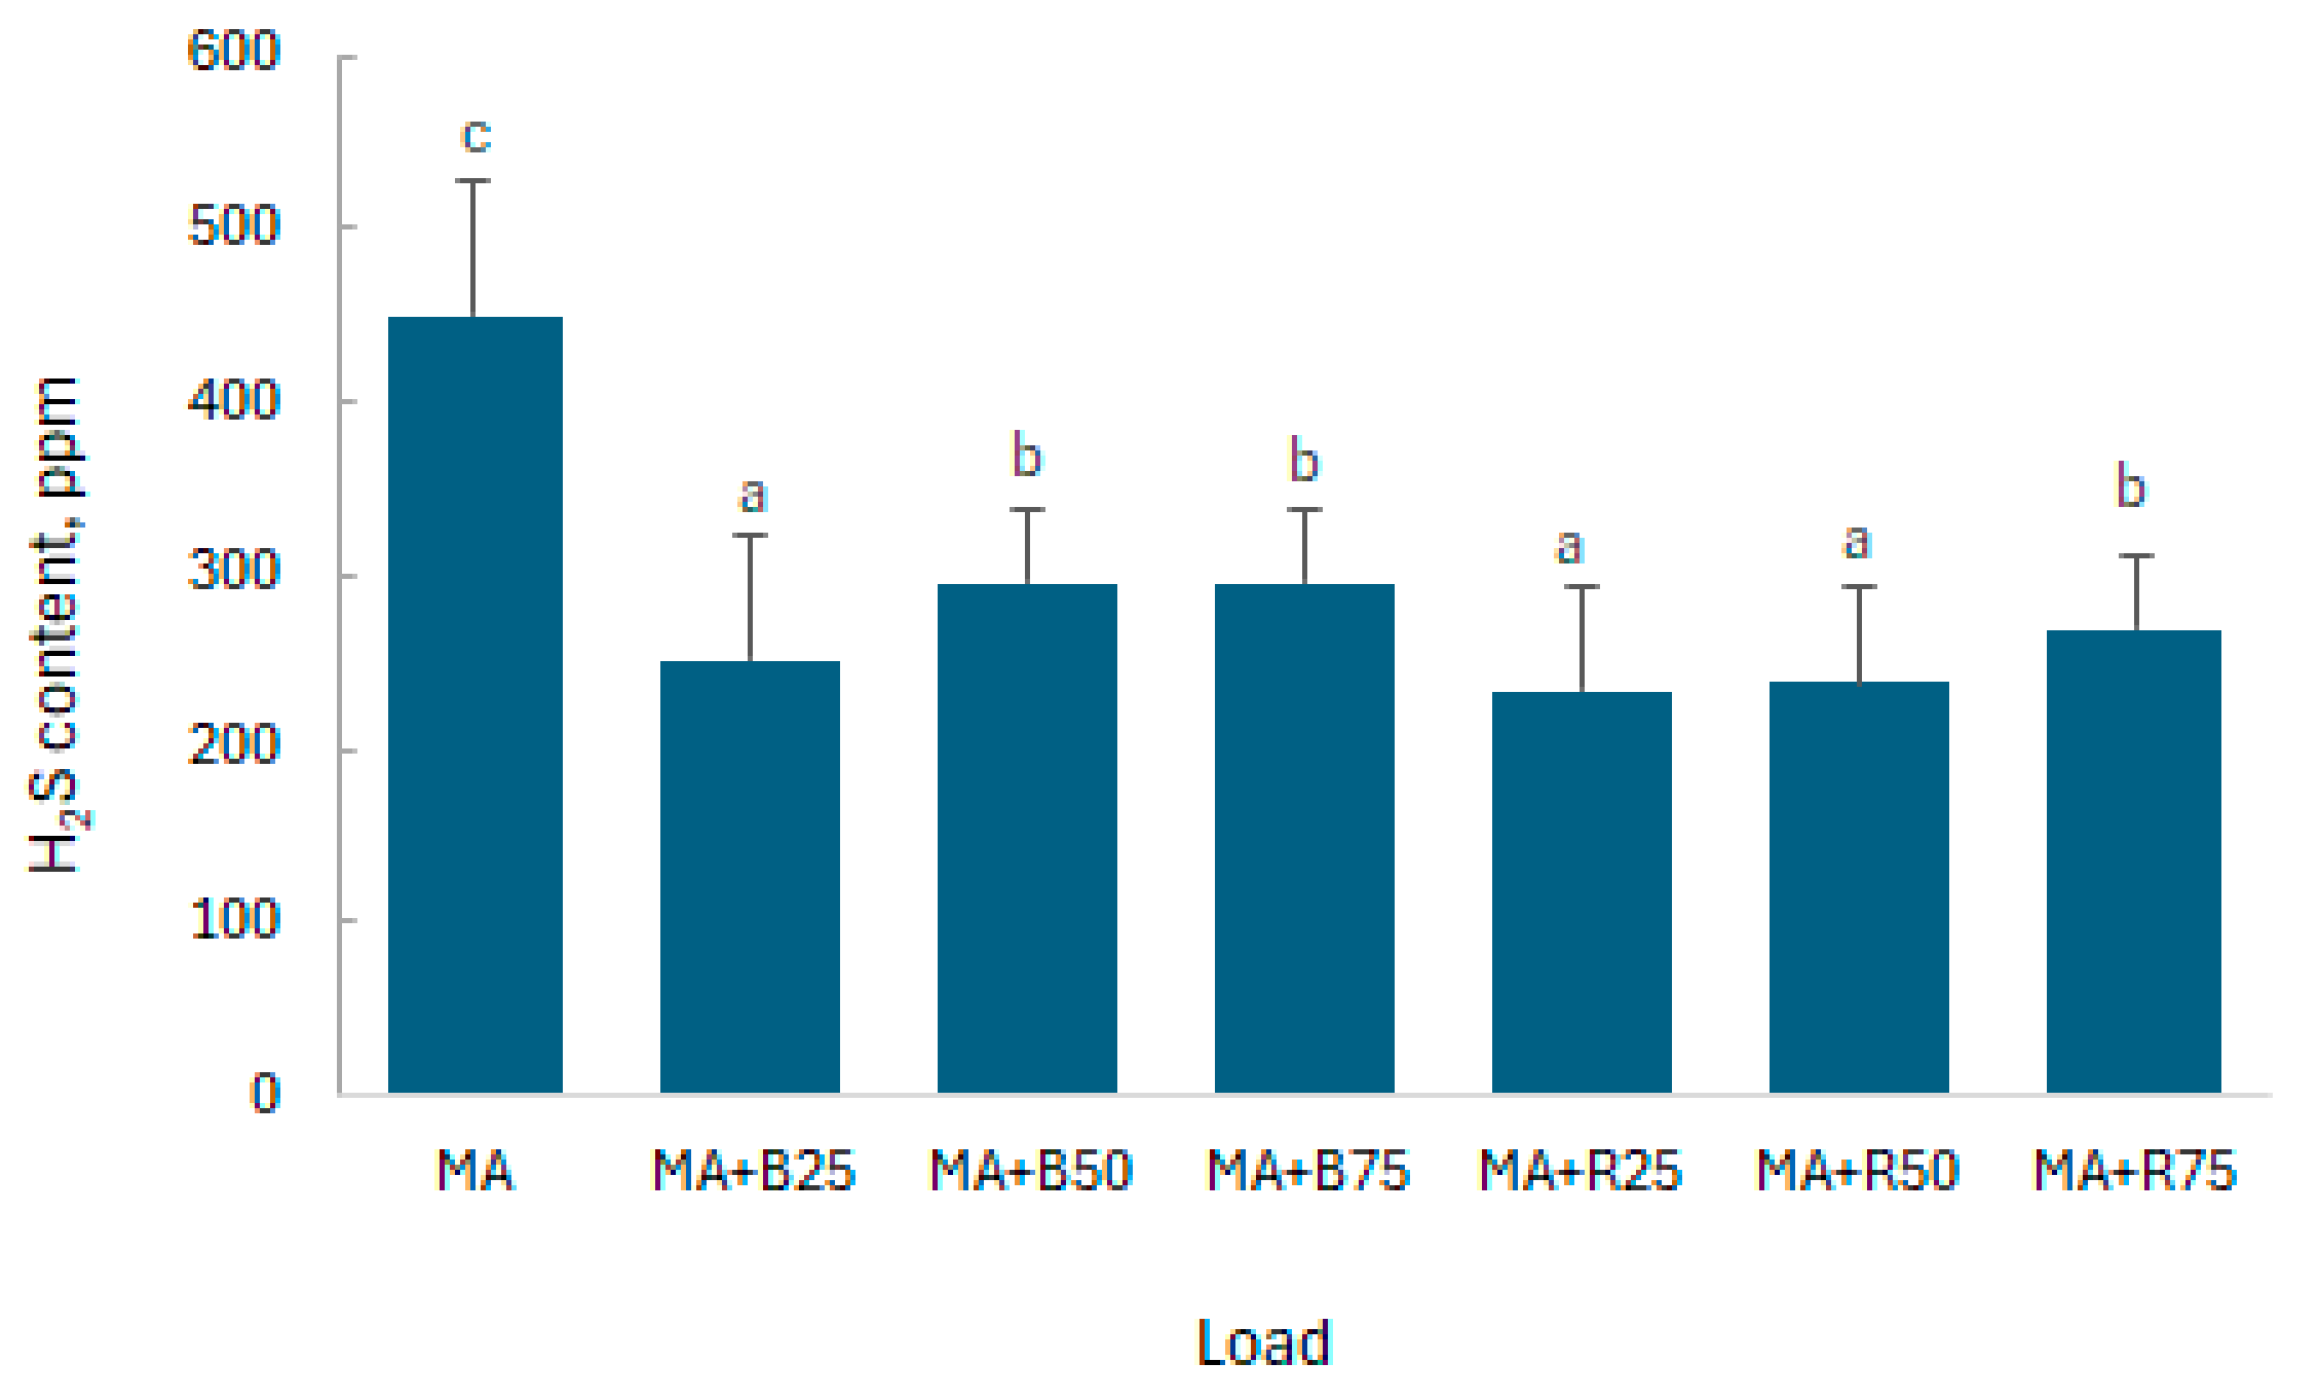
The highest average H2S concentrations were recorded in the control sample containing only microalgal biomass undergoing anaerobic digestion, with values slightly exceeding 450 ppm. The lowest values were observed during the AD of microalgal biomass co-digested with rolls at a 25% dose, where concentration was less than 235 ppm (Figure 7). Hydrogen sulphide in biogas can inhibit methanogenesis [54]. Practical strategies for H2S mitigation in AD include both in situ and ex situ methods. In situ options involve controlled micro-aeration for biological oxidation of sulphides, and addition of iron salts for FeS precipitation [54,55]. The main ex situ techniques, primarily aimed at corrosion prevention and protection of energy conversion equipment, include biogas purification through adsorption on solid adsorbents, absorption into liquids, or a chemical scrubbing system [56,57].

3.4. Energy Efficiency for the Anaerobic Digestion Process

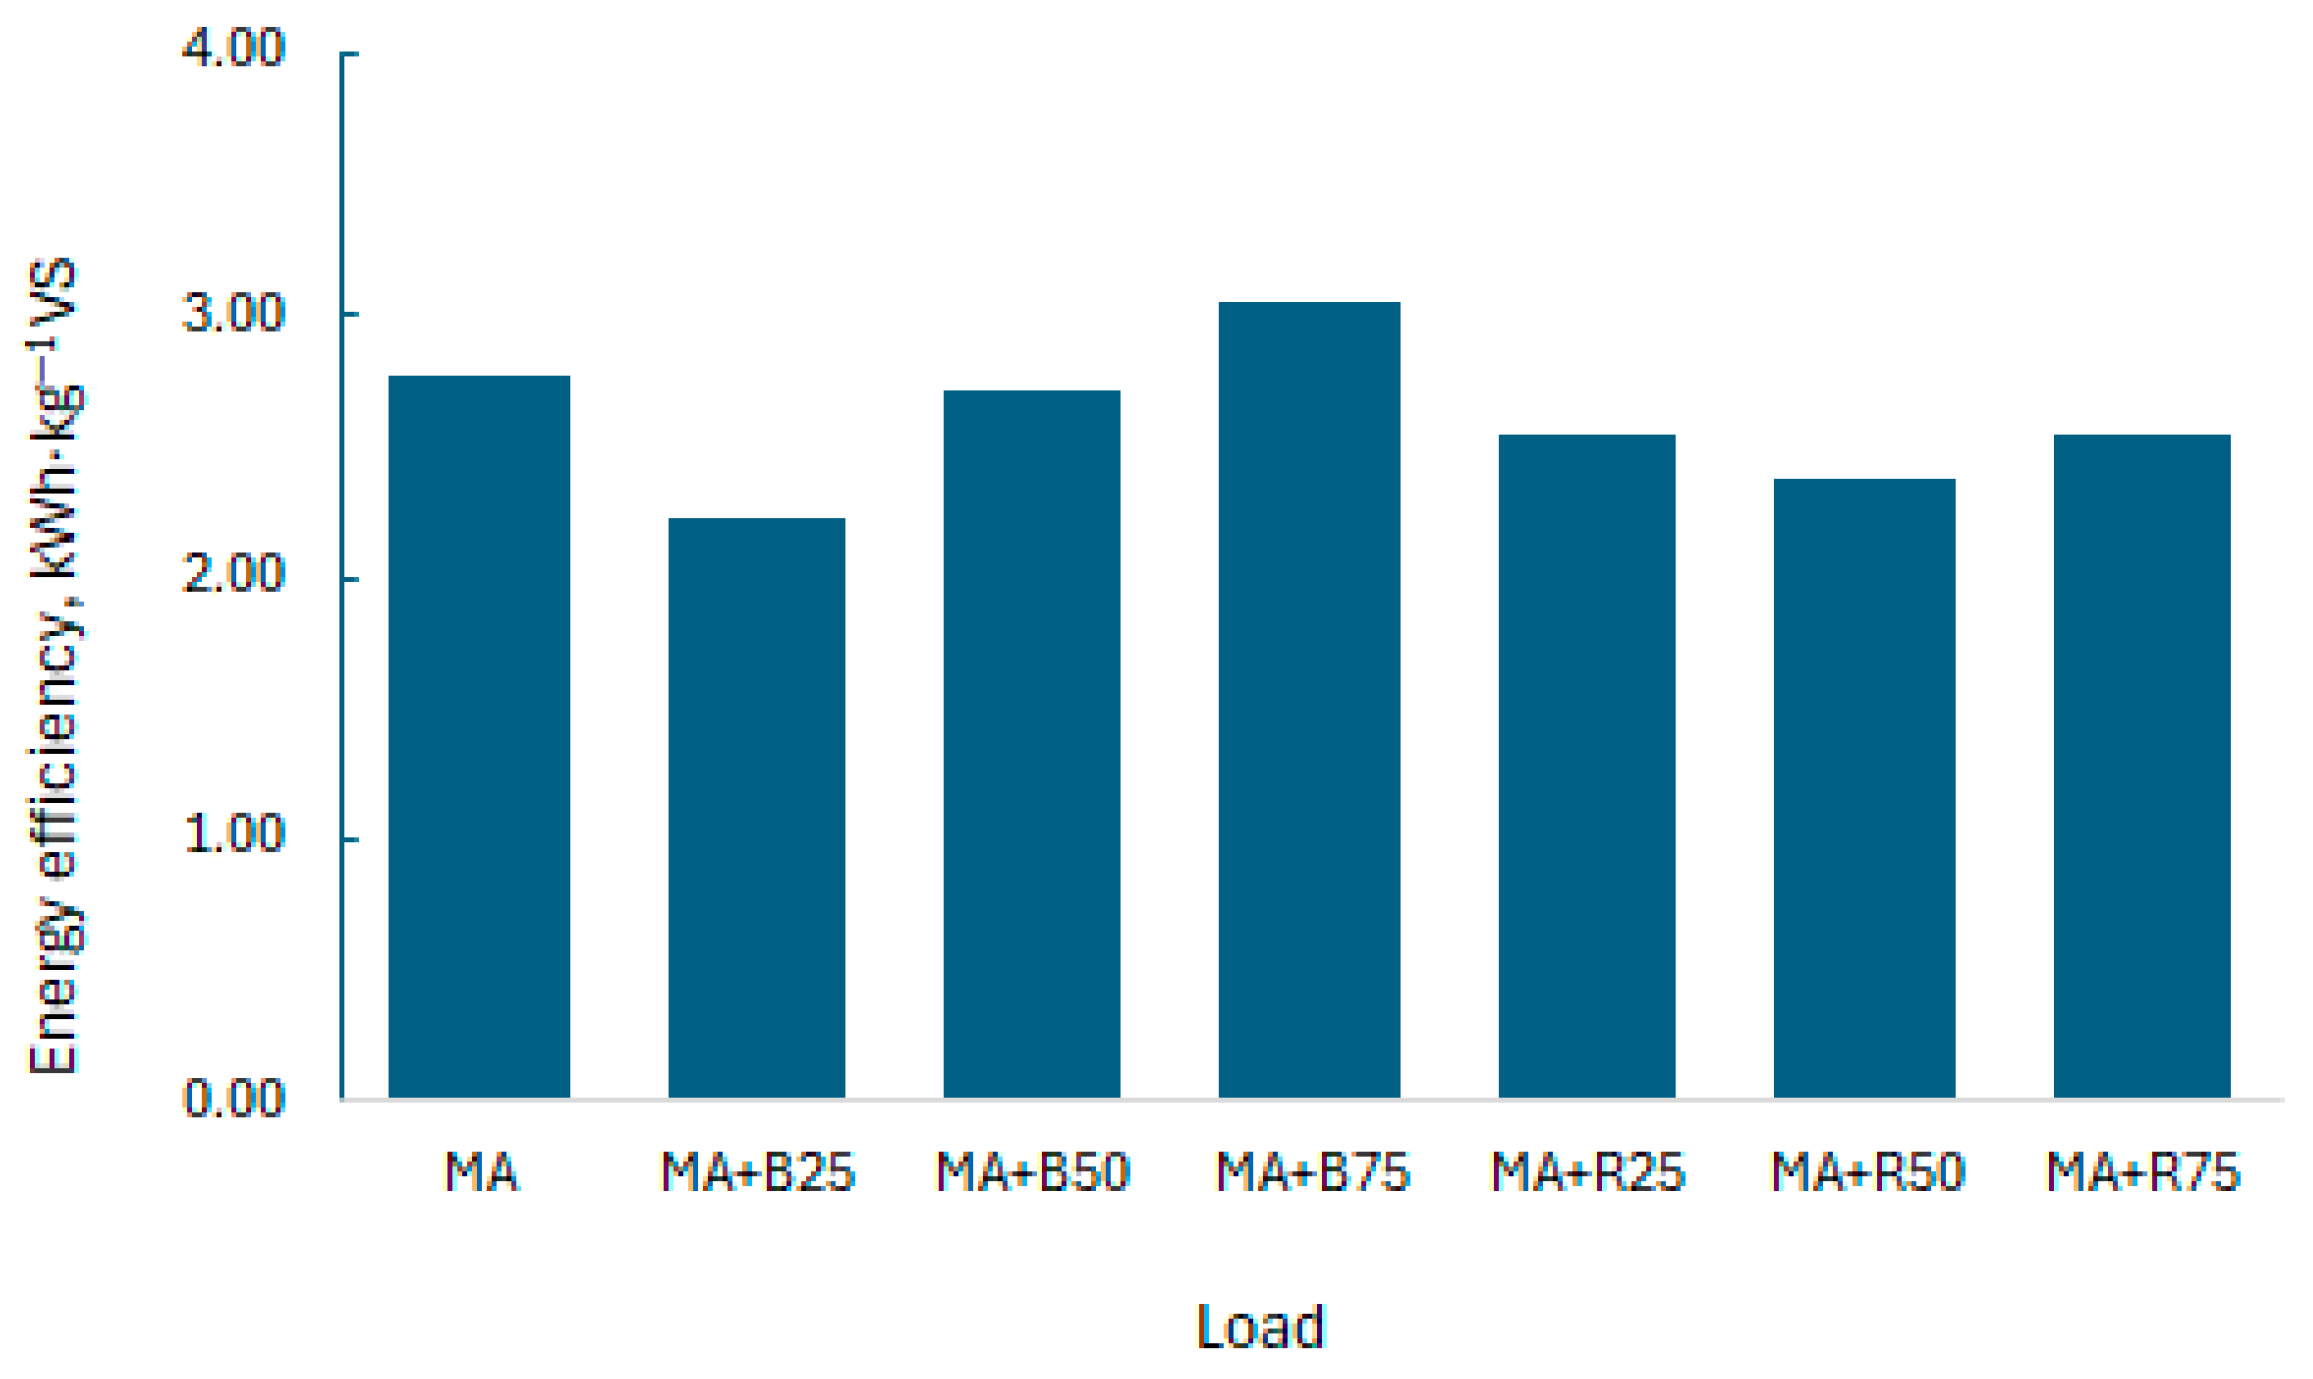
The calculated energy potential for biogas derived from various substrates is presented in Figure 8. For microalgal biomass, the energy potential was 2.76 kWh·kg−1 VS. Milledge and Heaven [58] concluded that biogas production from microalgae can be cost-effective, provided that thermal energy from biogas combustion is efficiently recovered in combined heat and power (CHP) units. The lowest energy potential was obtained for the MA + B25 mixed substrate, while the highest was for the MA + B75 variant. In a study carried out by Hawrot-Paw et al. [37], the energy potential for Arthrospira platensis biomass ranged from 1 kWh·kg−1 to 2.75 kWh·kg−1. In the present study, the value ranged from 2.23 kWh·kg−1 to 3.05 kWh·kg−1, likely due to differences in substrate quality. The energy efficiency of anaerobic digestion is influenced by several interconnected factors. One of the most critical is the type and intensity of pretreatment, which significantly affect substrate accessibility, particularly for biomass with recalcitrant cell walls (e.g., microalgae) [59]. The content and composition of volatile solids also determine the maximum achievable methane yield. At demonstration scale, Díez-Montero et al. [60] reported around 70% VS removal and up to 0.24 L CH4 g−1 VS following thermal pretreatment at 75 °C for 10 h. Pretreatment can further enhance digestibility. In the study by Dębowski et al. [61], sonication applied for 50 s increased methane productivity to 183 ± 25 cm3 CH4 g−1 VS and achieved the highest net energy efficiency of 1.909 ± 0.20 Wh g−1 VS, demonstrating that even short pretreatment can provide a positive energy balance. The energy recovery in AD also depends on operational parameters. Proper mixing and temperature regulation are essential, as even minor deviations can reduce biogas yield [62]. Hydraulic retention time and organic loading rate co-determine the volumetric biogas production and process stability [63]. Extended HRT generally improves the conversion of slowly degradable fractions, increasing gas yield up to a saturation point [64]. Additionally, pH regulation and alkalinity buffering are necessary to support effective methanogenesis [65]. Inoculum selection and its adaptation to temperature are also important, as temperature-adapted or acclimated microbial consortia have been shown to enhance methane production from algal biomass [66]. The co-digestion may improve the availability of easily degradable compounds for methanogens, resulting in higher overall energy efficiency.
The higher heating value (HHV) and lower heating value (LHV) varied during the experiment. Microalgal biomass generated biogas with a relatively high energy value (Table 2), confirming its suitability as a primary substrate for AD. The addition of co-substrates led to a reduction in calorific values. Bakery products such as bread are rich in carbohydrate content and low in protein [67], which likely increased the C/N ratio in the load. Too high a carbon content can cause nitrogen deficiency, limiting the growth of methanogenic microorganisms [68]. As methanogenesis becomes less efficient, the calorific value of biogas decreases. The highest LHV was obtained from a mixture of microalgal biomass and bread at a 25% dosage (23.3 MJ/m3), while the lowest was observed at a 75% dosage (22.2 MJ/m3). A higher carbohydrate load increases the OLR value. As the digester becomes overloaded, the CO2 content in biogas increases, while the CH4 content decreases. That was confirmed in the present study.

3.5. Potential CO2 Emissions Avoided Compared to Fossil Fuels

In most environmental assessments, biogas production is not considered as a source of CO2 emissions because it originates from biomass. Unlike fossil fuels, the combustion of biogas is part of the short-term carbon cycle and does not contribute to net atmospheric CO2 accumulation [69]. By comparing the energy obtained from biogas with that from conventional fossil fuels, it is possible to quantify the amount of CO2 emissions avoided through the use of this renewable energy source (Figure 9). All experimental variants demonstrated potential for reducing CO2 emissions compared to conventional fossil-based energy sources. The MA + B50 configuration demonstrated the highest level of CO2 avoidance, particularly relative to coal (0.70 kg CO2 avoided per kg substrate), while the MA variant showed strong overall potential. Modification in the composition of the digester load influences both the volume of biogas and its calorific value, which directly affects the total amount of carbon dioxide emissions that can be avoided. Since the CO2 released during biogas combustion is of biogenic origin, it is considered neutral in relation to climate impact [70].

3.6. Operational Conditions of Anaerobic Digestion (pH, Temperature, ORP)

In biogas production, maintaining the stability of the methane generation process is essential. Deviations in key process parameters, such as temperature or pH of the load above the optimal range, can negatively affect biogas production [71,72]. The operating conditions related to pH, temperature, and ORP in the present study are summarised in Table 3. The process temperature remained stable throughout the experiment, ranging from 36.87 °C to 36.98 °C. The pH of the substrate in the digester was also stable across all treatment variants, with values ranging from 7.00 to 7.08. The buffering effect observed in our digester can be explained by the protein-rich nature of the microalgal substrate. During anaerobic degradation, proteins are hydrolysed, releasing ammonia, which reacts with dissolved CO2 to form ammonium bicarbonate (NH4HCO3). This buffering mechanism, previously described for untreated organic manure [73], could stabilize the pH within the optimal range for methanogenesis [74]. The stability of conditions is critical. As demonstrated by Latif et al. [75], reducing the pH to 5.5 led to an approximately 50% decrease in methane yield compared to neutral conditions. This reduction was attributed to the suppressed activity of methanogenic microorganisms. The optimal pH range for AD process stability is around 7 [72]. Although most anaerobic digestion microorganisms can tolerate a pH value between 5.0 and 8.5, methanogens exhibit optimal activity within a range of 6.8 to 7.2 [76]. Process stability depends not only on maintaining near-neutral pH but also on sufficient alkalinity, which supports methanogenesis [77]. Oxidation-reduction potential is another important diagnostic parameter, used to monitor the anaerobic environment and indirectly evaluate microbial activity. In this study, ORP values during anaerobic digestion ranged from −328.7 mV to −270.5 mV. After each substrate addition, a short-term rise in ORP was recorded, followed by rapid stabilisation at approximately −285 mV or lower. These stable values reflect the establishment of strongly reducing conditions required for methanogenesis under mesophilic conditions. Vongvichiankul et al. [78] reported that the optimal ORP value for the methanogenic phase in mesophilic anaerobic digestion was −335.63 ± 28.97 mV. Costa et al. [79] observed that a shift from strict anaerobic conditions (≈−350 mV) to microaerophilic conditions (≈−250 mV) indicated the presence of oxygen in the digester and was linked to changes in microbial function. These findings demonstrate that methanogenic archaea require and thrive under highly reducing conditions, and that any sustained increase in ORP above approximately −250 mV can negatively influence methane production. In our system, the temporary ORP fluctuations recorded immediately after substrate addition reflect typical oxygen depletion dynamics in batch anaerobic digestion. Rapid recovery to stable, reducing ORP levels confirms that the digester environment remained favorable for methanogenesis throughout the process. Controlling ORP is thus critical for sustaining metabolic balance in the system. In support of this, Nguyen et al. [80] demonstrated a direct correlation between the accumulation of volatile fatty acids and fluctuations in ORP values.

4. Conclusions

This study confirms the potential of co-digesting microalgal biomass with bakery waste. The highest biogas yield (494.34 L·kg−1 VS) was obtained using 75% bread as a co-substrate; however, the methane yield was similar to that of mono-digestion. Despite differences in substrate composition, methane concentration remained high across all variants, with the highest value (64.94%) observed for microalgal biomass and bread at a dose of 25%. The energy potential of co-digestion depended on the type of substrate. Co-digestion with bakery waste reduced H2S concentration in biogas. The lowest value (234.20 ppm) was noted in the MA + R25 variant, improving biogas quality. Too high a proportion of bakery waste can lead to deterioration of AD conditions and lower energy potential for the biogas produced. Replacing fossil fuels with energy from biogas reduced carbon dioxide emissions. The MA + B50 variant showed the highest avoided emission relative to coal (0.70 kg CO2·kg−1 substrate). All fermentation parameters (pH, ORP, temperatures) remained within optimal ranges, demonstrating that co-digestion was feasible and stable at semi-technical scale.

Author Contributions

Conceptualization, M.H.-P.; methodology, M.H.-P.; validation, M.H.-P.; formal analysis, M.H.-P. and J.T.; writing—original draft preparation, M.H.-P.; writing—review and editing, M.H.-P. and J.T.; visualization, M.H.-P. and J.T.; supervision, M.H.-P. All authors have read and agreed to the published version of the manuscript.

Funding

This research received no external funding.

Data Availability Statement

The original contributions presented in this study are included in the article. Further inquiries can be directed to the corresponding author.

Acknowledgments

The authors have reviewed and edited the output and take full responsibility for the content of this publication.

Conflicts of Interest

The authors declare no conflicts of interest.

Abbreviations

The following abbreviations are used in this manuscript:
EFEmission Factors
HHVHigher Heating Value
LHVLower Heating Value
OLROrganic Loading Rate
ORPOxidation-Reduction Potential
TSTotal Solids
VSVolatile Solids

References

  1. Jamil, F.; Inayat, A.; Hussain, M.; Akhter, P.; Abideen, Z.; Ghenai, C.; Shanableh, A.; Abdellatief, T.M.M. Valorization of Waste Biomass to Biofuels for Power Production and Transportation in Optimized Way: A Comprehensive Review. Processes 2022, 10, 1501. [Google Scholar] [CrossRef]
  2. Joshi, N.C.; Sinha, S.; Bhatnagar, P.; Nath, Y.; Negi, B.; Kumar, V.; Gururani, P. A Concise Review on Waste Biomass Valorization through Thermochemical Conversion. Curr. Res. Microb. Sci. 2024, 6, 100237. [Google Scholar] [CrossRef] [PubMed]
  3. Mignogna, D.; Szabó, M.; Ceci, P.; Avino, P. Biomass Energy and Biofuels: Perspective, Potentials, and Challenges in the Energy Transition. Sustainability 2024, 16, 7036. [Google Scholar] [CrossRef]
  4. Kumar, D.J.P.; Mishra, R.K.; Chinnam, S.; Binnal, P.; Dwivedi, N. A Comprehensive Study on Anaerobic Digestion of Organic Solid Waste: A Review on Configurations, Operating Parameters, Techno-Economic Analysis and Current Trends. Chemosphere 2022, 307, 135656. [Google Scholar] [CrossRef]
  5. Huang, X. The Promotion of Anaerobic Digestion Technology Upgrades in Waste Stream Treatment Plants for Circular Economy in the Context of “Dual Carbon”: Global Status, Development Trend, and Future Challenges. Water 2024, 16, 3718. [Google Scholar] [CrossRef]
  6. Fagerström, A.; Al Seadi, T.; Rasi, S.; Briseid, T. The Role of Anaerobic Digestion and Biogas in the Circular Economy; IEA Bioenergy Task 37; Report No. 2018:8; Murphy, J.D., Ed.; IEA Bioenergy: Cork, Ireland, 2018. [Google Scholar]
  7. Kupryaniuk, K.; Witaszek, K.; Vaskina, I.; Filipek-Kaźmierczak, S.; Kupryaniuk, J.; Sołowiej, P.; Dach, J. The Effect of Corn Ensiling Methods on Digestibility and Biogas Yield. Energies 2025, 18, 188. [Google Scholar] [CrossRef]
  8. Fuksa, P.; Hakl, J.; Míchal, P.; Hrevušová, Z.; Šantrůček, J.; Tlustoš, P. Effect of silage maize plant density and plant parts on biogas production and composition. Biomass Bioenerg. 2020, 140, 105678. [Google Scholar] [CrossRef]
  9. Xu, N.; Liu, S.; Xin, F.; Zhou, J.; Jia, H.; Xu, J.; Jiang, M.; Dong, W. Biomethane Production from Lignocellulose: Biomass Recalcitrance and Its Impacts on Anaerobic Digestion. Front. Bioeng. Biotechnol. 2019, 7, 191. [Google Scholar] [CrossRef]
  10. Abusweireh, R.S.; Rajamohan, N.; Sonne, C.; Vasseghian, Y. Algae biogas production focusing on operating conditions and conversion mechanisms—A Review. Heliyon 2023, 9, e17757. [Google Scholar] [CrossRef]
  11. Montuori, L.; Alcázar-Ortega, M.; Benreguieg, A. A Perspective on Biogas Production from Algae Biomass: A Promising Third-Generation Biofuel for the Sustainable Development. In Biogas in the 21st Century—Developments and Perspectives; IntechOpen: London, UK, 2025. [Google Scholar] [CrossRef]
  12. Sambusiti, C.; Bellucci, M.; Zabaniotou, A.; Beneduce, L.; Monlau, F. Algae as promising feedstocks for fermentative biohydrogen production according to a biorefinery approach: A comprehensive review. Renew. Sustain. Energy Rev. 2015, 44, 20–36. [Google Scholar] [CrossRef]
  13. Steuer, R. Fast-growing phototrophic microorganisms and the productivity of phototrophic cultures. Biotechnol. Bioeng. 2022, 119, 2261–2267. [Google Scholar] [CrossRef]
  14. Falfushynska, H. Advancements and Prospects in Algal Biofuel Production: A Comprehensive Review. Phycology 2024, 4, 548–575. [Google Scholar] [CrossRef]
  15. Fernandes de Souza, M.; Meers, E.; Mangini, S. The potential of microalgae for carbon capture and sequestration. EFB Bioecon. J. 2024, 4, 100067. [Google Scholar] [CrossRef]
  16. Hawrot-Paw, M.; Koniuszy, A.; Gałczyńska, M.; Zając, G.; Szyszlak-Bargłowicz, J. Production of Microalgal Biomass Using Aquaculture Wastewater as Growth Medium. Water 2020, 12, 106. [Google Scholar] [CrossRef]
  17. Dias, R.R.; Deprá, M.C.; de Menezes, C.R.; Zepka, L.Q.; Jacob-Lopes, E. Microalgae Cultivation in Wastewater: How Realistic Is This Approach for Value-Added Product Production? Processes 2025, 13, 2052. [Google Scholar] [CrossRef]
  18. Hassan, H.; Ansari, F.A.; Rawat, I.; Bux, F. Unlocking the potential of microalgae: Cultivation in algae recycled effluent with domestic wastewater for enhancing biomass, bioenergy production and CO2 sequestration. J. Water Process Eng. 2024, 68, 106499. [Google Scholar] [CrossRef]
  19. Narayanan, I.; Pandey, S.; Vinayagam, R.; Priyadarshini, R.; Shanmugam, S.; Sankaran, V. A Recent Update on Enhancing Lipid and Carbohydrate Accumulation for Sustainable Biofuel Production in Microalgal Biomass. Discov. Appl. Sci. 2025, 7, 195. [Google Scholar] [CrossRef]
  20. Rahman, M.M.; Hosano, N.; Hosano, H. Recovering Microalgal Bioresources: A Review of Cell Disruption Methods and Extraction Technologies. Molecules 2022, 27, 2786. [Google Scholar] [CrossRef]
  21. Shivakumar, S.; Serlini, N.; Esteves, S.M.; Miros, S.; Halim, R. Cell Walls of Lipid-Rich Microalgae: A Comprehensive Review on Characterisation, Ultrastructure, and Enzymatic Disruption. Fermentation 2024, 10, 608. [Google Scholar] [CrossRef]
  22. Dębowski, M.; Kazimierowicz, J.; Zieliński, M.; Bartkowska, I. Co-Fermentation of Microalgae Biomass and Miscanthus × giganteus Silage—Assessment of the Substrate, Biogas Production and Digestate Characteristics. Appl. Sci. 2022, 12, 7291. [Google Scholar] [CrossRef]
  23. Torres, A.; Padrino, S.; Brito, A.; Díaz, L. Biogas production from anaerobic digestion of solid microalgae residues generated on different processes of microalgae-to-biofuel production. Biomass Convers. Biorefinery 2023, 13, 4659–4672. [Google Scholar] [CrossRef]
  24. Mao, C.; Feng, Y.; Wang, X.; Ren, G. Process performance and methane production optimizing of anaerobic co-digestion of swine manure and corn straw. Sci. Rep. 2017, 7, 9379. [Google Scholar] [CrossRef]
  25. Milledge, J.J.; Nielsen, B.V.; Maneein, S.; Harvey, P.J. A Brief Review of Anaerobic Digestion of Algae for Bioenergy. Energies 2019, 12, 1166. [Google Scholar] [CrossRef]
  26. Al-Wahaibi, A.; Osman, A.I.; Al-Muhtaseb, A.H.; Alajeeli, N.; Al-Hinai, M.; Rooney, D.W. Techno-economic evaluation of biogas production from food waste via anaerobic digestion. Sci. Rep. 2020, 10, 15719. [Google Scholar] [CrossRef] [PubMed]
  27. Zupančič, M.; Možic, V.; Može, M.; Cimerman, F.; Golobič, I. Current Status and Review of Waste-to-Biogas Conversion for Selected European Countries and Worldwide. Sustainability 2022, 14, 1823. [Google Scholar] [CrossRef]
  28. Mohamed Ali, A.; Alam, M.Z.; Mohamed Abdoul-latif, F.; Jami, M.S.; Gamiye Bouh, I.; Adebayo Bello, I.; Ainane, T. Production of Biogas from Food Waste Using the Anaerobic Digestion Process with Biofilm-Based Pretreatment. Processes 2023, 11, 655. [Google Scholar] [CrossRef]
  29. Pour, M.B.H.; Makkawi, Y.T. A review of post-consumption food waste management and its potentials for biofuel production. Energy Rep. 2021, 7, 7756–7773. [Google Scholar] [CrossRef]
  30. Mirmohamadsadeghi, S.; Karimi, K.; Tabatabaei, M.; Aghbashlo, M. Biogas production from food wastes: A review on recent developments and future perspectives. Bioresour. Technol. Rep. 2019, 7, 100202. [Google Scholar] [CrossRef]
  31. Karmee, S.K. Liquid Biofuels from Food Waste: Current Trends, Prospect and Limitation. Renew. Sustain. Energy Rev. 2016, 53, 945–953. [Google Scholar] [CrossRef]
  32. Unis, R.; Gnaim, R.; Kashyap, M.; Shamis, O.; Gnayem, N.; Gozin, M.; Liberzon, A.; Gnaim, J.; Golberg, A. Bioconversion of Bread Waste into High-Quality Proteins and Biopolymers by Fermentation of Archaea Haloferax mediterranei. Front. Microbiol. 2024, 15, 1491333. [Google Scholar] [CrossRef]
  33. He, K.; Liu, Y.; Tian, L.; He, W.; Cheng, Q. Review in anaerobic digestion of food waste. Heliyon 2024, 10, e28200. [Google Scholar] [CrossRef]
  34. Pan, Z.; Sun, X.; Huang, Y.; Liang, T.; Lu, J.; Zhang, L.; Qi, C. Anaerobic Co-Digestion of Food Waste and Microalgae at Variable Mixing Ratios: Enhanced Performance, Kinetic Analysis, and Microbial Community Dynamics Investigation. Appl. Sci. 2024, 14, 4387. [Google Scholar] [CrossRef]
  35. Dubrovskis, V.; Plume, I. Biogas Potential from Damaged Bread. In Proceedings of the 16th International Scientific Conference Engineering for Rural Development, Jelgava, Latvia, 24–26 May 2017; pp. 437–442. [Google Scholar] [CrossRef]
  36. Choudhury, A.; Lansing, S. Methane and Hydrogen Sulfide Production from Co-Digestion of Gummy Waste with a Food Waste, Grease Waste, and Dairy Manure Mixture. Energies 2019, 12, 4464. [Google Scholar] [CrossRef]
  37. Hawrot-Paw, M.; Koniuszy, A.; Ratomski, P.; Sąsiadek, M.; Gawlik, A. Biogas production from Arthrospira platensis biomass. Energies 2023, 16, 3971. [Google Scholar] [CrossRef]
  38. DEFRA. UK Government GHG Conversion Factors for Company Reporting: Methodology Paper for Emission Factors; Department for Environment, Food & Rural Affairs (DEFRA). 2024. Available online: https://www.gov.uk/government/collections/government-conversion-factors-for-company-reporting (accessed on 2 August 2025).
  39. Mussgnug, J.H.; Klassen, V.; Schlüter, A.; Kruse, O. Microalgae as substrates for fermentative biogas production in a combined biorefinery concept. J. Biotechnol. 2010, 150, 51–56. [Google Scholar] [CrossRef] [PubMed]
  40. Murphy, J.D.; Drosg, B.; Allen, E.; Jerney, J.; Xia, A.; Herrmann, C. A perspective on Algal Biogas; IEA Bioenergy Task 37 Technical Brochure 2015; Report No. 2015:8; International Energy Agency Bioenergy: Paris, France, 2015. [Google Scholar]
  41. Li, C.; Mörtelmaier, C.; Winter, J.; Gallert, C. Co-digestion of wheat and rye bread suspensions with source-sorted municipal biowaste. Waste Manag. 2015, 40, 63–71. [Google Scholar] [CrossRef]
  42. Calbry-Muzyka, A.; Madi, H.; Rüsch-Pfund, F.; Gandiglio, M.; Biollaz, S. Biogas composition from agricultural sources and organic fraction of municipal solid waste. Renew. Energy 2022, 181, 1000–1007. [Google Scholar] [CrossRef]
  43. Fermoso, F.G.; Bartacek, J.; Jansen, S.; Lens, P.N.L. Screening of Biomethane Production Potential from Dominant Microalgae. Bioresour. Technol. 2016, 51, 1062–1067. [Google Scholar] [CrossRef]
  44. Cortés-Carmona, M.; Tapia-Rodríguez, A.; Morales, M.; Celis, L.B.; Alatriste-Mondragón, F.; Razo-Flores, E. Methane Production from Thermally Pretreated Scenedesmus obtusiusculus Biomass in Semi-Batch Reactors at Low Reaction Times. Biochem. Eng. J. 2018, 136, 61–68. [Google Scholar] [CrossRef]
  45. Roberts, K.P.; Heaven, S.; Banks, C.J. Comparative Testing of Energy Yields from Micro-Algal Biomass Cultures Processed via Anaerobic Digestion. Renew. Energy 2016, 87, 744–753. [Google Scholar] [CrossRef]
  46. Reshma, R.; Arumugam, M. Selective degradation of the recalcitrant cell wall of Scenedesmus quadricauda CASA CC202. Planta 2017, 246, 779–790. [Google Scholar] [CrossRef]
  47. Amorim, M.L.; Soares, J.; Vieira, B.B.; Batista-Silva, W.; Martins, M.A. Extraction of proteins from the microalga Scenedesmus obliquus BR003 followed by lipid extraction of the wet deproteinized biomass using hexane and ethyl acetate. Bioresour. Technol. 2020, 307, 123190. [Google Scholar] [CrossRef] [PubMed]
  48. Sialve, B.; Bernet, N.; Bernard, O. Anaerobic digestion of microalgae as a necessary step to make microalgal biodiesel sustainable. Biotechnol. Adv. 2009, 27, 409–416. [Google Scholar] [CrossRef] [PubMed]
  49. Barros, R.; Raposo, S.; Morais, E.G.; Rodrigues, B.; Afonso, V.; Gonçalves, P.; Marques, J.; Cerqueira, P.R.; Varela, J.; Teixeira, M.R.; et al. Biogas Production from Microalgal Biomass Produced in the Tertiary Treatment of Urban Wastewater: Assessment of Seasonal Variations. Energies 2022, 15, 5713. [Google Scholar] [CrossRef]
  50. Chambers, A.K. Gas Utilization from Sewage Waste. CiteSeerX Technical Report. 2002, pp. 1–20. Available online: https://citeseerx.ist.psu.edu/document?doi=c7f9c446794ed90fc5b02c6366130e583de5cea3 (accessed on 12 July 2025).
  51. Kisielewska, M.; Dębowski, M.; Zieliński, M. Comparison of biogas production from anaerobic digestion of microalgae species belonging to various taxonomic groups. Arch. Environ. Prot. 2020, 46, 33–40. [Google Scholar] [CrossRef]
  52. Wickham, R.; Galway, B.; Bustamante, H.; Nghiem, L.D. Biomethane potential evaluation of co-digestion of sewage sludge and organic wastes. Int. Biodeterior. Biodegrad. 2016, 113, 3–8. [Google Scholar] [CrossRef]
  53. Khoshnevisan, B.; Tsapekos, P.; Alfaro, N.; Díaz, I.; Fdz-Polanco, M.; Rafiee, S.; Angelidaki, I. A review on prospects and challenges of biological H2S removal from biogas with focus on biotrickling filtration and microaerobic desulfurization. Biofuel Res. J. 2017, 4, 741–750. [Google Scholar] [CrossRef]
  54. Vu, H.P.; Nguyen, L.N.; Wang, Q.; Ngo, H.H.; Liu, Q.; Zhang, X.; Nghiem, L.D. Hydrogen sulphide management in anaerobic digestion: A critical review on input control, process regulation, and post-treatment. Bioresour. Technol. 2022, 346, 126634. [Google Scholar] [CrossRef]
  55. Zhang, C.; Lu, Q.; Li, Y. A Review on Sulfur Transformation during Anaerobic Digestion of Organic Solid Waste: Mechanisms, Influencing Factors and Resource Recovery. Sci. Total Environ. 2023, 865, 161193. [Google Scholar] [CrossRef]
  56. Abatzoglou, N.; Boivin, S. A Review of Biogas Purification Processes. Biofuels Bioprod. Biorefin. 2009, 3, 42–71. [Google Scholar] [CrossRef]
  57. Ryckebosch, E.; Drouillon, M.; Vervaeren, H. Techniques for Transformation of Biogas to Biomethane. Biomass Bioenergy 2011, 35, 1633–1645. [Google Scholar] [CrossRef]
  58. Milledge, J.J.; Heaven, S. Energy Balance of Biogas Production from Microalgae: Effect of Harvesting Method, Multiple Raceways, Scale of Plant and Combined Heat and Power Generation. J. Mar. Sci. Eng. 2017, 5, 9. [Google Scholar] [CrossRef]
  59. de Oliveira, M.C.; Bassin, I.D.; Cammarota, M.C. Microalgae and Cyanobacteria Biomass Pretreatment Methods: A Comparative Analysis of Chemical and Thermochemical Pretreatment Methods Aimed at Methane Production. Fermentation 2022, 8, 497. [Google Scholar] [CrossRef]
  60. Díez-Montero, R.; Vassalle, L.; Passos, F.; Ortiz, A.; García-Galán, M.J.; García, J.; Ferrer, I. Scaling-Up the Anaerobic Digestion of Pretreated Microalgal Biomass within a Water Resource Recovery Facility. Energies 2020, 13, 5484. [Google Scholar] [CrossRef]
  61. Dębowski, M.; Kazimierowicz, J.; Świca, I.; Zieliński, M. Ultrasonic Disintegration to Improve Anaerobic Digestion of Microalgae with Hard Cell Walls—Scenedesmus sp. and Pinnularia sp. Plants 2023, 12, 53. [Google Scholar] [CrossRef] [PubMed]
  62. Babaei, A.; Shayegan, J. Effects of temperature and mixing modes on the performance of municipal solid waste anaerobic slurry digester. J. Environ. Health Sci. Eng. 2020, 17, 1077–1084. [Google Scholar] [CrossRef] [PubMed]
  63. Parajuli, A.; Khadka, A.; Sapkota, L.; Ghimire, A. Effect of Hydraulic Retention Time and Organic-Loading Rate on Two-Staged, Semi-Continuous Mesophilic Anaerobic Digestion of Food Waste during Start-Up. Fermentation 2022, 8, 620. [Google Scholar] [CrossRef]
  64. Shi, X.-S.; Dong, J.-J.; Yu, J.-H.; Yin, H.; Hu, S.-M.; Huang, S.-X.; Yuan, X.-Z. Effect of Hydraulic Retention Time on Anaerobic Digestion of Wheat Straw in Semicontinuous Continuous Stirred-Tank Reactors. Biomed. Res. Int. 2017, 2017, 2457805. [Google Scholar] [CrossRef]
  65. Zainal, A.; Harun, R.; Idrus, S. Performance Monitoring of Anaerobic Digestion at Various Organic Loading Rates of Commercial Malaysian Food Waste. Front. Bioeng. Biotechnol. 2022, 10, 775676. [Google Scholar] [CrossRef]
  66. González-Fernández, C.; Barreiro-Vescovo, S.; de Godos, I.; Fernández, M.; Arbib, Z.; Ballesteros, M. Biochemical Methane Potential of Microalgae Biomass Using Different Microbial Inocula. Biotechnol. Biofuels 2018, 11, 184. [Google Scholar] [CrossRef]
  67. Svensson, S.E.; Bucuricova, L.; Ferreira, J.A.; Souza Filho, P.F.; Taherzadeh, M.J.; Zamani, A. Valorization of Bread Waste to a Fiber- and Protein-Rich Fungal Biomass. Fermentation 2021, 7, 91. [Google Scholar] [CrossRef]
  68. Choi, Y.; Ryu, J.; Lee, S.R. Influence of carbon type and carbon to nitrogen ratio on the biochemical methane potential, ph, and ammonia nitrogen in anaerobic digestion. J. Anim. Sci. Technol. 2020, 62, 74–83. [Google Scholar] [CrossRef] [PubMed]
  69. Christianides, D.; Bagaki, D.A.; Timmers, R.A.; Zrimec, M.B.; Theodoropoulou, A.; Angelidaki, I.; Kougias, P.; Zampieri, G.; Kamergi, N.; Napoli, A.; et al. Biogenic CO2 Emissions in the EU Biofuel and Bioenergy Sector: Mapping Sources, Regional Trends, and Pathways for Capture and Utilisation. Energies 2025, 18, 1345. [Google Scholar] [CrossRef]
  70. Paolini, V.; Petracchini, F.; Segreto, M.; Tomassetti, L.; Naja, N.; Cecinato, A. Environmental impact of biogas: A short review of current knowledge. J. Environ. Sci. Health A 2018, 53, 899–906. [Google Scholar] [CrossRef] [PubMed]
  71. Sánchez, E.; Borja, R.; Weiland, P.; Travieso, L.; Colmenarejo, M.F. Effect of substrate concentration and temperature on the anaerobic digestion of piggery waste in a UASB reactor. Biotechnol. Lett. 2000, 22, 303–307. [Google Scholar] [CrossRef]
  72. Pilarska, A.A.; Kulupa, T.; Kubiak, A.; Wolna-Maruwka, A.; Pilarski, K.; Niewiadomska, A. Anaerobic Digestion of Food Waste—A Short Review. Energies 2023, 16, 5742. [Google Scholar] [CrossRef]
  73. Abelenda, A.M.; Baltrusaitis, J. Design of Conventional Batch Distillation of Anaerobic Digestate to Isolate Ammonium Bicarbonate Considering Non-Ideal Mixture Behavior. Biofuels Bioprod. Bioref. 2025, 19, 1110–1123. [Google Scholar] [CrossRef]
  74. Filer, J.; Ding, H.H.; Chang, S. Biochemical Methane Potential (BMP) Assay Method for Anaerobic Digestion Research. Water 2019, 11, 921. [Google Scholar] [CrossRef]
  75. Latif, M.A.; Mehta, C.M.; Batstone, D.J. Influence of low pH on continuous anaerobic digestion of waste activated sludge. Water Res. 2017, 113, 42–49. [Google Scholar] [CrossRef]
  76. Wang, S.; Xu, C.; Song, L.; Zhang, J. Anaerobic digestion of food waste and its microbial consortia: A historical review and future perspectives. Int. J. Environ. Res. Public Health 2022, 19, 9519. [Google Scholar] [CrossRef]
  77. Hobbs, S.R.; Landis, A.E.; Rittmann, B.E.; Young, M.N.; Parameswaran, P. Enhancing Anaerobic Digestion of Food Waste through Biochemical Methane Potential Assays at Different Substrate: Inoculum Ratios. Waste Manag. 2018, 71, 612–617. [Google Scholar] [CrossRef]
  78. Vongvichiankul, C.; Deebao, J.; Khongnakorn, W. Relationship between pH, Oxidation Reduction Potential (ORP) and biogas production in mesophilic screw anaerobic digester. Energy Procedia 2017, 138, 877–882. [Google Scholar] [CrossRef]
  79. Costa, L.; Duarte, M.S.; Magalhães, C.P.; Pereira, M.A.; Cavaleiro, A.J. Micro-Aeration for Improving Anaerobic Treatment and Biogas Production from Organic Pollutants. Appl. Microbiol. Biotechnol. 2025, 109, 131. [Google Scholar] [CrossRef]
  80. Nguyen, D.; Wu, Z.; Shrestha, S.; Lee, P.-H.; Raskin, L.; Khanal, S.K. Intermittent Micro-Aeration: New Strategy to Control Volatile Fatty Acid Accumulation in High Organic Loading Anaerobic Digestion. Water Res. 2019, 166, 115080. [Google Scholar] [CrossRef]
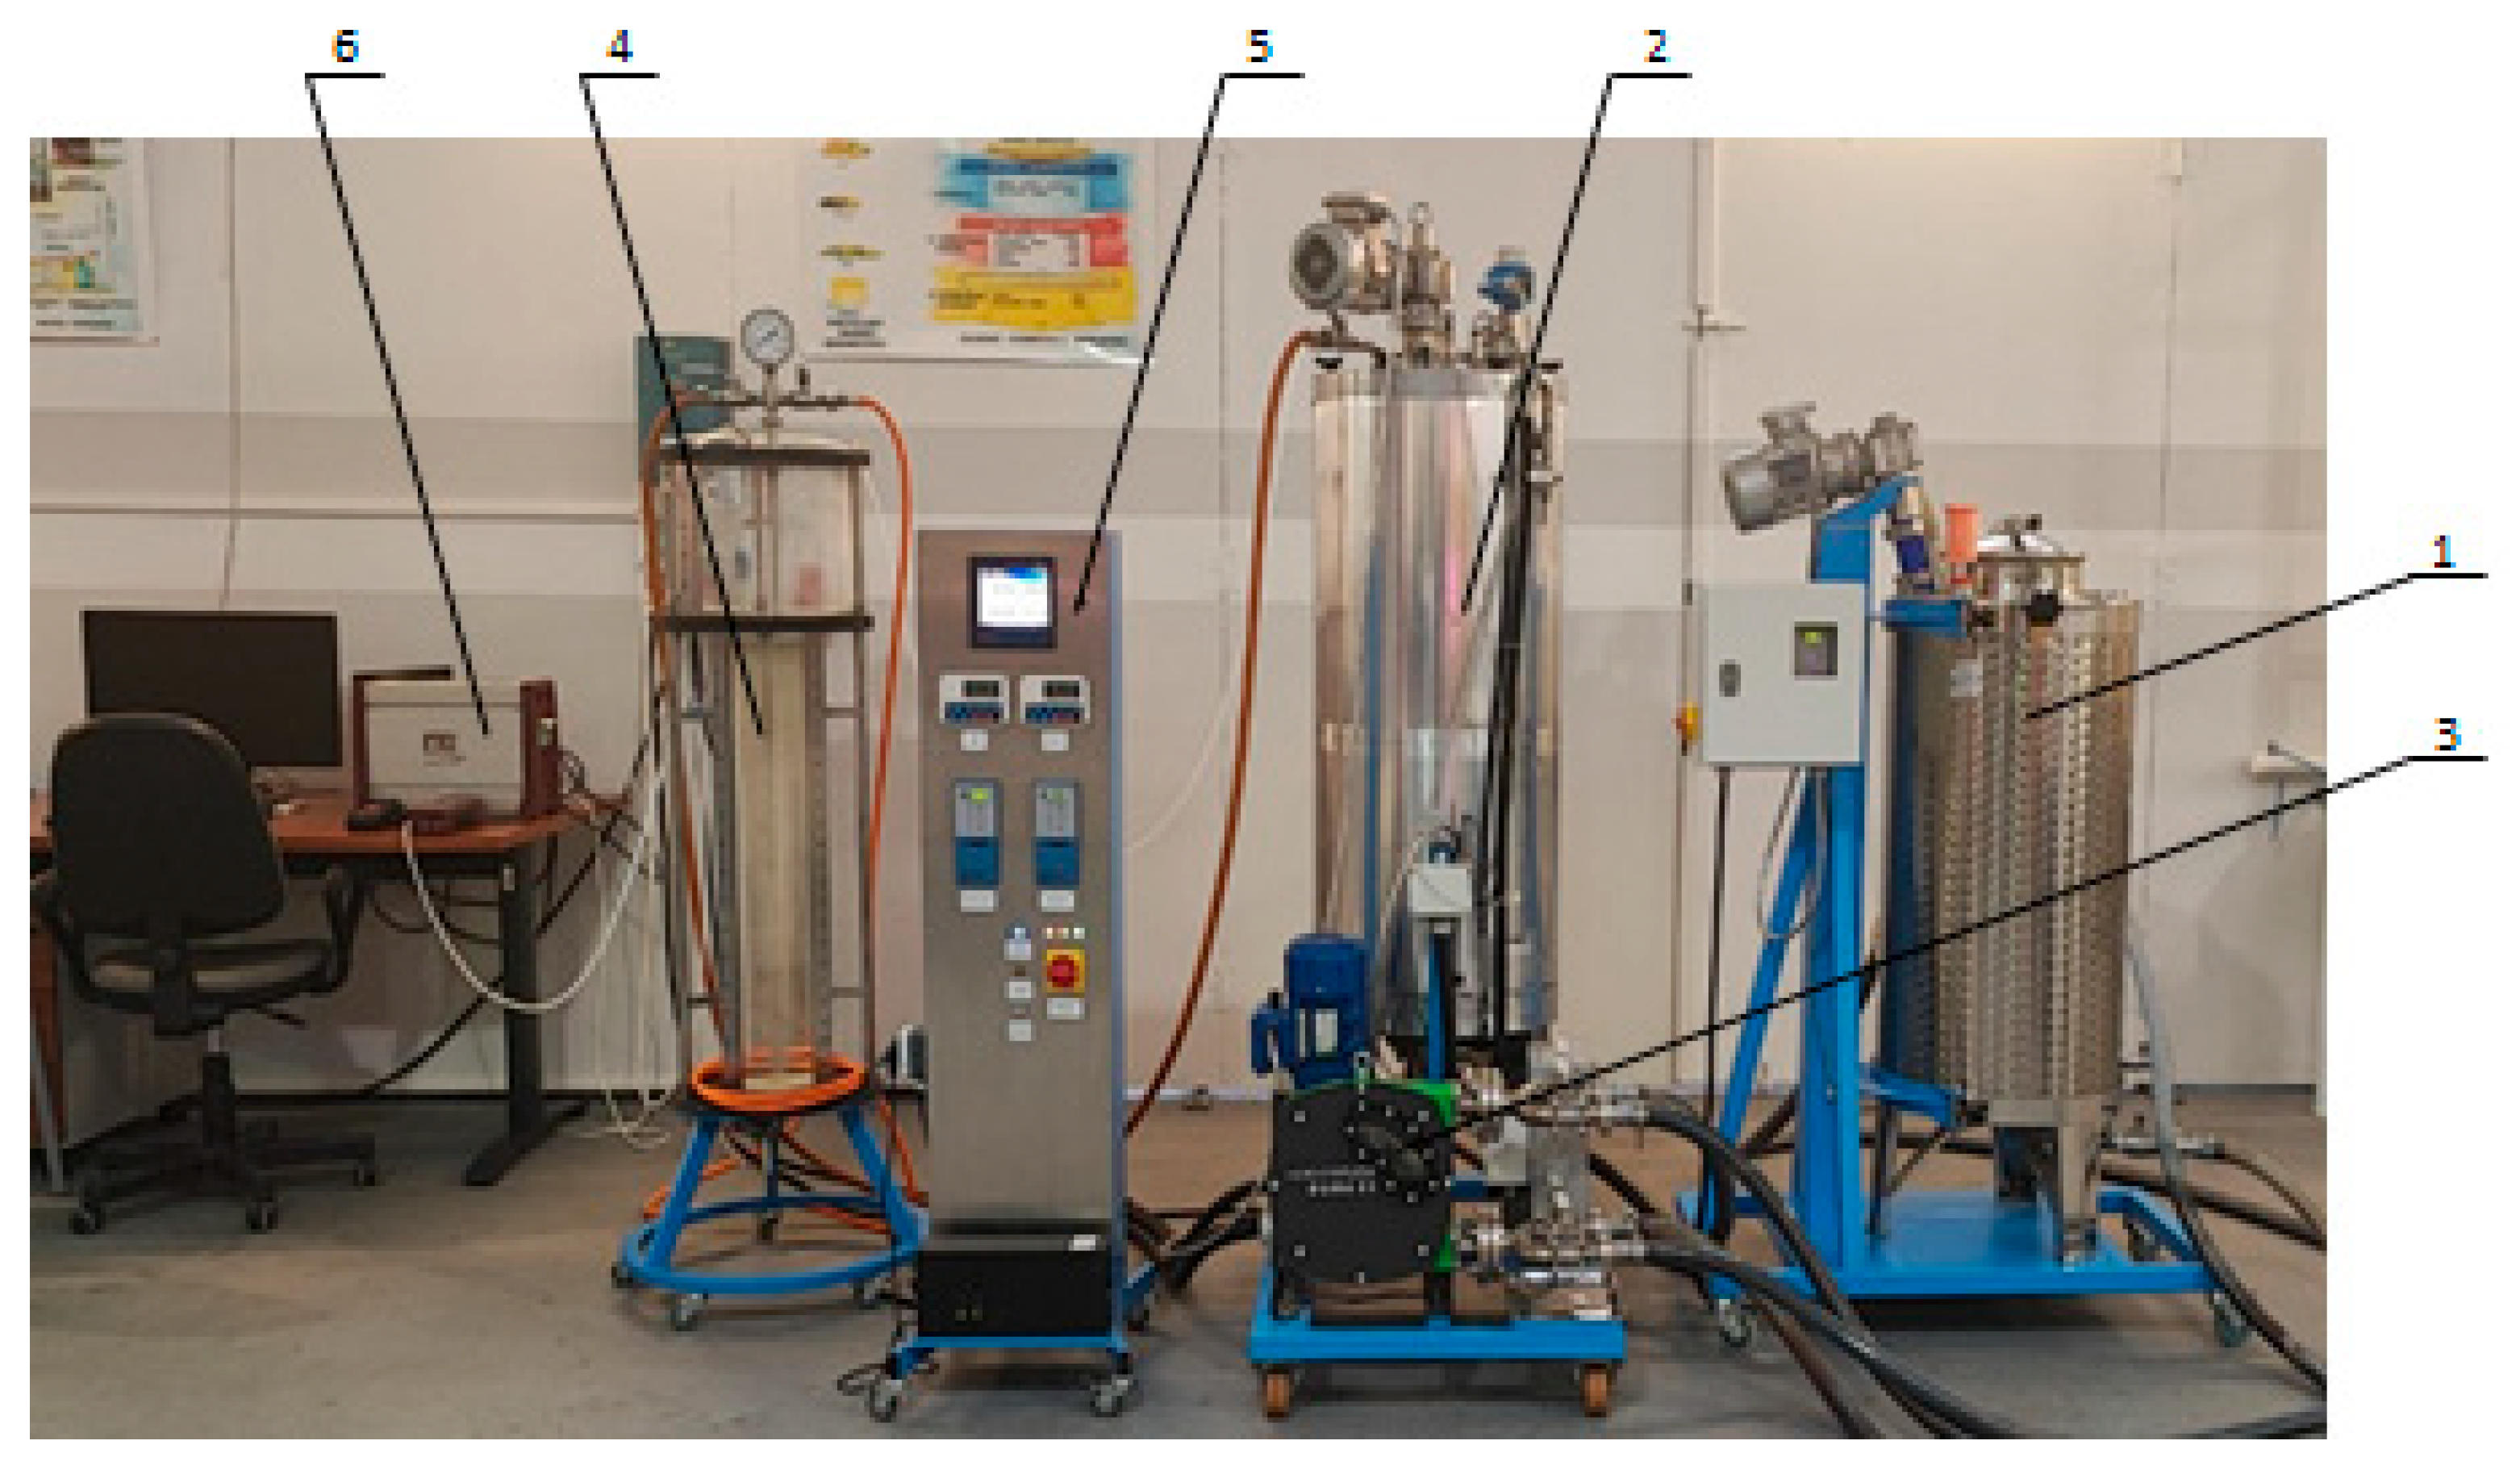
Figure 1. Scheme of anaerobic digestion installation: 1—preliminary mixing chamber; 2—digestion chamber; 3—peristaltic pump; 4—gas meter; 5—control and measurement system; 6—biogas analyser [37].
Energies 18 05516 g001
Figure 2. Cumulative biogas production from each substrate. Source: Authors’ own study.
Energies 18 05516 g002
Figure 3. The dynamics of methane production during mono- and co-fermentation. Source: Authors’ own study.
Energies 18 05516 g003
Figure 4. Heatmap illustrating cumulative biogas yield (L·kg−1 VS) recorded for each treatment at the end of the digestion cycle and the average methane content in biogas calculated as the arithmetic mean of five sequential measurements within the same cycle (days 1, 2, 3, 4, and 7). Color intensity reflects the magnitude of the measured values.
Energies 18 05516 g004
Figure 5. Cycle-average composition of biogas obtained from microalgal biomass and bakery waste. Source: Authors’ own study.
Energies 18 05516 g005
Figure 6. Changes in the amount of hydrogen sulphide in biogas. Source: Authors’ own study.
Energies 18 05516 g006
Figure 7. Average hydrogen sulphide content in biogas; the means over each column not marked with the same letter are significantly different at p ≤ 0.05. Source: Authors’ own study.
Energies 18 05516 g007
Figure 8. The energy potential of biogas from microalgae biomass and bakery waste. Source: Authors’ own study.
Energies 18 05516 g008
Figure 9. Comparison of CO2 emissions between fossil fuels and biogas. Source: Authors’ own study.
Energies 18 05516 g009
Table 1. Summary of analytical parameters and measurement procedures for anaerobic digestion monitoring. Source: Authors’ own study.
ParametersUnitMethod/InstrumentFrequency
Biogas volumeLGas meterContinuous
pH-Probe integrated with the digester control and measurement systemContinuous
Temperature°CProbe integrated with the digester control and measurement systemContinuous
Oxidation-reduction potential (ORP)mVProbe integrated with the digester control and measurement systemContinuous
Methane (CH4), Carbon dioxide (CO2), Oxygen (O2), Nitrogen (N2)% (v/v)Biogas analyser (OPTIMA MRU)On measurement days (1, 2, 3, 4, 7)
Hydrogen sulphide (H2S)ppmBiogas analyser (OPTIMA MRU)On measurement days (1, 2, 3, 4, 7)
Higher heating value (HHV), Lower heating value (LHV)MJ/m3Calculated based on biogas
composition
On measurement days (1, 2, 3, 4, 7)
Table 2. Heating and calorific values of the biogas. Source: Authors’ own study.
SubstrateLoad [%]Avg. HHV
[MJ/m3]
HHV Range
[MJ/m3]
Avg. LHV
[MJ/m3]
LHV Range
[MJ/m3]
microalgae10024.6 ± 0.923.4–25.722.2 ± 0.821.1–23.2
bread+2522.2 ± 1.422.2–25.820.1 ± 1.220.1–23.3
rolls23.2 ± 0.923.2–25.520.9 ± 0.820.9–23.0
bread+5022.1 ± 1.222.1–25.220.4 ± 0.820.4–22.7
rolls23.4 ± 0.623.4–25.121.1 ± 0.621.1–22.6
bread+7522.4 ± 0.923.2–25.020.2 ± 0.820.2–22.2
rolls23.2 ± 0.723.2–25.020.9 ± 0.620.9–22.6
Table 3. Process conditions for methane production. Source: Authors’ own study.
SubstrateLoad [%]Measurement
[day]
pHORP
[mV]
Load Temperature [°C]
microalgae10017.07−308.636.87
27.07−320.536.87
37.07−278.136.98
47.07−312.636.98
77.08−322.736.87
bread+2517.06−270.536.98
27.07−312.036.87
37.07−310.236.87
47.08−321.536.98
77.08−328.736.87
rolls17.04−310.836.98
27.05−309.636.98
37.05−308.736.87
47.06−309.736.87
77.06−307.836.87
bread+5017.01−291.336.87
27.03−316.336.87
37.03−323.736.98
47.04−290.936.87
77.05−315.036.87
rolls17.03−287.936.87
27.04−302.236.98
37.05−289.636.87
47.07−273.036.98
77.07−285.336.87
bread+7517.00−281.736.87
27.02−310.436.87
37.03−310.236.87
47.04−307.436.87
77.05−306.936.98
rolls17.04−296.336.87
27.05−301.936.87
37.05−294.336.98
47.06−311.236.98
77.06−302.536.87
Disclaimer/Publisher’s Note: The statements, opinions and data contained in all publications are solely those of the individual author(s) and contributor(s) and not of MDPI and/or the editor(s). MDPI and/or the editor(s) disclaim responsibility for any injury to people or property resulting from any ideas, methods, instructions or products referred to in the content.