Abstract
The European Commission, through the REPowerEU plan and the “Fit for 55” package, aims to reduce fossil fuel dependence and greenhouse gas emissions by promoting electric and fuel cell hybrid electric vehicles (EV-FCHEVs). The transition to this mobility model requires energy systems that are able to provide both electricity and hydrogen while reducing the reliance of residential buildings on the national grid. This study analyses a poly-generative (PG) system composed of a Solid Oxide Fuel Cell (SOFC) fed by biomethane, a Photovoltaic (PV) system, and a Proton Exchange Membrane Electrolyser (PEME), with electric vehicles used as dynamic storage units. The assessment is based on simulation tools developed for the main components and applied to four representative seasonal days in Rende (Italy), considering different daily travel ranges of a 30-vehicle fleet. Results show that the PG system provides about 27 kW of electricity, 14.6 kW of heat, and 3.11 kg of hydrogen in winter, spring, and autumn, and about 26 kW, 14 kW, and 3.11 kg in summer; it fully covers the building’s electrical demand in summer and hot water demand in all seasons. The integration of EV batteries reduces grid dependence, improves renewable self-consumption, and allows for the continuous and efficient operation of both the SOFC and PEME, demonstrating the potential of the proposed system to support the green transition.
1. Introduction
From 2035, the “Ready for 55%” climate package [1] requires that pure or hybrid ICE vehicles fed by gasoline or diesel will no longer be manufactured. They will be progressively replaced by pure electric or fuel cell hybrid electric vehicles to reduce pollution and the generation of climate-altering gas emissions.
The introduction of this new green mobility not only requires additional electric power, but also new hydrogen generation capacity. The REPowerEU plan [2], written by the European Commission, was designed to rapidly reduce dependence on fossil fuels, to further develop a European hydrogen market, and to accelerate the deployment of renewable energy.
Solar was the fastest-growing EU power source in 2024; capacity additions hit a record high, and generation was 22% higher than in 2023. For the first time, solar (11%, 304 TWh) overtook coal (10%, 269 TWh) [3]. This trend is widespread, with growth observed in every EU country. However, accelerated clean flexibility and smart electrification are needed to sustain this expansion.
In this context, surplus electricity from renewable sources can be used in two complementary ways: to recharge electric vehicles or to produce green hydrogen for refuelling hybrid fuel cell vehicles [4,5,6,7,8]. Both solutions contribute to the decarbonisation of land and naval transport.
The Combined Heat and Power (CHP) generation offers greater efficiency and reduces waste, bringing both economic and environmental benefits. Solid Oxide Fuel Cell (SOFC) systems, in particular, present advantages such as fuel flexibility (e.g., steam/biogas mixtures [9] and biomethane [10]) and high efficiency in CHP generation.
Water electrolysis remains the most mature and promising technology for producing renewable hydrogen from non-carbon sources. Among the four main electrolyser technologies—alkaline (A), anion exchange membrane (AEM), proton exchange membrane (PEM) and solid oxide (SO)—the A and PEM systems have already achieved commercial maturity for large-scale applications, with deployments reaching hundreds of megawatts [11]. PEM electrolysers, in particular, convert water into high-purity hydrogen and oxygen with higher efficiency than conventional alkaline electrolysers [12]. Moreover, they can modulate absorbed electrical power within a defined range, adapting to the variable output of renewable energy sources while maintaining high efficiency [13].
Hence, the challenge is to develop distributed and highly efficient poly-generative systems that can exploit renewable energy sources (solar and biofuels) in the best possible way to support new green mobility and residential loads. In this context, the implementation of poly-generation or multi-source systems [14] emerges as a promising technical solution.
A review of the recent literature shows that, while some works have addressed new infrastructures for pure electric vehicles [15,16,17,18], there are relatively few studies on poly-generative systems combined with hydrogen generation [14,19,20,21,22,23,24,25].
In most of these articles [19,20,21,22,24], the systems were designed for stationary energy generation and did not support new green mobility. For instance, in [23], the authors presented a solar photovoltaic plant for hydrogen and electricity production to supply a fleet of 43 university buses. The system was modelled and optimised with TRNSYS® under dynamic weather conditions in Pakistan, the USA, and the UK.
In [24], the authors analysed an on-grid reversible Solid Oxide Cell (rSOC) plant with renewable sources and molten-salt heat storage through a time-resolved dynamic model, considering the hydrogen required for a bus fleet. The system achieved high co-generation efficiency and significant CO2 emission reductions.
A preliminary version of this work was presented at the SUPEHR23 conference [14], where a feasibility study was carried out on a poly-generative system combining SOFC, PV, and PEM electrolysis, considering only winter and summer days and fuels such as biogas and biomethane.
The present article develops a different case study. It implements new Vehicle-to-Grid (V2G) strategies for optimal energy management, focusing exclusively on biomethane to increase SOFC efficiency. The analysis is extended to four seasonal days, with two different minimum and maximum daily travel ranges of the vehicle fleet, providing a more comprehensive and detailed assessment.
The adoption of V2G technology, specifically using the lithium-ion batteries of some electric vehicles in the fleet, allows for dynamic storage of electricity produced by both PV and SOFC systems. This reduces dependence on the national grid, enables continuous operation of the SOFC at reduced size, and allows for the PEME to operate at fixed load and high efficiency even during winter days.
The poly-generative system is therefore designed to meet the needs of pure electric and hybrid fuel cell mobility, as well as the electric and thermal loads of a residential building in Rende, across four representative days of winter, spring, summer, and autumn.
A detailed energy analysis is performed to evaluate the electrical and thermal outputs, efficiencies, and hydrogen production for a mixed fleet of pure electric and hybrid fuel cell vehicles under varying travel distances. In addition, the coverage percentages of the building’s electrical and thermal loads are calculated for the four typical days.
The widespread adoption of poly-generative systems like the one analysed here would allow for the better utilisation of renewable energy sources and a drastic reduction of CO2 emissions, particularly in the transport sector, while also decreasing the dependence of buildings on fossil fuels.
In particular, the present analysis provides quantitative evidence of these benefits by showing that the proposed PG system can cover both mobility and residential demands while reducing the building’s dependence on the national grid, lowering biomethane consumption, and increasing renewable self-consumption. These insights underline the potential of PG systems to support the decarbonisation of both the transport and building sectors.
2. Electric and Thermal Loads of the Residential Building and New Green Vehicle Fleet
The thermal and electric power time trends of the residential building are defined as in [14,26,27], based on the users and the volumes served by the poly-generative system. In this work, the data related to a typical middle-season day (spring or autumn) are also included.
The electric needs are associated with the electric devices, while the thermal needs are due to domestic heating and hot water production.
The residential building is located in the urban area of Rende, Cosenza, Italy (39°20′ N 16°11′ E). It consists of five floors and three different apartment sizes with net useful surfaces of 100, 150, and 200 m2. The surfaces suitable for installing PV panels and the possible installation modes are described in [14].
For all the typical days, the time trends of the electric load and of the thermal loads for heating and hot water production, , and , for the building B are calculated by Equation (1) [14]:
, , are the useful surfaces of the different apartments; is the floor number and is the increasing factor in electric power consumed for common services, such as the lighting of the stairs and garages, equal to 0.10.
The time trends of the electrical load and of the thermal loads for hot water production and for heating in the residential building are shown in Figure 1.
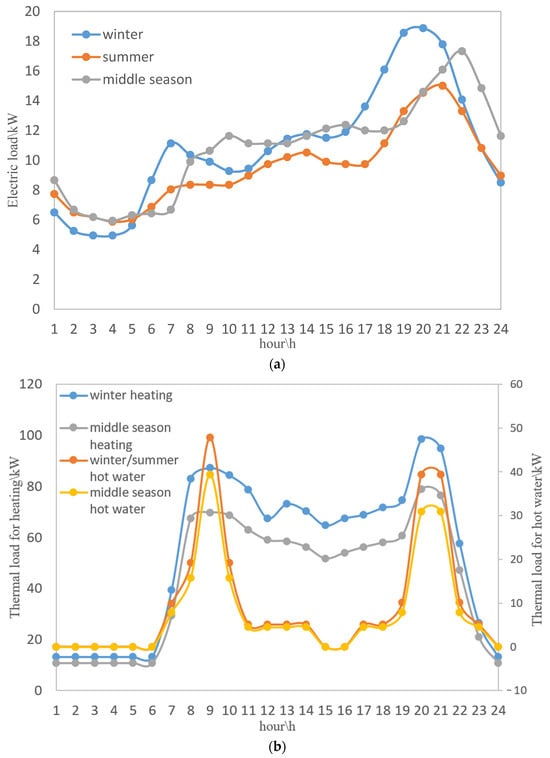
Figure 1.
Time trends of the electrical load (a) and of the thermal loads for hot water production and for heating for the residential building (b).
In the building, each family is assumed to consist of an average of four people and to own two vehicles, based on the statistics reported in [28]. The vehicle fleet includes three different types of cars: A (Fiat 500E), B (Tesla Model Y Long Range), and C (Toyota Mirai MY23 Pure). The technical specifications of these cars are reported in [29,30,31].
Types A and B are pure electric vehicles, designed to cover short and medium distances, respectively. Type C is a fuel cell (FC) hybrid electric vehicle, suitable for longer distances. The fleet is composed of 15 type A vehicles, 14 type B vehicles, and one type C vehicle.
The electric energy and hydrogen consumptions for the pure electric vehicles (A and B vehicles) and the hybrid fuel cell electric vehicle (C vehicle) are calculated, after having defined the specific electric energy (vehicle A: 0.13 kWh/km; vehicle B: 0.15 kWh/km) and hydrogen consumptions (vehicle C: 8 g/km) based on the manufactures data [29,30,31] and the daily travelled distances reported in paragraph 2. The electric energy nominal capacities of the pure electric vehicles A and B battery pack are considered equal to 42 kWh and 75 kWh based on the manufactures data [29,30].
The minimum daily travelled distances are 29 km for type A, 190 km for type B, and 276 km for type C. These minimum values correspond to 70% of the maximum travelled distances. The maximum daily travelled distances are defined as follows: for type A, the average daily distance for Calabrian urban cities [32]; for type B, the round-trip distance between the University of Calabria and Capo Vaticano; and for type C, the round-trip distance between the University of Calabria and Reggio Calabria.
3. Poly-Generative System
The simplified layout of the poly-generative system is shown in Figure 2. The system is composed of three main subsystems:

Figure 2.
Layout of the poly-generative system.
- The Photovoltaic (PV) system, which converts solar energy into electricity.
- The hydrogen production system, which uses the electricity generated by the PV system and bi-distilled water to produce hydrogen. The hydrogen is then compressed to high pressure (up to 750 bar), as required for refuelling the hybrid fuel cell vehicles (type C).
- The Solid Oxide Fuel Cell (SOFC) based system fed by biomethane, which produces the electric energy necessary for the recharge of the pure electric vehicles (A and B vehicles).
- The thermal energy produced by the SOFC based system covers the thermal energy needs of residential building for the heating and for the hot water production.
- The PV system covers totally the electric energy needs of the H2 production system and the electric vehicles with their battery packs have the important tasks of:
- Absorbing the surplus of electric energy produced by PV system to recharge themselves and to satisfy as much as possible the electric energy needs of the residential building, reducing its dependence on the national electric grid;
- Absorbing the surplus of electric energy produced by SOFC based system fed by biomethane operating 24 h a day continuously allowing us to reduce its size and its cost.
- The main components of the Poly-generative system are described in the following subparagraphs.
3.1. Photovoltaic System
The Photo-Voltaic (PV) system is mainly composed of the PV modules and of the inverter DC/AC to interface with the domestic electrical grid and of a converter DC/DC to interface with electric vehicles.
A commercial module [33] was chosen for this application, and its main technical data are shown in Table 1.

Table 1.
Main technical data of the PV module.
The solar radiation incident on the oriented plane is calculated through Equation (2):
In Equation (2), , , and are, respectively, the global radiation on the inclined plane, the global radiation, the direct radiation and the diffused radiation in the horizontal plane; α is the inclination angle of the surface; is the ratio between the direct radiation incident on the surface and that incident on the horizontal plane; is the ratio between the diffused radiation incident on the surface and that incident on the horizontal plane; a is the albedo value.
The sizing of the PV system, which consists of evaluating the number of modules that can be installed, is carried out by considering the available surface area and the surface occupied by each PV module. The output electric power of the system is then calculated on the basis of the module efficiency.
The procedure is applied to four representative days: a winter day (21 December), a spring day (21 March), a summer day (21 June), and an autumn day (22 September). These dates were selected to account for the typical solar radiation conditions of each season. More details on the PV system model are reported in [13].
The calculation tool based on the PV system model calculates the output electric energy produced by the PV modules, after having defined the values of the input parameters reported in Table 2.
Table 2.
Main input parameters of PV system model.
The DC electric powers produced by the PV system in the different typical days are shown in Figure 3.
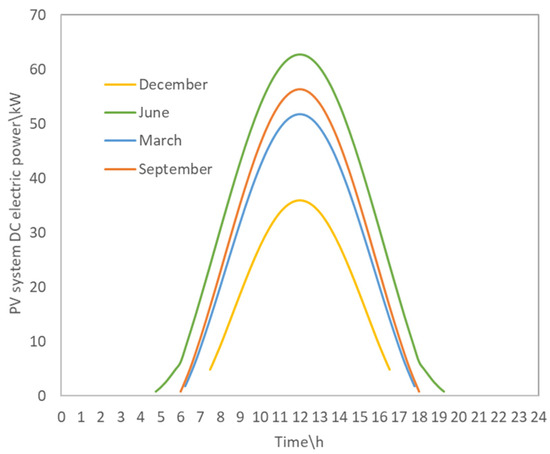
Figure 3.
Time trends of the output DC electric power produced by PV system in the four seasons’ typical days.
The DC electrical power generated by the PV system during these four typical days is shown in Figure 3. The system produces electricity from 7:30 a.m. to 4:30 p.m. in December, reaching a maximum of about 36 kW. In March, operation extends from 6 a.m. to 6 p.m., with a peak of about 53 kW. In June, the system produces from 4:45 a.m. to 7:15 p.m., reaching about 63 kW, while in September it operates from 6 a.m. to 6 p.m., with a peak of about 56 kW.
Overall, the daily energy produced by the PV system amounts to 214 kWh in December, 363 kWh in March, 489 kWh in June, and 404 kWh in September.
3.2. Hydrogen Generation System and Electric Charging Points
The hydrogen generation system consists of two main sections. The first is a Proton Exchange Membrane (PEM) electrolyser, which produces hydrogen at low pressure (up to 15 bar) from bi-distilled water using electricity supplied by the PV system. The second is a compression unit, which increases the hydrogen pressure up to 750 bar, making it suitable for refuelling the hybrid fuel cell vehicles (type C).
In [13], a calculation tool based on the dynamic electric simulation model of a PEM electrolyser system was developed in the Simulink® version 2019b environment and validated using experimental data from a commercial PEM electrolyser.
The PEM stack represents the core of the electrolyser system, which also includes the DC/DC buck converter, auxiliary devices (for measurement and control), and the hydrogen storage units. Using this tool, the best operating current range of the PEM electrolyser was identified, achieving an H2 production efficiency of about 65% (referred to the hydrogen high heating value) at a maximum hydrogen flow of approximately 60%, which is suitable for system-level energy balance evaluation. The dynamic electric model of the PEM electrolyser developed and validated in [13] accounts for variations in hydrogen mass flow and efficiency with absorbed power, and the simplified model used here can be directly related to that general formulation.
The PEM electrolyser system analysed in has been scaled up to produce the hydrogen required for vehicle C to cover its maximum daily distance, even under winter conditions with the lowest solar irradiation levels. This operation is supported by the integration of electric vehicle batteries. The PEME operates within its optimal current range, previously identified in [13], which ensures an efficiency of about 65% (HHV basis). This operating point was adopted to guarantee stable hydrogen production with high efficiency. The use of EV batteries further contributes to this methodology by providing a constant power input to the PEME, allowing for the system to operate at fixed load even during periods of low solar irradiation. This methodological approach ensures that the PEME model, validated against experimental data, can be reliably scaled up and adapted to the system-level analysis presented here.
The calculation tool based on the PEM electrolyzer dynamic electric model calculates the mass flow of hydrogen produced and the hydrogen production efficiency after having defined the values of the main input parameters reported in Table 3.
Table 3.
Input parameters of the PEM Electrolyzer dynamic electric model, including the PEM Electrolytic stack and DC-DC buck converter models.
Vehicle C requires a daily hydrogen supply of about 3.11 kg when travelling the maximum distance, and about 2.18 kg when travelling the minimum distance.
The PEM electrolyser system operates at the identified optimal operating point. In this condition, it produces the hydrogen required by vehicle type C and compresses it up to 750 bar. The process absorbs a constant electrical power of about 23 kW, for 9 h in the maximum-range condition and for 6.3 h in the minimum-range condition.
The electricity required for hydrogen generation and compression is entirely provided by the PV system on all the considered typical days.
Based on the number of vehicles, their technical specifications, and the minimum and maximum travelled distances, eight charging points are estimated for the recharging of pure electric vehicles, each operating at an electrical power of 7.5 kW. In addition, one hydrogen refuelling point is required for the type C vehicle, operating at an electrical power of about 23 kW.
Among the eight charging points, the first supplies electricity to the 15 type A pure electric vehicles, while the remaining seven supply the 14 type B pure electric vehicles. The maximum standard charging window is set from 8 p.m. to 8 a.m., corresponding to a total of 12 h.
3.3. Solid Oxide Fuel Cell System Fed by Bio-Methane
The general stationary model of the SOFC system fed by biogas developed in [9] was simplified by considering biomethane as a special biogas (CO2 and CH4 inlet molar fractions set to 0 and 1, respectively), without anodic exhaust gas recirculation, and with the steam-to-carbon (S/C) ratio equal to that of the commercial SOFC system reported in [10]. The SOFC stack was sized to deliver the required nominal power, and the output power was adjusted by decreasing the stack current and inlet biomethane flow, in order to preserve high electrical and thermal efficiencies. The electricity produced is used to recharge the pure electric type A and B vehicles on all the typical days.
The SOFC operates continuously, 24 h a day. When the vehicles travel the maximum distances, the system supplies a constant electric power of about 27 kW in winter, spring, and autumn, and about 26 kW in summer. On a typical summer day, the surplus electricity generated by the PV system, which cannot be consumed by the residential building, is used to recharge some of the type A vehicles. This operating mode reduces the electricity demand from the SOFC system and increases the self-consumption of PV electricity.
When the vehicles travel the minimum distances, the SOFC operates at reduced power levels of about 16.3 kW in winter, spring, and autumn, and about 15 kW in summer. If the type C hybrid fuel cell vehicle also travels the minimum distance, the electricity saved from hydrogen production is redirected to recharge type A and B vehicles. In this case, the PV system surplus, not used by the residential building, is again employed to recharge type A vehicles.
In terms of thermal energy, the SOFC system supplies constant outputs of 14.6 kW in winter, spring, and autumn, and about 14 kW in summer, when type A and B vehicles travel the maximum distances. When the vehicles travel the minimum distances, the thermal power is reduced to about 8.9 kW in winter, spring, and autumn, and about 8.2 kW in summer.
The net thermal output of the SOFC system, obtained by recovering heat from hot exhaust gases through heat exchange with water, is used to cover the thermal demands of the residential building for hot water production and heating on all the typical days.
3.4. Vehicle to Grid (V2G) for the Energy Storage and the Energy Management of the System
The poly-generative system requires three different types of variable electrical energy storage:
- To allow for the SOFC system to operate continuously at good efficiency, with reduced power, while covering the total electrical load of type A and B vehicles in all the typical days.
- To accumulate surplus PV electricity compared to the energy required by the hydrogen production system and the building, and to release it when PV generation is insufficient.
- To accumulate surplus PV electricity not used to cover the building’s electrical load.
These functions are provided by the Li-ion batteries of type A and B electric vehicles. The batteries must contain enough energy to allow for the vehicle to complete its trip, but they also have spare capacity to store and release additional electricity. This makes them an effective storage component for the poly-generative system.
Figure 4 shows the time trends of the electric power required to recharge type A and B vehicles (for both minimum and maximum travel ranges) and the electric power produced by the SOFC system in winter, spring, autumn, and summer. In the maximum-range condition, seven type A vehicles and ten type B vehicles accumulate the electricity generated by the SOFC between about 7 a.m. and 8 p.m., and return it between 8 p.m. and 7 a.m., completing the recharging of all vehicles with SOFC power.
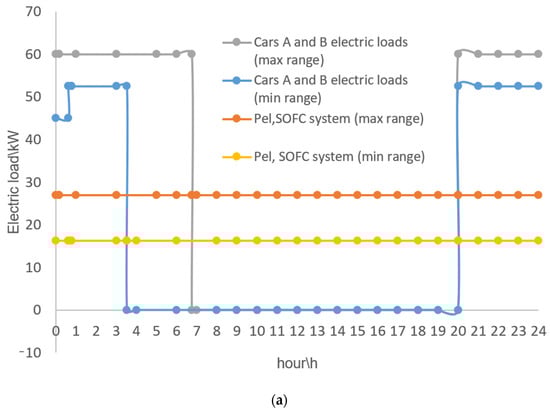
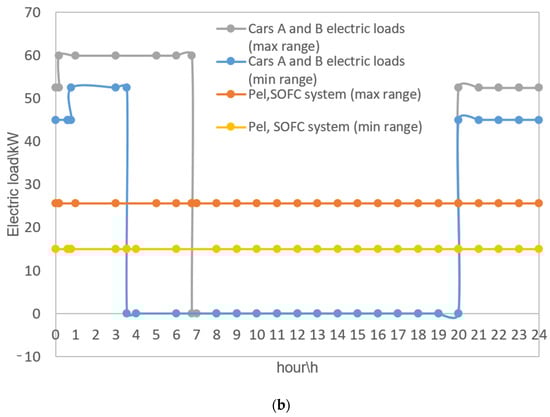
Figure 4.
Time trends of the electric power requested for the recharge of A and B electric vehicles, that travel the minimum and maximum distances (max and min ranges) and of the electric powers produced by the SOFC system in typical winter, spring and autumn days (a) and in a typical summer day (b).
In the minimum-range condition, five type A and five type B vehicles accumulate electricity from the SOFC between about 3:30 a.m. and 8 p.m., and return it between 8 p.m. and 3:30 a.m., again ensuring full recharging of the fleet.
Figure 5 shows the time trends of the PV system’s output DC power and the hydrogen generation system’s input DC power during a typical winter day under maximum-range conditions.
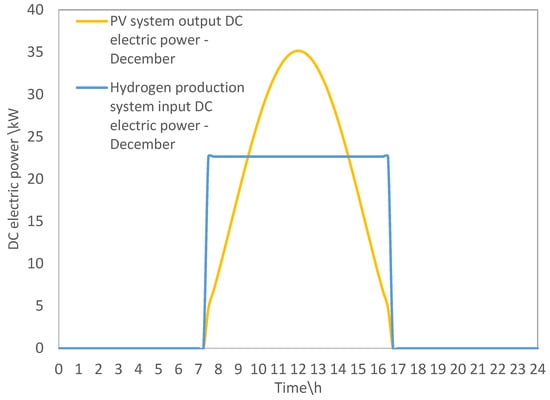
Figure 5.
Time trends of PV system output DC electric power and of hydrogen generation system input DC electric power on a typical winter day.
In this case, two pure electric type A vehicles or three pure electric type B vehicles accumulate the surplus electricity produced by the PV system between about 9 a.m. and 3 p.m. This energy is then returned between about 7:30–9:00 a.m. and 3:00–4:30 p.m. to supply the hydrogen refuelling system for the type C hybrid fuel cell vehicle.
In the minimum-range condition, the operating time of the hydrogen generation system decreases from 9 h to 6.3 h. The saved electricity, about 61.2 kWh, is used to fully recharge two type B vehicles and partially recharge a third, while also reducing the output power required from the SOFC system.
Figure 6 shows the trends of the net PV system output DC energy and the cumulative net DC equivalent energy, either required by the residential building or stored in the pure electric vehicles, during the typical spring (a), summer (b), and autumn (c) days. These trends account for the electricity consumed by the hydrogen generation system for refuelling the type C hybrid vehicle under maximum-range conditions.
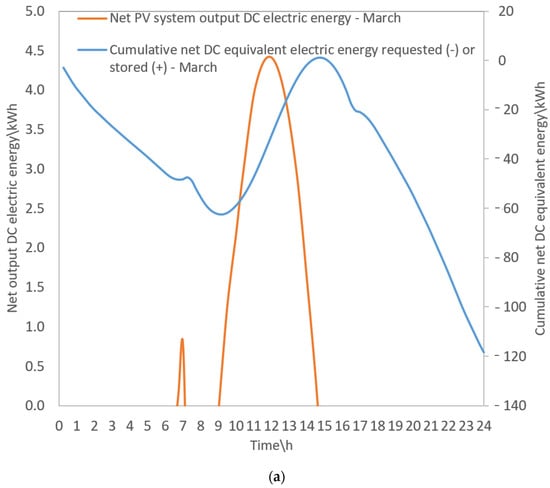
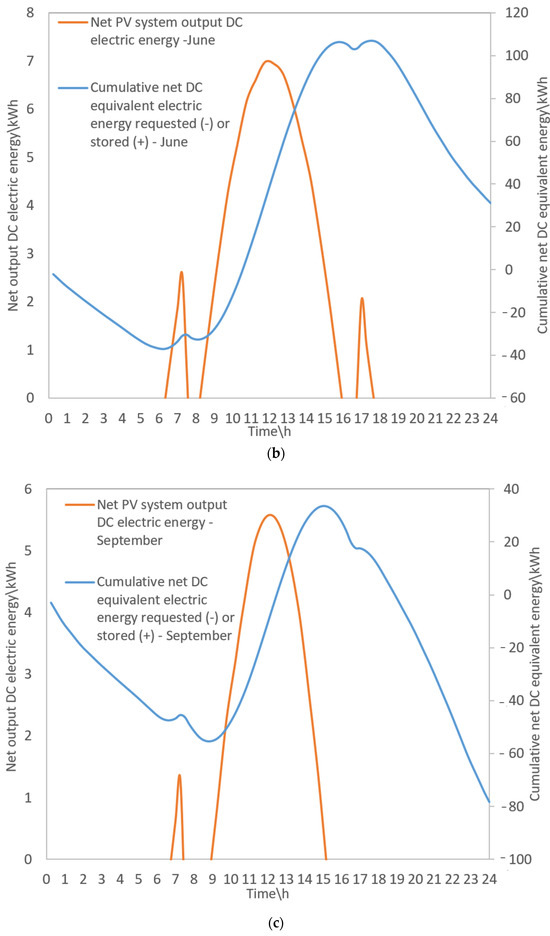
Figure 6.
Trends of the net PV system output DC electric energy and of the cumulative net DC equivalent electric energy, which is requested by the residential building equipped with PV system or is storable in the pure electric vehicles during typical spring (a), summer (b) and autumn (c) days.
On the spring day, the residential building absorbs about 62.5 kWh from the national grid until around 8:30 a.m. After this point, the same amount of energy plus an additional 1.1 kWh generated by the PV system can be stored in three type A vehicles or four type B vehicles (maximum range condition), or in three type A or three type B vehicles (minimum range condition) until about 2:30 p.m. The stored energy is then released to the building until 8 p.m.
Later the same day, the building absorbs another 56 kWh from the grid, bringing the total daily electricity demand to about 118.5 kWh. This demand is lower than what would be required without the PV system. In this configuration, type A or B vehicles are used to store surplus PV electricity, reducing the building’s reliance on the grid and increasing self-consumption of renewable energy.
On the summer day, the residential building absorbs about 37 kWh from the grid until 6 a.m. Afterwards, this same amount of energy, together with about 107 kWh generated by the PV system, can be stored in six type A or eight type B vehicles (maximum range condition), or in five type A or five type B vehicles (minimum range condition), until about 5:30 p.m.
Subsequently, part of the stored energy (about 76 kWh) is released to the building until midnight. The remaining 68 kWh stay stored in the vehicles. This surplus can be used in the following summer days, covering the 37 kWh daily electricity demand of the building and fully charging two type A vehicles plus partially a third, thereby reducing the demand on the SOFC system.
From the second summer day onwards, all the electricity required by the residential building is supplied by the PV system. The type A or B vehicles serve as storage units for surplus PV energy, eliminating the building’s demand from the national grid, increasing renewable self-consumption, and reducing biomethane consumption by the SOFC system.
On a typical autumn day, the residential building absorbs about 55.4 kWh from the national electricity grid until around 8:30 a.m. After this time, the same amount of energy plus an additional 33.7 kWh produced by the PV system can be stored in four type A vehicles or five type B vehicles under maximum-range conditions. Alternatively, in minimum-range conditions, the surplus can be stored in three type A or three type B vehicles until about 3 p.m., and then released to the residential building until 10 p.m.
Later the same day, the building absorbs an additional 23 kWh from the grid, reaching a total daily electricity demand of about 78.4 kWh. This value is significantly lower than the demand that would be required without the contribution of the PV system.
In this typical autumn day, type A and B vehicles are again used to store the surplus energy generated by the PV system. This storage strategy reduces the building’s reliance on the national grid and increases the self-consumption of renewable electricity.
4. Energy Analysis of the Poly-Generative System
The poly-generative system exploits renewable energy sources—solar power and biomethane—to generate electricity for charging type A and B pure electric vehicles, and to produce compressed hydrogen for refuelling the type C hybrid fuel cell vehicle. This operating scheme is applied across all the considered typical days.
Figure 7 shows the diagram of the energy flows and the fuel masses for the poly-generative system under all typical days and range conditions.

Figure 7.
Diagram of the energy flows and of the fuels masses for the poly-generative system.
In the maximum-range condition, the total daily biomethane consumption is about 82 kg in winter, spring, and autumn, and about 78 kg in summer. The corresponding daily output of compressed hydrogen is approximately 3.11 kg.
In the minimum-range condition, the daily biomethane consumption decreases to about 49 kg in winter, spring, and autumn, and to about 45 kg in summer. In this case, the output of compressed hydrogen is about 2.18 kg.
The electricity produced by the PV system fully covers the energy requirements for hydrogen production and compression on all typical days.
On the summer day, under maximum-range conditions, the surplus electricity from the PV system is used to fully recharge two type A vehicles and partially recharge a third. This also reduces the biomethane consumption of the SOFC system, while the PV system completely supplies the building’s electrical load.
In spring and autumn, the surplus PV electricity partially covers the building’s electrical load, by about 55.3% and 70.4%, respectively, under maximum-range conditions.
In addition, the PV electricity not required for hydrogen production (in the minimum-range condition) can be redirected to fully recharge two type B vehicles and partially recharge a third, across all the typical days.
Regarding thermal energy, in the maximum-range condition the poly-generative system fully covers the building’s demand for domestic hot water production on all typical days.
In the minimum-range condition, the system supplies about 92.3% and 85% of the hot water demand in winter and summer, respectively, while fully covering this load in spring and autumn.
For space heating, the thermal output of the poly-generative system covers about 9.4% to 15.6% of the building’s demand in winter, spring, and autumn under maximum-range conditions, and only about 2.4% of the demand in spring or autumn under minimum-range conditions.
5. Conclusions
This article presented a detailed energy analysis of a poly-generative system based on solid oxide fuel cells and electrolysers. The system was designed to satisfy the needs of pure electric or hybrid fuel cell mobility and the electrical and thermal loads of a residential building in Italy across four representative days of winter, spring, summer, and autumn, with varying vehicle travel distances.
Although simplified models were adopted for the PEM electrolyzer and the SOFC system to enable system-level energy balance analysis, this approach was adequate for the present scope, while the general models remain available for control-oriented studies.
The poly-generative system, fed by renewable energy sources such as solar power and biomethane (derived from the anaerobic digestion of the organic fraction of municipal solid waste), produces electricity for charging type A and B electric vehicles and compressed hydrogen for refuelling the type C hybrid vehicle.
Within the system, the Li-ion batteries of the type A and B vehicles perform three key storage functions:
- Enabling continuous and efficient SOFC operation with reduced biomethane consumption, while covering the total electrical load of the fleet.
- Accumulating surplus PV electricity compared to the demand of the hydrogen production system and the building and releasing it when PV output is insufficient.
- Storing surplus PV electricity not required for the building’s electrical load.
In the winter, on a typical day under maximum-range conditions, two type A vehicles or three type B vehicles accumulate surplus PV electricity to support the hydrogen refuelling of the type C vehicle. Under minimum-range conditions, the operating time of the hydrogen generation system decreases from 9 h to 6.3 h, and the saved electricity (about 61.2 kWh) is used to fully recharge two type B vehicles and partially a third, while reducing SOFC power output.
Across all typical days, different numbers of type A and B vehicles are engaged in storing surplus PV electricity. This reduces the building’s demand from the national grid, increases renewable self-consumption, and lowers biomethane consumption by the SOFC system.
The total daily biomethane consumption is about 82 kg in winter, spring, and autumn, and 78 kg in summer under maximum-range conditions. In minimum-range conditions, the consumption decreases to 49 kg in winter, spring, and autumn, and 45 kg in summer. The corresponding daily compressed hydrogen production is about 3.11 kg (maximum range) and 2.18 kg (minimum range).
PV electricity fully covers the demand for hydrogen production and compression on all typical days. In summer under maximum-range conditions, the surplus PV electricity recharges two type A vehicles and partially a third, while also reducing SOFC biomethane consumption and fully covering the building’s electrical load. In spring and autumn, the PV surplus covers about 55.3% and 70.4% of the building’s electricity demand, respectively, under maximum-range conditions. In the minimum-range case, surplus PV electricity not used for hydrogen production is redirected to recharge two type B vehicles and partially a third.
Regarding thermal energy, in maximum-range conditions, the system fully covers the building’s domestic hot water demand on all typical days. In minimum-range conditions, it supplies about 92.3% and 85% of the hot water demand in winter and summer, respectively, and fully covers the demand in spring and autumn. For space heating, the thermal output covers about 9.4–15.6% of the demand in winter, spring, and autumn under maximum-range conditions and about 2.4% under minimum-range conditions.
Overall, the poly-generative system enables the use of biomethane to simultaneously produce electricity for short- to medium-range electric vehicles and thermal energy at high efficiency. At the same time, it stores surplus solar energy as hydrogen for long-range fuel cell vehicles, while partially or totally meeting the electrical demand of the residential building. The thermal output of the SOFC system, recovered from exhaust gases, is effectively used for hot water production and space heating.
The scope of this study was restricted to simulation-based analyses of a single residential building and a representative vehicle fleet. The load profiles were derived from the literature data [14,26,27] and adapted to four representative seasonal days. While this approach ensures consistency with real consumption trends and allows for a clear seasonal comparison, it inevitably simplifies the variability of real irradiance conditions and daily demand fluctuations.
Future developments of this work include the integration of different conventional and unconventional energy systems, using programmable renewable sources (e.g., biomethane) to produce electricity and heat, and non-programmable sources (e.g., solar and wind) to generate electricity and hydrogen. The implementation of an advanced control system will also be essential to dynamically and optimally manage both programmable and non-programmable renewables under variable vehicle demand throughout the year.
Author Contributions
Conceptualization, G.D.L.; methodology, G.D.L. and N.B.; software, G.D.L.; validation, G.D.L.; formal analysis, G.D.L.; investigation, G.D.L.; resources, N.B. and A.S.V.; data curation, G.D.L.; writing—original draft preparation, G.D.L. and N.B.; writing—review and editing, G.D.L., N.B. and A.S.V.; visualization, G.D.L.; supervision, N.B. and A.S.V.; project administration, N.B.; funding acquisition, N.B. All authors have read and agreed to the published version of the manuscript.
Funding
This study was carried out in the Electrolife project that is supported by the Clean Hydrogen Partnership and its members and has received funding from the Horizon Europe programme under grant agreement No. 101137802. Views and opinions expressed are however those of the author(s) only and do not necessarily reflect those of the European Union or the Clean Hydrogen Partnership. Neither the European Union nor the granting authority can be held responsible for them.
Institutional Review Board Statement
Not applicable.
Data Availability Statement
The data presented in this study are available on request from the corresponding author.
Conflicts of Interest
The authors declare no conflicts of interest.
Nomenclature
| Symbols | ||
| L | Load | kW |
| l | specific load | kW m−2 |
| S | Surface | m2 |
| n | Number | - |
| t | Time | h or s |
| h | solar radiation | W m−2 |
| r | Ratio | - |
| a | Albedo | - |
| I | current | A |
| N | number | - |
| P | Power | kW |
| R | Resistance | Ω |
| DR | Resistance variation | Ω |
| C | Capacitance | F |
| f | frequency | Hz |
| L | inductance | H |
| Subscripts | ||
| el | Electric | |
| B | Building | |
| th | thermal | |
| cs | common services | |
| ap | Apartment | |
| floor | Floor | |
| hw | hot water | |
| heat | heating | |
| a | referred to inclined plane | |
| b | referred to direct radiation | |
| d | referred to diffused radiation | |
| ss | referred to the short stack | |
| min | minimum value | |
| c | referred to the cell elements in a short stack | |
| id | ideal | |
| an | anode | |
| mem | membrane | |
| cat | cathode | |
| sw | switch | |
| in | input | |
| stab2 | output stabilizing | |
| 1 | output branch | |
| el | electric | |
| DC | Direct Current | |
| in1 | Input branch | |
| out1 | Output branch | |
References
- The European “Fit for 55” Plan. Available online: https://www.consilium.europa.eu/it/policies/green-deal/fit-for-55-the-eu-plan-for-a-green-transition/ (accessed on 25 June 2025).
- The European REPowerEU Plan. Available online: https://www.consilium.europa.eu/it/policies/eu-recovery-plan/repowereu/ (accessed on 25 June 2025).
- European Electricity Review 2025. Available online: https://ember-energy.org/app/uploads/2025/01/EER_2025_22012025.pdf (accessed on 25 June 2025).
- Niu, S.; Zhao, Q.; Chen, H.; Yu, H.; Niu, S.; Jian, L. Underwater Wireless Charging System of Unmanned Surface Vehicles with High Power, Large Misalignment Tolerance and Light Weight: Analysis, Design and Optimization. Energies 2022, 15, 9529. [Google Scholar] [CrossRef]
- Nory, H.; Yildiz, A.; Aksun, S.; Aksoy, C. Design and Analysis of an IE6 Hyper-Efficiency Permanent Magnet Synchronous Motor for Electric Vehicle Applications. Energies 2025, 18, 4684. [Google Scholar] [CrossRef]
- De Lorenzo, G.; Piraino, F.; Longo, F.; Tinè, G.; Boscaino, V.; Panzavecchia, N.; Caccia, M.; Fragiacomo, P. Modelling and Performance Analysis of an Autonomous Marine Vehicle Powered by a Fuel Cell Hybrid Powertrain. Energies 2022, 15, 6926. [Google Scholar] [CrossRef]
- De Lorenzo, G.; Ruffo, R.M.; Fragiacomo, P. Preliminary Design of the Fuel Cells Based Energy Systems for a Cruise Ship. World Electr. Veh. J. 2023, 14, 263. [Google Scholar] [CrossRef]
- Matignon, M.; Mcharek, M.; Azib, T.; Chaibet, A. Enhancing Fuel Cell Hybrid Electric Vehicle Energy Management with Real-Time LSTM Speed Prediction. Energies 2025, 18, 4340. [Google Scholar] [CrossRef]
- De Lorenzo, G.; Fragiacomo, P. Electrical and thermal analysis of an intermediate temperature IIR-SOFC system fed by biogas. Energy Sci. Eng. 2018, 6, 60–72. [Google Scholar] [CrossRef]
- Technical Specification of Solydera Bluegen BG-15. Available online: https://bluegen.eu/it/ (accessed on 25 June 2025).
- Water Electrolysis and Hydrogen: Growing Deployment Prospects in Europe and Beyond. Available online: https://joint-research-centre.ec.europa.eu/jrc-news-and-updates/water-electrolysis-and-hydrogen-growing-deployment-prospects-europe-and-beyond-2023-11-24_en (accessed on 25 June 2025).
- Kumar, S.S.; Himabindu, V. Hydrogen production by PEM water electrolysis—A review. Mater. Sci. Energy Technol. 2019, 2, 442. [Google Scholar]
- De Lorenzo, G.; Agostino, R.G.; Fragiacomo, P. Dynamic Electric Simulation Model of a Proton Exchange Membrane Electrolyzer System for Hydrogen Production. Energies 2022, 15, 6437. [Google Scholar] [CrossRef]
- De Lorenzo, G.; Corigliano, O.; Piraino, F.; Genovese, M.; Fragiacomo, P. Technical feasibility study of a renewable fuel cell/electrolyzer poly-generative system. E3S Web Conf. 2023, 414, 03014. [Google Scholar] [CrossRef]
- Lei, X.; Zhong, J.; Chen, Y.; Shao, Z.; Jian, L. Grid integration of electric vehicles within electricity and carbon markets: A comprehensive overview. eTransportation 2025, 25, 100435. [Google Scholar] [CrossRef]
- Carvalhosa, S.; José Rui Ferreira, J.R.; Araújo, R.E. Fuzzy Logic Estimation of Coincidence Factors for EV Fleet Charging Infrastructure Planning in Residential Buildings. Energies 2025, 18, 4679. [Google Scholar] [CrossRef]
- Colombo, C.G.; Leone, C.; Miraftabzadeh, S.M.; Matera, N.; Longo, M. Location of Charging Stations Considering Services and Power Losses: Case Study. Energies 2025, 18, 4923. [Google Scholar] [CrossRef]
- Mogire, E.; Kilbourn, P.; Luke, R. Smart Charging for E-Mobility in Urban Areas: A Bibliometric Review. Energies 2025, 18, 4655. [Google Scholar] [CrossRef]
- Khalid, F.; Kumar, R. Thermodynamic assessment of a new PTC operated polygeneration system for fresh water, cooling, electricity and hydrogen production for a residential community. Int. J. Hydrogen Energy 2023, 48, 38991–39001. [Google Scholar] [CrossRef]
- Luqman, M.; Al-Ansari, T. Energy, water and food security through a wastedriven polygeneration system for sustainable dairy production. Int. J. Hydrogen Energy 2022, 47, 3185–3210. [Google Scholar] [CrossRef]
- Minutillo, M.; Perna, A.; Sorce, A. Combined hydrogen, heat and electricity generation via biogas reforming: Energy and economic assessments. Int. J. Hydrogen Energy 2019, 44, 23880–23898. [Google Scholar] [CrossRef]
- Hai, T.; Ali, M.A.; Alizadeh, A.; Almojil, S.F.; Almohana, A.I.; Chauhan, B.S.; Alali, A.F.; Raise, A. Optimization next to environmental analysis of harvesting waste heat from a biomass-driven externally-fired gas turbine cycle for sub-zero cooling and production of hydrogen, freshwater, and hot water. Appl. Term. Eng. 2023, 223, 119884. [Google Scholar] [CrossRef]
- Saleem, M.S.; Abas, N. A solar assisted grid-tied polygeneration system for hydrogen and electricity production: Future of energy transition from electrons to molecules. Int. J. Hydrogen Energy 2024, 69, 559–569. [Google Scholar] [CrossRef]
- Rostami, M.; Manshadi, M.D.; Afshari, E. Energy production and storage from a polygeneration system based on parabolic trough solar collector, proton exchange membrane fuel cell, organic Rankine cycle, and alkaline electrolyzer. J. Energy Storage 2022, 47, 103635. [Google Scholar] [CrossRef]
- Buffo, G.; Ferrero, D.; Santarelli, M.; Lanzini, A. Energy and environmental analysis of a flexible Power-to-X plant based on Reversible Solid Oxide Cells (rSOCs) for an urban district. J. Energy Storage 2020, 29, 101314. [Google Scholar] [CrossRef]
- Gallanti, M.; Grattieri, W.; Maggiore, S.; Marino, A. Analisi ed Evoluzione Negli Anni Delle Curve di Carico dei Clienti Domestici, Energia Elettrica, November 2012. Available online: https://www.researchgate.net/profile/Simone-Maggiore/publication/273119076_Analisi_ed_evoluzione_negli_anni_delle_curve_di_carico_dei_clienti_domestici/links/556ecf5d08aeccd7773f7e75/Analisi-ed-evoluzione-negli-anni-delle-curve-di-carico-dei-clienti-domestici.pdf (accessed on 25 June 2025).
- Di Somma, M.; Bertini, I.; Caliano, M.; Graditi, G.; Mongibello, L.; Puglisi, G. Ottimizzazione Economico—Exergetica Delle Prestazioni di Reti Energetiche Distribuite su Scala Distrettuale: Applicazione ad un Caso Studio Reale, RdS/PAR2017082, September 2018. Available online: https://www.ricercasistemaelettrico.enea.it/archivio-documenti.html?task=download.send&id=3811:ottimizzazione-economico-exergetica-delle-prestazioni-di-reti-energetiche-distribuite-su-scala-distrettuale-applicazione-ad-un-caso-studio-reale&catid=131 (accessed on 25 June 2025).
- Average Number of Vehicles in Italy per Inhabitant. Available online: https://ec.europa.eu/eurostat/web/products-eurostat-news/-/edn-20210922-1 (accessed on 25 June 2025).
- Fiat 500E Technical Specifications. Available online: https://thedriver.it/listini-auto-nuove/fiat/500-electric (accessed on 25 June 2025).
- Tesla Model Y Longe Range Technical Specifications. Available online: https://www.ultimatespecs.com/it/auto-caratteristiche-tecniche/Tesla/118935/Tesla-Model-Y-Long-Range-AWD.html (accessed on 25 June 2025).
- Toyota Mirai MY23 Pure Technical Specifications. Available online: https://www.toyota.it/content/dam/toyota/nmsc/italy/gamma/pdf/scheda-tecnica/MIRAI_Scheda_tecnica.pdf (accessed on 25 June 2025).
- Average Daily Traveled in 2019 for Calabrian Urban Cities. Available online: https://www.unipolsai.it/homepage (accessed on 25 June 2025).
- PV Module Data Sheet. Available online: https://media.adeo.com/marketplace/LMIT/85830903/3316547.pdf (accessed on 25 June 2025).
Disclaimer/Publisher’s Note: The statements, opinions and data contained in all publications are solely those of the individual author(s) and contributor(s) and not of MDPI and/or the editor(s). MDPI and/or the editor(s) disclaim responsibility for any injury to people or property resulting from any ideas, methods, instructions or products referred to in the content. |
© 2025 by the authors. Licensee MDPI, Basel, Switzerland. This article is an open access article distributed under the terms and conditions of the Creative Commons Attribution (CC BY) license (https://creativecommons.org/licenses/by/4.0/).