You are currently viewing a new version of our website. To view the old version click .
Energies
  • Article
  • Open Access

18 January 2025

Simulation and Experimental Study of Arc Model in a Low-Voltage Distribution Network †

,
,
,
and
1
State Grid Anhui Electric Power Co., Ltd., Electric Power Research Institute, Hefei 230031, China
2
School of Electrical Engineering and Automation, Anhui University, Hefei 230093, China
*
Author to whom correspondence should be addressed.
This paper is an extended version of our paper published in 2023 13th International Conference on Power and Energy Systems (ICPES), Chengdu, China, 8–10 December 2023; pp. 13–18.
This article belongs to the Special Issue Advances in Power Distribution Systems

Abstract

Using the low-voltage and low-current platform (220 VAC-10 A), this paper selected the Mayr arc theoretical model and the improved control theory model as a theoretical basis and built a single-phase low-voltage AC series arc model based on Simulink. The simulation results showed that arc dissipation power directly determined arc voltage amplitude, arc time constant influenced arc voltage waveform, and arc current was mainly determined by load resistance. Because the arc length parameter can be set by the improved control arc theory model, the arc can be drawn only at the micro-distance of two electrodes, which is more suitable for describing the arc characteristics of low voltage and low current. A scheme of large ratio reducer for permanent magnet brushless DC motor was developed, which was combined with the stepless governor controlled by PWM and the positive and negative switch to realize the adjustment of the two-electrode micro-distance. The collection and analysis of arc voltage and arc current under pure resistance, resistive load, and multi-branch load were completed. The experimental results also verified that the Mayr arc and improved control theory arc have good accuracy in describing low voltage and low current characteristics, which improves data support for later fault identification and removal.

1. Introduction

In the low-voltage distribution network system, series arc faults are one of the common fault types due to aged wires and loose plugs. Fires caused by poor contact of electrical equipment, aging insulation, or mechanical external force impact have received increasing attention. Electric fire ignition mechanisms, early warning and prevention, arc fault identification and perception, and fire extinguishing methods have become research hotspots.
The Mayr arc model and the improved control theory arc model are described by the first-order differential equation about arc conductance g, and are suitable for low-voltage and low-current case [1,2,3,4,5]. The appended Material variable definition table encapsulates definitions for all variables; refer to the Supplementary Material.
A time-variance accuracy coefficient optimized random forest model is proposed to identify series arc faults with feature aliasing in low-voltage scenarios, which builds arc platforms considering different load characteristics [6,7].
The convolutional neural network (CNN) is widely used to detect arc faults because it can automatically extract arc features for signal classification [8,9,10]. For the dimmer loads, a time-series reconstruction method is presented to distinguish normal signals with arcing ones based on spectral features [9]. An arc detection model based on CNN has been proposed to identify an arcing current, which can achieve a maximum of 99.47% arc detection accuracy at a 10 kHz sampling rate [10]. The recurrent neural network (RNN) is also used to detect series arc fault instead of CNN because the RNN method is more suitable to analyzing time-series [11].
The current of series arc faults is time-varying and stochastic, therefore, the time-frequency methods such as discrete wavelet transform (DWT), empirical wavelet transform (EWT), or empirical mode decomposition (EMD) are suitable for series arc fault detection [12,13,14]. Five-layer empirical wavelet transform decomposition is performed based on the current signal measured at the front of the inverter [14].
For the simple nonlinear loads, fast Fourier transform (FFT) and wavelet decomposition can be used to extract frequency domain features for arc detection. An arc fault detection model based on the residual network was proposed from the perspective of computer vision, and an appropriate data enhancement method was given [15].
In the above literature, there are few studies based on the characteristics of low-voltage platform arc model, especially in the aspect of combining experimental waveform verification. An important discovery was made through a number of experiments in this paper. The arc pulling distance between two electrodes is very small (measured about 0.1 mm) in a low-voltage distribution network (220 Vac). The main work was to design a platform to accurately control the distance.
In this paper, according to the characteristics of 220 Vac low-voltage and low-current power supply scenario, based on the Mayr arc and improved control arc theory, a single-phase low-voltage AC series arc model was simulated. To simulate the arc generation scene, an arc generation platform was developed in this paper. The shift of one pole is driven by a permanent magnet (PM) brush motor with large reduction ratio reducer. The biggest advantage of the arc platform is that it can achieve accurate tiny distance control between two poles.

2. Materials and Methods

Based on the Mayr arc and improved control theory arc theory, the derivation process and the realization in Simulink are summarized. The single-phase AC low-voltage series arc model was built and the experimental device of the single-channel arc pulling automatic control system was verified.
To describe the characteristics of the “zero rest” zone of arc current, an improved Sigmoid function was introduced to describe the transition function ζ with arc current i as the variable. The Simulink model and mathematical description about Sigmoid function are defined in Figure 1 and Equation (1):
ζ i = 1 1 + e α β i 2 I 0 2
where i is the instantaneous value of the arc current, coefficient α is the value [20,50,80,200], coefficient β is the value of 0.005, and I0 is the transition current with a value of 0.2.
Figure 1. Transition function ζ model in Simulink.
Under the conditions of coefficient α [20,50,80,200], coefficient β = 0.005, and transition current I0 = 0.2, the change curve of transition function ζ(i) with the instantaneous arc current i (value range [−30, 30]) is given in Figure 2. The simulation results show that ζ(i) was larger and the X-axis range was wider when ζ(i) < 1. The larger the coefficient α, the closer the value of ζ(i) at i = 0 is to zero and the narrower the X-axis range across ζ(i) < 1 is to rectangle.
Figure 2. Transition function ζ(i) changes with arc current.
For single-phase 220 Vac-50 Hz, the instantaneous value of current i considering the arc is expressed as follows:
i = I 1 ζ i sin 2 π f t
where I1 is the RMS value of the current (assuming I1 = 10 A) and f is the frequency of the power supply (f = 50 Hz).
The instantaneous value of arc current i and the transition function ζ(i) in Equation (2) shows the phenomenon of “zero rest” in each region of zero crossing in Figure 3 and Figure 4.
Figure 3. Arc current changes with time t.
Figure 4. Transition function ζ(i) changes with time (s).

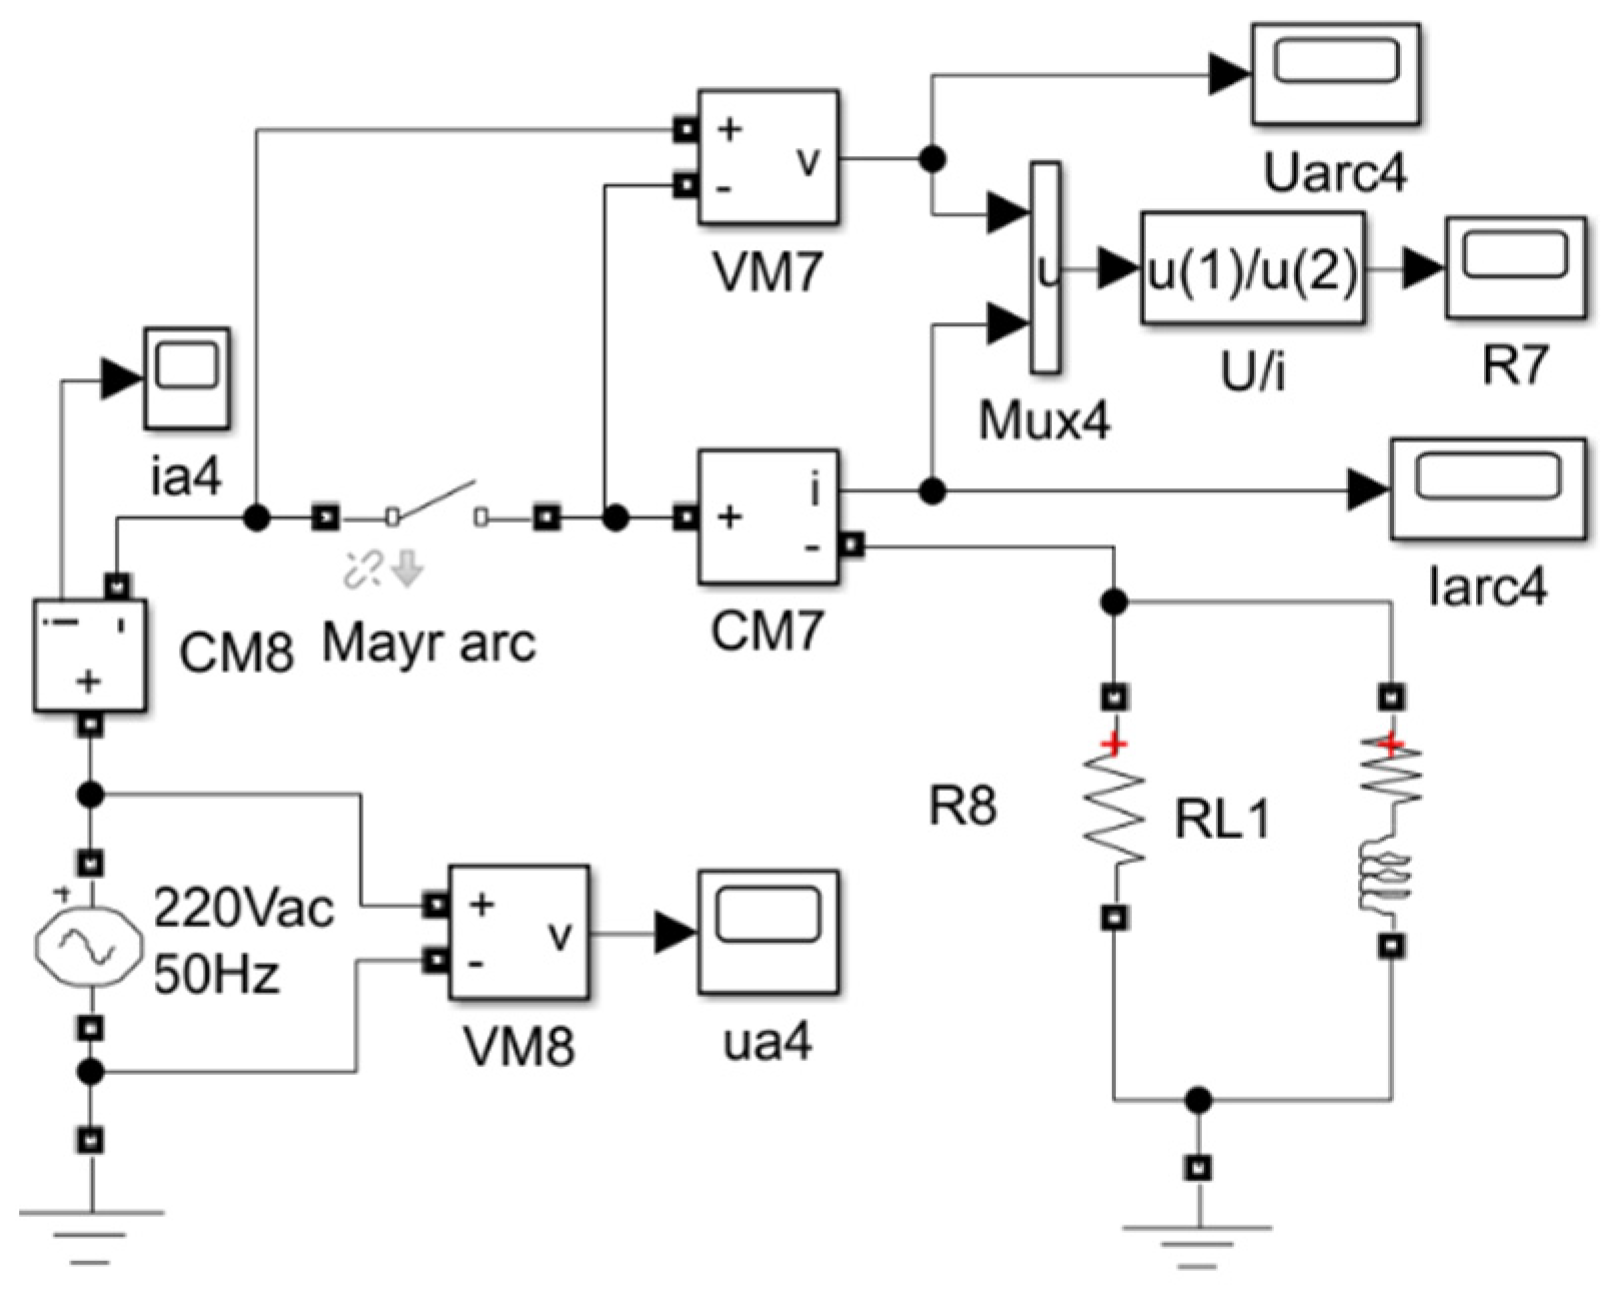
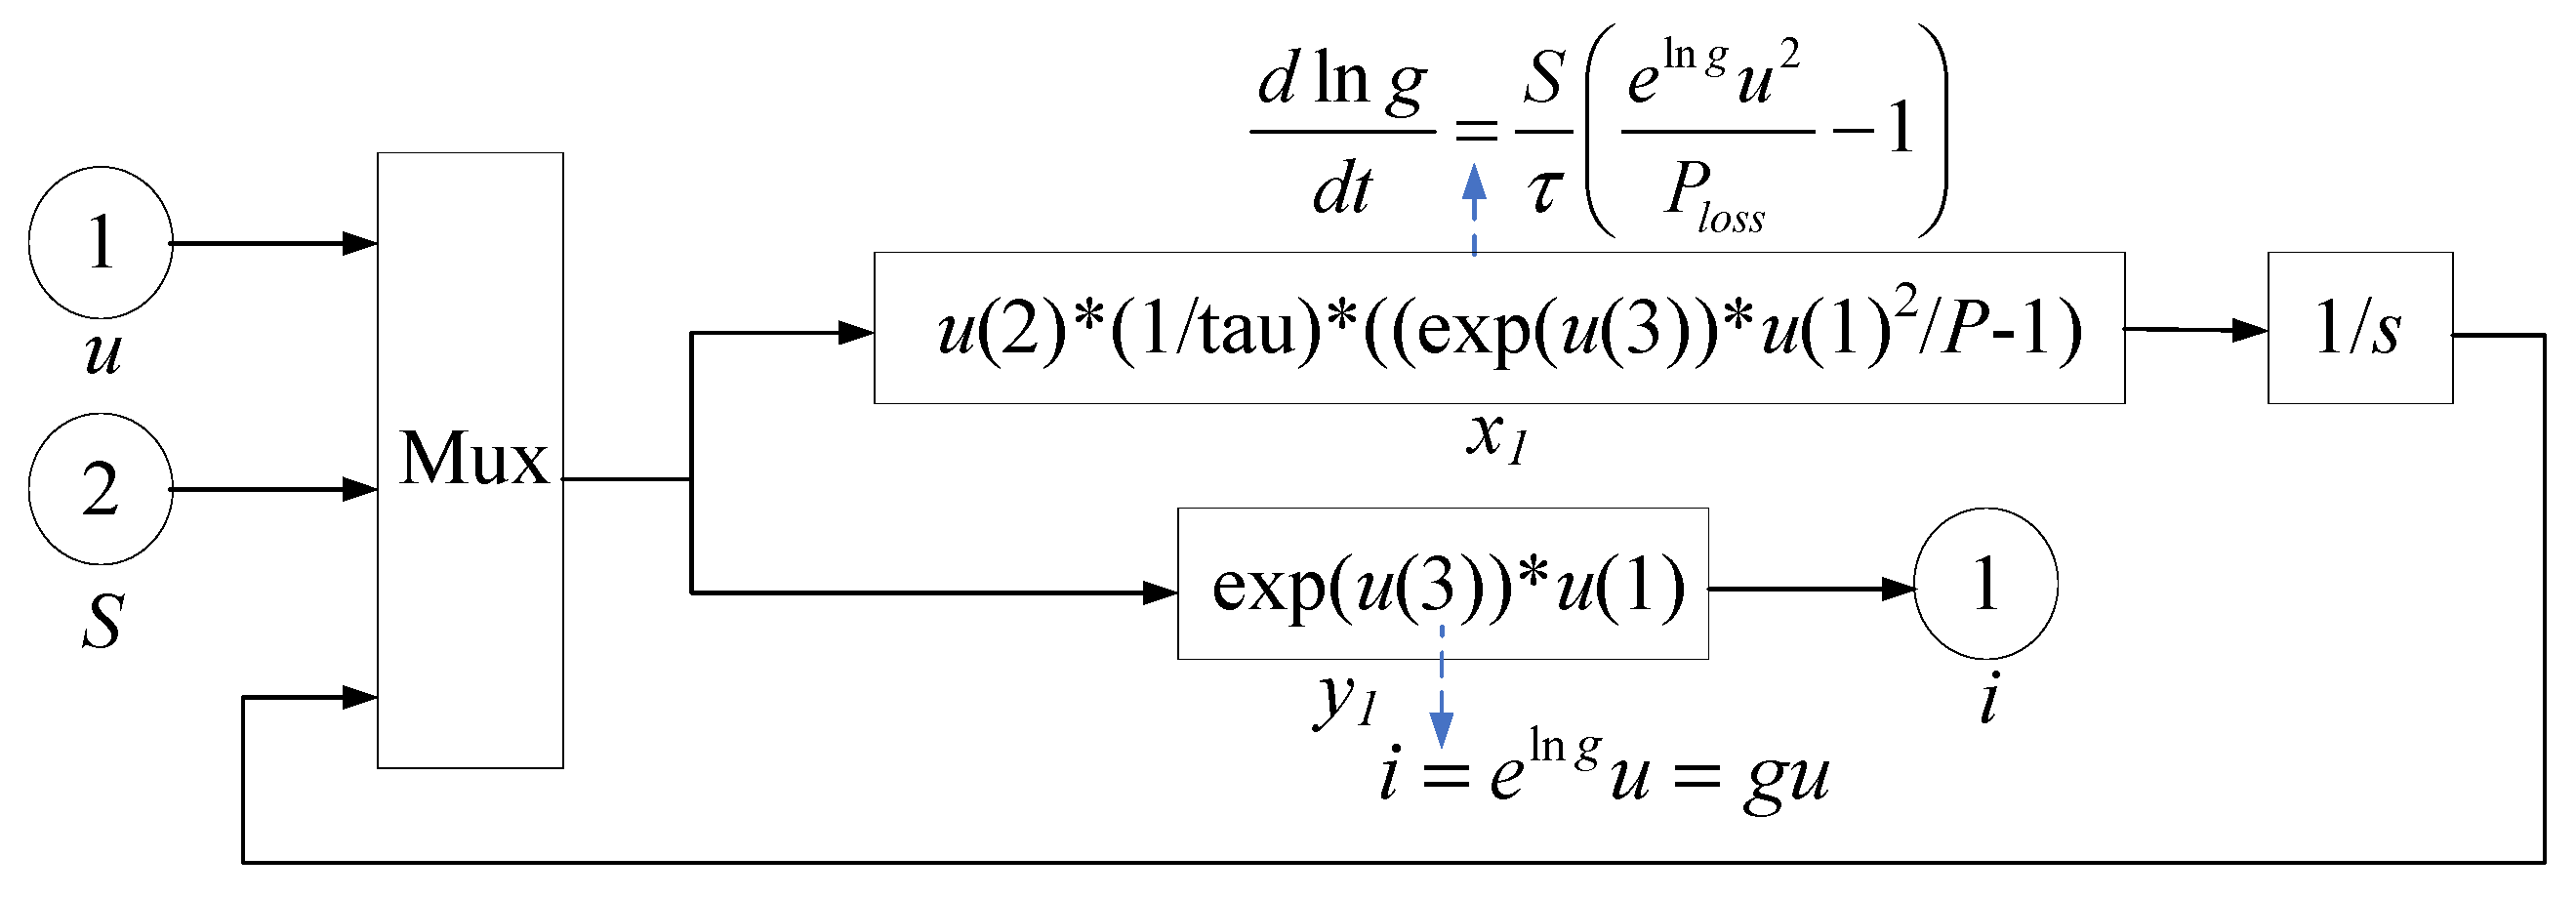
2.1. Mayr Arc Theoretical Model

Since the experimental platform adopted a 220 Vac single-phase AC power with low-voltage distribution, the Mayr arc model was suitable for simulating arc ignition with high-resistance and low-current load and describing arc state near the “zero rest” zone. Therefore, the theoretical basis of this paper was based on the Mayr arc model and the improved control theory model.
No matter the Mayr arc model or the control theory arc model, the arc in the arc gap was described according to the principle of energy conservation, and the expression is described as Equation (3). The black box model of the arc described above is the differential equation of Equation (3) concerning the arc conductance g. In Equation (3), the energy change rate dq/dt stored per unit length arc is equal to the difference between the input power ei per unit length arc and the combustion dissipation power P0 per unit length arc [1,2,3,4,6].
d q d t = d q d g d g d t = e i P 0 d g d t = P 0 d q d g e i P 0 1 1 g d g d t = 1 g P 0 d q d g e i P 0 1 = 1 τ e i P 0 1 , τ = g P 0 d q d g
The arc heat dissipation power Ploss and the arc time constant τ play key roles in the Mayr arc extinguishing process. Its mathematical definition is described as follows:
1 g d g d t = d ln g d t = 1 τ e i P 0 1 = 1 τ e i L P 0 L 1 = 1 τ u i P l o s s 1 1 g d g d t = 1 τ u i P l o s s 1
where g is arc conductance, Ploss is arc combustion dissipation power (Ploss = P0 × L)), u is arc voltage (u = e × L), e is unit arc column electric field strength, i is arc current (i = g × u), P0 is power loss per unit arc length, τ is time constant, and other parameters are defined as Equation (3).
According to the mathematical description of the Mayr arc model in Equation (4), arc conductance g and arc resistance R can be obtained by integrating the time t, as shown in Equations (5) and (6).
ln g = 1 τ u i P l o s s 1 d t e ln g = g = e 1 τ u i P l o s s 1 d t
d lng d t = d ln R 1 d t = d ln R d t = 1 τ u i P l o s s 1 ln R = 1 τ 1 u i P l o s s d t R = e 1 τ 1 u i P l o s s d t
According to the mathematical description of the Mayr arc model in Equation (4), the DEE (differential equation editor) module was built in Simulink as shown in Equation (7):
d ln g d t = S τ e ln g u 2 P l o s s 1 = S τ u i P l o s s 1 y = i = e ln g u = g u
where x(1) is the state variable of the differential equation, that is, the natural logarithm of arc conductance ln(g), S is the switching signal (0 or 1), x(0) is the initial value of arc conductance (x(0) = ln(g(0)), u(1) is the arc voltage u corresponding to the first variable input of DEE module, and u(2) is the contact separation state quantity of the circuit breaker. Corresponding to the second variable input of the DEE module, u(3) is the natural logarithm of arc conductance ln(g) corresponding to the third variable input of the DEE module, y represents the arc current i corresponding to the output variable of the DEE module. τ and Ploss are defined in Equation (4).
The single-phase series arc model based on Mayr arc theory is shown in Figure 5. The DEE module of the Mayr arc model was built in Simulink according to Equation (7), as shown in Figure 6. Simulation waveform of arc voltage and arc current were obtained after 5 electrical cycles (0.1 s) (Figure 5 and Figure 6).
Figure 5. Arc model based on the Mayr arc theory.
Figure 6. The DEE module in the Mayr arc model.
The DEE module parameters in the Mayr arc model include time constant τ, dissipated power Ploss (W), arc conductance constant g0, and breaker contact–separation start time St0. In addition, the Mayr arc model itself includes load resistance R, AC voltage uac, and AC power frequency f. The parameters of the Mayr arc model are given in Table 1.
Table 1. Parameters of the Mayr arc model.
Based on the Mayr arc theoretical model, simulation experiments have found that arc dissipation power Ploss directly determines the amplitude of arc voltage. The arc time constant τ affects the shape of the arc voltage waveform. Arc current is mainly determined by load resistance, and a larger load is conducive to increasing arc current and maintaining arc duration, especially under the condition of low-voltage 220 Vac power supply. By setting the two groups of arc dissipation power (Table 1), it was found that when the arc dissipation power was very small (1 W), the arc voltage also became small, and the phenomenon of zero arc current almost disappeared, as shown in Figure 7. With the increase in the arc dissipation power, the arc gap energy increases, arc voltage increases significantly, and the arc current shows a relatively obvious phenomenon of zero rest, as shown in Figure 8.
Figure 7. Arc voltage and current in the Mayr model (Case 1).
Figure 8. Arc voltage and current in the Mayr model (Case 2).

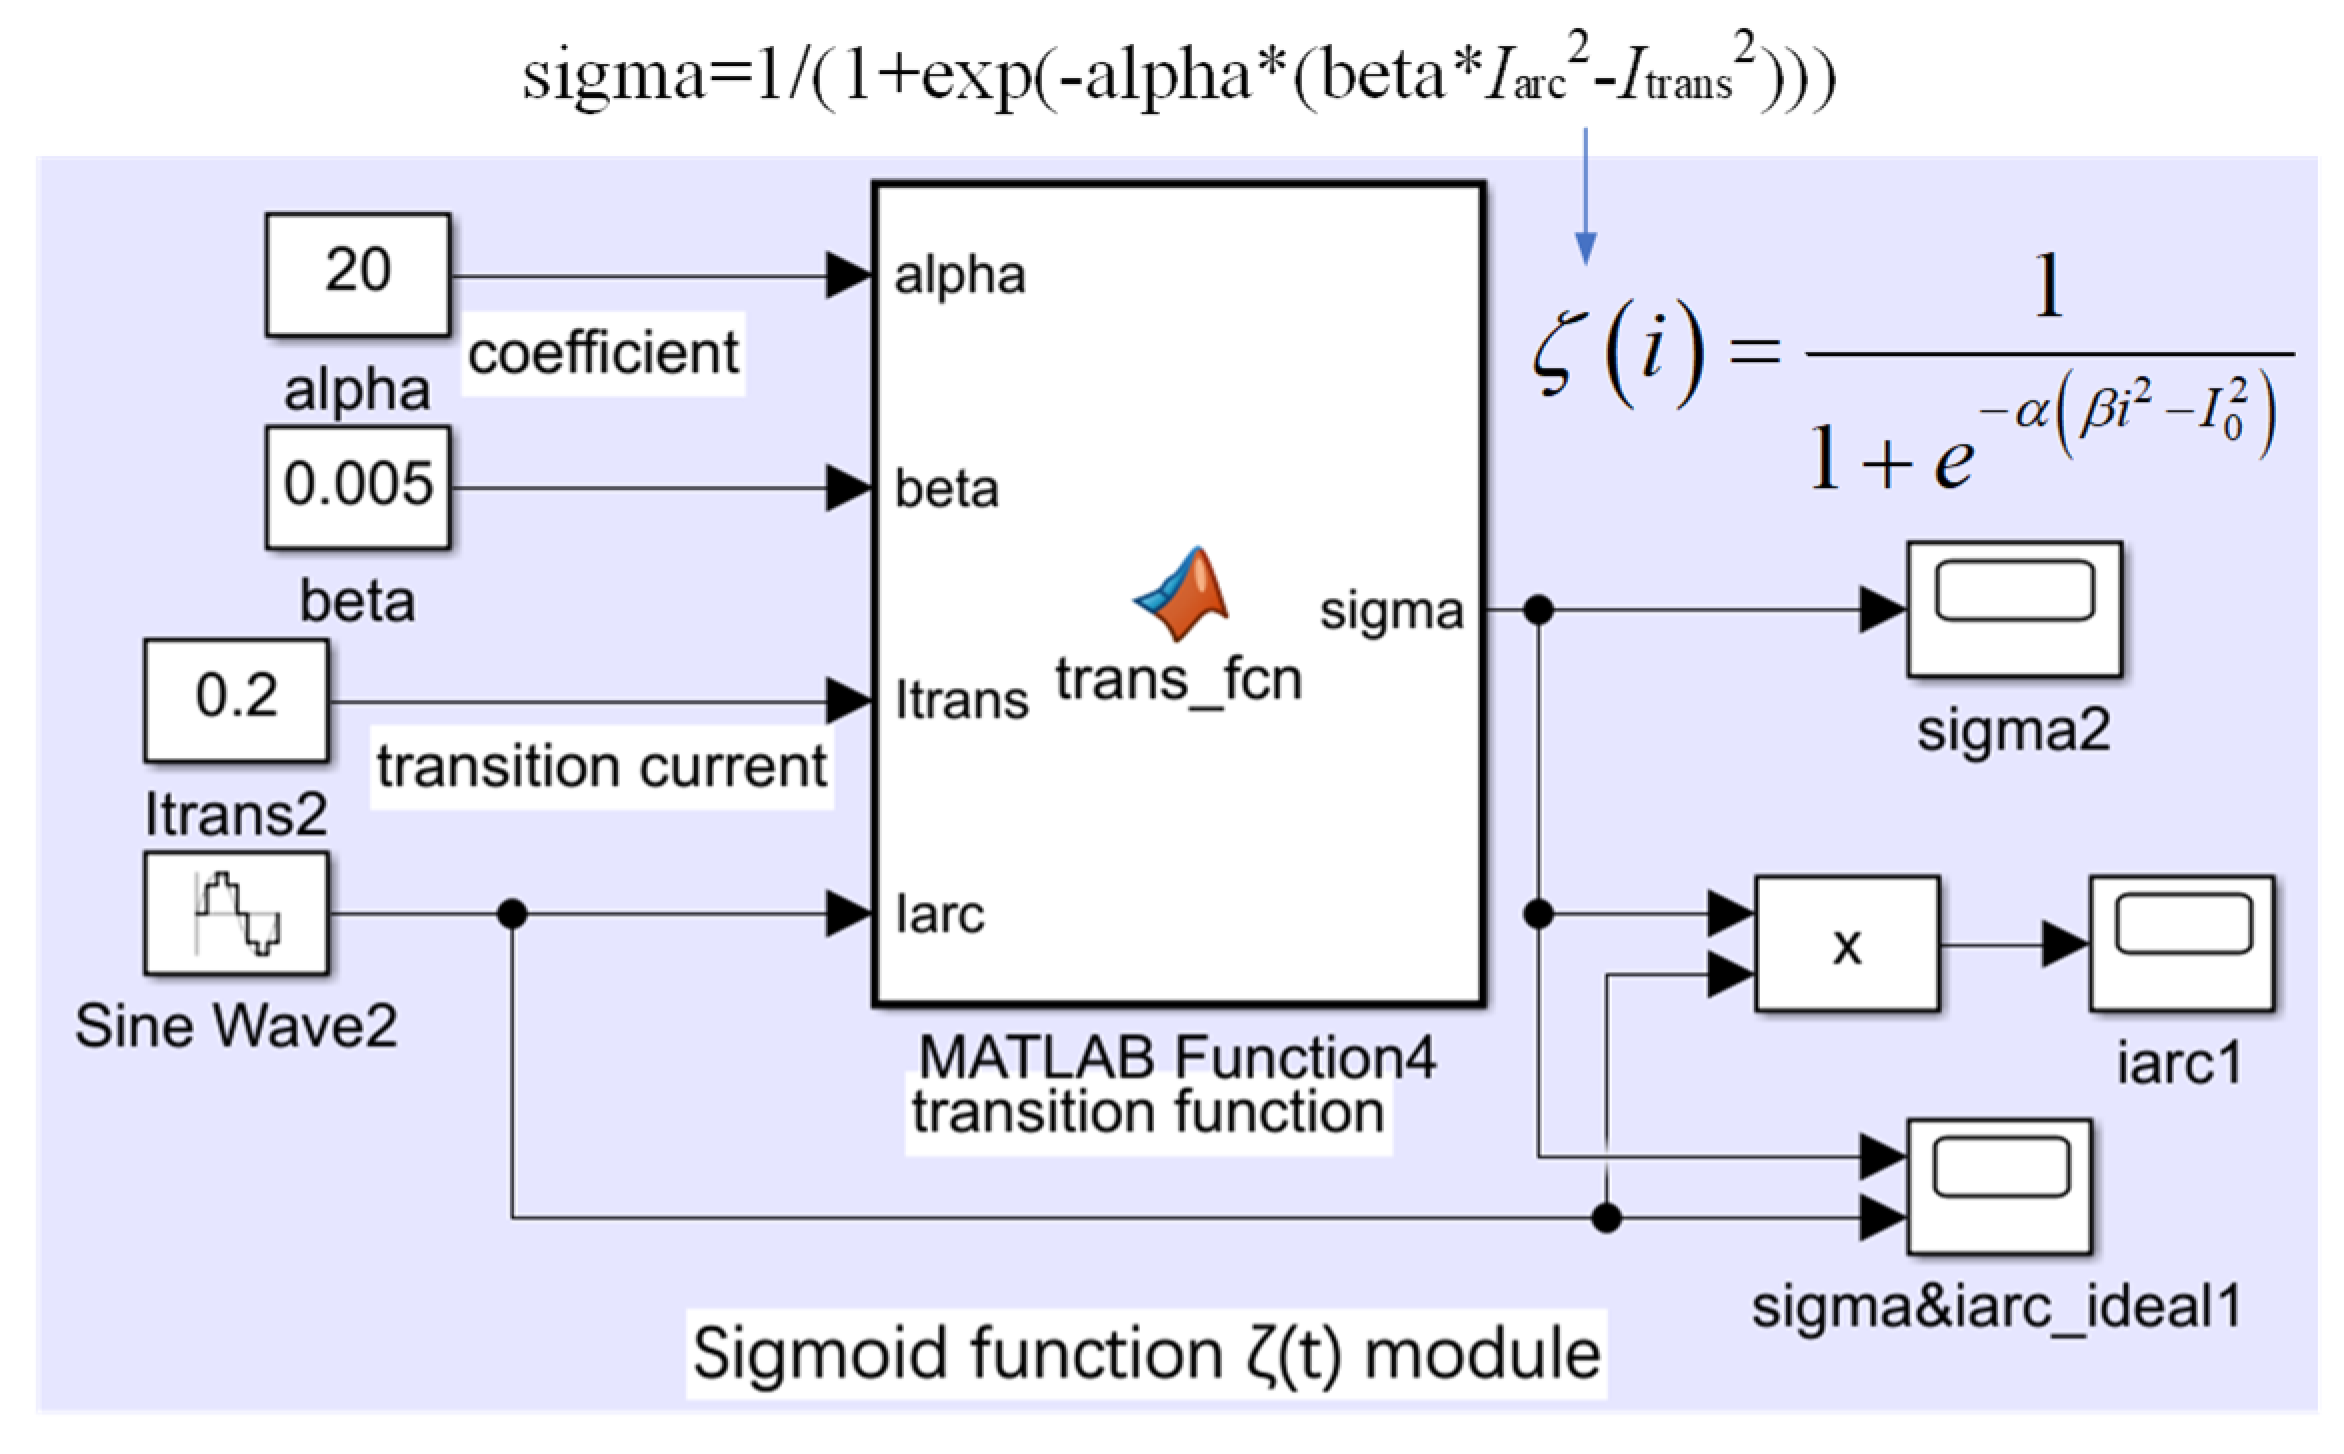
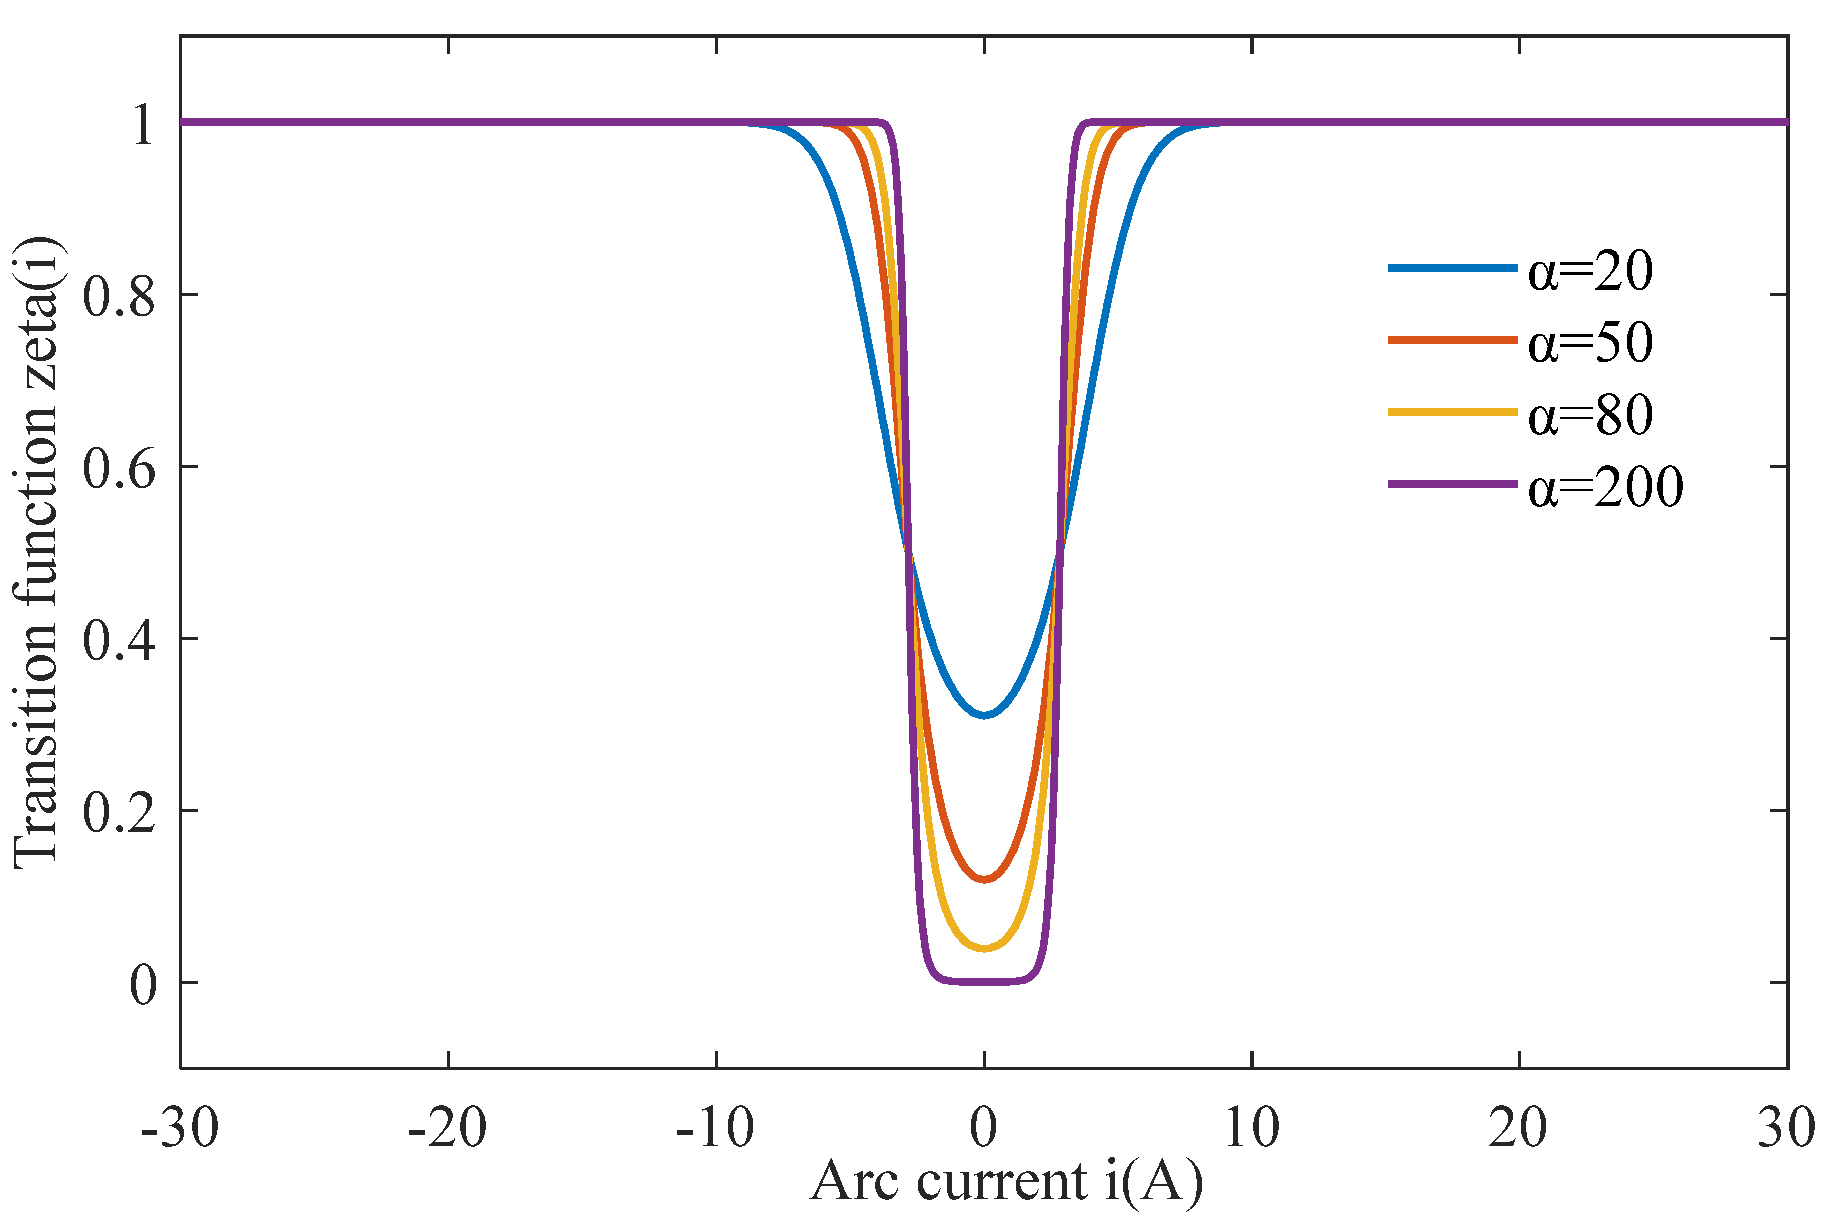
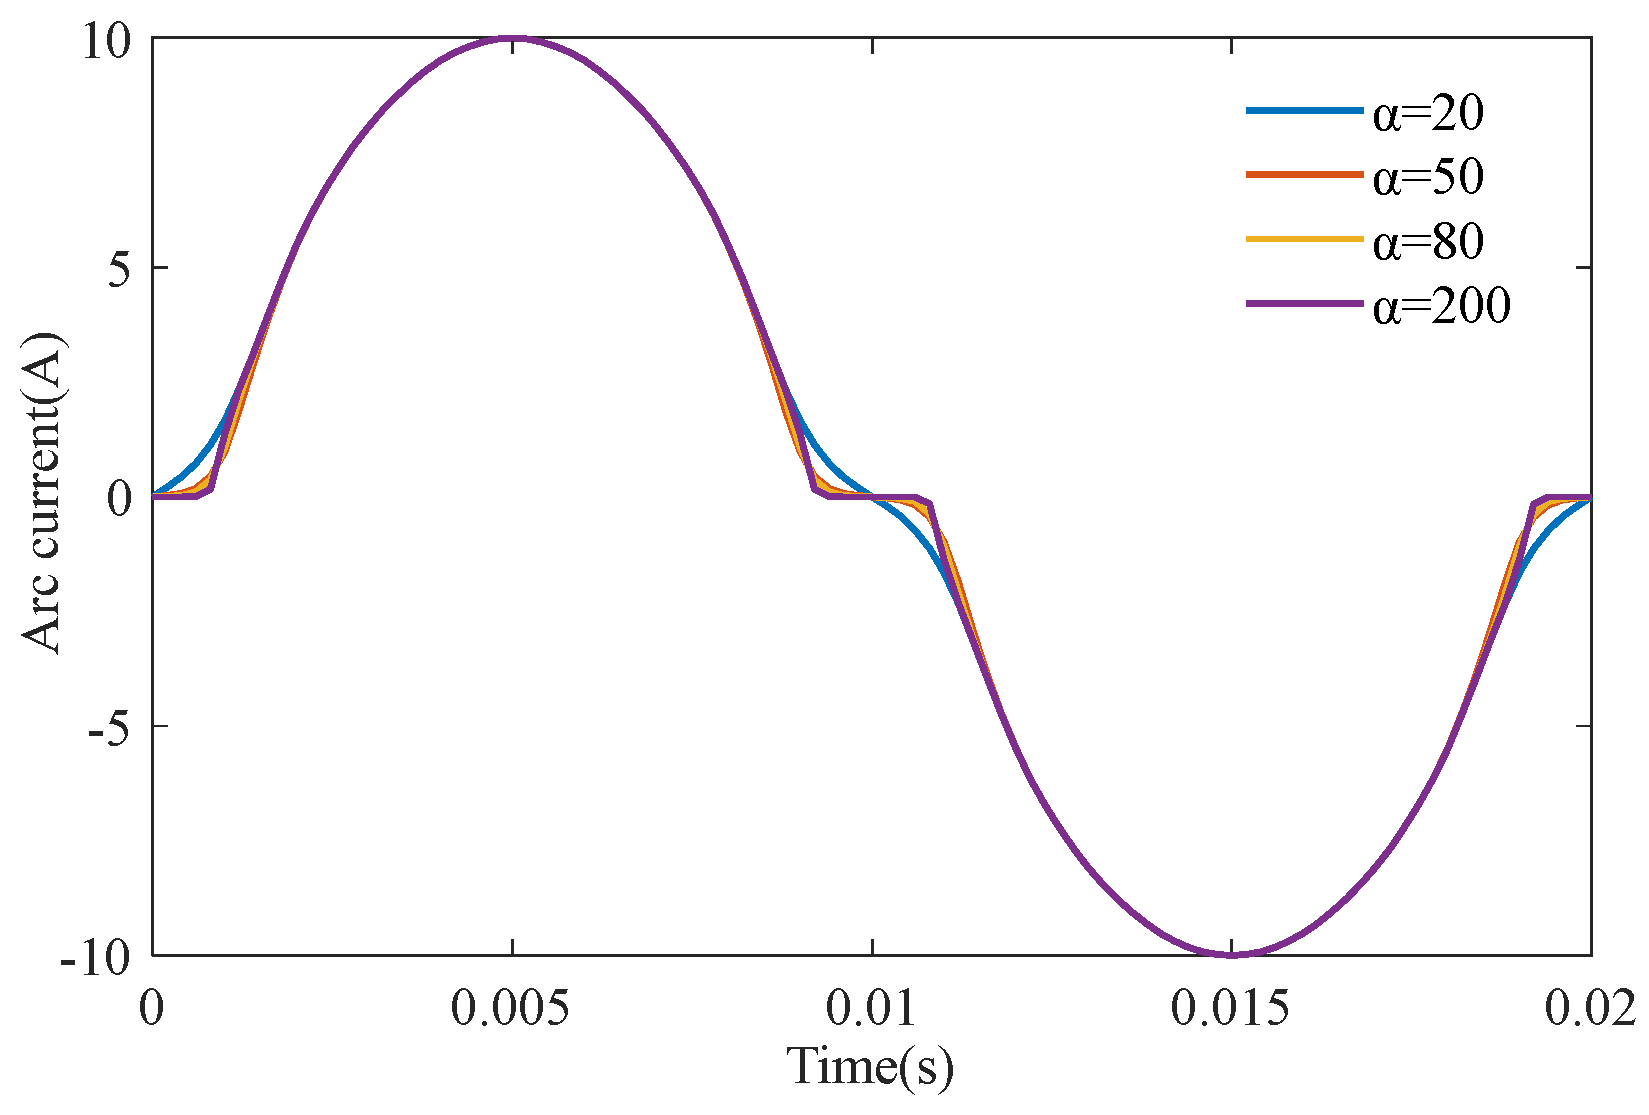
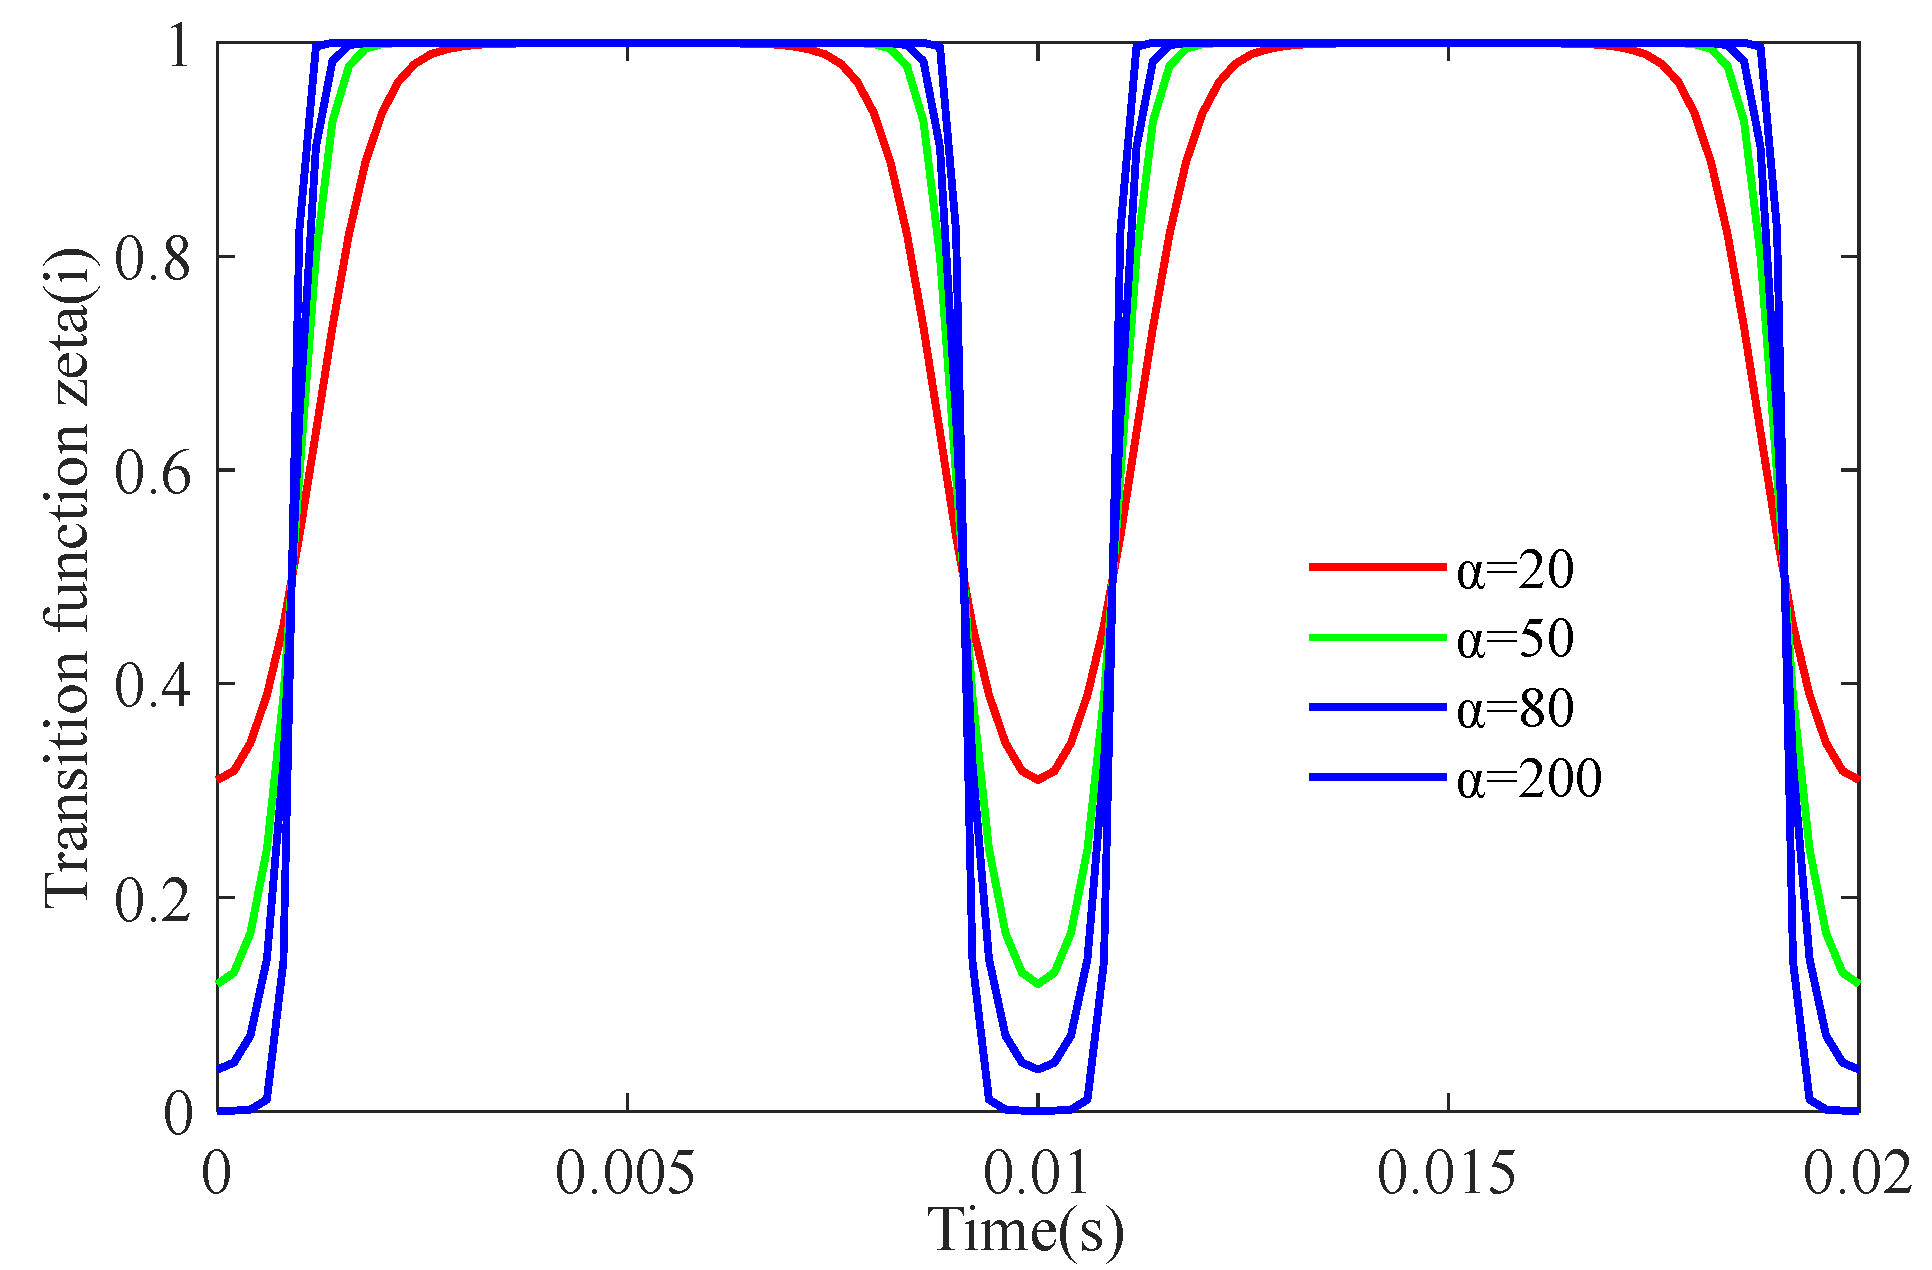
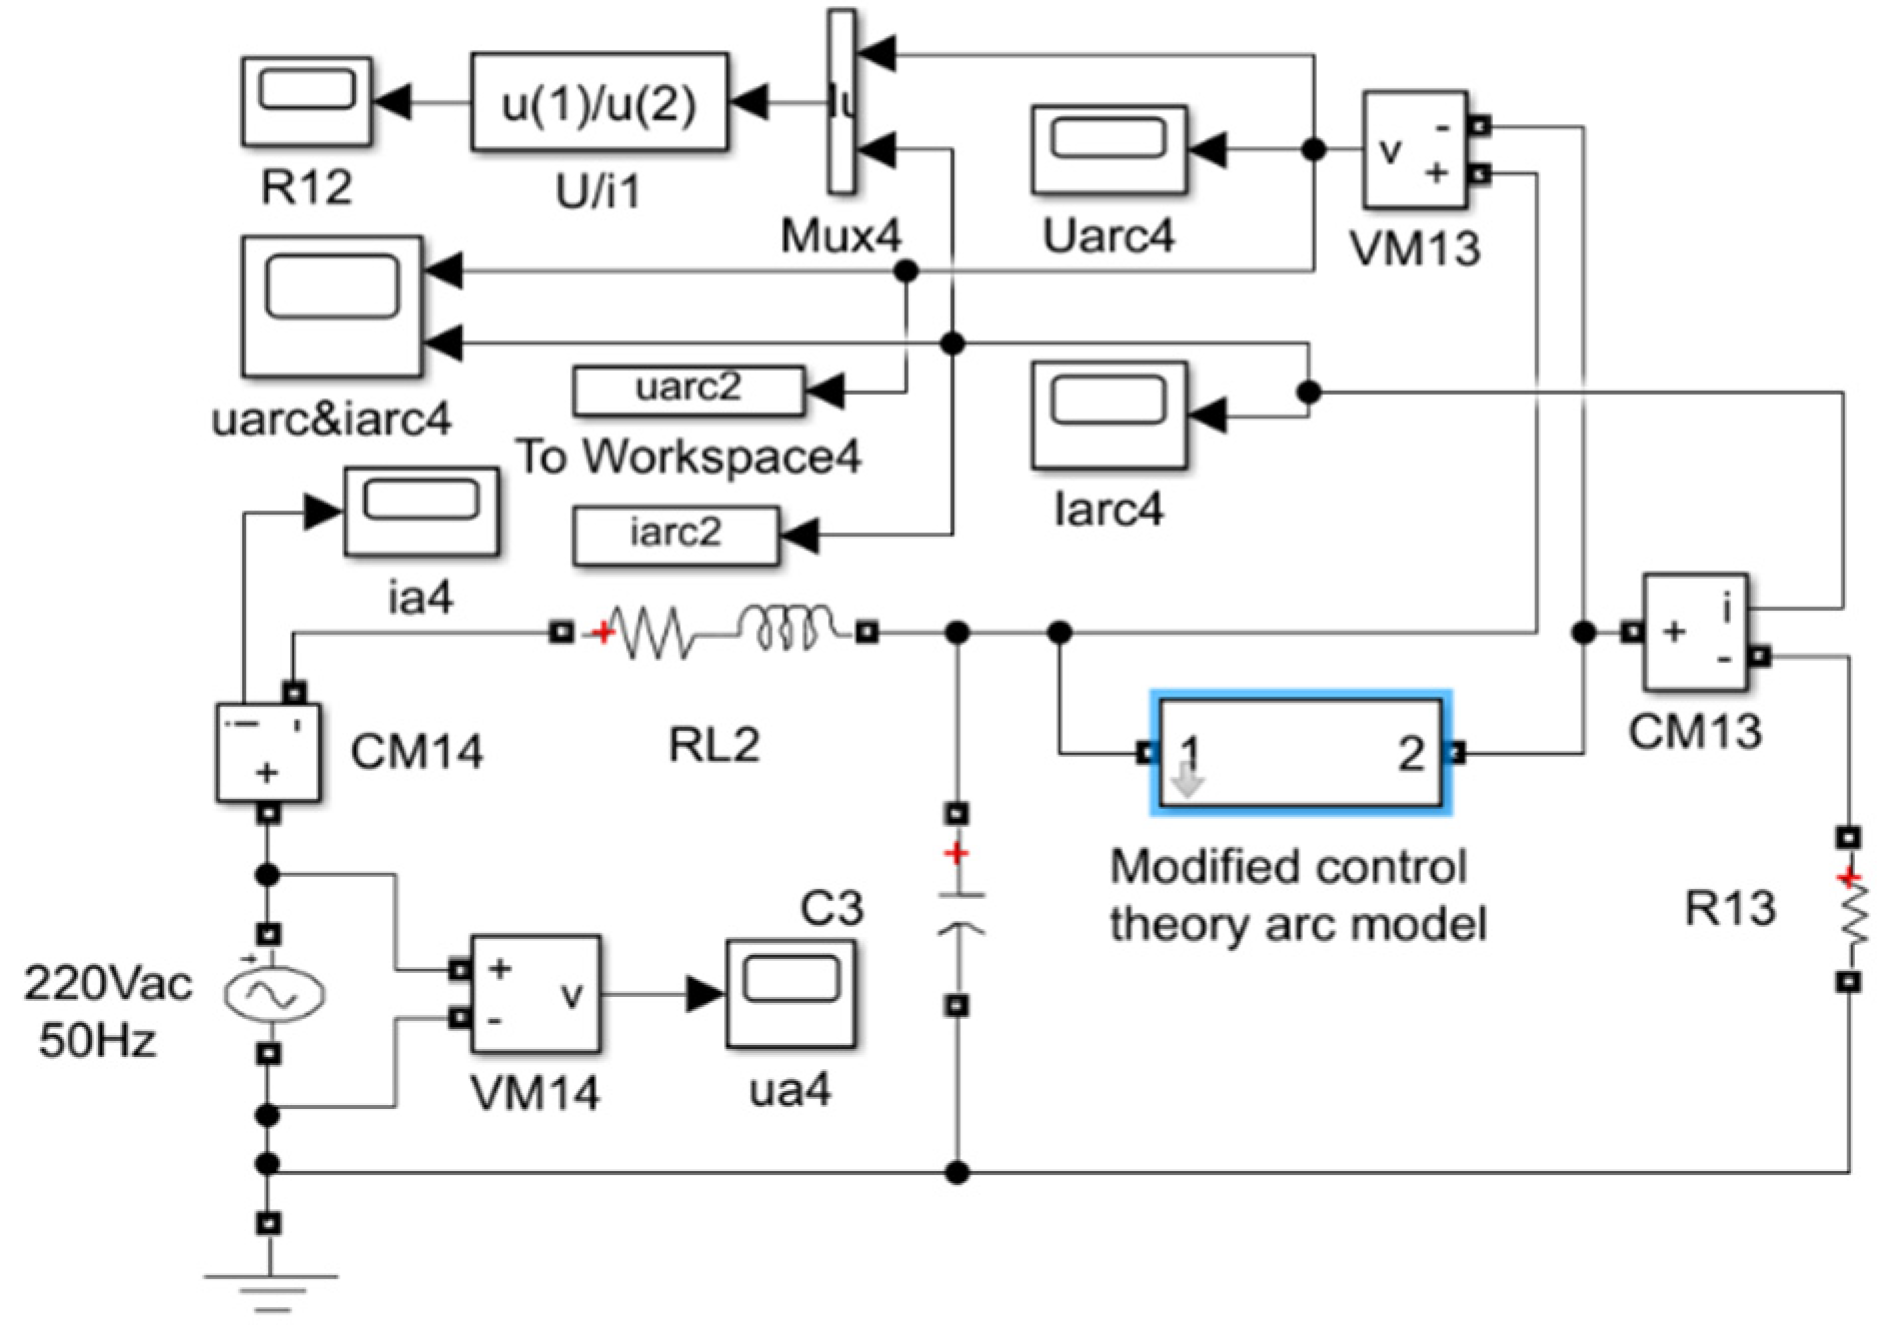
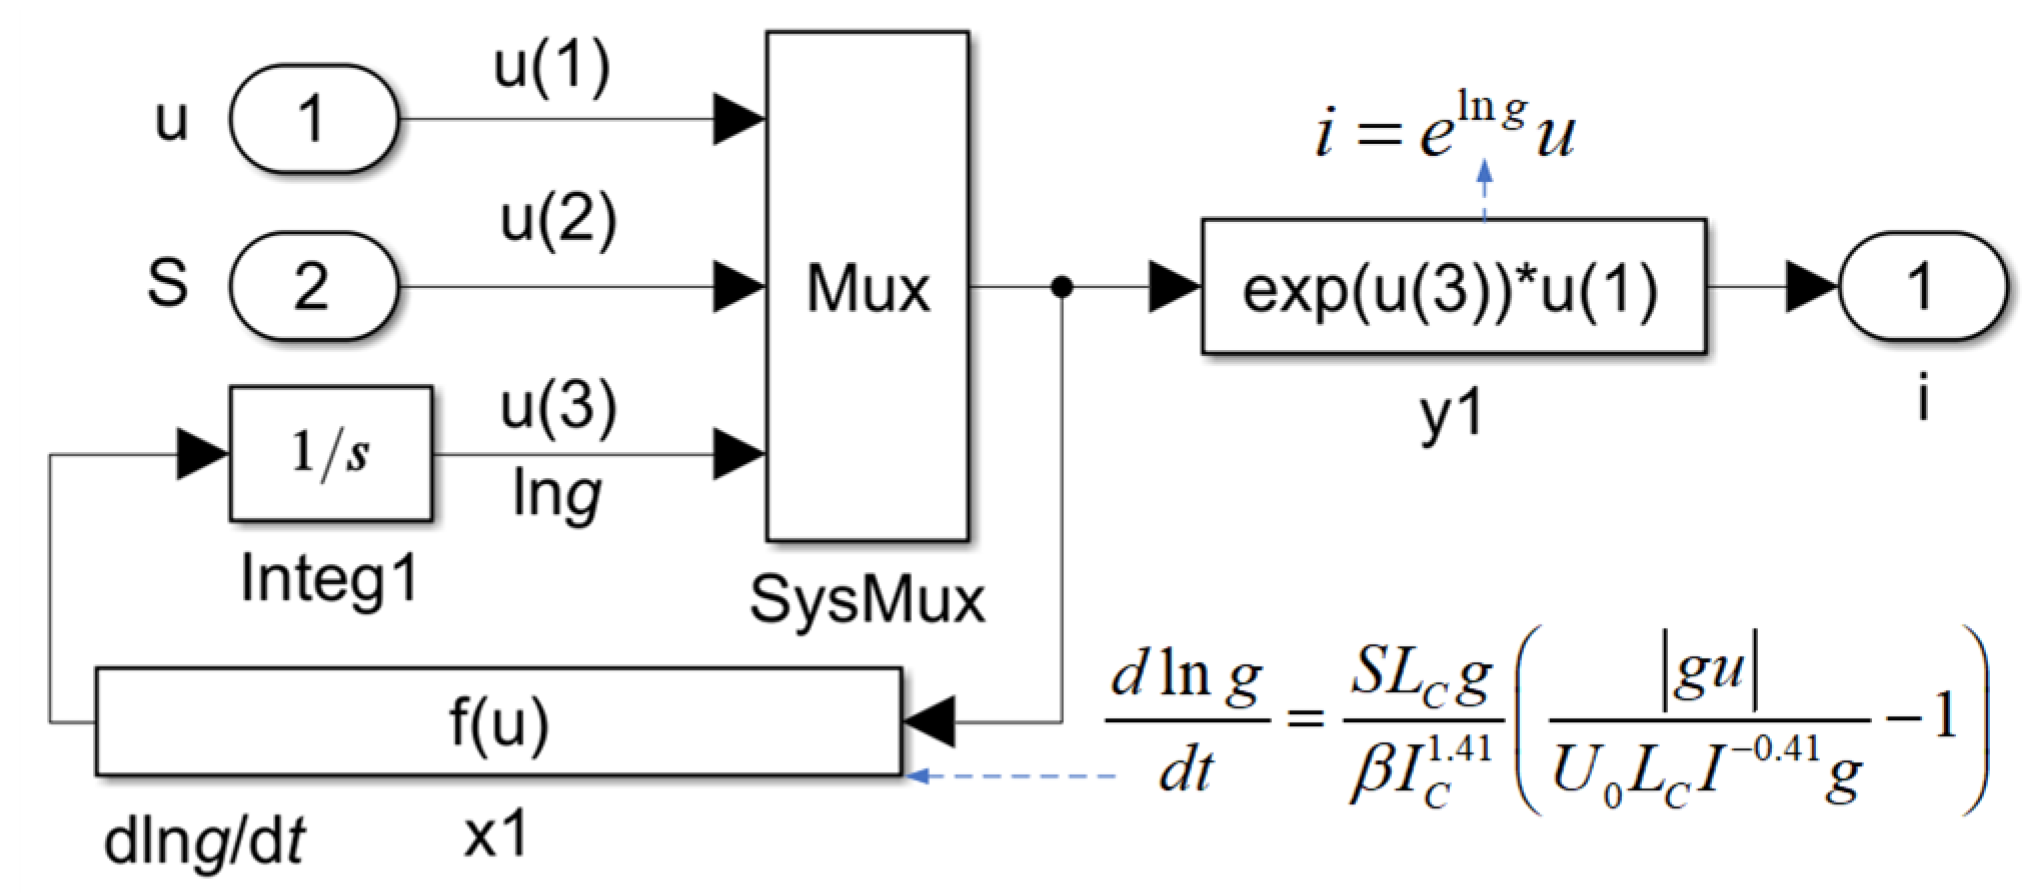
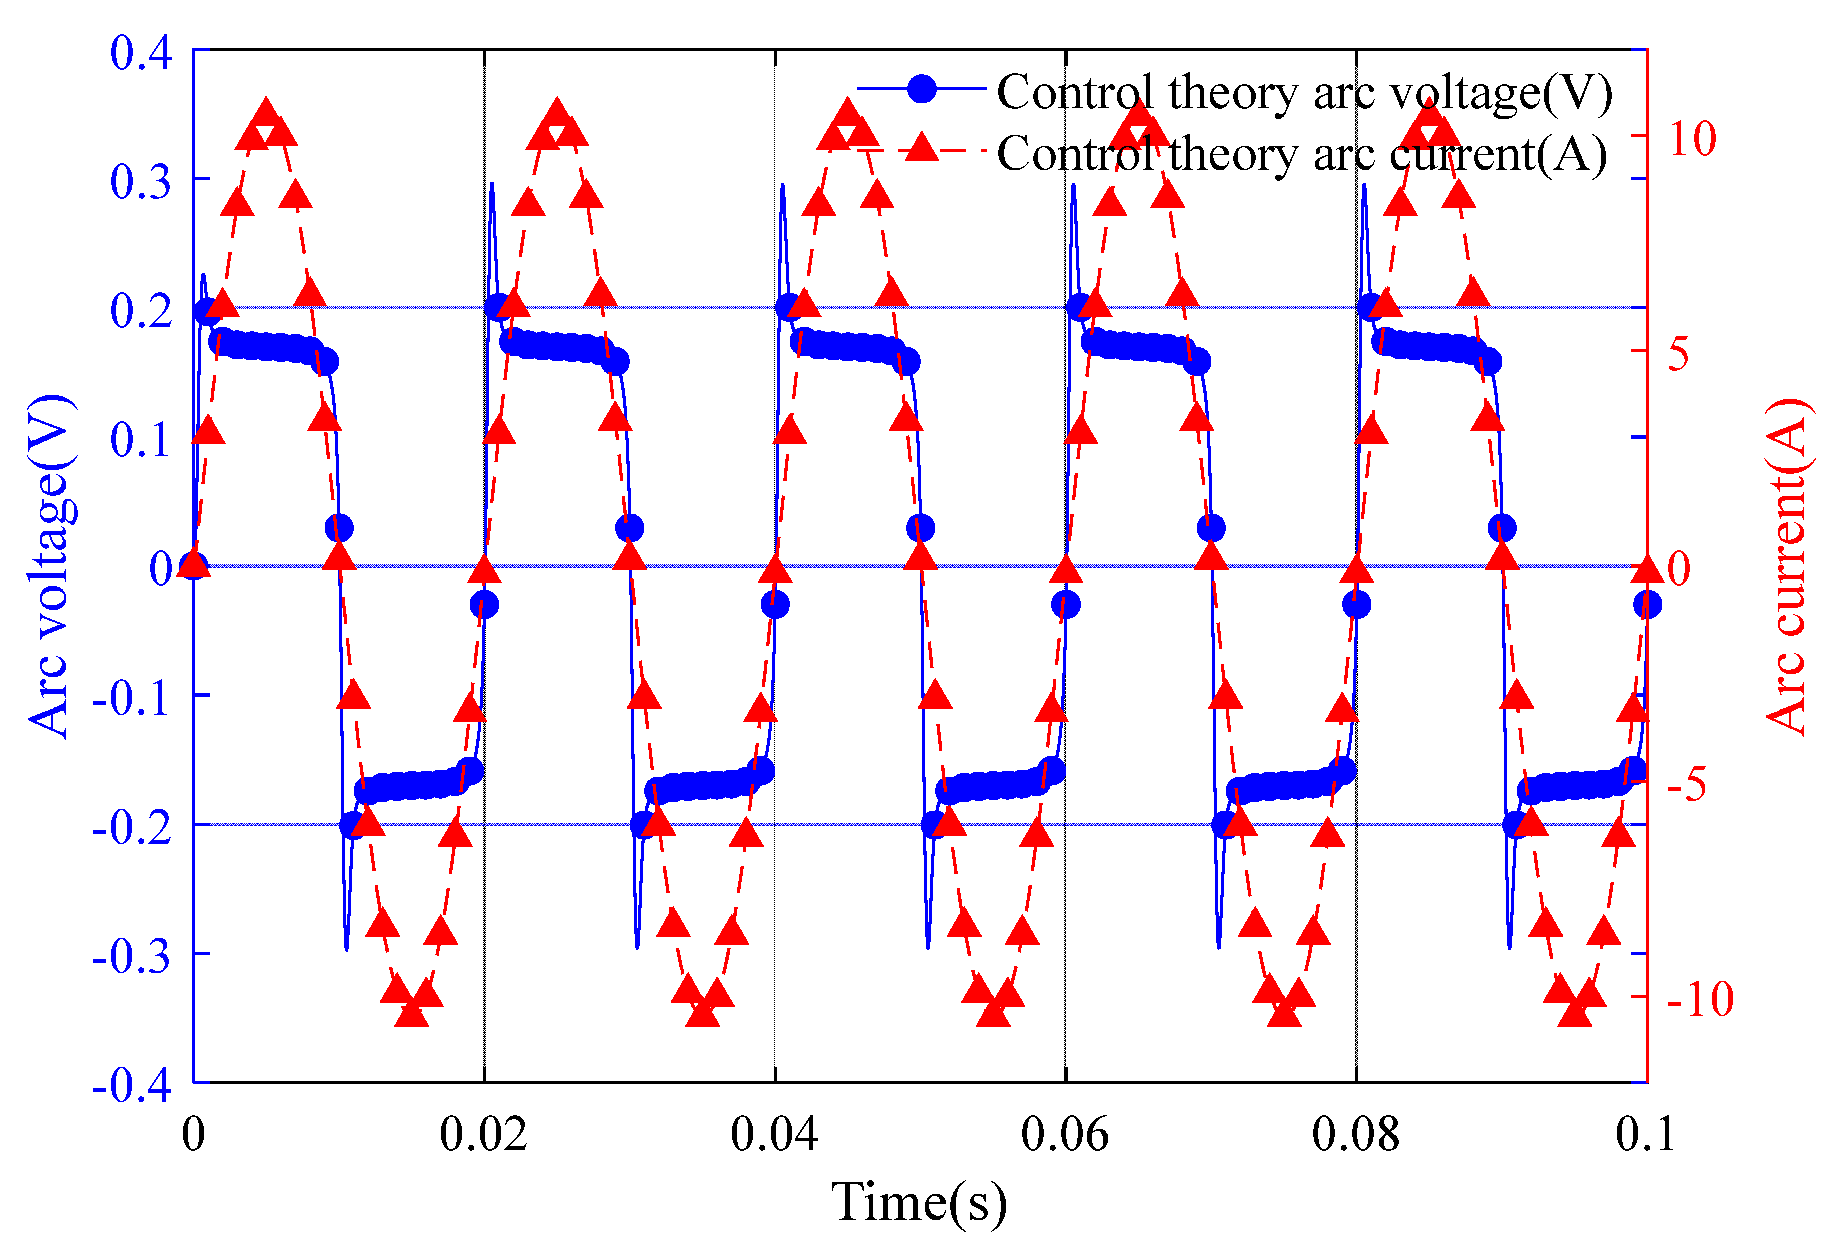
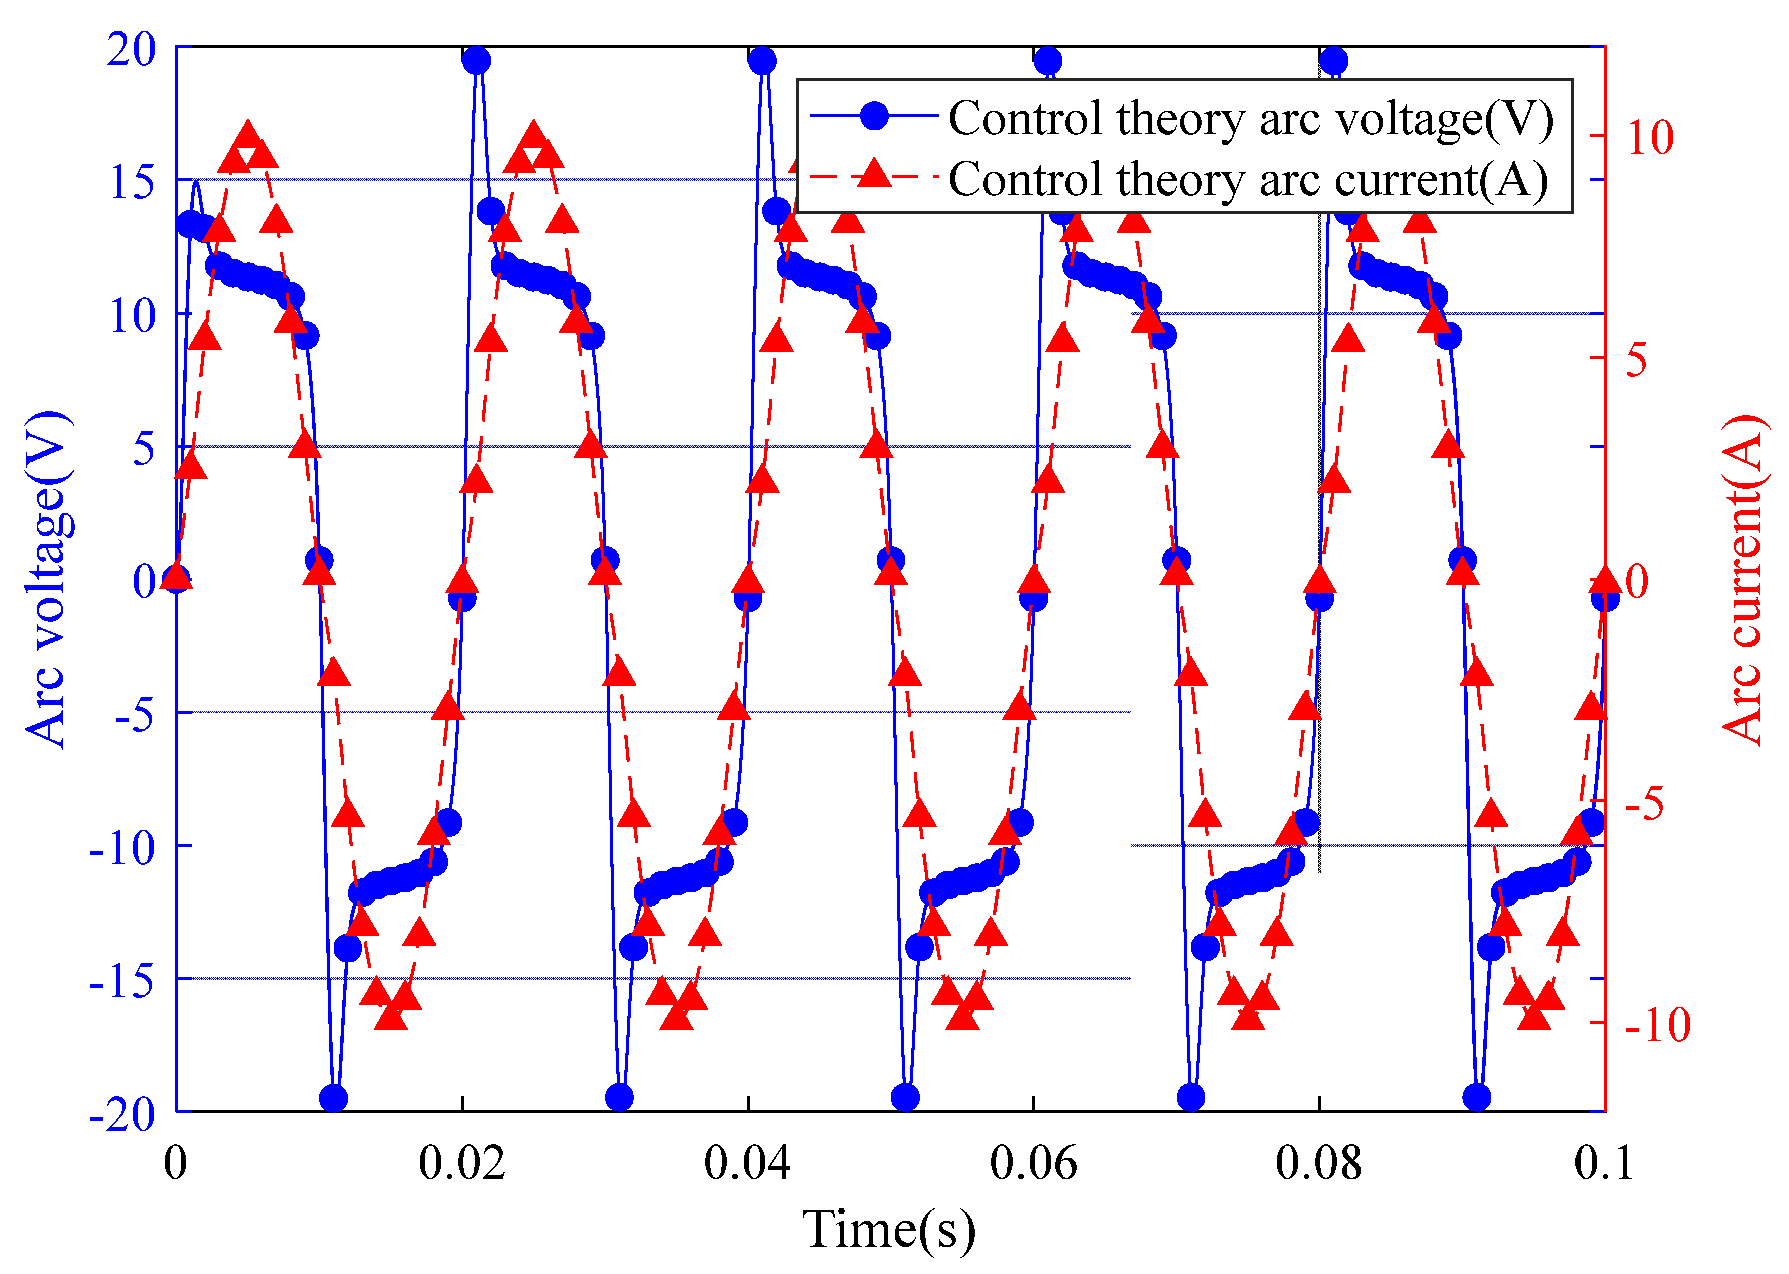
2.2. Improved Control Theory Arc Model

In the case of low current series arc or ground fault, the improved control theory arc model can more accurately describe the variation of arc voltage and arc current, and the arc length can be set to reflect the real arc stretching phenomenon. Based on classical control theory, an improved control theory arc model is proposed in [5,6].
dg d t = 1 τ C G C g
G C = i U C L C I C 0.4 ;   τ C = β I C 1.4 L C
Here, GC is the arc steady-state conductivity, τC is the arc time constant, UC is the arc column steady-state field intensity coefficient (voltage drop per unit length of arc gap (V/cm)), LC is arc length (cm), β is the coefficient (empirical value is β = 1 × 10⁻⁶~2.85 × 10⁻⁶), IC is the peak arc current, and i is the transient current.
Based on the improved control theory model of Equations (8) and (9), the derivation of the differential equation module DEE is as follows:
d ln g d t = S L C g β I C 1.41 g u U 0 L C I 0.41 g 1 = S L C β I C 1.41 i U 0 L C I 0.41 g i = g u
Figure 9 and Figure 10, respectively, show the series arc model of improved control theory built on the Simulink platform and the corresponding DEE module.
Figure 9. Series arc model based on the improved control theory.
Figure 10. The DEE module in the improved control theory arc model.
Parameters of the improved control theory arc model are shown in Table 2.
Table 2. Improved control theory arc model parameters.
The simulation waveform of arc voltage and arc current under two working conditions, respectively, are given in Figure 11 and Figure 12. Referring to the ideas in Section 2.1, based on the improved control theory arc theoretical model, the arc length and voltage drop per unit length can be set in this theoretical model, which more directly corresponds to the actual distance between the two electrodes in the experiment. The conclusions obtained from the simulation data were basically consistent with those obtained in Section 2.1 based on the Mayr arc theory.
Figure 11. Based on the arc voltage and current in the modified control theory model (Case 1).
Figure 12. Based on the arc voltage and current in the modified control theory model (Case 2).

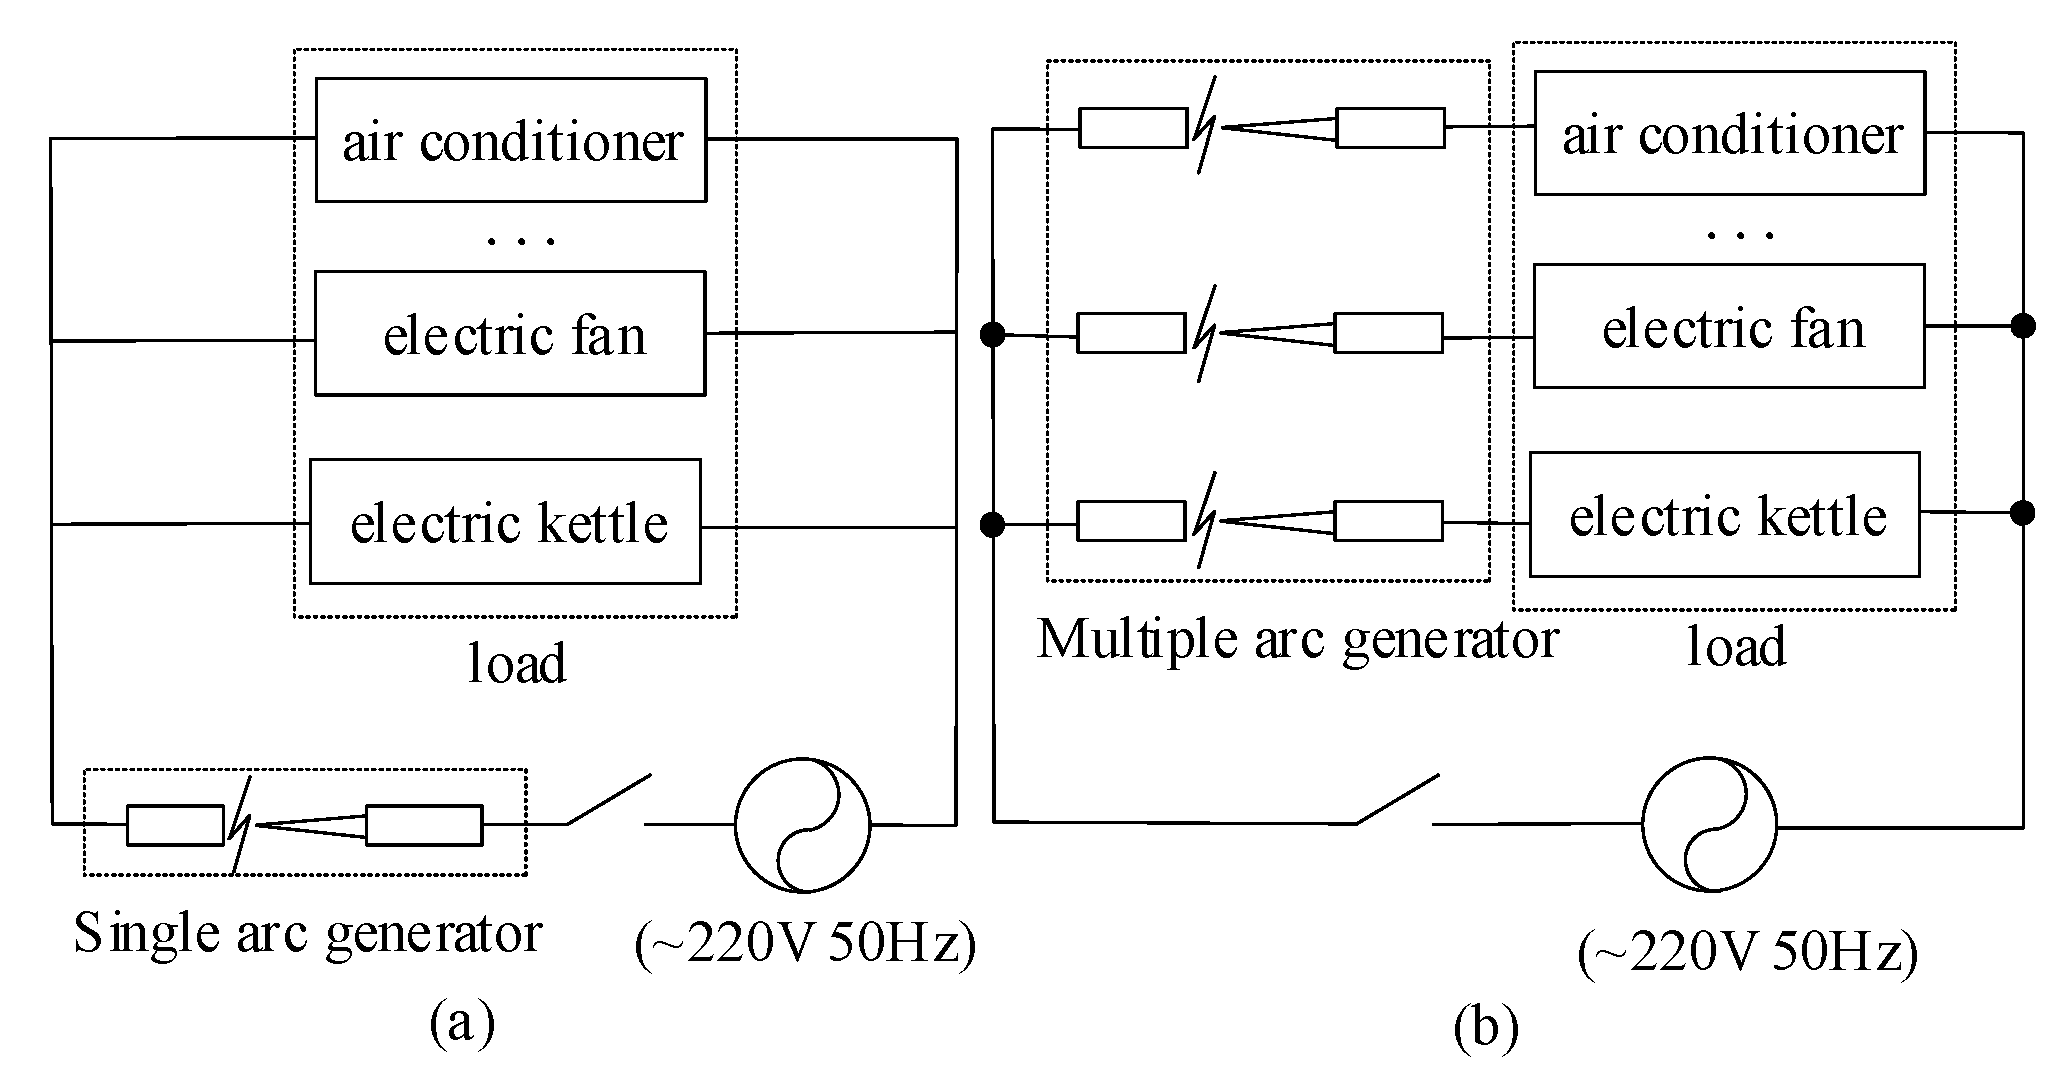
3. Single Arc Pulling System Experiment

The arc may occur in the main loop (Figure 13a) or in one or more parallel branches (Figure 13b). This paper mainly discusses the single arc experiment.
Figure 13. The arc generating device is (a) single-channel and (b) multi-channel.

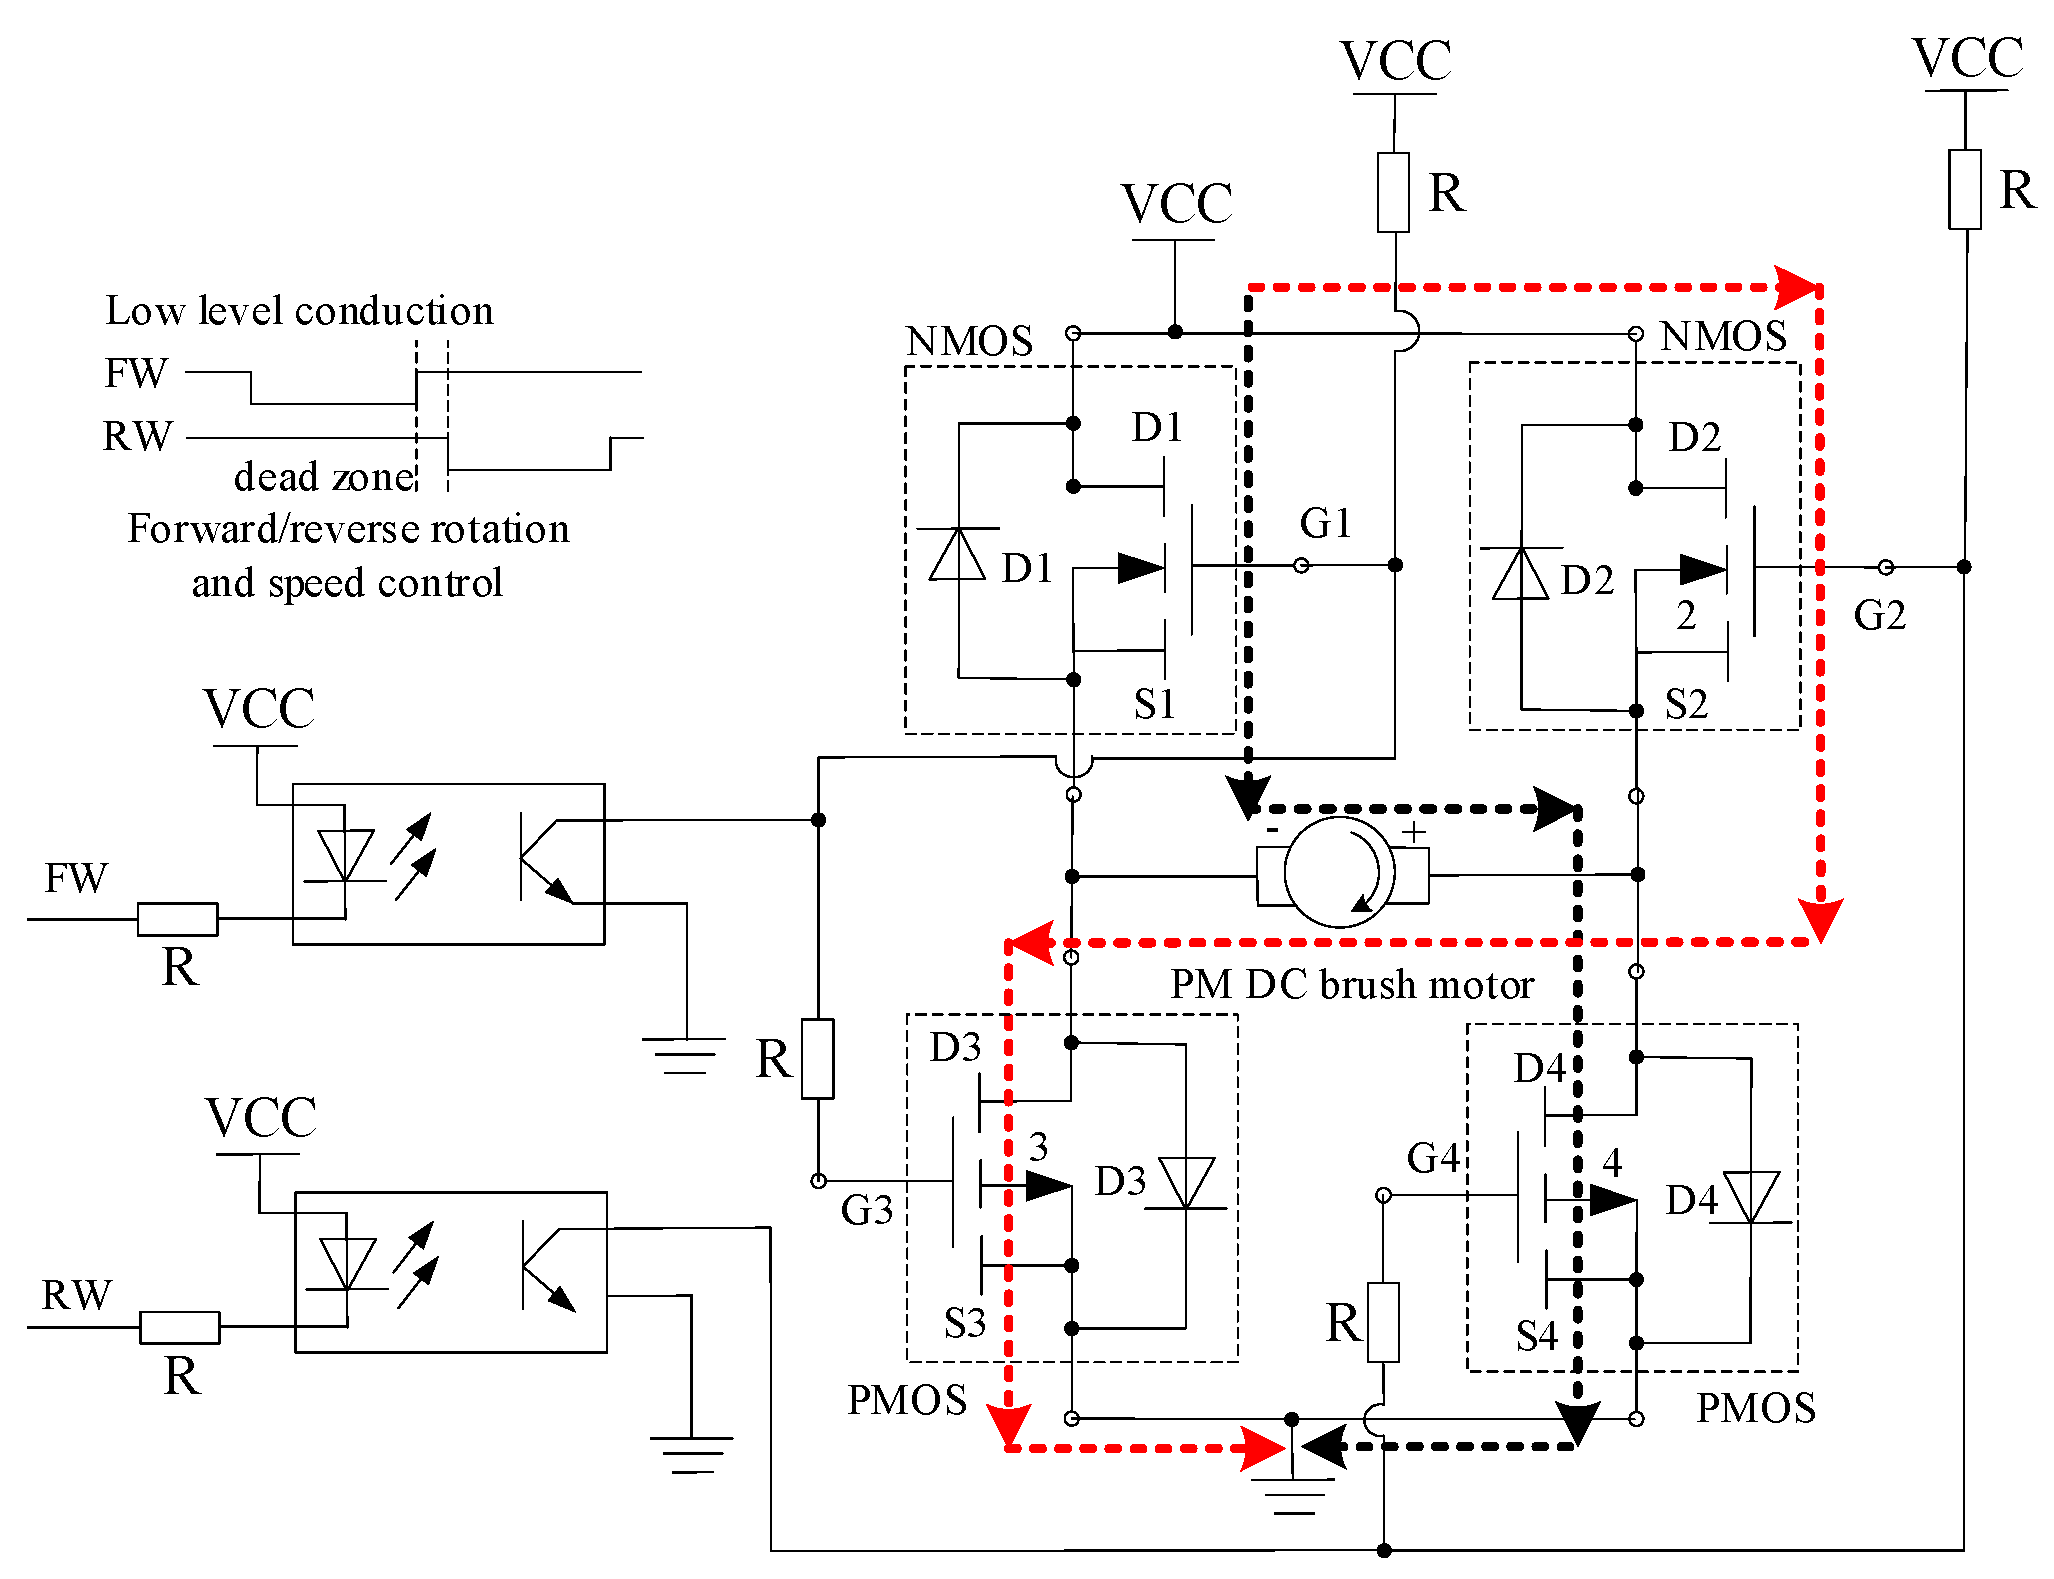
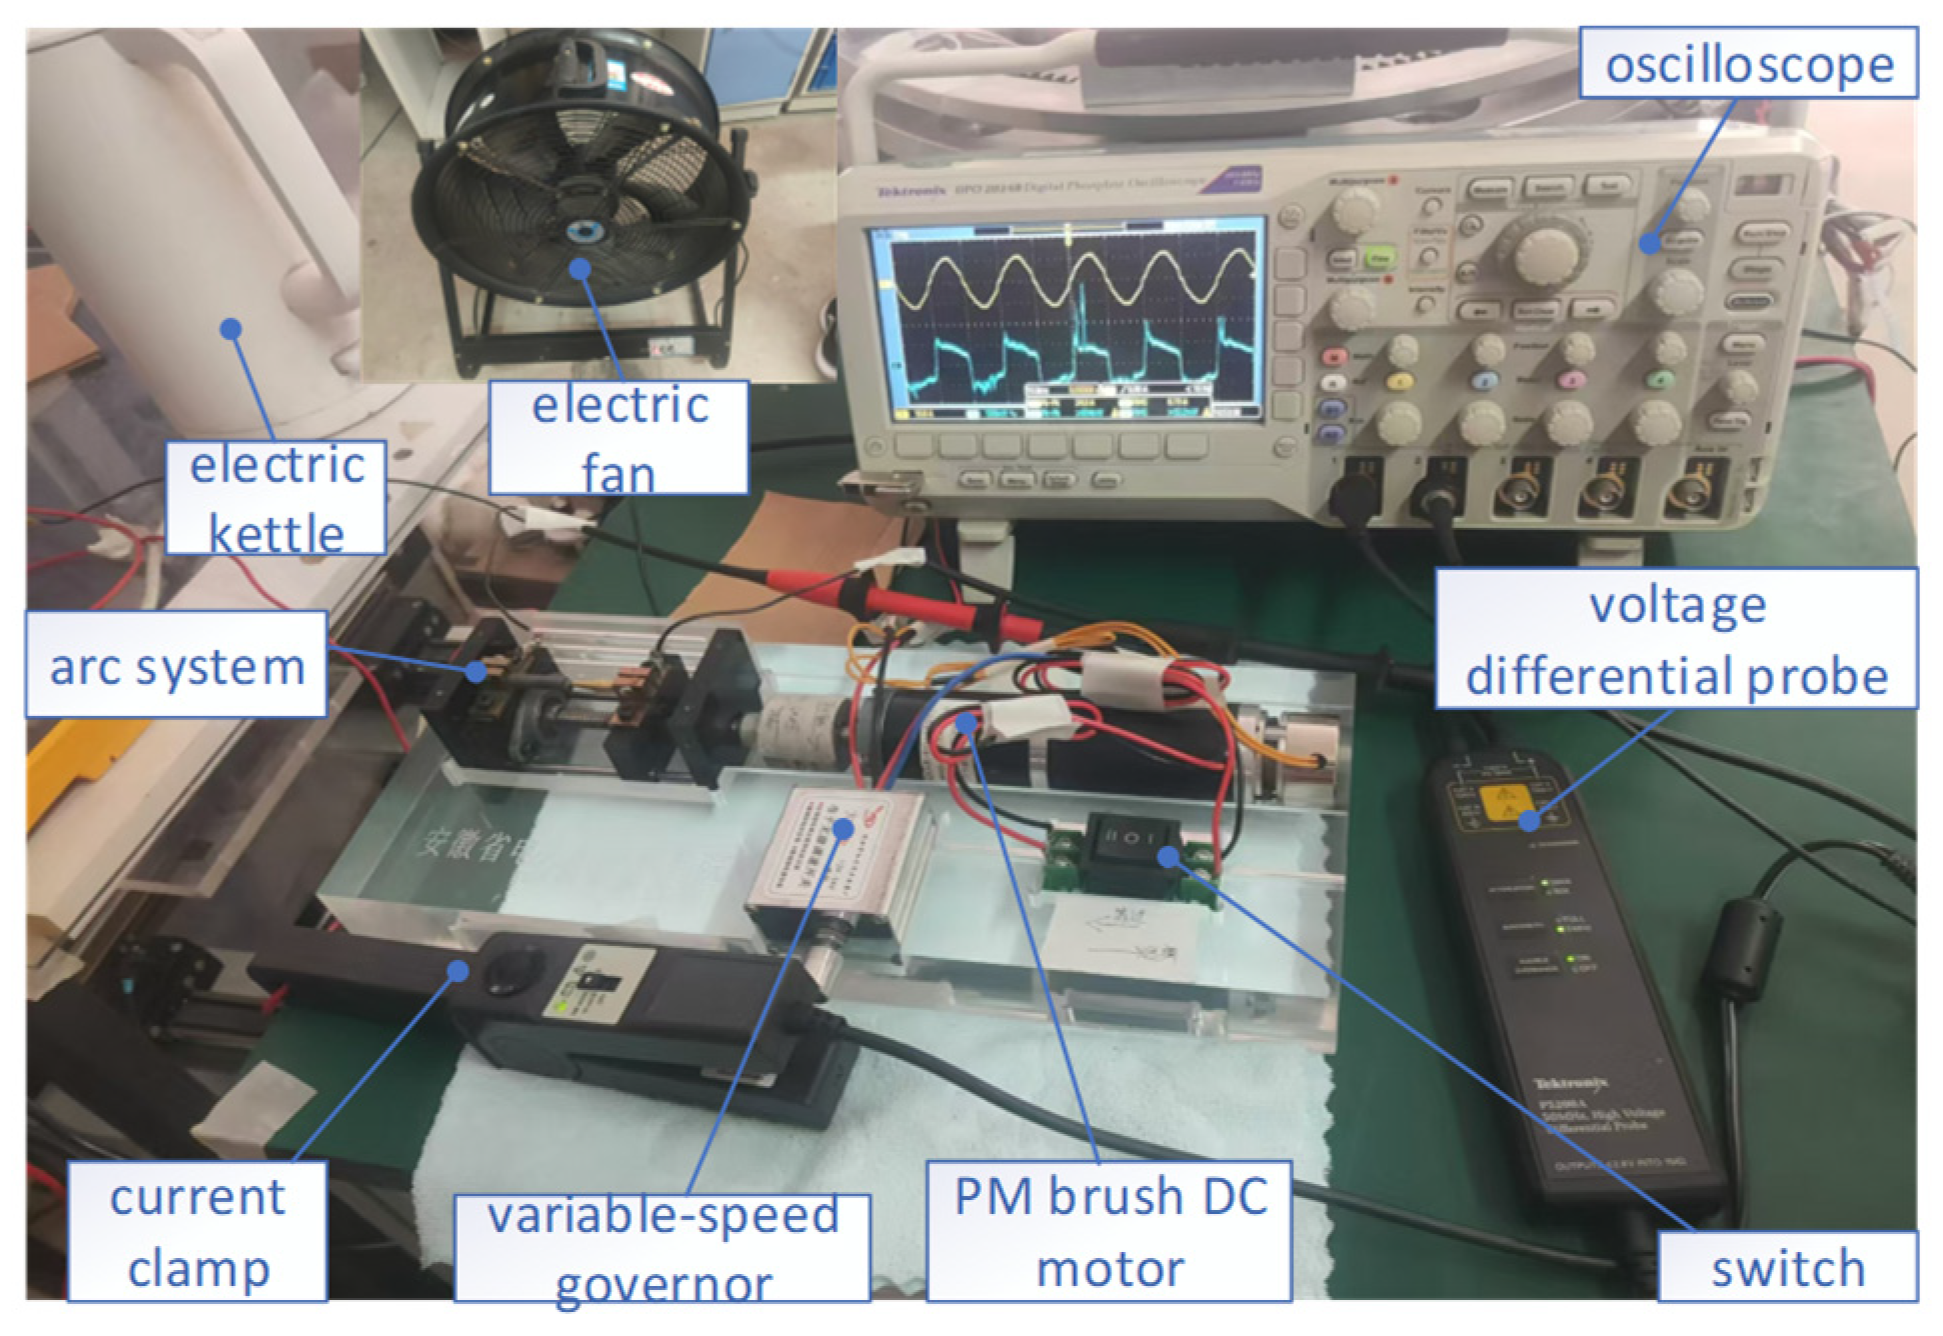
3.1. Working Principle and Platform Construction of Single Arc Pulling System

The single-channel arc pulling control system is composed of an arc generating device, a permanent magnet DC brush motor and its controller, and a reducer, wherein the stepless governor and positive and negative switch, respectively, adjust the speed and steering of the permanent magnet DC brush motor. Figure 14 shows the working principal diagram of the motor speed regulation and positive/negative rotation control. The permanent magnet DC brush motor adopts a 24 V DC power supply. Each group of bridge arms is composed of four MOSFET, including NMOS and PMOS. The current flow direction is controlled by inputting PWM control signals of forward turning FW or reverse RW, and the speed of the motor is controlled by controlling PWM duty ratio of FW or reverse RW signal, as shown in Figure 14, the red and black lines are the two alternating diagonal MOSFET lines. The flowchart of the arc generation is given in Figure 15.
Figure 14. Working principal diagram of the permanent magnet DC brush motor control.
Figure 15. The flowchart of the arc generation simulation and experiment.
The experimental platform of the single-channel arc pulling control system is shown in Figure 16. The arc generating device of the system is composed of a static graphite electrode, a moving brass electrode, and a screw nut mechanism. Because the experimental device uses a low-voltage 220 Vac single-phase AC power supply, the moving electrode is separated from the stationary electrode by contact, and micro-distance (about 0.1 mm, thickness of an A4 paper) is required to start the arc. To solve the micro-distance control problem, a permanent magnet DC brush motor drive reducer (reducer ratio i = 2264) was designed, combined with a stepless governor. Thus, micron speed control is realized, and the control device is far away from the arc, reducing the risk of electric shock during operation. The current clamp is responsible for collecting arc current in the loop, the voltage differential probe collects arc voltage, and the collected data are displayed in the oscilloscope.
Figure 16. Single arc generation control system.

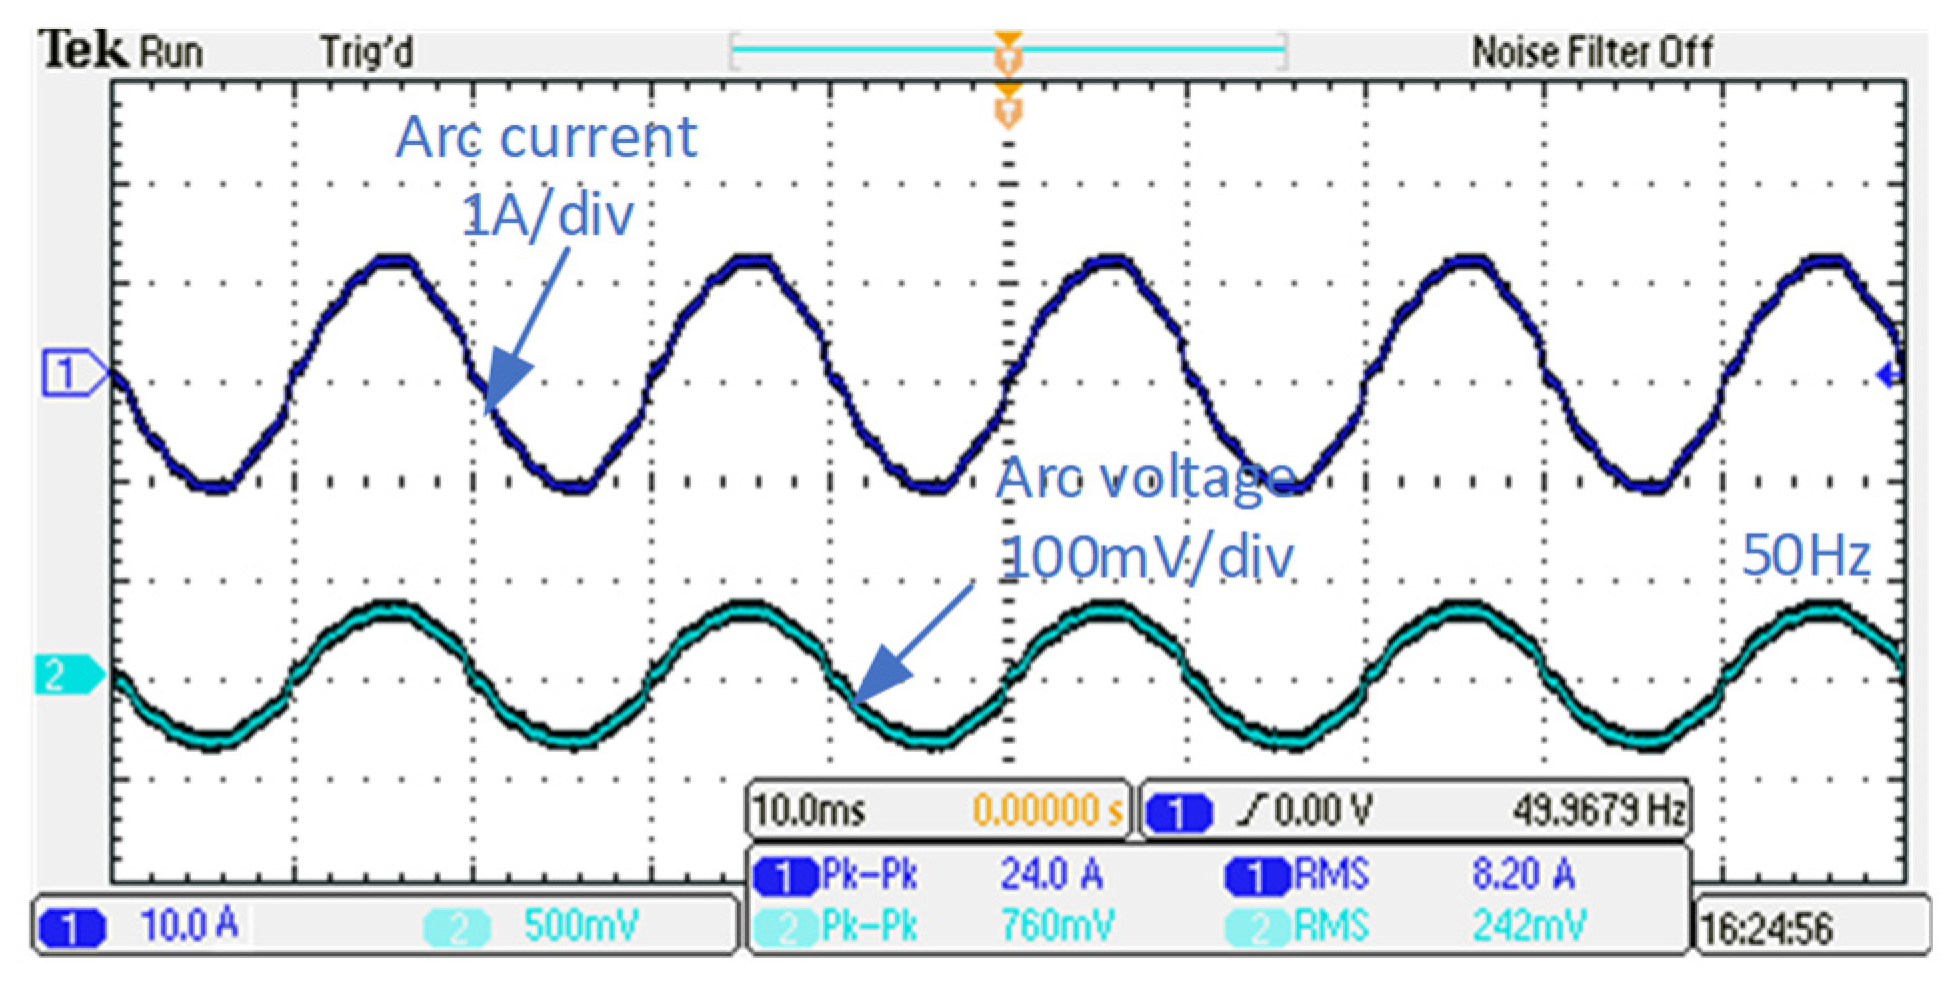
3.2. Pure Resistance Load Test

A hot kettle (1800 W-220 VAC, frequency 50 Hz) was selected as a pure resistance load to carry out the arc pulling experiment. By controlling the stepless speed control button and the forward and reverse switch, the load experiments and waveforms under normal contact condition (two electrodes in full contact) and fault separation condition (two electrodes in micro-distance separation) were carried out, respectively. The waveforms are shown in Figure 17 and Figure 18. The arc current (RMS) and arc voltage under normal contact conditions were 8.2 A and 0.24 V, respectively.
Figure 17. Experimental curve of arc current and voltage for pure resistance load test under the condition of two electrodes in contact (normal).
Figure 18. Experimental curve of arc current and voltage for pure resistance load test under the condition of separation of two electrodes (fault).
Under fault separation conditions, the arc current was 8.1 A and the arc voltage was 0.089 V. In Figure 18, the arc current in the fault condition has the phenomenon of “zero rest”, and the fault arc voltage has the obvious phenomenon of arc burning and quenching. Because the two electrodes in the micro-distance (0.05–0.1 mm) arc pull discharge, the voltage between the electrodes is very small; the arc current decline amplitude is greater than the arc resistance increased amplitude, resulting in a downward trend of arc voltage; the arc increased the resistance of the loop; and the arc current slightly decreased.

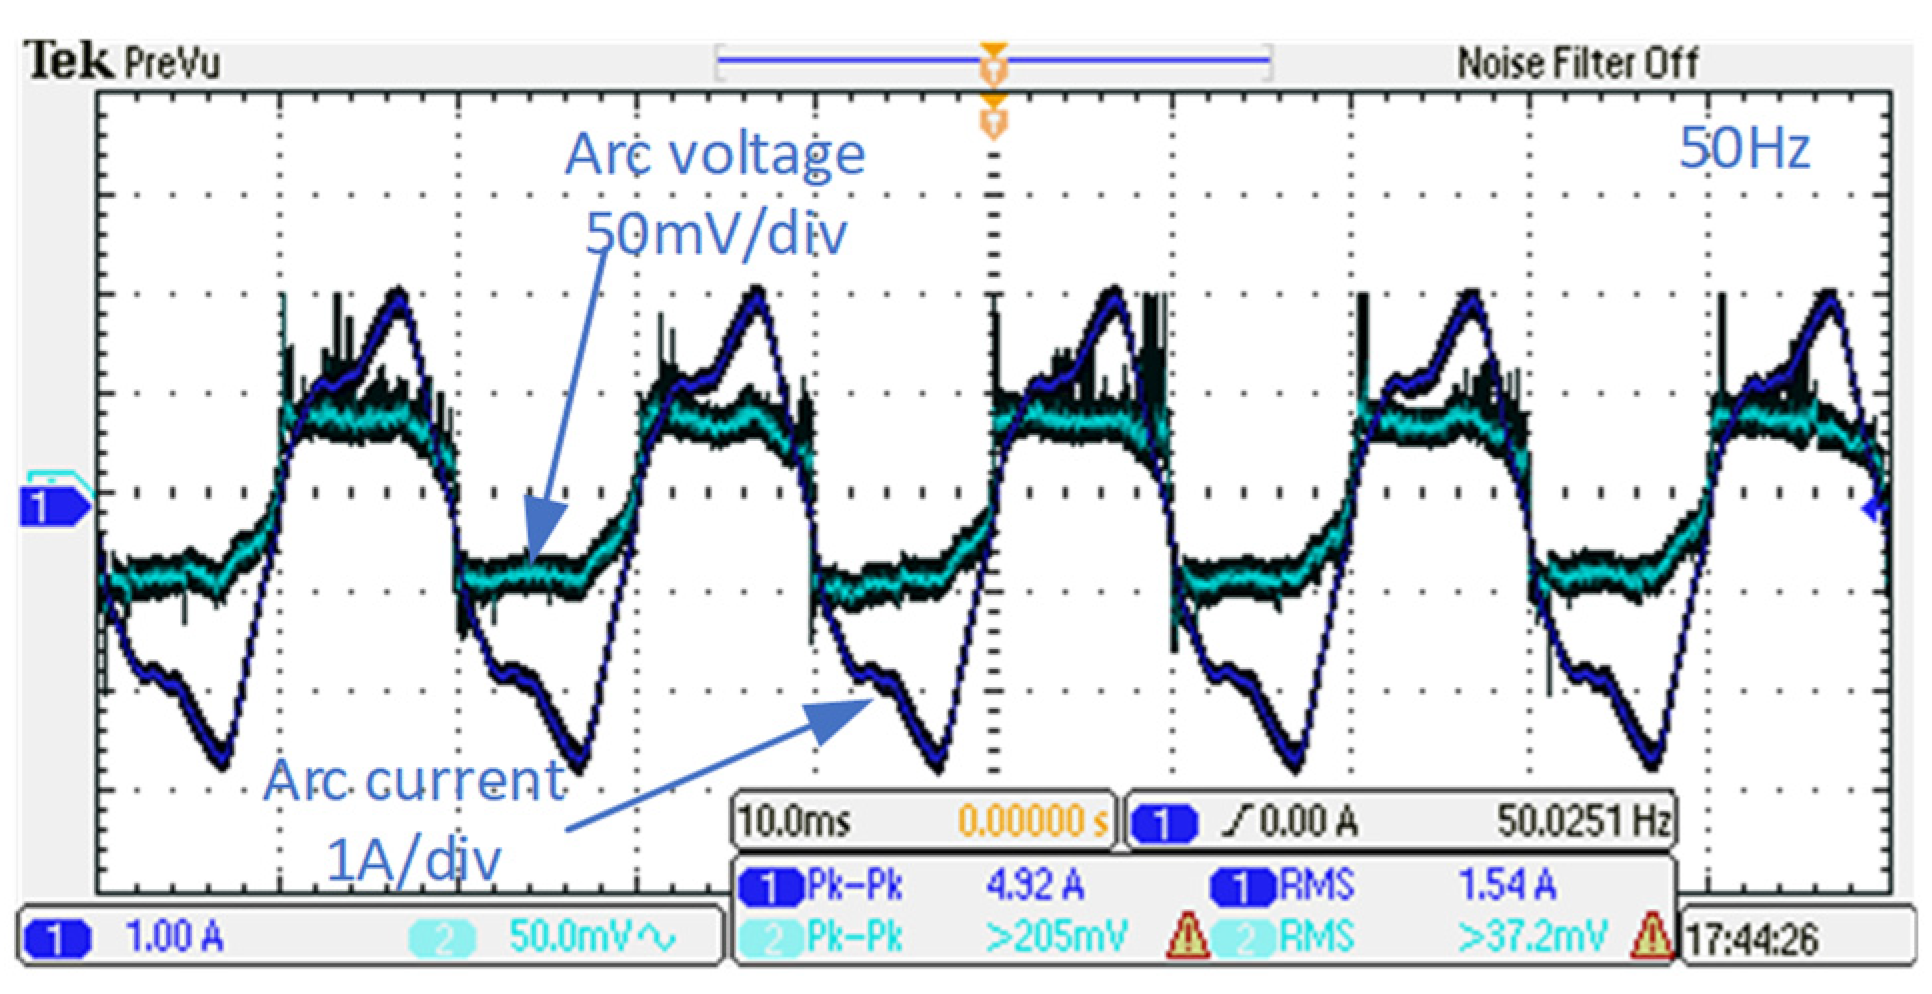
3.3. Resistive Load Test

Similarly to the pure resistance load experiment in Section 3.2, when an industrial fan (350 W-220 VAC) was selected as a pure resistance load, the arc current (RMS) under normal contact conditions (Figure 19) was 1.54 A, and the arc current and arc voltage under fault separation conditions (Figure 20) were 1.56 A and 0.04 V, with little change in arc current and voltage. In the fault separation conditions, the arc burning was not obvious and intermittent, and the line current was too small to support the continuous arc pulling. In addition, an arc current of 2.94 A at the starting stage of the industrial fan (Figure 21) was also collected. Compared with the fault separation state, the arc voltage only had a brief and obvious arc extinguishing phenomenon due to the short starting time.
Figure 19. Experimental curve of the arc current and voltage for resistive load test under the condition of two electrodes in contact (normal).
Figure 20. Experimental curve of the arc current and voltage for resistive load test under the condition of separation of two electrodes (fault).
Figure 21. Experimental curve of the arc current and voltage under starting state and separation of two electrodes (fault).

3.4. Multi-Branch Parallel Load Experiment

The arc pulling device was arranged in the main loop, and the double branch load formed in parallel by the hot kettle (power 1800 W) and the industrial fan (power 350 W) (topological reference Figure 13a). Due to the increase in the load, the arc current of the main circuit (Figure 22) reached 9.84 A under normal conditions and 9.74 A under fault separation conditions (Figure 23). The arc voltage produced the obvious phenomenon of arc burning and quenching, and its value reached 0.087 V. The important thing is that the increase in the line load made the line current increase, which caused the increase in the arc energy, resulting in a continuous arc.
Figure 22. Experimental curve of the arc current and voltage for multi-branch parallel load experiment under the condition of two electrodes in contact (normal).
Figure 23. Experimental curve of the arc current and voltage for multi-branch parallel load experiment under the condition of separation of two electrodes (fault).

4. Conclusions

For the low-voltage and low-current platform (220 VAC-10 A), this paper selected the Mayr arc theoretical model and improved control theory model as the theoretical basis, and conducted simulations and experiments, concluding as follows:
  • Arc dissipation power directly determines the arc voltage amplitude. The arc time constant affects the arc voltage waveform. Arc current is mainly determined by the load resistance.
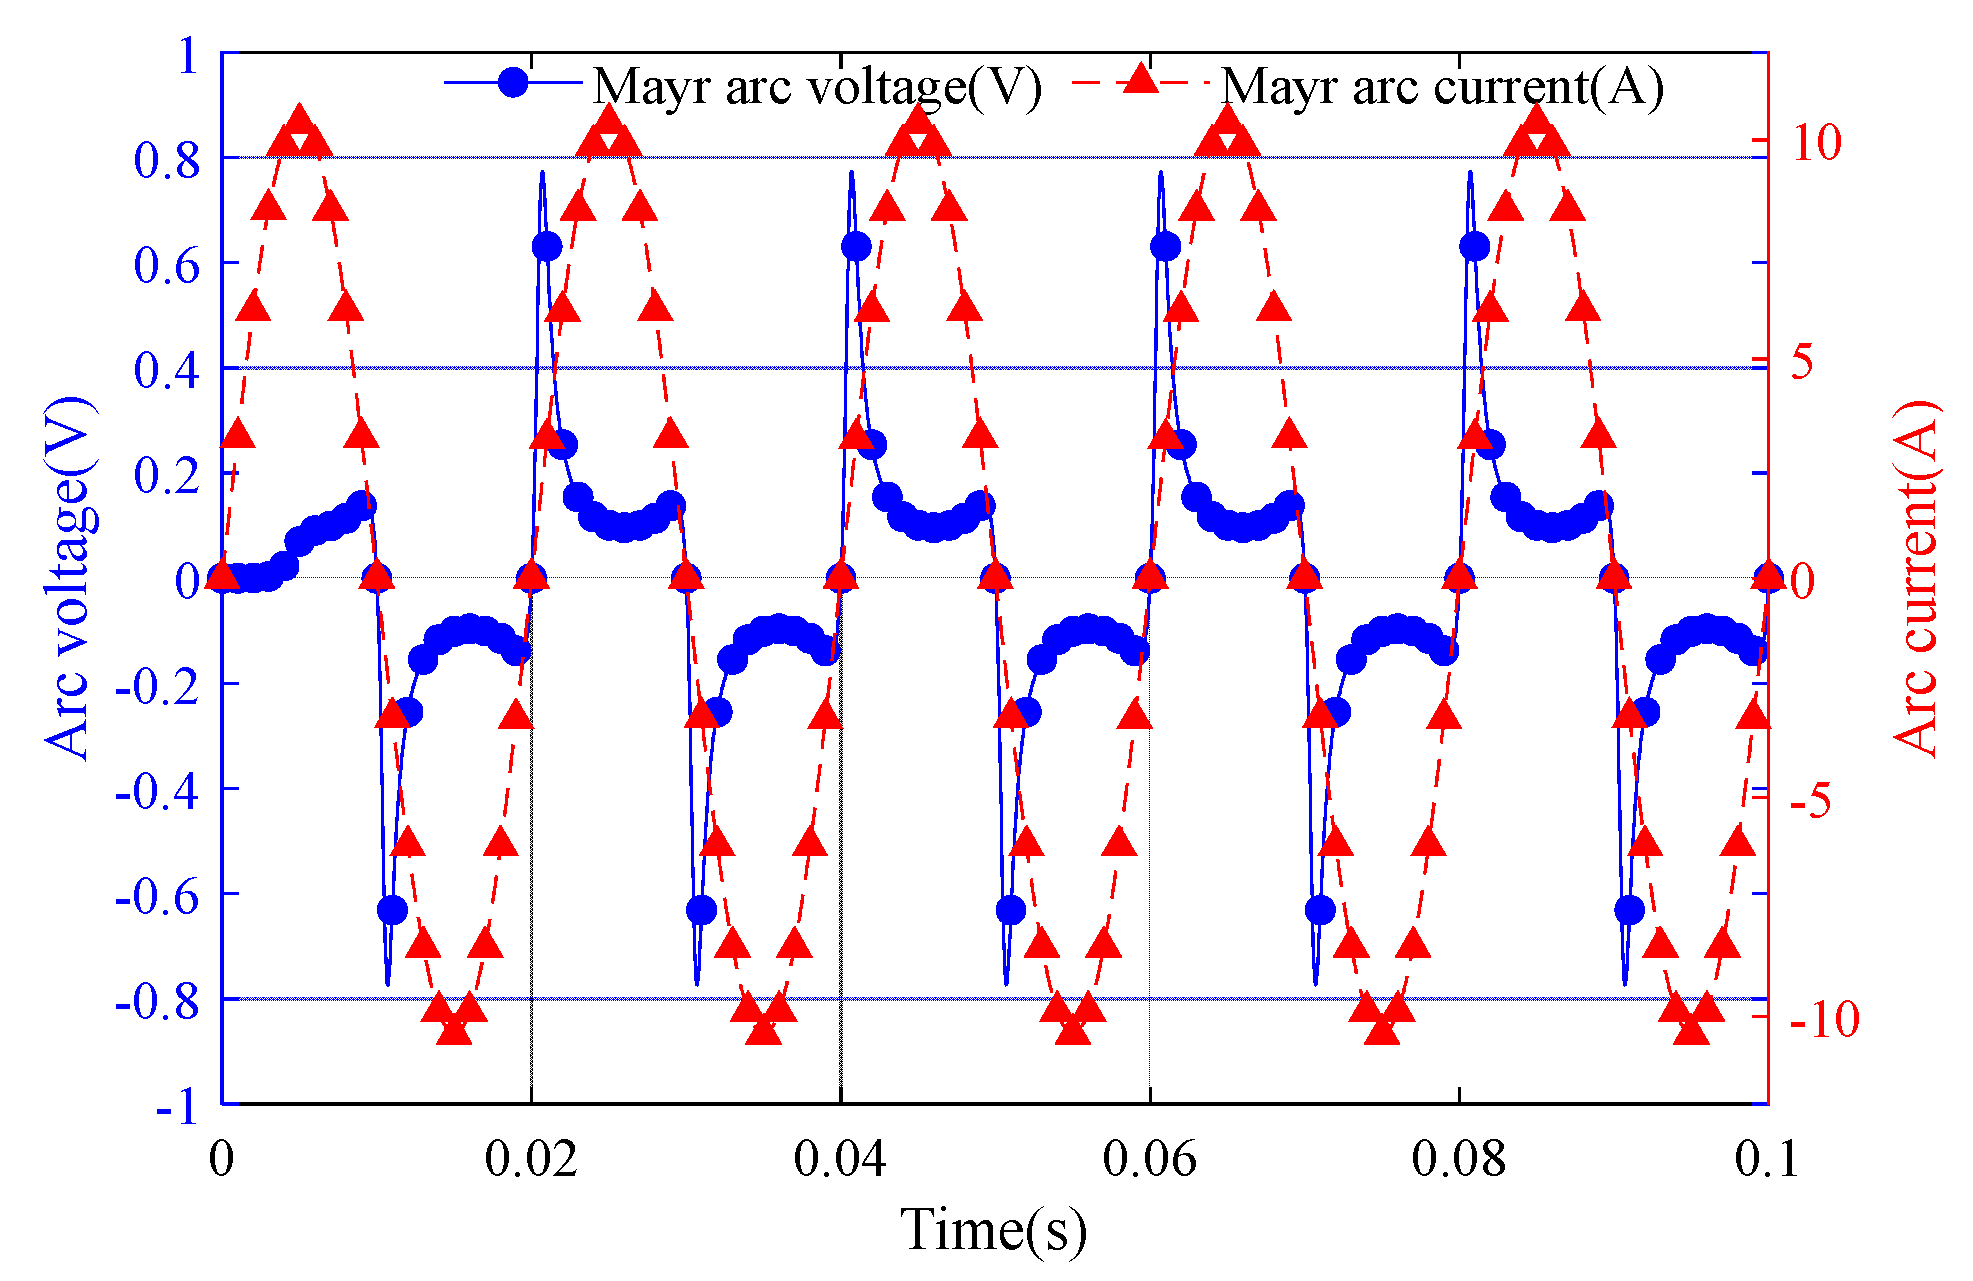
  • Arc length and voltage drop per unit length can be set based on the improved control theory arc theoretical model. The arc length can directly correspond to the actual distance between the two electrodes of the experimental platform, and the arc voltage waveform obtained is very close to the shape of the experimental waveform. This arc model is more suitable for reflecting the arc characteristics of low voltage and small current. Research has found that the improved control theory arc model can control the arc length, and the simulation wave of the arc voltage is similar to the experiment results.
  • In the simulation of the low-voltage and low-current platform, arc voltage arc-quenching and zero arc current can hardly be combined. This phenomenon is also verified in the experiments of pure resistance, resistive load and multi-branch load. Multi-branch load is beneficial to increase the arc current, to obtain continuous arc pulling, and to facilitate the collection of experimental data.
  • The developed permanent magnet DC brush motor matching the large speed reducer ratio speed reducer scheme, combined with the PWM controlled stepless governor and positive and negative switch, can cause the adjustment of the two electrodes, while preventing the risk of arc discharge shock, improving the safety of the experiment. By collecting arc voltage and arc current waveforms, it is helpful to identify and remove faults in the later stage.

Supplementary Materials

The following supporting information can be downloaded at: https://www.mdpi.com/article/10.3390/en18020420/s1, Simulation and Experimental Study of Arc Model in Low-Voltage Distribution Network—Variable definition.

Author Contributions

Methodology and formula derivation, B.Z. and Q.C.; writing and original draft preparation, B.Z. and J.Z.; review and editing, Q.Z. and Y.C.; supervision, B.Z.; project administration B.Z. All authors have read and agreed to the published version of the manuscript.

Funding

This research was funded by Project of the ignition mechanism and early warning method of series arc fault in low voltage distribution network (Project number: B3120523000W).

Data Availability Statement

The data presented in this study are not publicly available due to proprietary restrictions. The data will be available from the authors upon reasonable request and with permission of the company holding the rights.

Acknowledgments

The authors would like to express their sincere thanks to the reviewers and editors for their valuable opinions and constructive suggestions.

Conflicts of Interest

Authors Binbin Zhang, Jiaqing Zhang and Yifeng Cheng were employed by the State Grid Anhui Electric Power Co., Ltd. The remaining authors declare that the research was conducted in the absence of any commercial or financial relationships that could be construed as a potential conflict of interest.

References

  1. Schavemaker, P.H.; der Sluis, L.V. An improved Mayr-type arc model based on current-zero measurements. IEEE Trans. Power Electron. 2000, 15, 580–584. [Google Scholar] [CrossRef]
  2. Wei, M.J.; Shi, F.; Zhang, H.X.; Yang, F.; Chen, W.J. A high-efficiency method to determine parameters of high impedance arc fault models. IEEE Trans. Power Deliv. 2022, 37, 1203–1214. [Google Scholar] [CrossRef]
  3. Wang, F.; Gao, H.L.; Sun, Y.; Zhang, L.L. Arc grounding model and simulation in non-effectively grounded system. In Proceedings of the 5th International Conference on Electric Utility Deregulation and Restructuring and Power Technologies, Changsha, China, 26–29 November 2015; pp. 358–362. [Google Scholar]
  4. Cheng, Y.; Liu, Z.G.; Huang, K. Transient analysis of electric arc burning at insulated rail joints in high-speed railway stations based on state-space modeling. IEEE Trans. Transp. Electrif. 2017, 3, 750–760. [Google Scholar] [CrossRef]
  5. Zheng, J.C.; Lin, J.J.; Kong, X.P.; Ning, J.X. PSCAD/EMTDC based arc model simulation method for single-pole grounding fault. In Proceedings of the 2022 IEEE 5th International Electrical and Energy Conference (CIEEC), Nangjing, China, 27–29 May 2022. [Google Scholar]
  6. Ji, C.; Chen, Q.; Zhang, Q.; Wang, Q.; Ju, L.; Chen, Q. Evolution of Arc Model and Its Application in Low-Voltage Single-Phase Grounding Fault. In Proceedings of the 2023 13th International Conference on Power and Energy Systems (ICPES), Chengdu, China, 8–10 December 2023; pp. 13–18. [Google Scholar]
  7. Tong, H.X.; Zeng, X.J.; Yu, K.; Mu, J.R.; Luo, C.; Liu, B.Y. Research on the identification method of series arc fault based on the feature sensitivity analysis and the TVA coefficient optimized random forest. IEEE Trans. Power Del. 2024, 39, 751–762. [Google Scholar] [CrossRef]
  8. Ren, L.; Lv, W.; Jiang, S.; Xiao, Y. Fault diagnosis using a joint model based on sparse representation and SVM. IEEE Trans. Instrum. Meas. 2016, 65, 2313–2320. [Google Scholar] [CrossRef]
  9. Jiang, R.; Zheng, Y.S. Series arc fault detection using regular signals and time-series reconstruction. IEEE Trans. Ind. Electron. 2023, 70, 2026–2036. [Google Scholar] [CrossRef]
  10. Wang, Y.; Hou, L.M.; Paul, K.C. ArcNet: Series AC arc fault detection based on raw current and convolutional neural network. IEEE Trans. Ind. Inform. 2022, 18, 77–86. [Google Scholar] [CrossRef]
  11. Li, W.; Liu, Y.; Li, Y.; Guo, F. Series arc fault diagnosis and line selection method based on recurrent neural network. IEEE Access 2020, 8, 177815–177822. [Google Scholar] [CrossRef]
  12. Yao, X.; Herrera, L.; Ji, S.; Zou, K.; Wang, J. Characteristic study and time-domain discrete-wavelet-transform based hybrid detection of series dc arc faults. IEEE Trans. Power Electron. 2013, 29, 3103–3115. [Google Scholar] [CrossRef]
  13. Costa, F.B. Fault-induced transient detection based on real-time analysis of the wavelet coefficient energy. IEEE Trans. Power Del. 2014, 29, 140–153. [Google Scholar] [CrossRef]
  14. Gao, H.X.; Wang, Z.Y.; Han, C.X. Feature extraction method of series arc fault occurred in three-phase motor with inverter circuit. IEEE Trans. Power Electron. 2021, 37, 11164–11173. [Google Scholar] [CrossRef]
  15. Zhang, S.; Qu, N.; Zheng, T.F.; Hu, C.Q. Series arc fault detection based on wavelet compression reconstruction data enhancement and deep residual network. IEEE Trans. Instrum. Meas. 2022, 71, 3508409. [Google Scholar] [CrossRef]
Disclaimer/Publisher’s Note: The statements, opinions and data contained in all publications are solely those of the individual author(s) and contributor(s) and not of MDPI and/or the editor(s). MDPI and/or the editor(s) disclaim responsibility for any injury to people or property resulting from any ideas, methods, instructions or products referred to in the content.

Article Metrics

Citations

Article Access Statistics

Multiple requests from the same IP address are counted as one view.