Abstract
As the penetration of renewable energy sources (RESs) in power systems continues to increase, their volatility and unpredictability have exacerbated the burden of frequency regulation (FR) on conventional generator units (CGUs). Therefore, to reduce frequency deviations caused by comprehensive disturbances and improve system frequency stability, this paper proposes an integrated strategy for hybrid energy storage systems (HESSs) to participate in primary frequency regulation (PFR) of the regional power grid. Once the power grid frequency exceeds the deadband (DB) of the HESS, the high-frequency signs of the power grid frequency are managed by the battery energy storage system (BESS) through a division strategy, while the remaining parts are allocated to pumped hydroelectric energy storage (PHES). By incorporating positive and negative virtual inertia control and adaptive droop control, the BESS effectively maintains its state of charge (SOC), reduces the steady-state frequency deviation of the system, and provides rapid frequency support. When the system frequency lies within the DB of the HESS, an SOC self-recovery strategy restores the BESS SOC to an ideal range, further enhancing its long-term frequency regulation (FR) capability. Finally, a regional power grid FR model is established in the RT-1000 real-time simulation system. Simulation validation is conducted under three scenarios: step disturbances, short-term continuous disturbances, and long-term RES disturbances. The results show that the proposed integrated strategy for HESS participation in PFR not only significantly improves system frequency stability but also enhances the FR capability of the BESS.
1. Introduction
As non-renewable resources slowly deplete, it is necessary to establish a power system with a high proportion of renewable energy sources (RESs), improving energy conservation and reducing emissions [1,2]. However, uncertainty and instability in the regulation of power generation equipment such as wind and solar energy pose significant risks to the long-term safe operation of the power system. These issues result in low grid inertia, weak damping, and large frequency variations under power disturbances [3,4]. Conventional generator units (CGUs), under existing control strategies, struggle to effectively address the aforementioned issues, significantly increasing the pressure for frequency regulation (FR) in the power gird [5,6]. Against this backdrop, energy storage systems (ESSs), with their rapid response and flexible adjustment capabilities, have become a crucial means of mitigating frequency fluctuations in the grid and improving system reliability [7]. In recent years, the achievement of more efficient and cost-effective FR and other ancillary service requirements through ESSs has gradually become a focal point of research in both academia and the industry [8,9,10,11].
Pumped hydroelectric energy storage (PHES), a large-scale ESS, exhibits significant advantages in the aspects of capacity, cost, and efficiency [11,12], making it particularly suitable for scenarios involving centralized integration of RESs. For applications that are more sensitive to instantaneous power support and rapid FR, flywheel energy storage, due to its mechanical operating principle, offers high power density and short response times, making it increasingly prominent in the market of ancillary services [13]. However, the relatively high self-discharge rate and maintenance costs of flywheel systems present limitations in scenarios requiring long-term energy storage or significant energy capacity [14]. Due to the fast response speed, high power density, and strong precision tracking capability of battery energy storage systems (BESSs) [15,16], the use of BESSs for FR in power systems has become a popular research topic. Reference [17] proposes that large-scale BESSs, as new participants in the energy market, can obtain certain benefits by providing PFR services.
Currently, the primary methods for BESSs to participate in PFR consist of virtual inertia control and droop control, which are used to improve the dynamic response and steady-state response of the system frequency, respectively [18,19]. Reference [20] proposes a linear droop coefficient (variable K), which, compared to the fixed droop coefficient, considers the impact of SOC on the FR capability of BESSs. However, it exhibits poor SOC tracking ability and limited FR performance. According to reference [21], combining droop control and virtual inertia control can achieve complementary advantages. By configuring appropriate switching times and modes, a more efficient integration of the two methods can be realized [22,23]. In reference [24], an adaptive FR regression function is used to determine the FR output of a BESS for a reasonable allocation between the two modes. Reference [25] achieves adaptive switching between the two control modes by designing a high-precision fuzzy controller at the upper level. However, the introduction of fuzzy rules adds corresponding design complexity to the system. In general, limitations related to charging and discharging states restrict BESS application in large-capacity systems and long-duration FR [26]. Regarding SOC, the methods for maintaining or restoring SOC have a significant impact on capacity allocation, the benefits of participating in PFR, and the lifespan of the BESS. Since the need for SOC recovery in BESSs often conflicts with the FR requirements, SOC recovery control strategies must simultaneously account for both frequency regulation and charging demands. Reference [27] proposes an SOC recovery strategy that operates with constant power within the DB of frequency regulation. However, using constant power can easily lead to secondary frequency drops in the system. Some related studies [28,29] consider performing SOC recovery outside the DB. However, this strategy must use the reserve capacity of the CGU as a constraint for BESS SOC recovery. Otherwise, when the load power increases, the BESS may absorb energy from the power system, increasing the FR burden on the CGU, which is detrimental to the safety and stability of the frequency.
For the complex fluctuations caused by RESs, different types of ESS have varying effects on frequency support [30]. Hybrid energy storage systems (HESSs) consider the combination of power-type and energy-type storage devices to effectively address complex power and frequency disturbances caused by load fluctuations and RES variability at RES gathering stations [31,32]. Reference [33] proposes an HESS consisting of a BESS and capacitance. An adaptive algorithm is used to calculate the appropriate cutoff frequency to achieve a reasonable power allocation between the two components. References [34,35] verified the feasibility of combining a BESS with PHES for FR.
The above studies explore the capability of energy storage systems in grid frequency regulation but present the following issues: (1) When selecting a BESS as the FR target, the droop coefficient’s adaptive capability is insufficient, and the SOC tracking ability is inadequate. (2) While the literature considers switching between virtual inertia and droop control, it fails to address the system oscillations caused by the switching process and the adaptive behavior of the virtual inertia coefficient during different FR phases. (3) The SOC recovery strategy does not take into account adaptability, and SOC recovery during the FR period is likely to cause a secondary drop in system frequency. (4) There is no discussion on how to efficiently combine HESSs.
To address the issue of frequency fluctuations caused by the integration of large-scale RESs into regional power grids through high-voltage RES gathering stations, this paper proposes an integrated control strategy for HESSs to participate in PFR. This strategy not only enhances grid frequency stability but also enables coordinated operation among different ESS. First, a frequency division device is used to allocate the high- and low-frequency components of grid frequency fluctuations to the BESS and PHES, respectively. To enhance the FR performance of the BESS, adaptive droop control and positive/negative virtual inertia control are integrated into the FR phase. Additionally, an SOC self-recovery strategy is introduced within the DB of the HESS to improve the long-term FR capability of the BESS. An HESS-based FR model for the regional power grid was established within the real-time simulation system RT-1000. This paper considers the FR of the system under the uncertainty of RES generation, focusing only on the participation of the BESS, PHES, and CGU. Using the proposed regional power grid FR model, the impact of the integrated strategy on frequency stability is validated under three scenarios: step disturbances, short-term continuous disturbances, and long-term RES disturbances. Experiments under various disturbance scenarios demonstrate that the proposed integrated strategy, which considers the rational allocation of HESSs, not only significantly improved system frequency stability but also improves the FR capability of the BESS.
- The impact of the DB on the FR performance of an HESS is considered in full. Moreover, by using frequency division control, the high-frequency and low-frequency components of frequency fluctuations are, respectively, allocated to the BESS and PHES, thereby better utilizing the respective advantages of the HESS.
- Based on the impact on SOC and frequency, the BESS incorporates positive/negative virtual inertia control. Taking into account the SOC and the degree of frequency variation, this approach simultaneously enhances the inertia level of the system.
- We propose an adaptive droop control that enables the droop control to not only respond quickly to FR demands but also effectively maintains the SOC of the BESS. In addition, when the frequency of the power grid is within the DB, a method is proposed to construct the SOC recovery coefficient to enhance the ability of the BESS to participate in the PFR over extended periods.
2. Materials and Methods
2.1. Modeling of the RES Gathering Station System
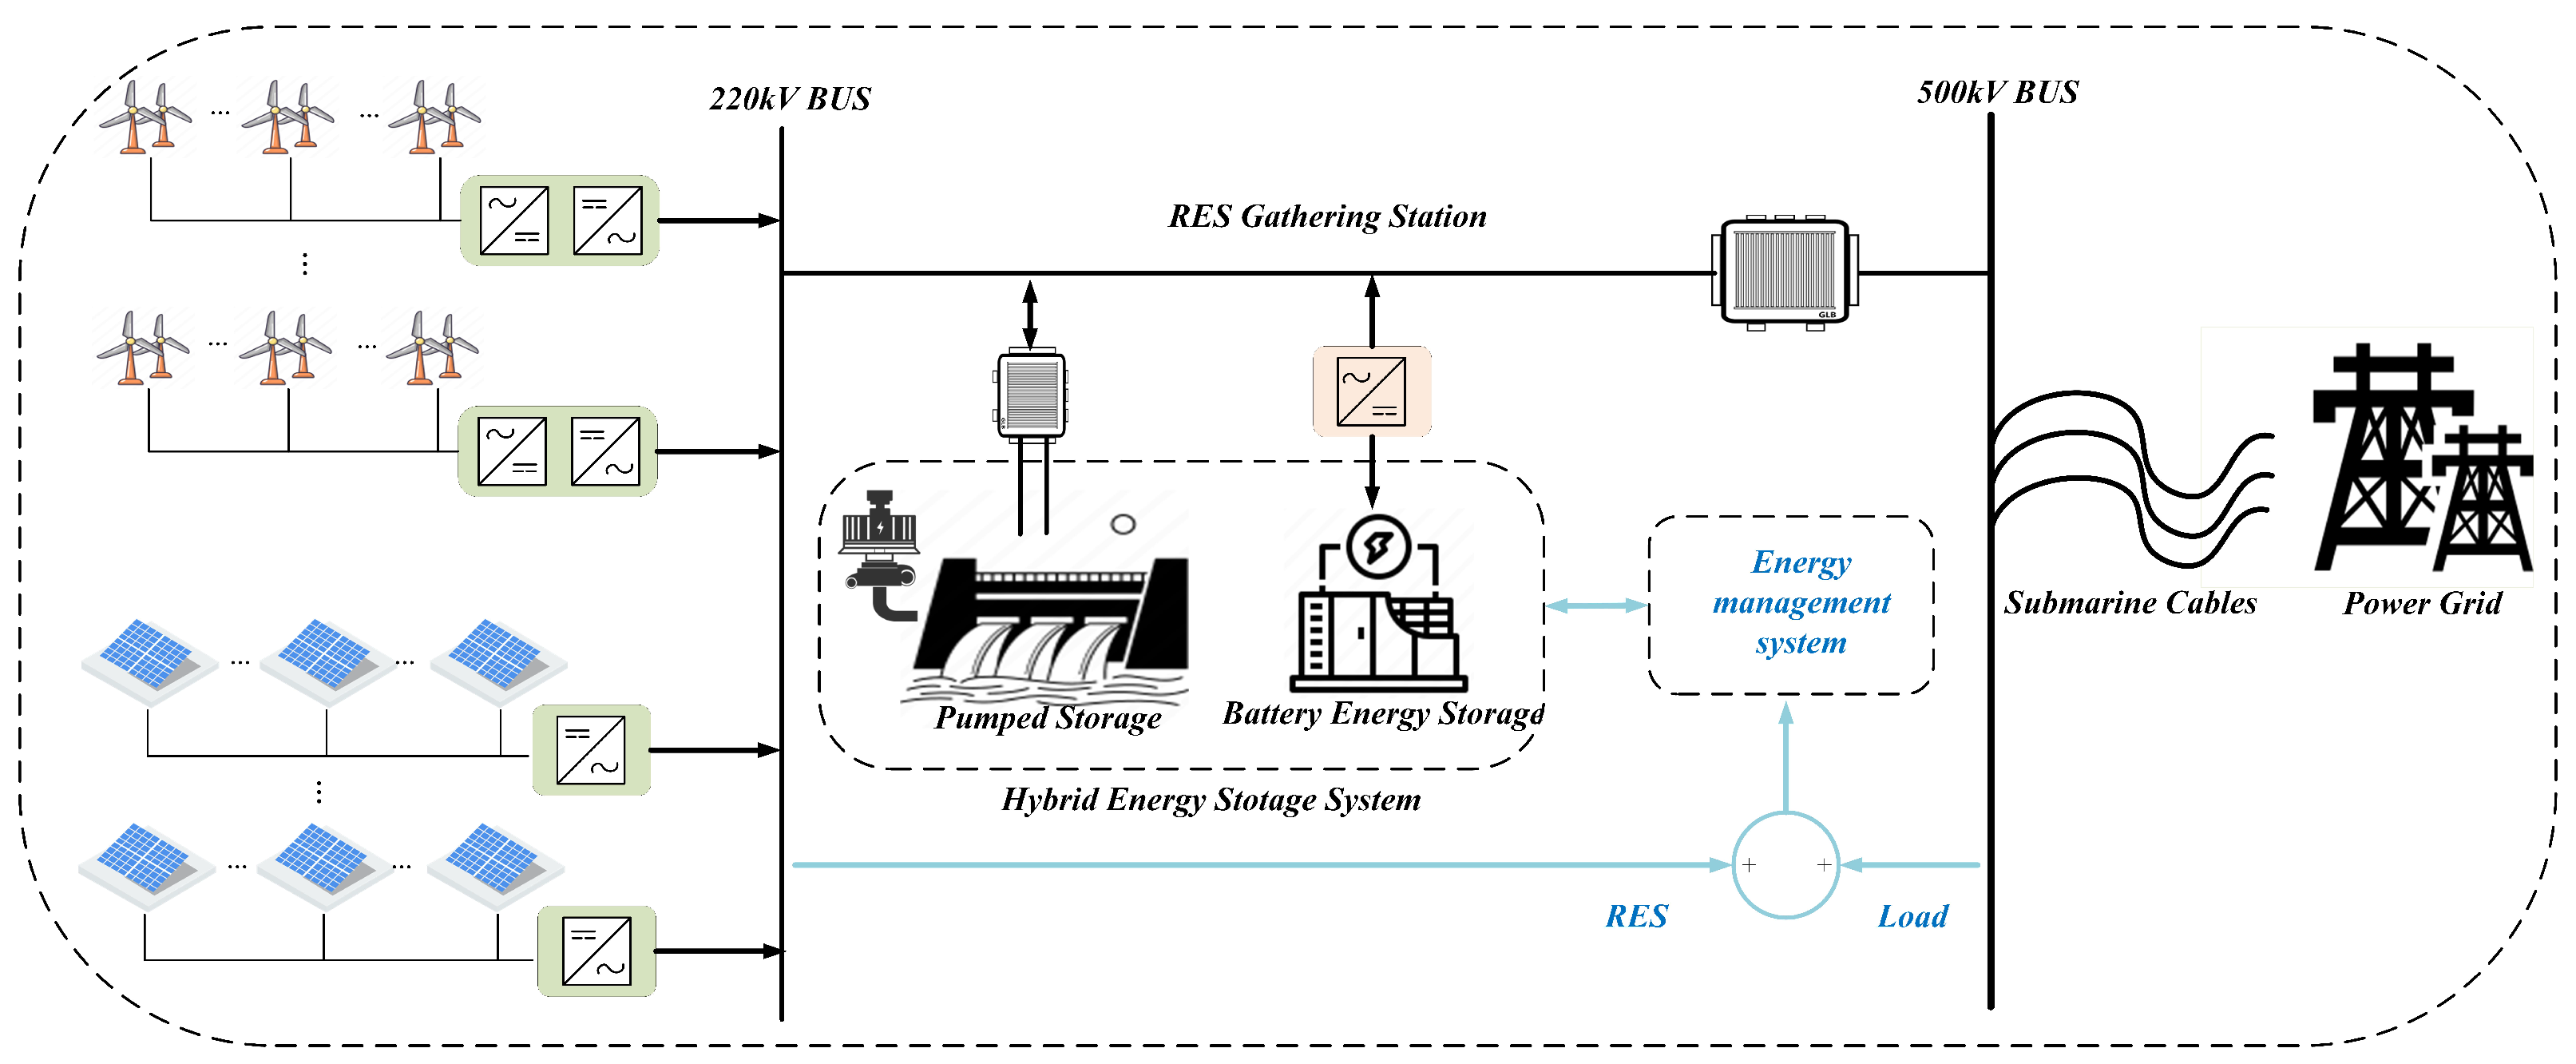
We constructed a structural diagram of the RES gathering station based on an actual power grid model, as illustrated in Figure 1.
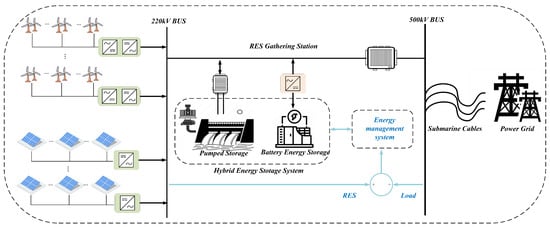
Figure 1.
RES gathering station structure diagram.
In this system, RESs are centrally controlled at the gathering station through a 220 kV bus before being integrated into the power grid. Placing a certain capacity of BESS and PHES in an RES gathering station can effectively regulate the frequency fluctuations of the system caused by the variability in RES output and load disturbances.
Wind farms and PV stations are connected to the power grid through electronic components, and are connected via inverters, thus reducing the inertia of the power grid. The output equation for an RES is shown in Equation (1) [36]:
where represents the output of the wind power station; v denotes the actual wind speed; and and represent the minimum and maximum wind speeds required for the turbine to start and stop, respectively. is the air density, r is the radius of the fan blade, and the magnitude of is related to the tip speed ratio . represents the output of the PV station; S is the irradiation intensity; A is the generating area of the PV equipment; represents the output power of a single PV station; and is the conversion efficiency. The maximum rated capacity unit is set as 1000 MW, with the BESS rated at 50 MW, and the value of the PHES capacity is 800 MW. The capacities of the wind turbines and PV power stations on the RES side are 500 MW and 100 MW, respectively.
2.2. Regional Grid FR Model with HESS
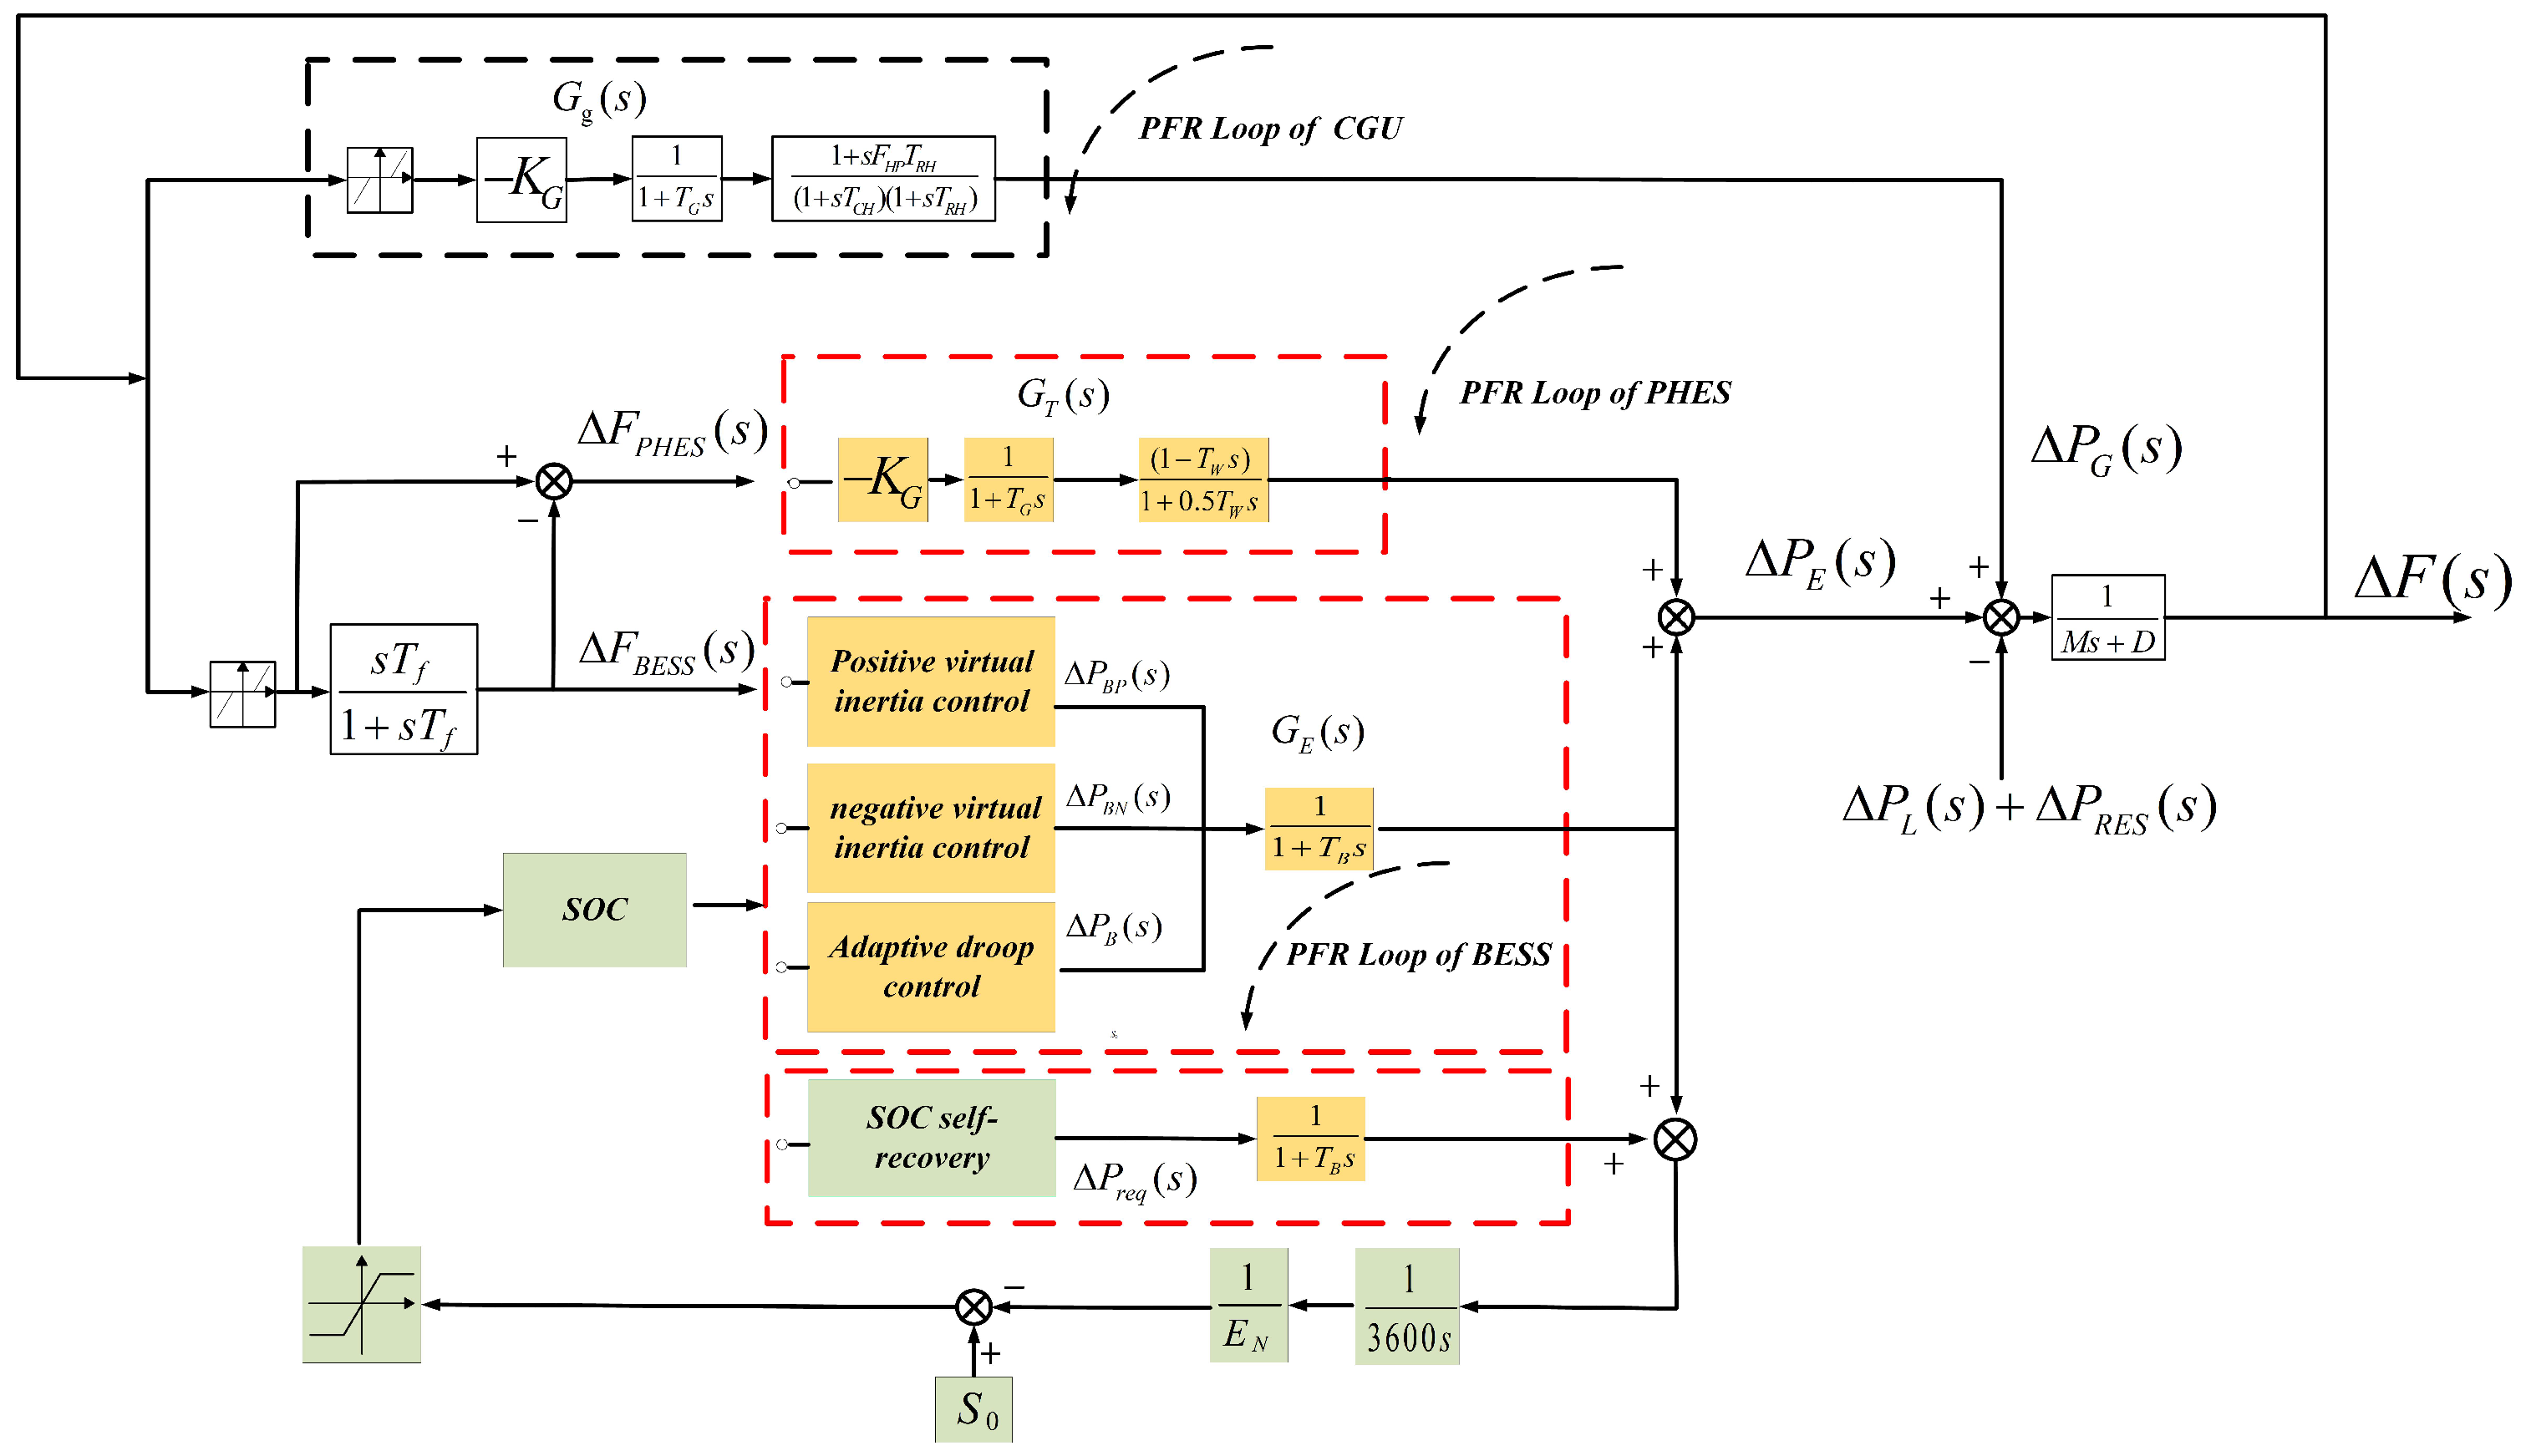
The dynamic response model for an HESS participating in PFR of the power grid consists of a control unit and various FR devices. Its structural diagram is shown in Figure 2.
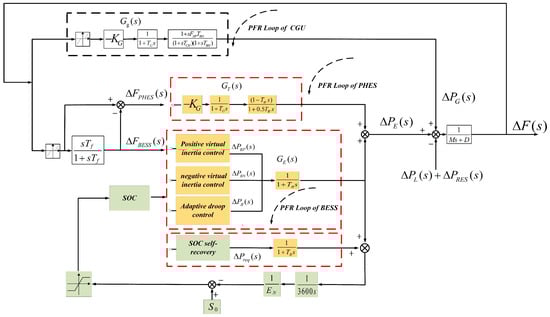
Figure 2.
FR model with HESS.
The CGU is a reheat-type thermal power unit, and its model primarily consists of a governor model and a prime-mover model. The transfer function of is expressed as follows [25]:
Similarly, the transfer functions corresponding to the PHES [36] are
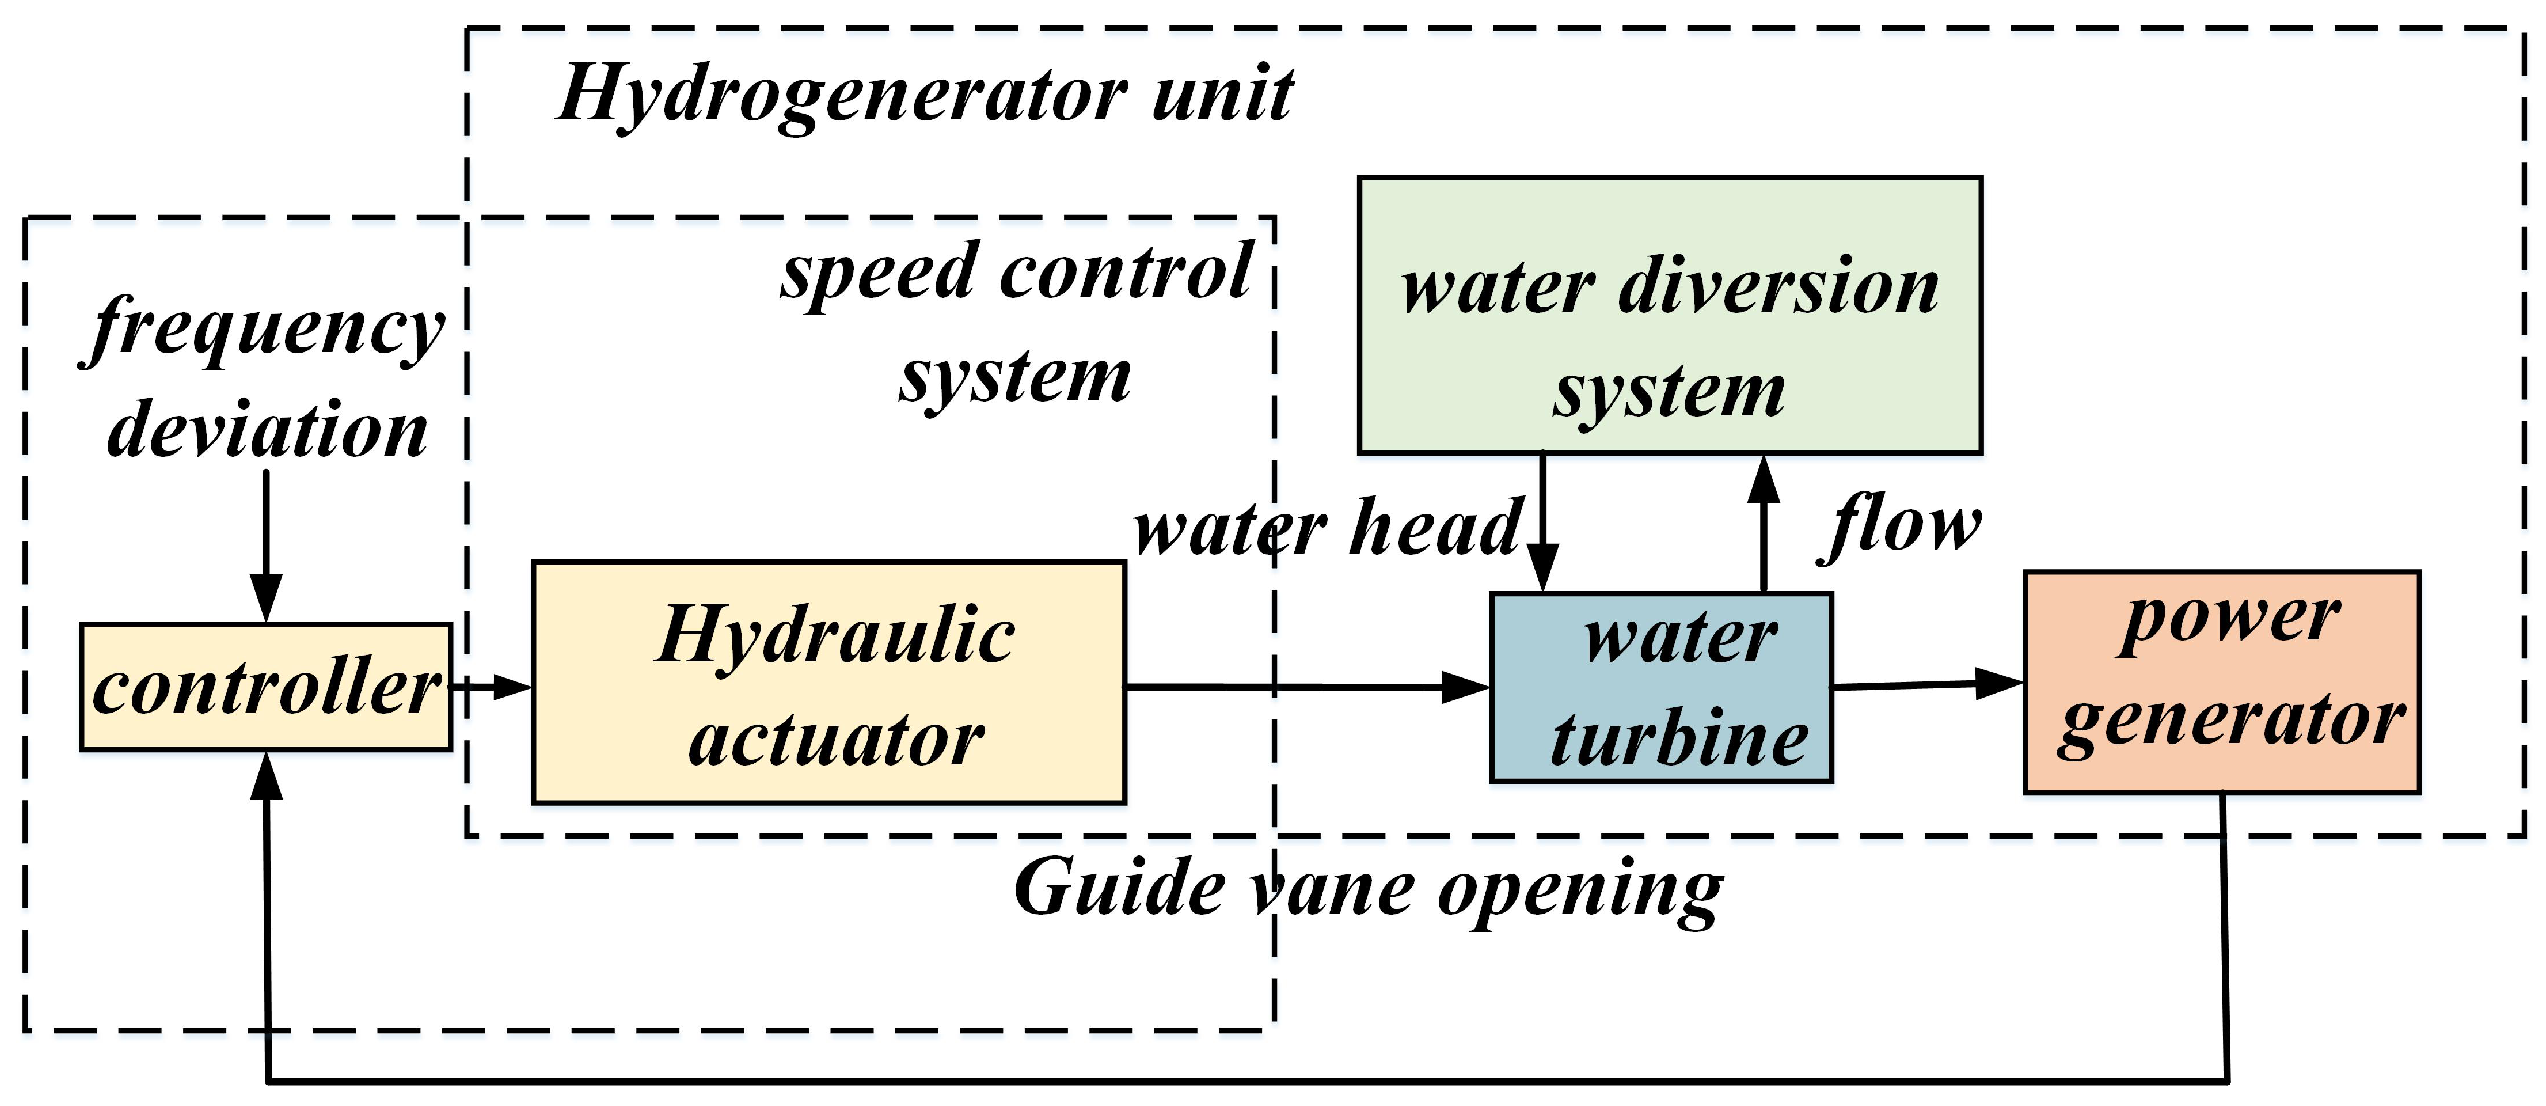
According to the operational status, PHES is categorized into two modes: generating and motoring. The former is modeled as a hydroelectric generator unit, while the latter is modeled as a pump model. When participating in frequency regulation, the power of the pumped storage units is automatically adjusted to complete the regulation tasks. Specifically, the hydroelectric generator unit is subdivided into a speed control system and a hydro turbine generator unit, as shown in Figure 3.
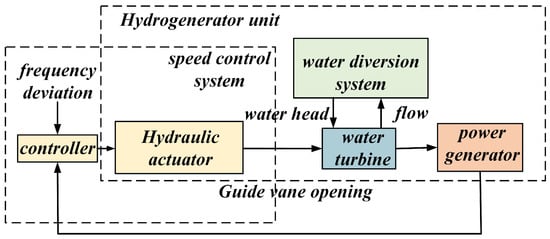
Figure 3.
Pumped unit structure diagram.
The BESS is represented by a first-order inertia model, which can accurately simulate the dynamic characteristics of the BESS when exchanging energy with the grid, while also considering the SOC constraints. The transfer function of the BESS is as follows [25]:
Based on Equations (2)–(4), along with Figure 2, where s is the pull operator, M is the inertia time constant of the system, and D is the system damping coefficient. is the droop coefficient of CGU; and are defined as the time constant and gain of the reheater, respectively. The time constant of the steam turbine is denoted as . Further, is used as the time constant for the governor of hydro turbines or thermal power units. is the water starting time of the hydraulic turbine. is the frequency deviation; represents the time constant of the high-pass filter; , , and refer to positive virtual inertia output, negative virtual inertia output, and droop control output, respectively; and and refer to BESS capacity and SOC initial state, respectively. The composite disturbance is composed of load disturbance and RES disturbance , and the integrated output consists of the unit and the HESS ; is the time constant inertia of the BESS. , , and are the CGU transfer function, BESS transfer function, and PHES transfer function, respectively [25].
The nominal power frequency of the power grid is set at 50 Hz, and the DB of PFR limits for the CGU is set at ±0.033 Hz; the values of the specific parameters are shown in Table 1.

Table 1.
Parameters of simulation model.
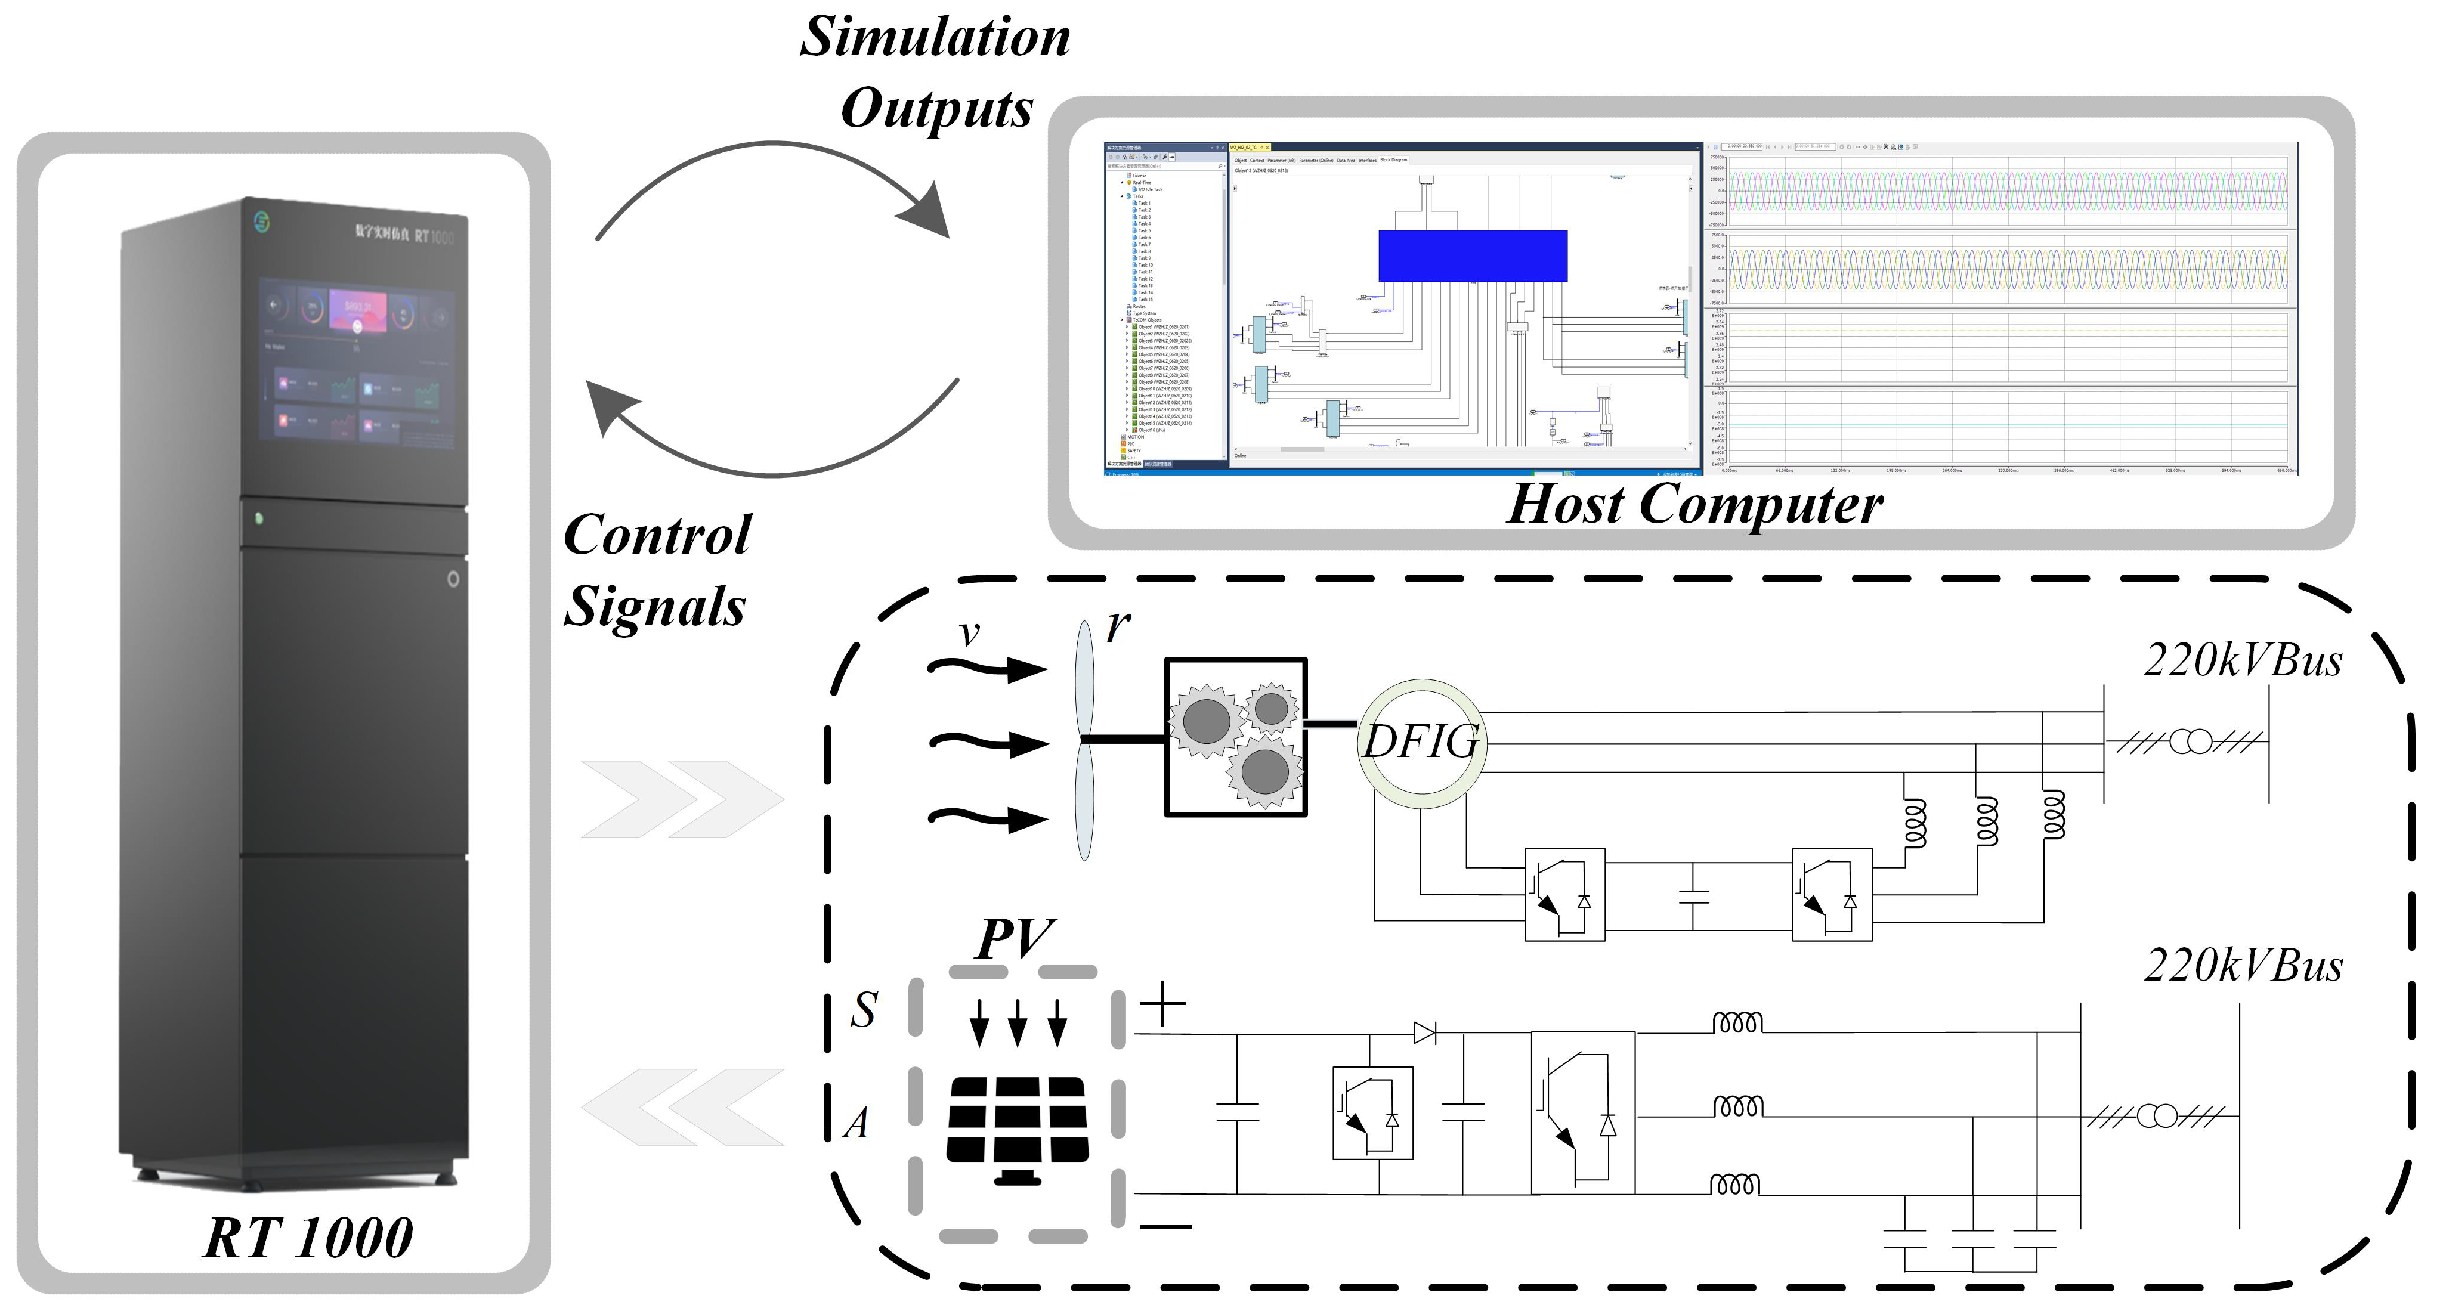
The RT-1000 system is a real-time simulation platform based on 21MATLAB/Simulink functionality, which is capable of distributed and flexible expansion of computing units according to the simulation scale. The aforementioned model and corresponding strategies were implemented on the RT-1000 system, and the configuration is shown in Figure 4.
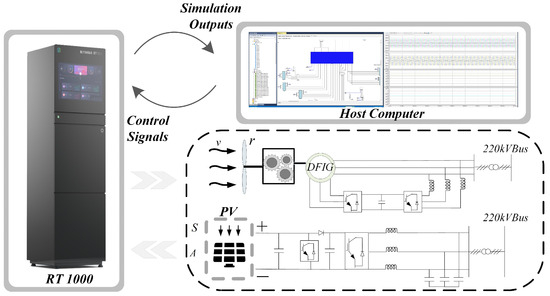
Figure 4.
Setup of real-time simulator RT-1000.
2.3. Control Strategy of BESS Participating in PFR
With the growing integration of RESs like wind and PV systems, their intermittent nature and connection through power inverters lead to decoupling from the grid. As a result, the effective inertia of the system decreases when traditional generators are substituted with RESs, posing challenges to the stability and reliability of the power grid [37]. To study the characteristics of droop control and inertia control of a BESS [38], the system frequency deviation when using only droop control or inertia control is described by Equation (5) [25]:
where and denote the frequency deviation when the BESS adopts inertial control and droop control, respectively.
From Equation (5), we can obtain the rate of change in the frequency deviation and steady-state frequency deviation [25]:
From Equations (6) and (7), it can be seen that at the initial moment of perturbation occurrence for the system with inertial response is mainly affected by the grid inertia coefficient M and the inertia coefficient of the BESS. When a stable steady state is achieved, is zero and the inertia control does not contribute, thus exiting the PFR. Therefore, effectively integrating the two control strategies is key to enhancing the FR performance of the BESS.
BESSs, known for their rapid response capabilities, are widely used for PFR and offer faster response times compared to PHES at the minute level. Following disturbances, they compensate for the high-frequency components within the disturbance, providing faster frequency support. Taking into account the impact of SOC on the PFR of BESSs, positive/negative virtual inertia control, adaptive droop control, and self-recovery control of SOC are introduced at different stages of FR.
2.3.1. Positive Virtual Inertia Control
During the initial phase of frequency variation in the power grid, positive virtual inertia control is introduced to emulate the inertia response of the CGU, effectively improving the dynamic characteristics of the frequency during the early stages of disturbances. The calculation formula for the positive virtual inertia response is as in Equation (8):
In Equation (8), the positive virtual inertia is applied only during the frequency deterioration phase and, for a short period, during the frequency worsening period, decreases until it reaches the maximum frequency deviation point where it becomes zero, while increases.
To ensure uniform output, the positive virtual inertia coefficient should be directly proportional to during this process. The relationship between and can be formulated as Equation (9):
where represents the initial positive virtual inertia coefficient. Accordingly, the corresponding curve is shown in Figure 5.
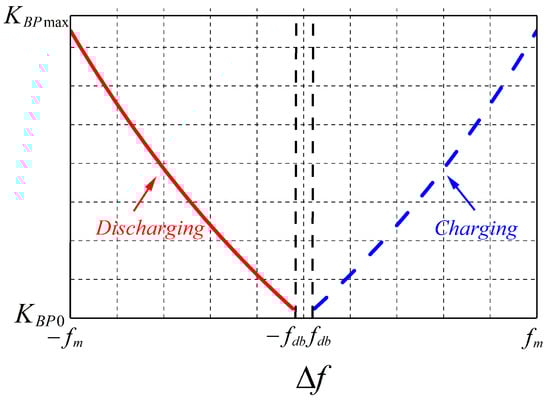
Figure 5.
Positive virtual inertia curve.
2.3.2. Negative Virtual Inertia Control
During the frequency recovery phase, which is time consuming, it is essential that the BESS considers both the effectiveness of FR and the impact of the SOC on its output. Consequently, a negative virtual inertia control is introduced, which fully considers the and SOC to adjust the output of the BESS during the frequency recovery phase. The calculation formula for the negative virtual inertia is as follows:
By further decomposing the negative virtual inertia coefficient in Equation (10), we can obtain Equations (11)–(13),
where is the initial coefficient, is the parameter setting considering the SOC, and is the parameter setting considering the frequency deviation; and are the upper and lower limits of the SOC mentioned above, which are set to 0.9 and 0.1, respectively; the maximum frequency deviation is set to 0.5 Hz.
The relationship between the negative virtual inertia coefficient , and is depicted in Figure 6. When is high (low), the is increased (decreased); an increase in results in a bigger output from . In general, negative virtual inertia control plays a role in the system frequency restoration period, accelerating frequency restoration while considering the SOC.
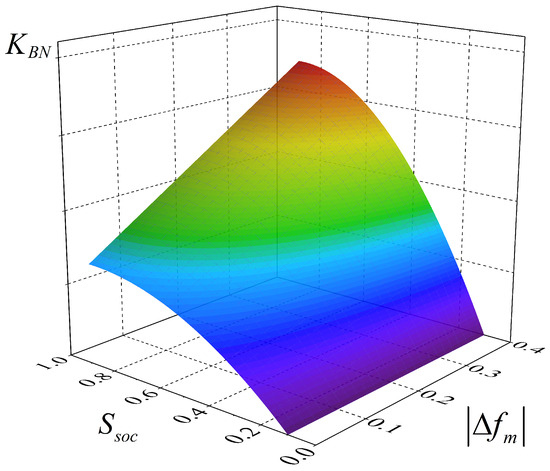
Figure 6.
Negative virtual inertia curve.
2.3.3. Adaptive Droop Control
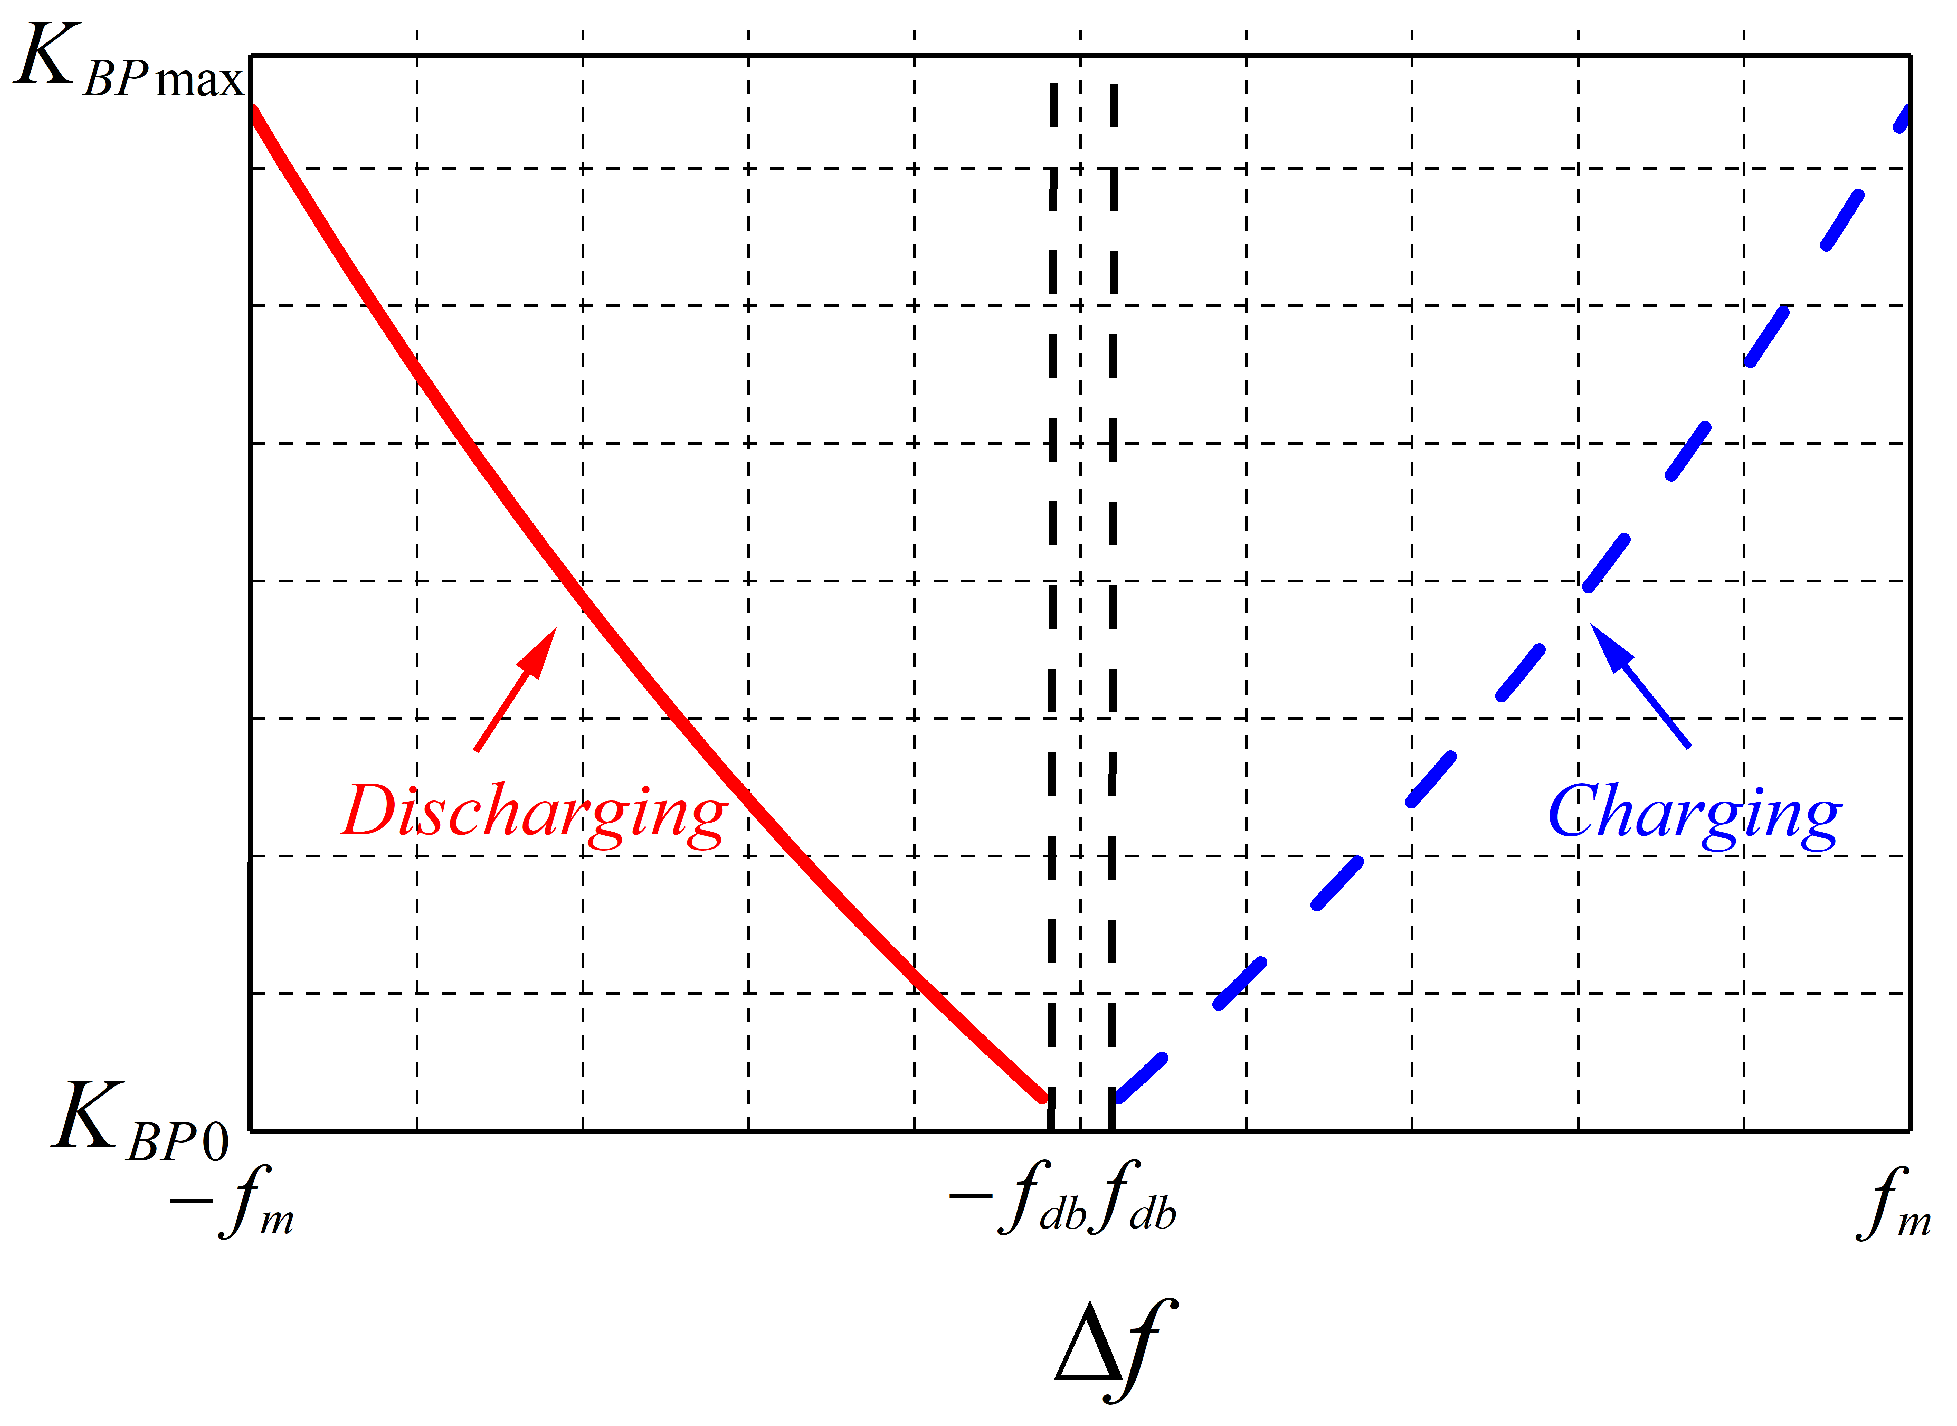
Throughout the entire FR phase, the droop control output is closely related to the frequency deviation of the system. The expression is shown in Equation (14):
for adaptive droop control, the function form used for calculating the and in the adaptive droop control is based on a piecewise function. Leveraging the monotonicity and concavity properties of this function, it inherently aligns with the adaptive characteristics of k-value variation with the SOC. When the SOC is higher (lower), the k-value becomes larger (smaller), enabling the adjustment of output weights based on the current SOC value. This smooth adjustment effectively prevents abrupt changes in power output, balancing FR performance with SOC maintenance. The specific expressions are expressed by Equations (15) and (16):
where is the maximum charging/discharging coefficient of the BESS. This strategy sets and when the SOC is 0.45 and 0.55. The ideal value of the SOC is set at 0.5. A point between and is selected as the intermediate value , and a point between and is selected as the intermediate value .
Figure 7 shows the visualization of the determination of the values of and with the change in SOC. Taking as an example, it maintains the maximum discharge coefficient within the range of ( < < 1) to stabilize the frequency drop. However, when the SOC is insufficient, rapidly declines and gradually reduces to 0 as it approaches the discharge lower limit, preventing the battery from over-discharge.

Figure 7.
Adaptive droop gain curve.
2.3.4. Self-Recovery Control of SOC
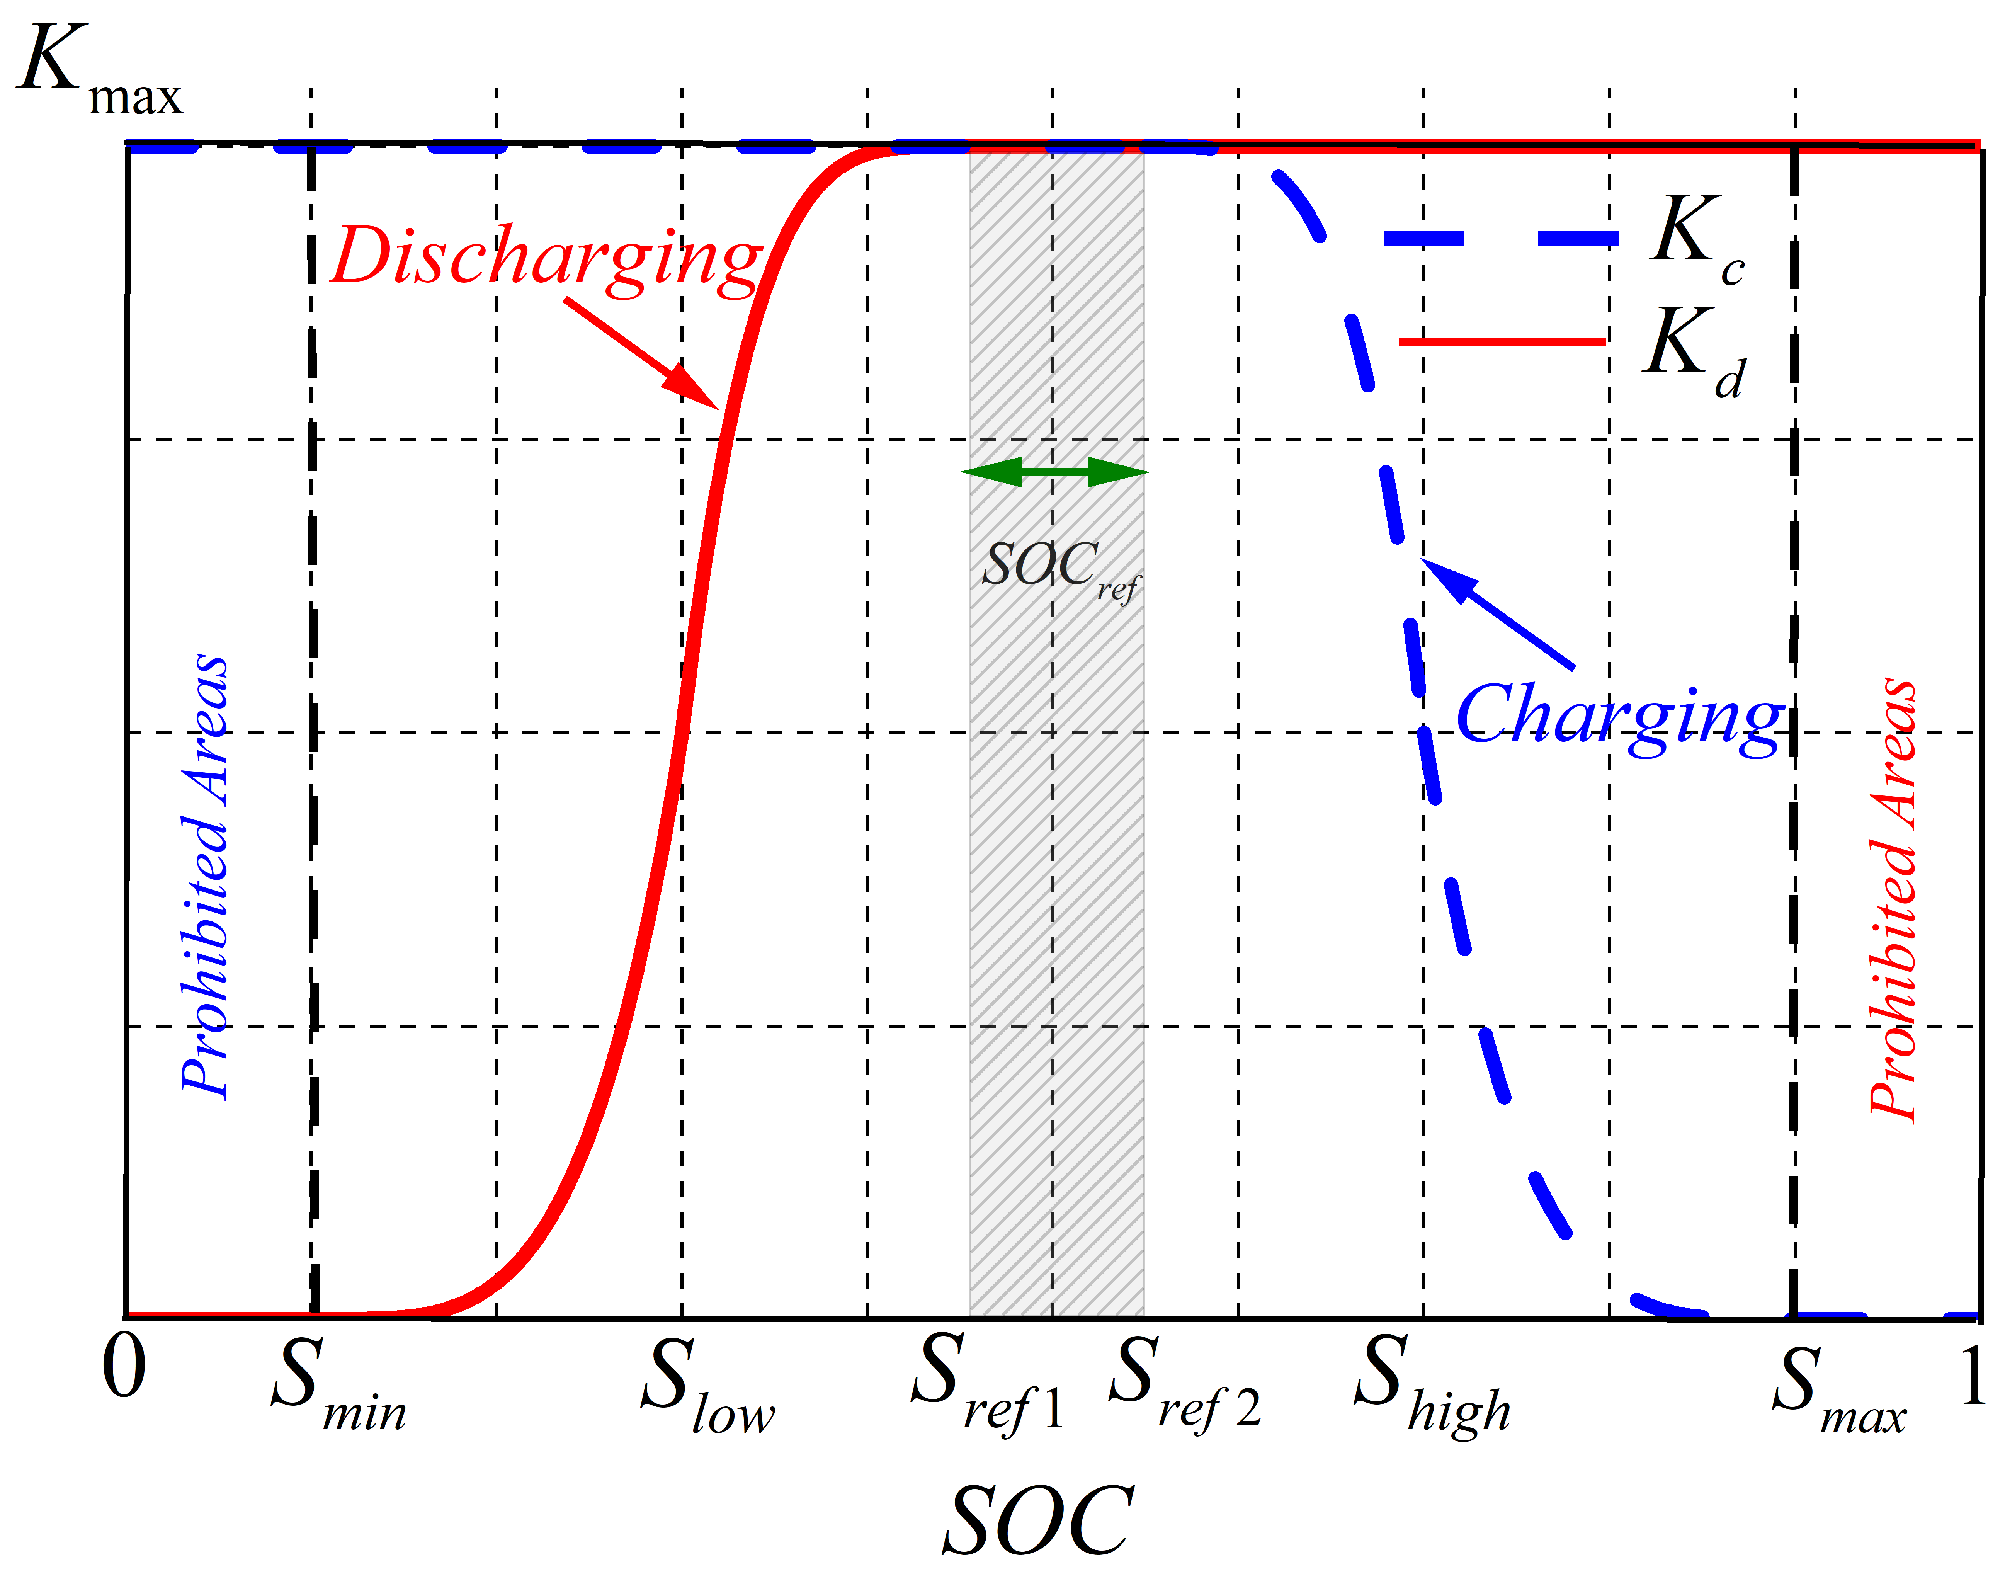
According to the adaptive droop coefficient setting described in Section 2.3.3 of this paper, when the SOC of the BESS is within the range of –, the charging and discharging power of the BESS reaches its maximum value. Therefore, this range is defined as the ideal SOC range and serves as the target for the following SOC recovery strategy.
When the BESS system does not participate in FR and the SOC level does not meet the desired value (, ), an SOC recovery strategy is implemented. The SOC self-recovery control improves the FR performance of the BESS in subsequent stages and further enhances its ability to participate in long-term FR. More specifically, the SOC recovery strategy for the BESS should determine the charging and discharging request coefficients based on various SOC levels. Therefore, adaptive strategies are designed as Equations (17) and (18):
where and represent the demand coefficients of the BESS for charging and discharging.
Figure 8 illustrates the close relationship between the demand coefficient and the SOC. Taking as an example, the discharge demand coefficient exhibits a rapid increase when , and gradually slows down as it approaches the SOC’s upper limit, eventually reaching its maximum value.

Figure 8.
SOC recovery demand gain.
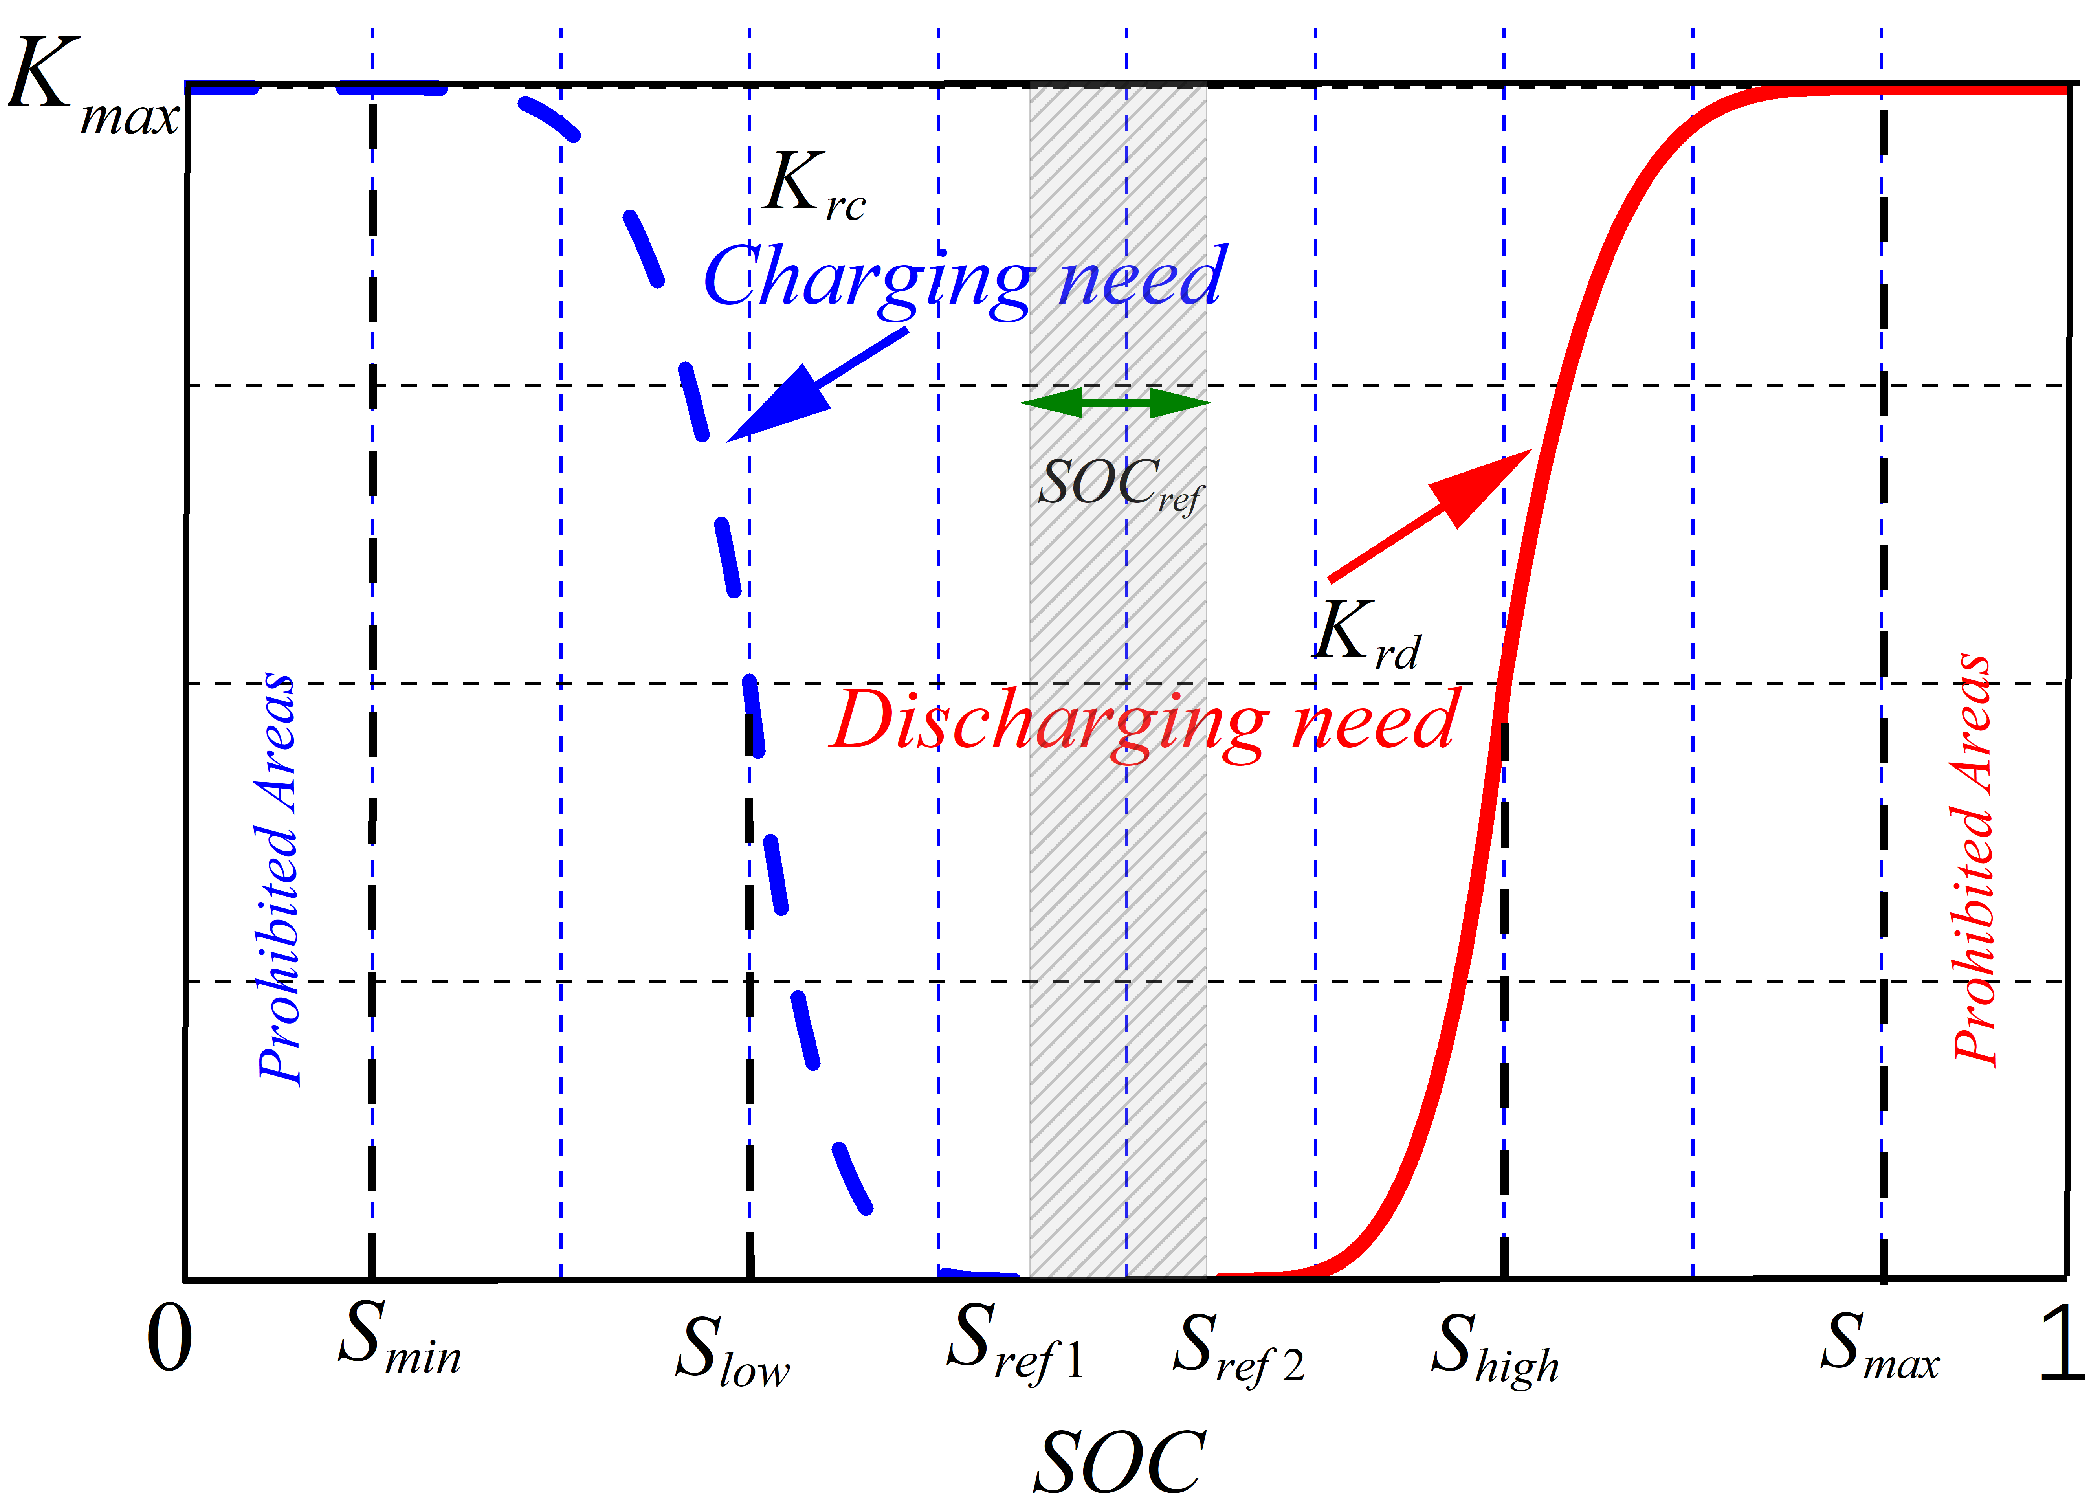
or for charging and discharging, based on the SOC, must ensure that the system frequency remains within the DB while considering SOC recovery. The values of the discharge constraint coefficient and the discharge constraint coefficient are determined according to Equations (19) and (20):
Figure 9 illustrates the close relationship between and the constraint coefficient. Taking as an example, the charging constrain coefficient exhibits a rapid decline when , and gradually slows down as it approaches the −, eventually reaching its zero value.
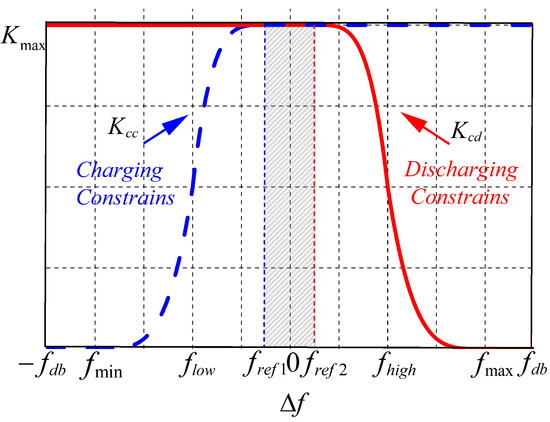
Figure 9.
SOC recovery constraint gain.
SOC recovery control using nonlinear functions to represent the SOC recovery demand coefficient and the SOC recovery constraint coefficient has the following benefits: Nonlinear functions can dynamically adjust the recovery coefficients based on SOC variations. For example, when the SOC deviates significantly from the ideal state, the recovery demand coefficient can increase rapidly. Conversely, as the SoC approaches the ideal state, the coefficient stabilizes, preventing excessive recovery actions and reducing unnecessary adjustments; nonlinear functions feature smooth transitions, avoiding abrupt changes in recovery demand or constraints, which could destabilize the system. When the SoC moves from one range to another, the nonlinear function ensures that the output changes continuously and gradually, enhancing control strategy stability.
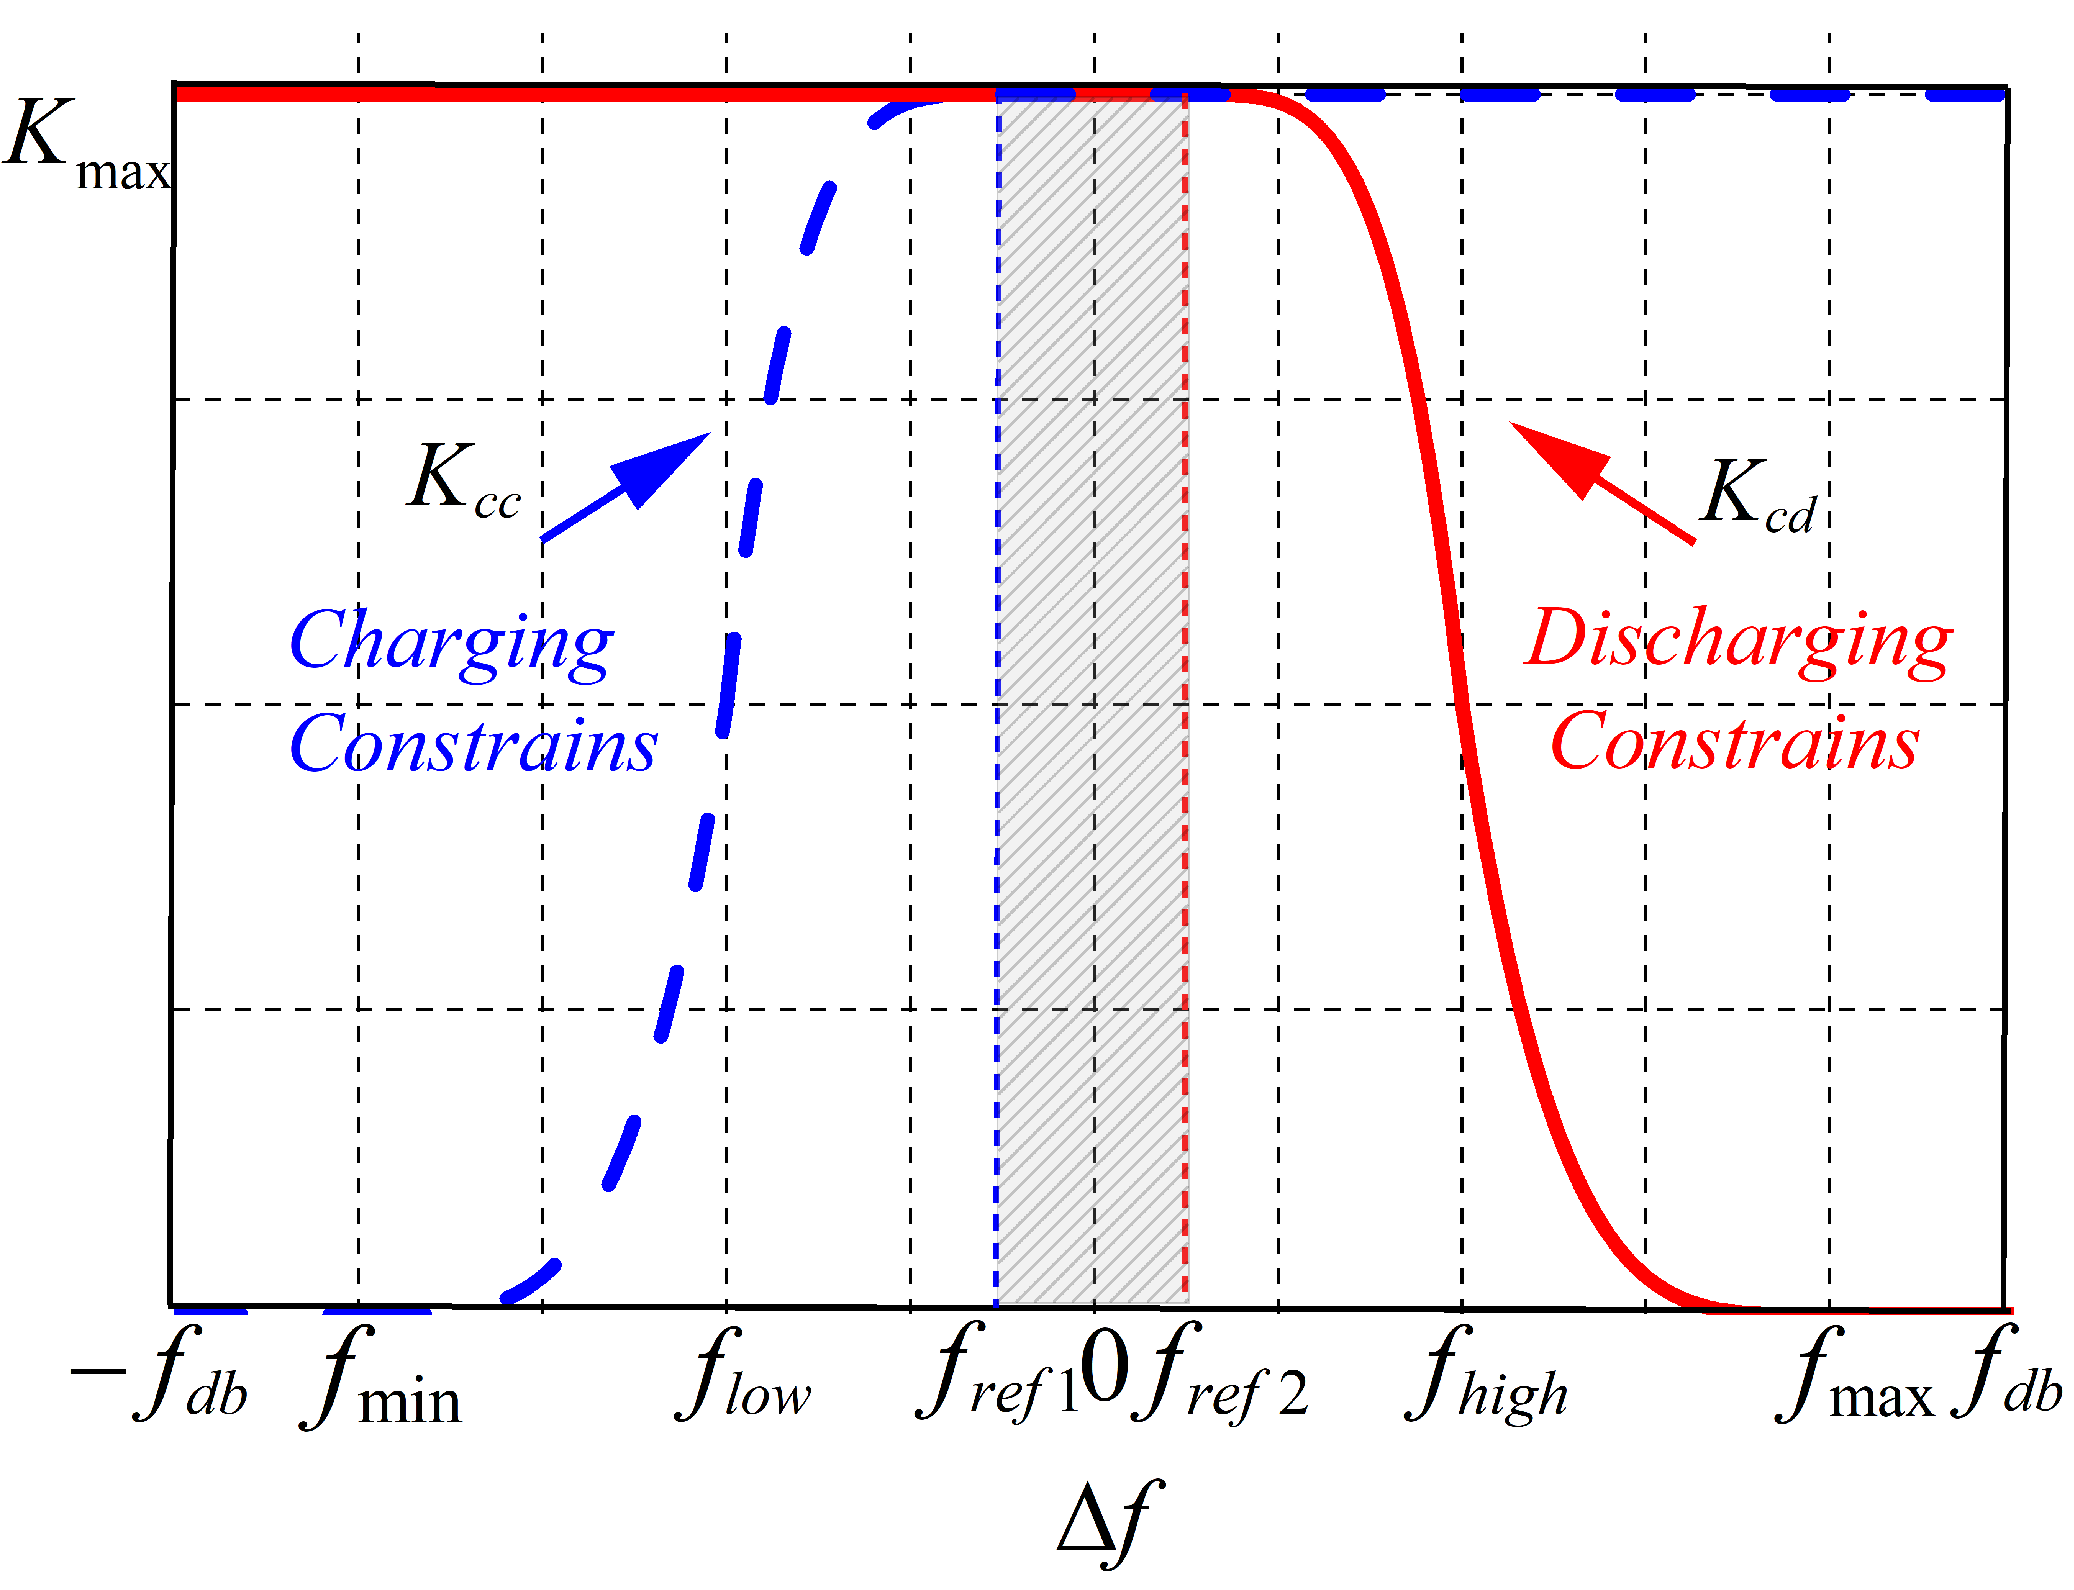
, , and , are placed in the same coordinate system for a horizontal comparison. Taking into account the SOC demand coefficients and the DB constraint coefficients, the smaller value between the recovery demand and the constraint is selected as the recovery coefficient . The calculation formula for is shown in Equation (21):
The relationship between and both the SOC and is illustrated in Figure 10.
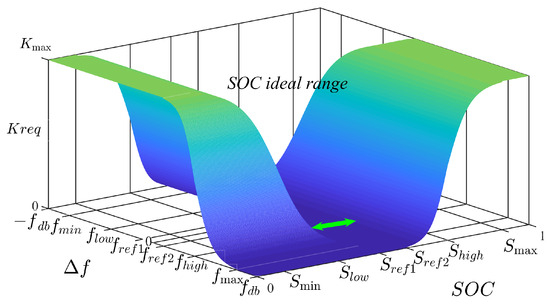
Figure 10.
SOC recovery gain.
Once the is determined, the recovery value of the BESS is calculated, thereby accomplishing the SOC restoration. The of BESS is shown as follows:
When is within the DB of the HESS and the SOC deviates from the ideal range, the SOC is restored using the calculated . Since the is determined by both the SOC recovery demand and the frequency deviation, the ensures that the SOC adjusts toward the ideal range, thereby enhancing the FR capability of the BESS for the next phase.
3. Integrated Strategy and Evaluating the Approach of an HESS Participating in PFR
To leverage the FR advantages of different ESSs, this section proposes the use of an HESS for PFR. First, the integrated strategy is analyzed to explore the activation timing of different strategies. Next, the FR DB for the HESS is defined. Finally, appropriate FR evaluation approaches are selected based on the validation requirements of the proposed strategy.
3.1. Overall Framework of Integrated PFR Strategy
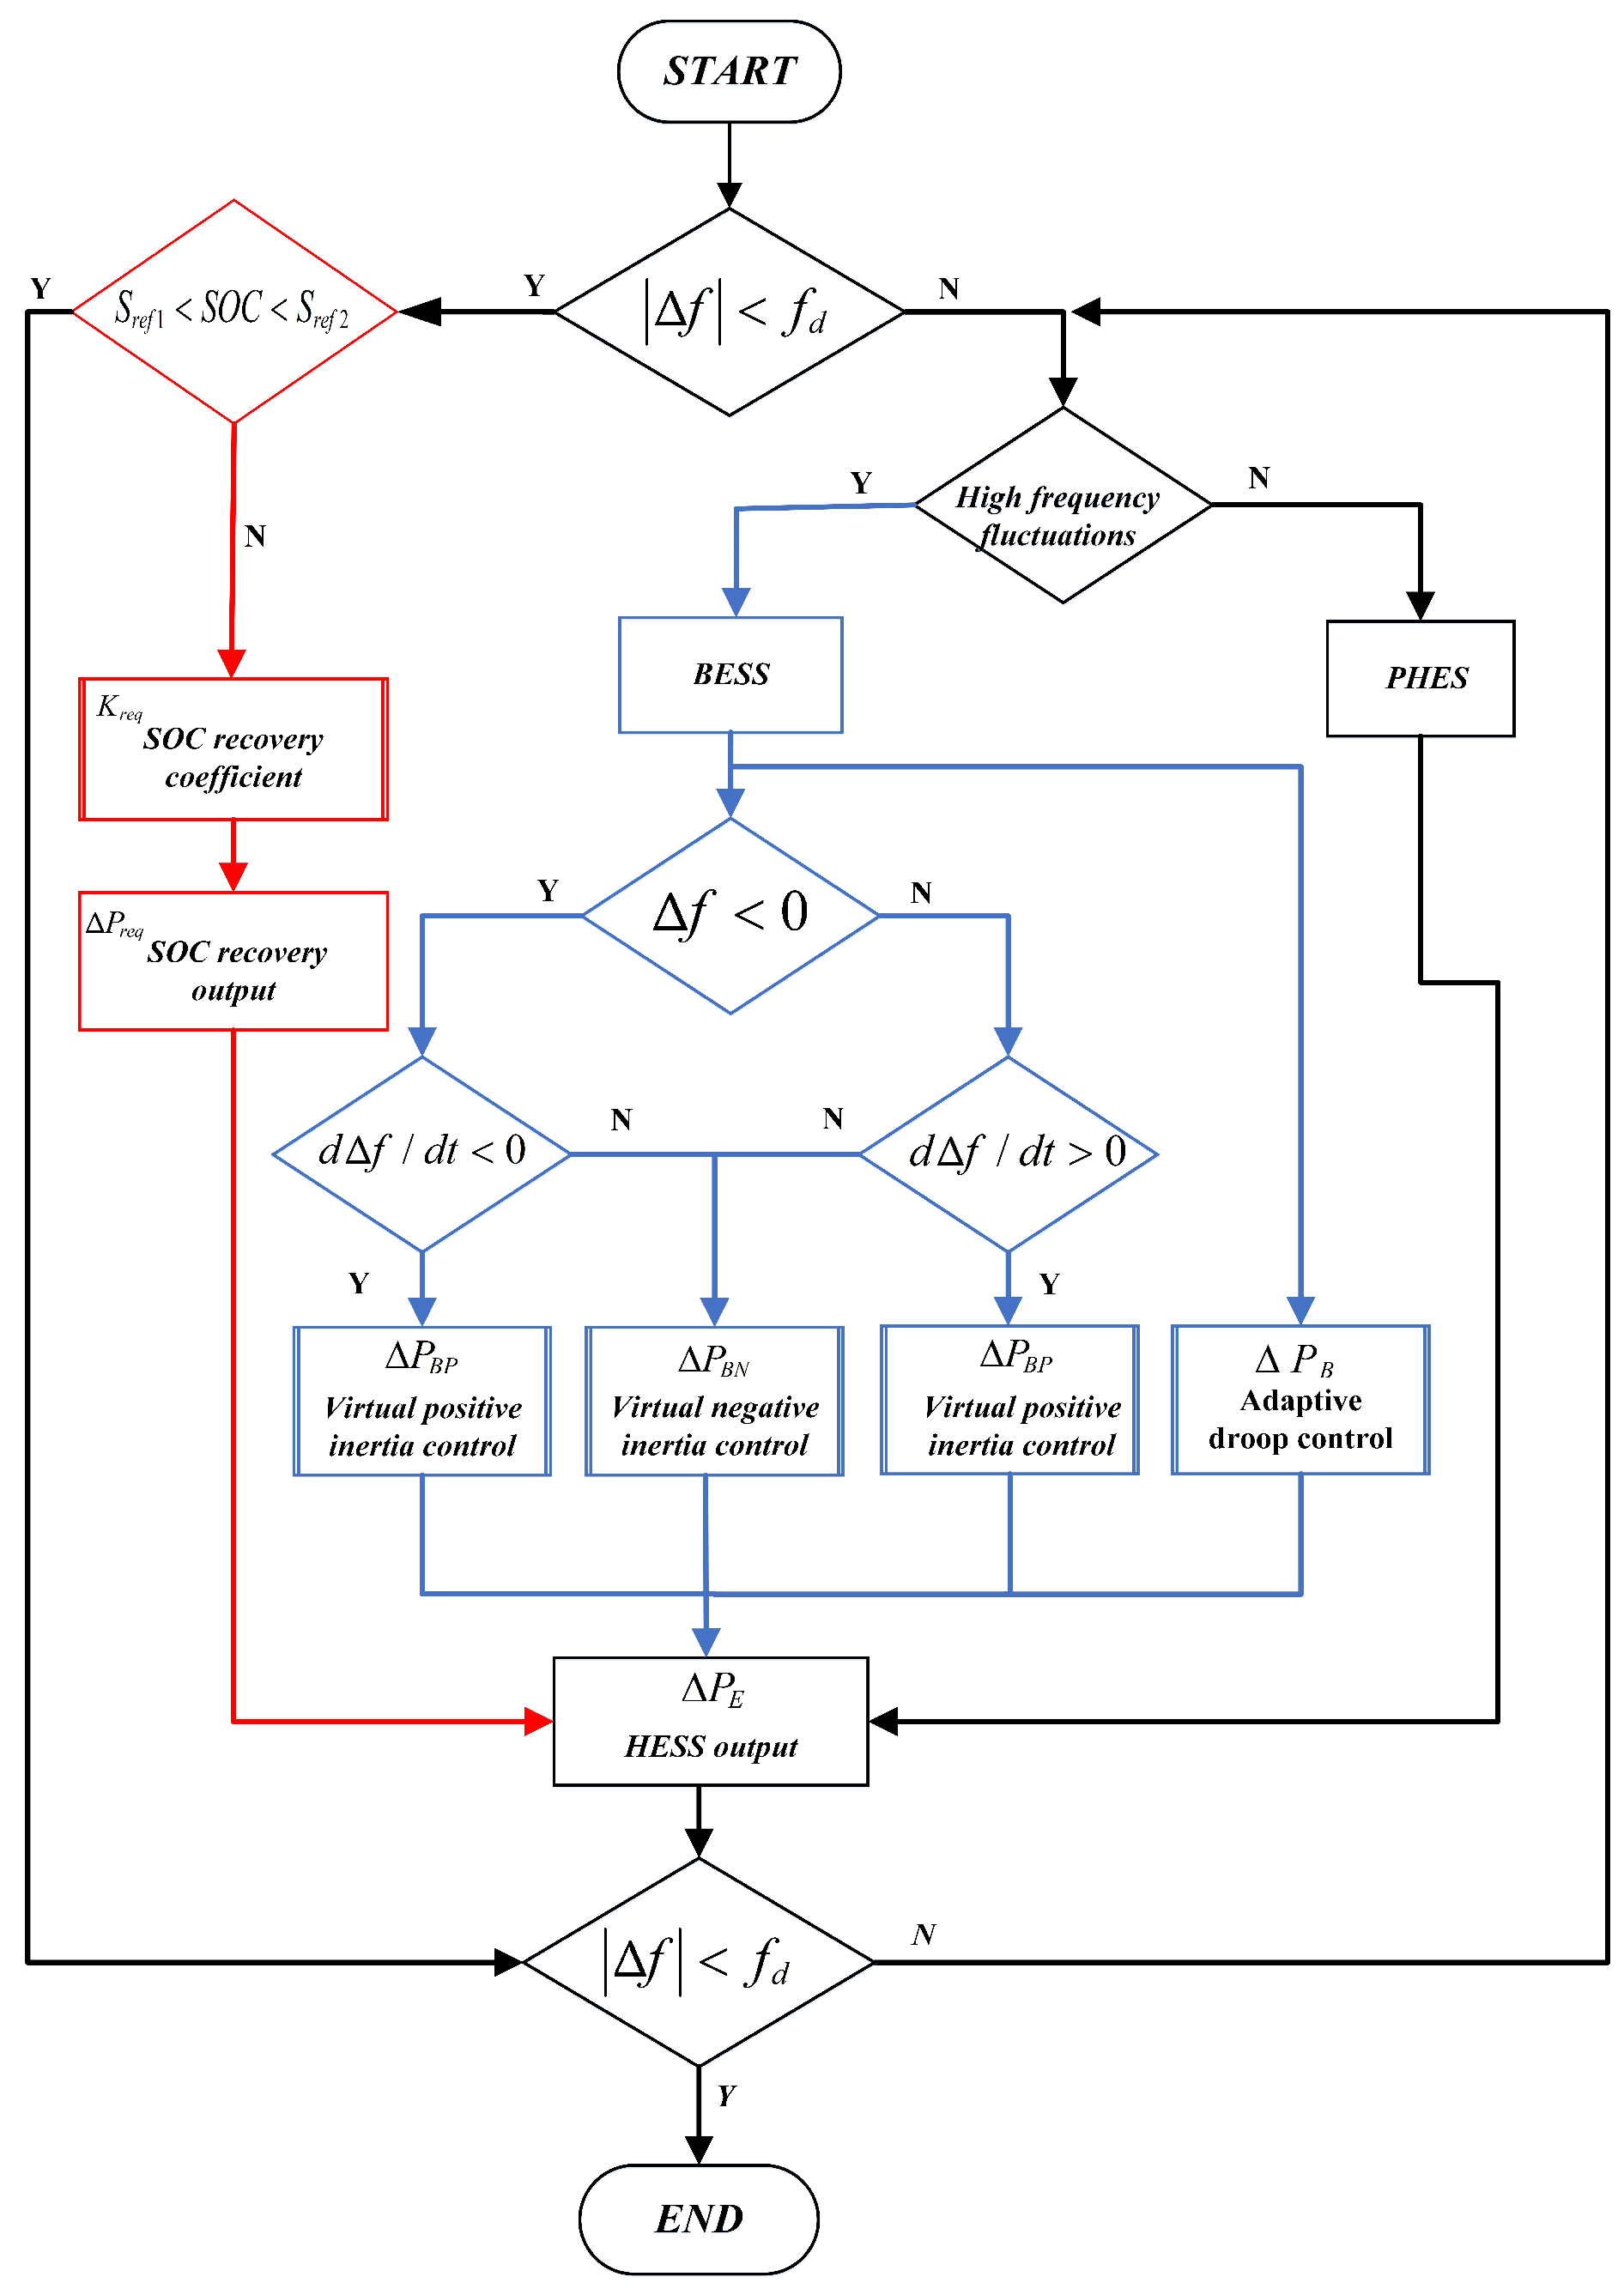
This paper proposes an integrated strategy for an HESS to participate in the PFR of a regional power grid. The flow chart is shown in Figure 11, and the detailed process is as follows:
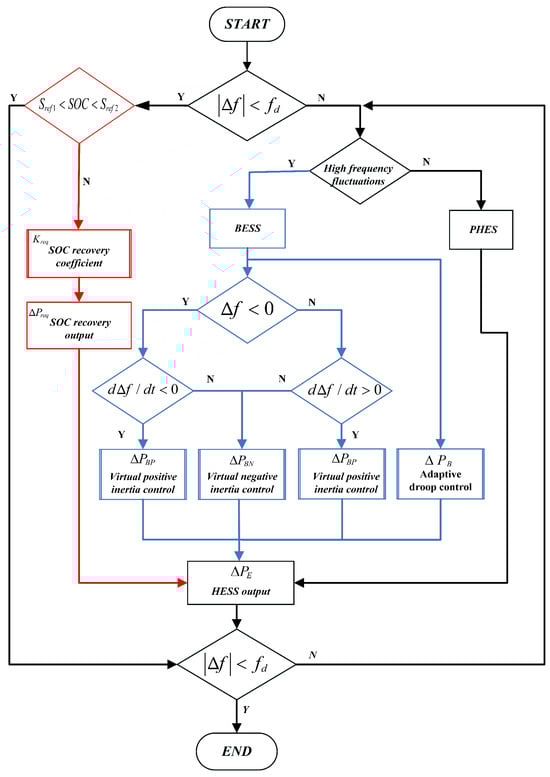
Figure 11.
Integrated strategy flowchart.
- (1)
- First, determine whether the fluctuation of the frequency of the system exceeds the DB of the HESS. If the frequency is within the DB (), the SOC recovery strategy is applied to optimize the SOC of the BESS.
- (2)
- When the HESS participates in PFR, the low-frequency components of frequency fluctuations are regulated by PHES, while the high-frequency components are managed by BESS. Where , during the initial stage of the disturbance, the rapid deterioration of the system frequency causes a significant frequency deviation (). Positive virtual inertia control is introduced, based on the degree of to improve the dynamic frequency characteristics. During the frequency recovery phase (), considering both the SOC and , negative virtual inertia control is implemented to accelerate the restoration of system frequency. Throughout the entire FR phase, the droop control output is dynamically adjusted based on the SOC variation trend, ensuring that the frequency approaches stability.
- (3)
- Finally, check whether and SOC are within reasonable ranges. If they are, the operation ends; if not, the next round of adjustment is initiated.
3.2. DB of HESS
Based on Figure 2, the frequency deviation of a system caused by comprehensive disturbance is as follows [29]:
To further explore the influence of the DB value of the HESS on the effectiveness of FR, the discussion is developed from the following two perspectives.
Case 1: The DB of the HESS is set to be identical to that of the CGU. When the frequency fluctuation within the CGU DB is observed, both the CGU and HESS do not participate in the FR, that is, both and are zero. Substituting this into the Equation (23), the characteristic of system frequency can be derived as follows:
Case 2: The HESS DB is limited within the CGU DB. When frequency fluctuations are within the DB of the CGU but exceed the DB of the HESS, the units do not participate in FR and = 0, while the HESS participates in FR. Substituting this into the Equation (23), the characteristic of system frequency can be derived as follows:
3.3. FR Allocation Strategy
When the HESS participates in FR, the BESS features a high short-term charge and discharge power, while PHES with a larger capacity can provide a stable power output over longer periods, helping maintain or restore the frequency of the system. To mitigate the impact of fluctuations at different frequencies on the FR performance of the HESS, it is necessary to linearly decompose the frequency deviation signal to obtain high-frequency and low-frequency components, and allocate them separately to the BESS and PHES.
Initially, a high-pass filter is used to process the frequency command value , extracting the high-frequency fluctuation as the frequency command for the BESS. Subsequently, the remaining part serves as the frequency command for the PHES [39]. The frequency characteristic equations of the three aspects mentioned above are shown in Equations (26) and (27):
where represents the time constant of the high-pass filter, which should be set based on the desired FR performance and the capacity of the HESS.
Considering Equations (26) and (27) and considering as the computational step size, we can obtain
From Equations (28) and (29), the frequency command for the BESS changes rapidly with , exhibiting high-frequency fluctuation characteristics; meanwhile, changes slowly in response to .
In summary, the linear decomposition of the frequency signals of the grid using a first-order filter is a simple and efficient method. The signals passing through the filter are primarily high-frequency components, which are allocated to the BESS for proper coordination, while the remaining components are handled by the PHES. For different types of disturbance, even if a small number of low-frequency components are present in the BESS operation, its fast response capability ensures effective regulation.
3.4. Evaluating the Approach of PFR
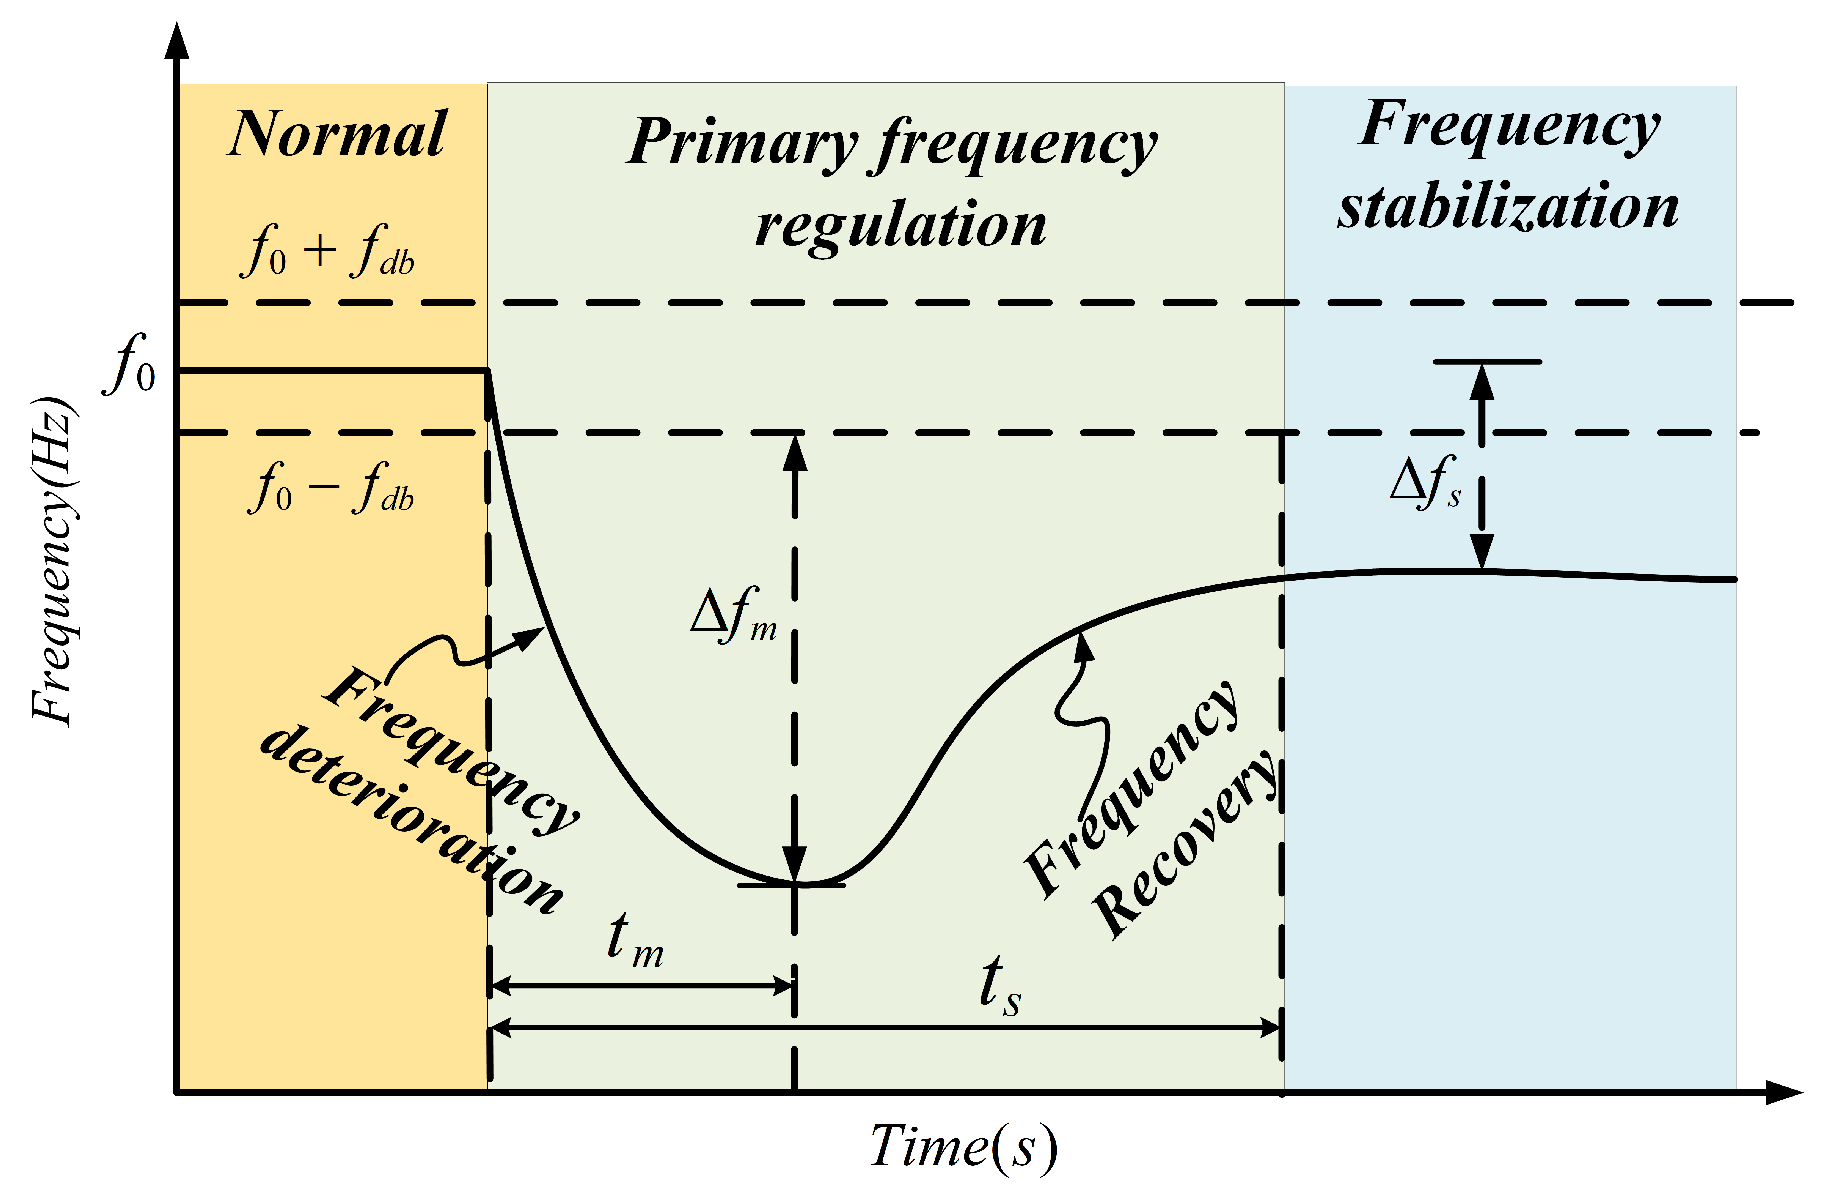
The PFR process is shown in Figure 12 and the corresponding FR indices for different types of disturbance are proposed as follows.
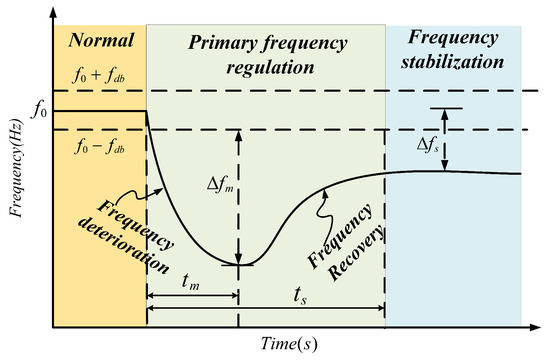
Figure 12.
Diagram of PFR of the power grid.
3.4.1. Step Disturbance
Step disturbances usually correspond to sudden switching on or off of large-capacity loads or disconnecting large-capacity power generation equipment from the power grid. The main FR evaluation indicators are the following: the maximum frequency deviation is ; steady-state frequency deviation is ; represents the time at ; and the total time from the onset of a disturbance to the stabilization of the frequency is denoted . Consequently, the rate of frequency decline can be defined as [40]:
Based on the aforementioned metrics, is defined as the frequency recovery rate [40]:
A smaller indicates a lower maximum frequency deviation, which indicates superior FR performance. A lower denotes a slower rate of system frequency drop, again implying enhanced FR effectiveness. Furthermore, a reduced alongside an increase suggests improved frequency restoration capabilities, indicating better FR effects.
3.4.2. Continuous Disturbance
We introduce to represent the peak-to-valley value of the frequency of the power grid. While verifying the FR effect of the HESS, the maintenance of BESS capacity is also considered, introducing the root mean square of frequency and SOC as the evaluation metric. These reflect the degree of deviation in the frequency and SOC from their respective reference value, as given by [40]:
From Equations (32) and (33), and represent the frequency index and SOC index, respectively, with being the power grid’s nominal frequency of 50 Hz; is set to 0.5. The smaller the values of , , and are, the better the FR performance and the maintenance of SOC.
4. Simulation Results and Discussion
4.1. DB of HESS
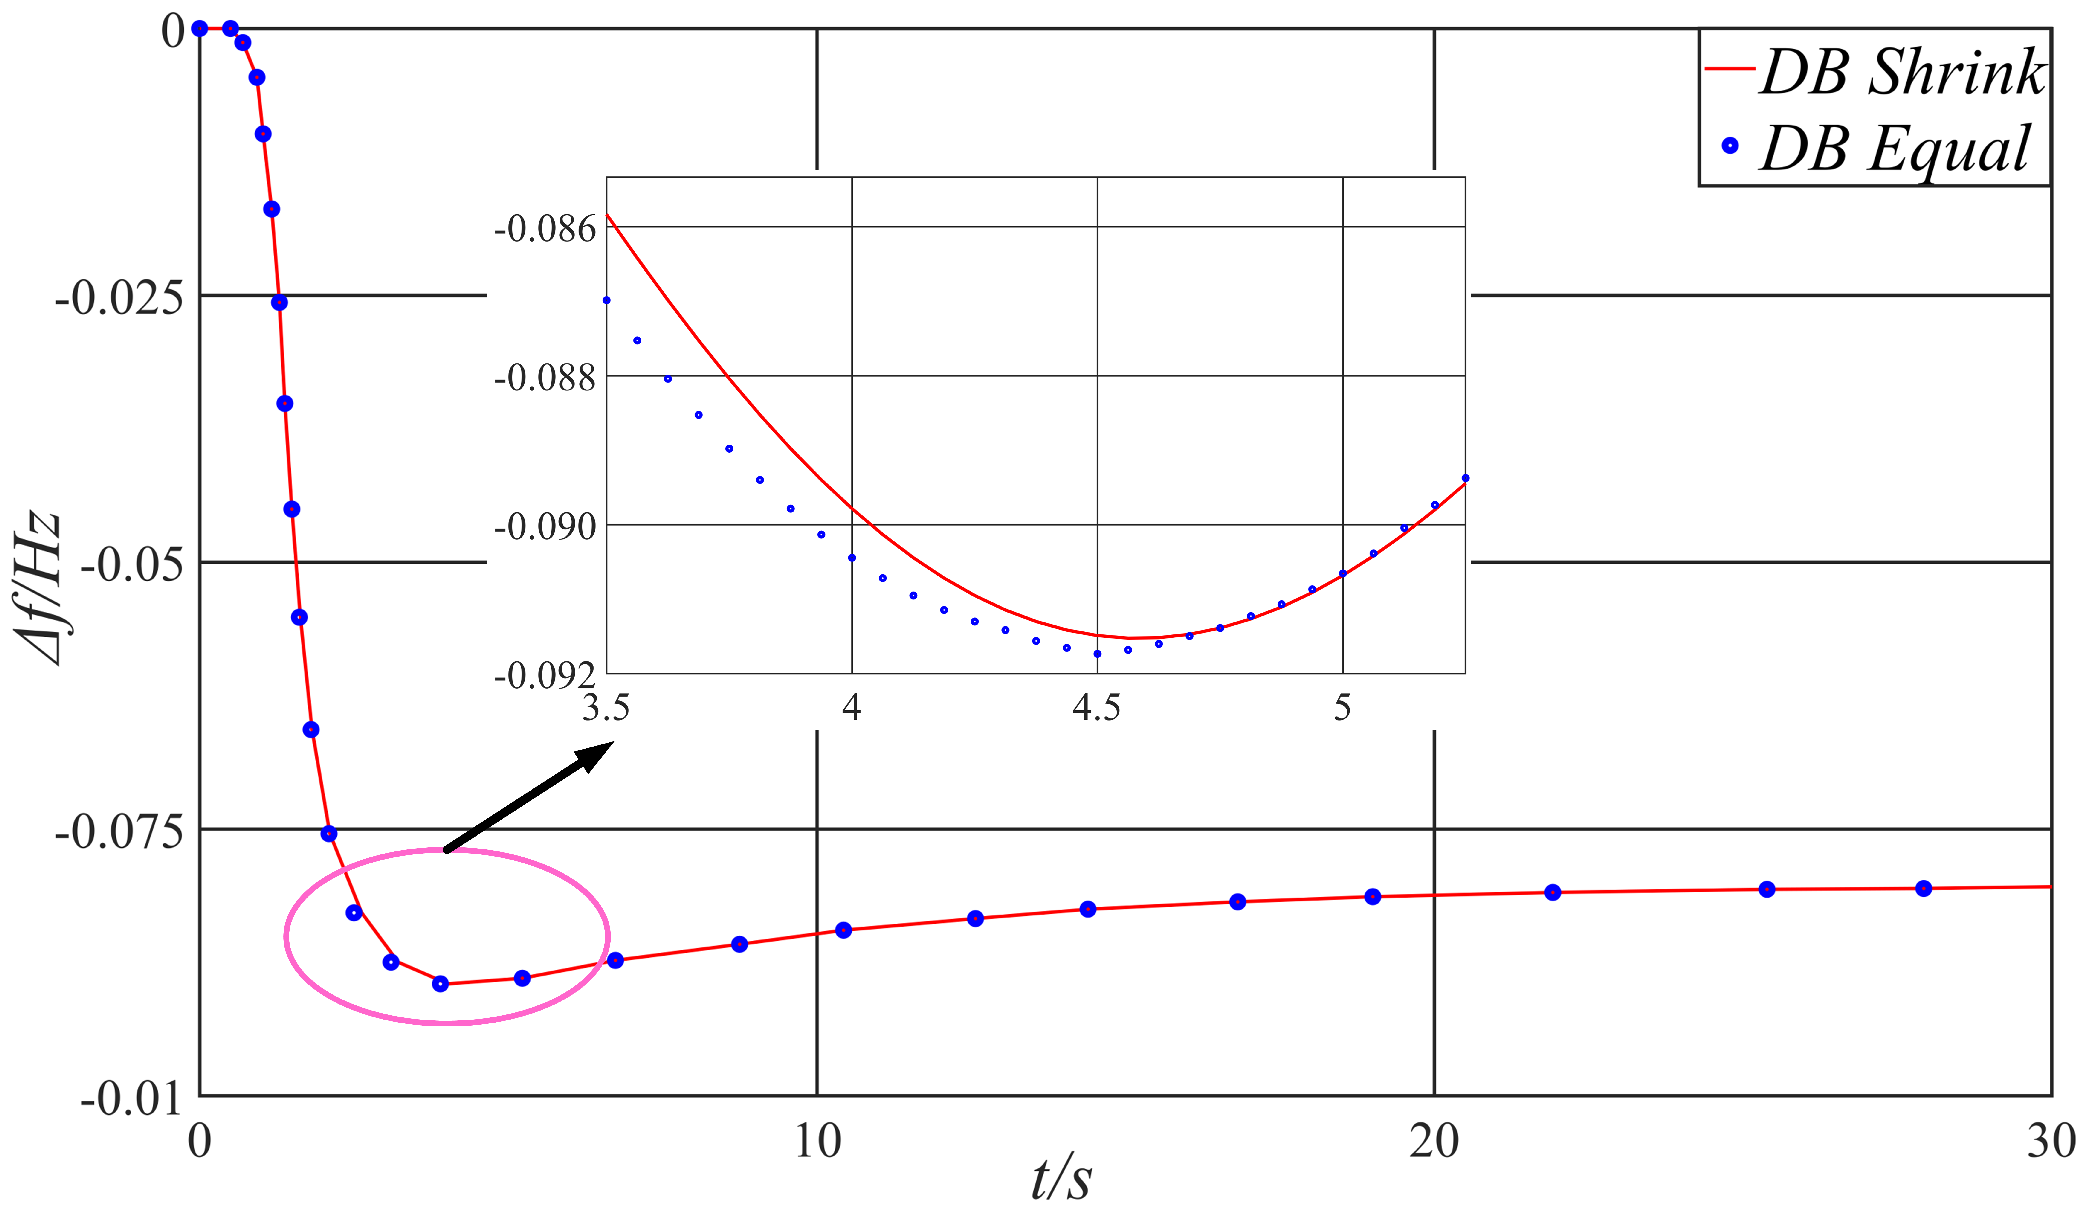
For the setting of the DB for energy storage systems on PFR performance, some studies have used the DB of CGU (1 DB) as a reference and experimentally determined that the optimal DB for the BESS to participate in PFR of the power system is 0.6 DB. Considering that the response characteristics of PHES are slower than those of the BESS, this study sets the DB for the HESS to 0.7 DB (0.0231 Hz) and conducts corresponding experimental verification.
To verify the impact of setting the DB for the HESS on PFR performance, a 0.05 p.u. step disturbance was set at 0.5 s. The better FR performance of the HESS’s DB being 70% of the CGUs compared with the HESS having the same DB as the CGUs will be clearly demonstrated. The curve of the is shown in Figure 13.
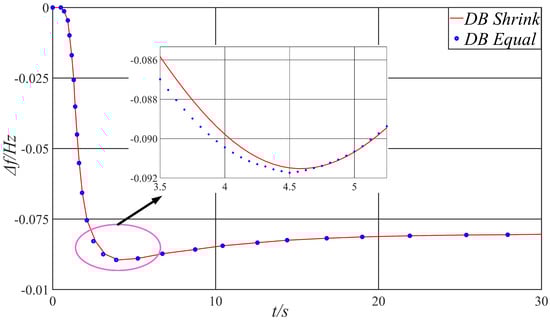
Figure 13.
Frequency variation curves under different DBs of HESS.
Here, it can be inferred that the configuration in results in a reduction of . In Table 2, the caused by different levels of disturbance is depicted. It is evident that when the disturbance level is 0.03 p.u., reducing the DB can increase by 15%. In summary, setting the DB of the HESS within the DB of the CGU can further improve the FR performance of the HESS. Moreover, the smaller the disturbance, the more significant the FR effect.
Table 2.
Maximum frequency deviation under different disturbances from load.
4.2. Step Disturbance
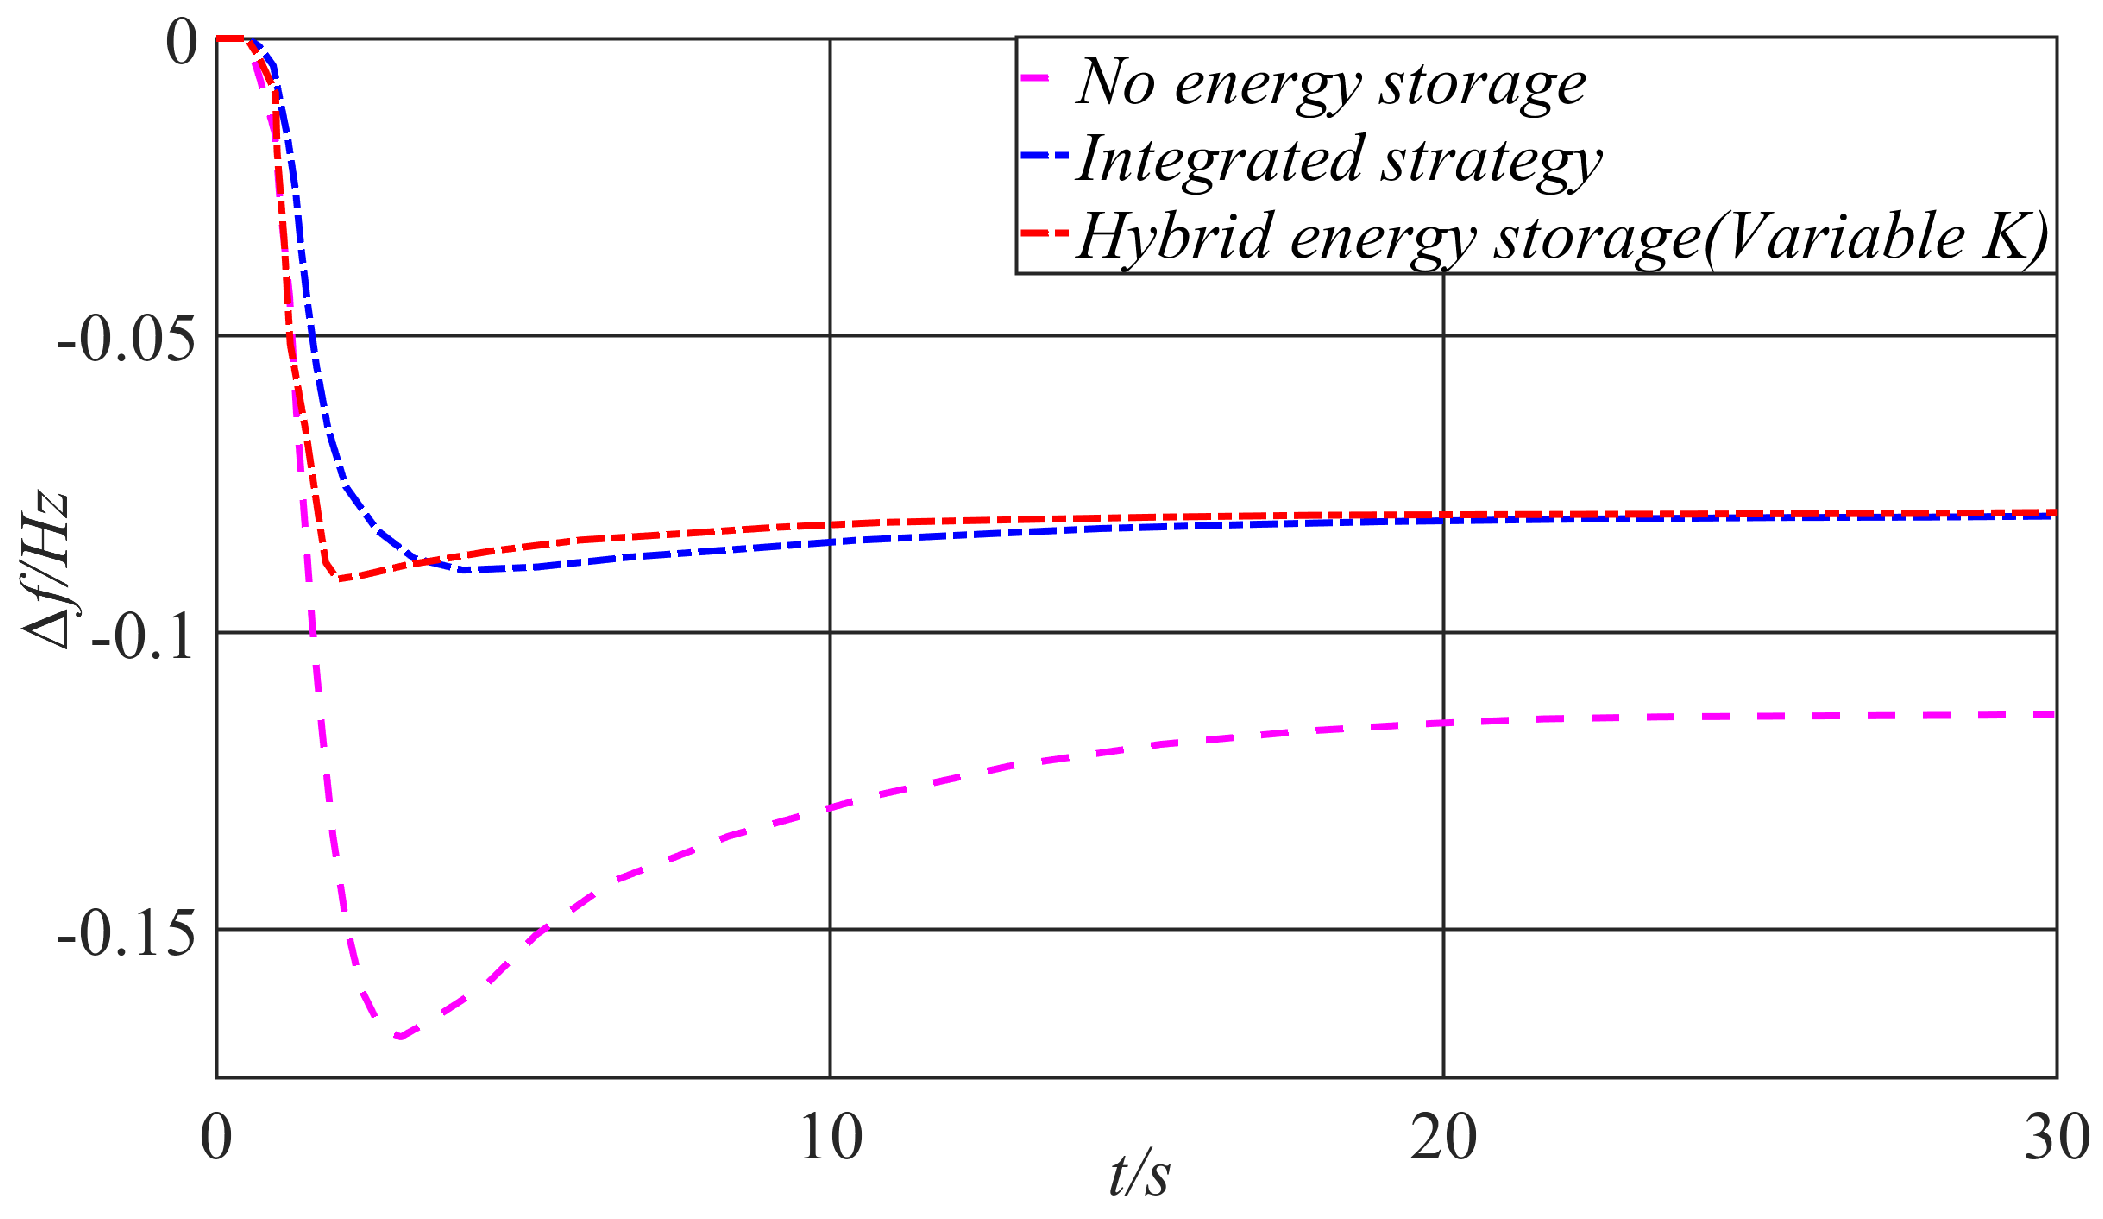
In summary, for all the following experiments, the DB of FR for the HESS is set to ±0.0231 Hz, with the rated frequency of the grid being 50 Hz. Under step disturbance, the FR results are compared among three strategies: the integrated strategy, without energy storage, and the combination of PHES and BESS with the traditional variable K. The performance of the and SOC is shown in Table 3, Figure 14 and Figure 15.
Table 3.
FR evaluation index under step disturbance.
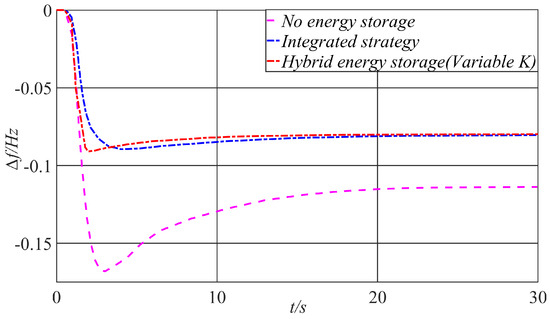
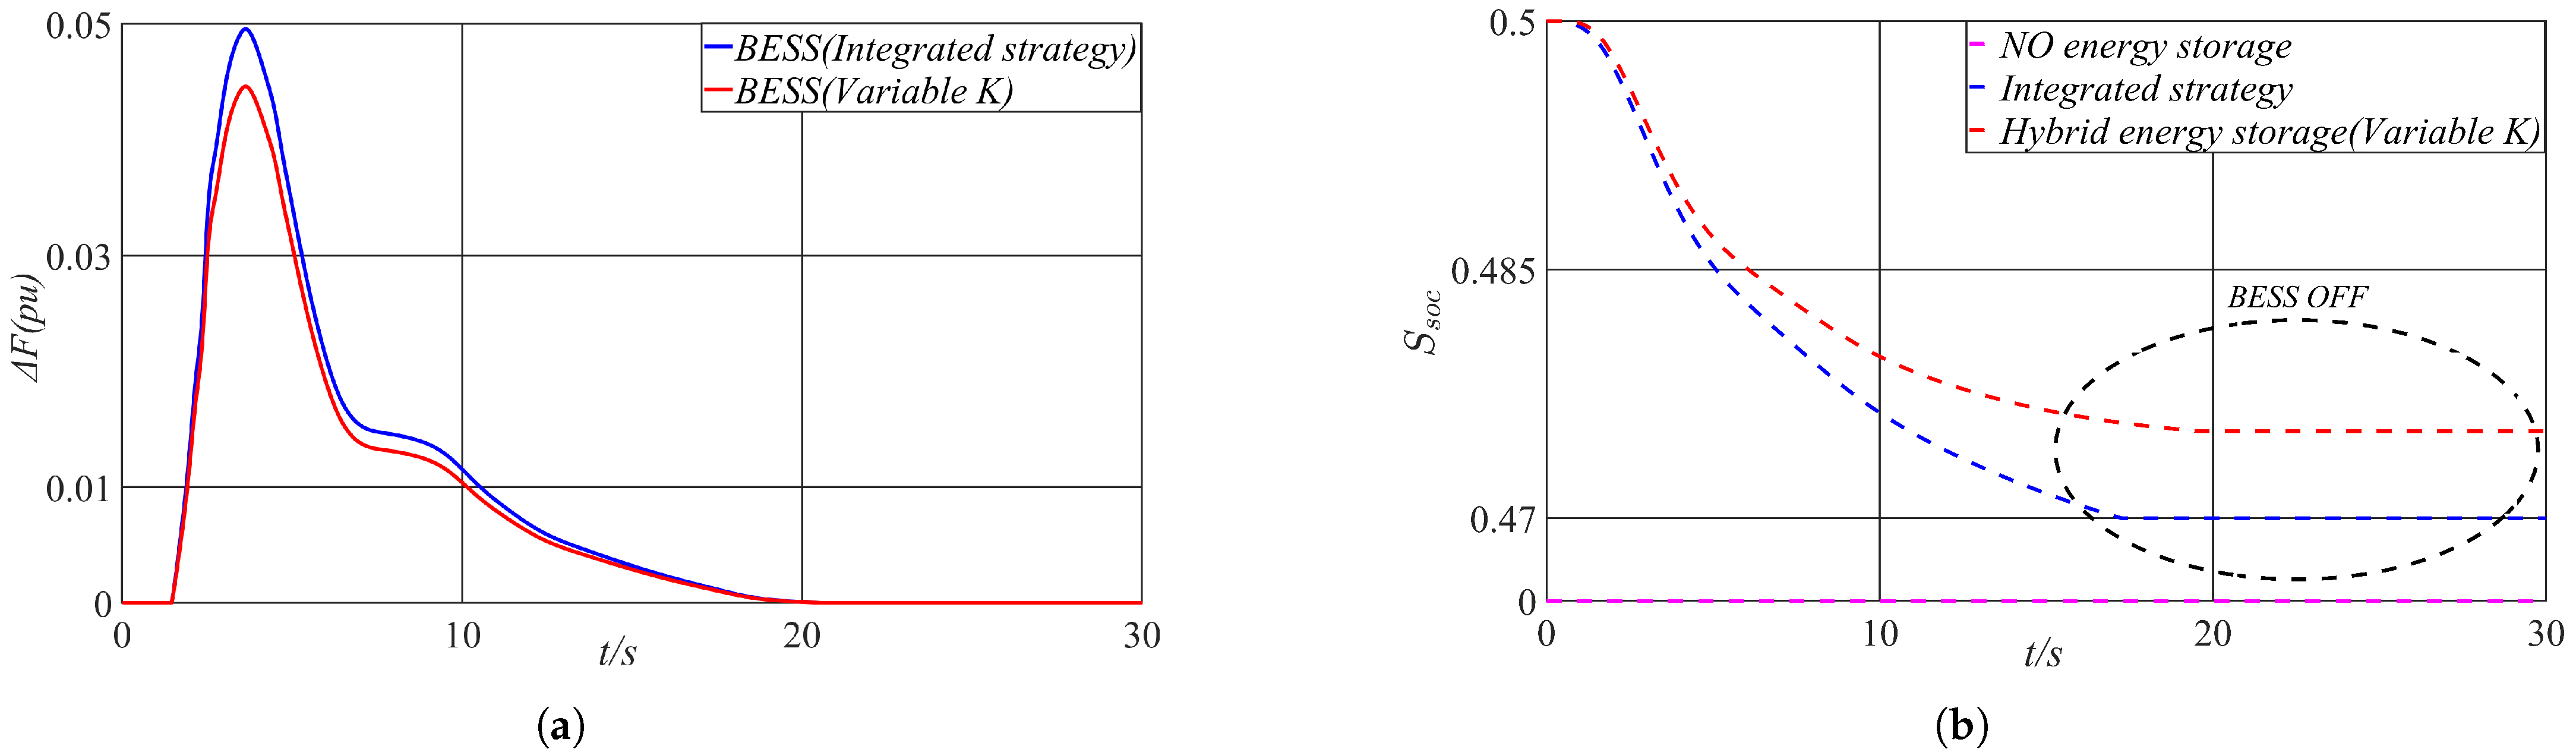
Figure 14.
Frequency variation under step load disturbance.
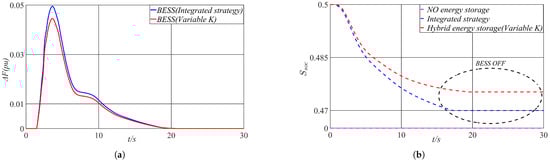
Figure 15.
The relationship between output and SOC under different BESS strategies. (a) Output of BESS under step load disturbance. (b) SOC curve under step load disturbance.
From Figure 14, it can be observed that under the influence of step disturbances, the frequency of the system deteriorates the fastest in the no-energy-storage strategy. The and after the disturbance are both larger in the other two strategies. The calculations in Table 3 show that the HESS (variable K) reduces the , , and by 45.11%, 34.95%, and 36.42%, respectively, compared to the no-energy-storage strategy. This indicates that the introduction of additional droop control and inertia control during the FR phase with the HESS effectively enhances the FR performance of the system. The proposed integrated strategy reaches the maximum frequency point more slowly than the HESS (variable K). According to Table 3, the and of the integrated strategy improve by 6.74% and 16.66%, respectively, compared to the HESS (variable K). This demonstrates that the adaptive droop control and positive/negative virtual inertia control of the BESS in the integrated strategy provide a more efficient output response when the SOC is in the ideal range, further improving the FR performance.
Based on Figure 15a,b, it can be inferred that the integrated strategy provides a relatively stable SOC maintenance effect compared to the HESS (variable K). At the moment of load switch, exhibits high-frequency fluctuations, with the BESS responding quickly to changes in the grid frequency. In the latter half, the high-frequency fluctuations gradually decrease until the frequency stabilizes. The BESS then exits the PFR, resulting in both SOC curves eventually stabilizing, with PHES providing sustained power and frequency support. The output of various energy storage methods is relatively similar, leading to only minor differences in the SOC, and the changes in the SOC are not significant. When the initial SOC is 0.5, the integrated strategy demonstrates clear advantages over other methods, effectively maintaining the SOC while improving the FR performance.
4.3. Continuous Load Disturbance
As shown in Table 4 and Figure 16 and Figure 17b, the frequency deviation and the SOC variation under continuous disturbance conditions are presented for the three modes. The initial SOC value is 0.5 and the duration of the disturbance is 400 s.
Table 4.
FR evaluation index under continuous disturbance.
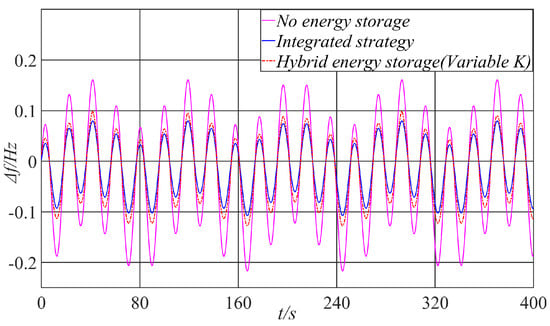
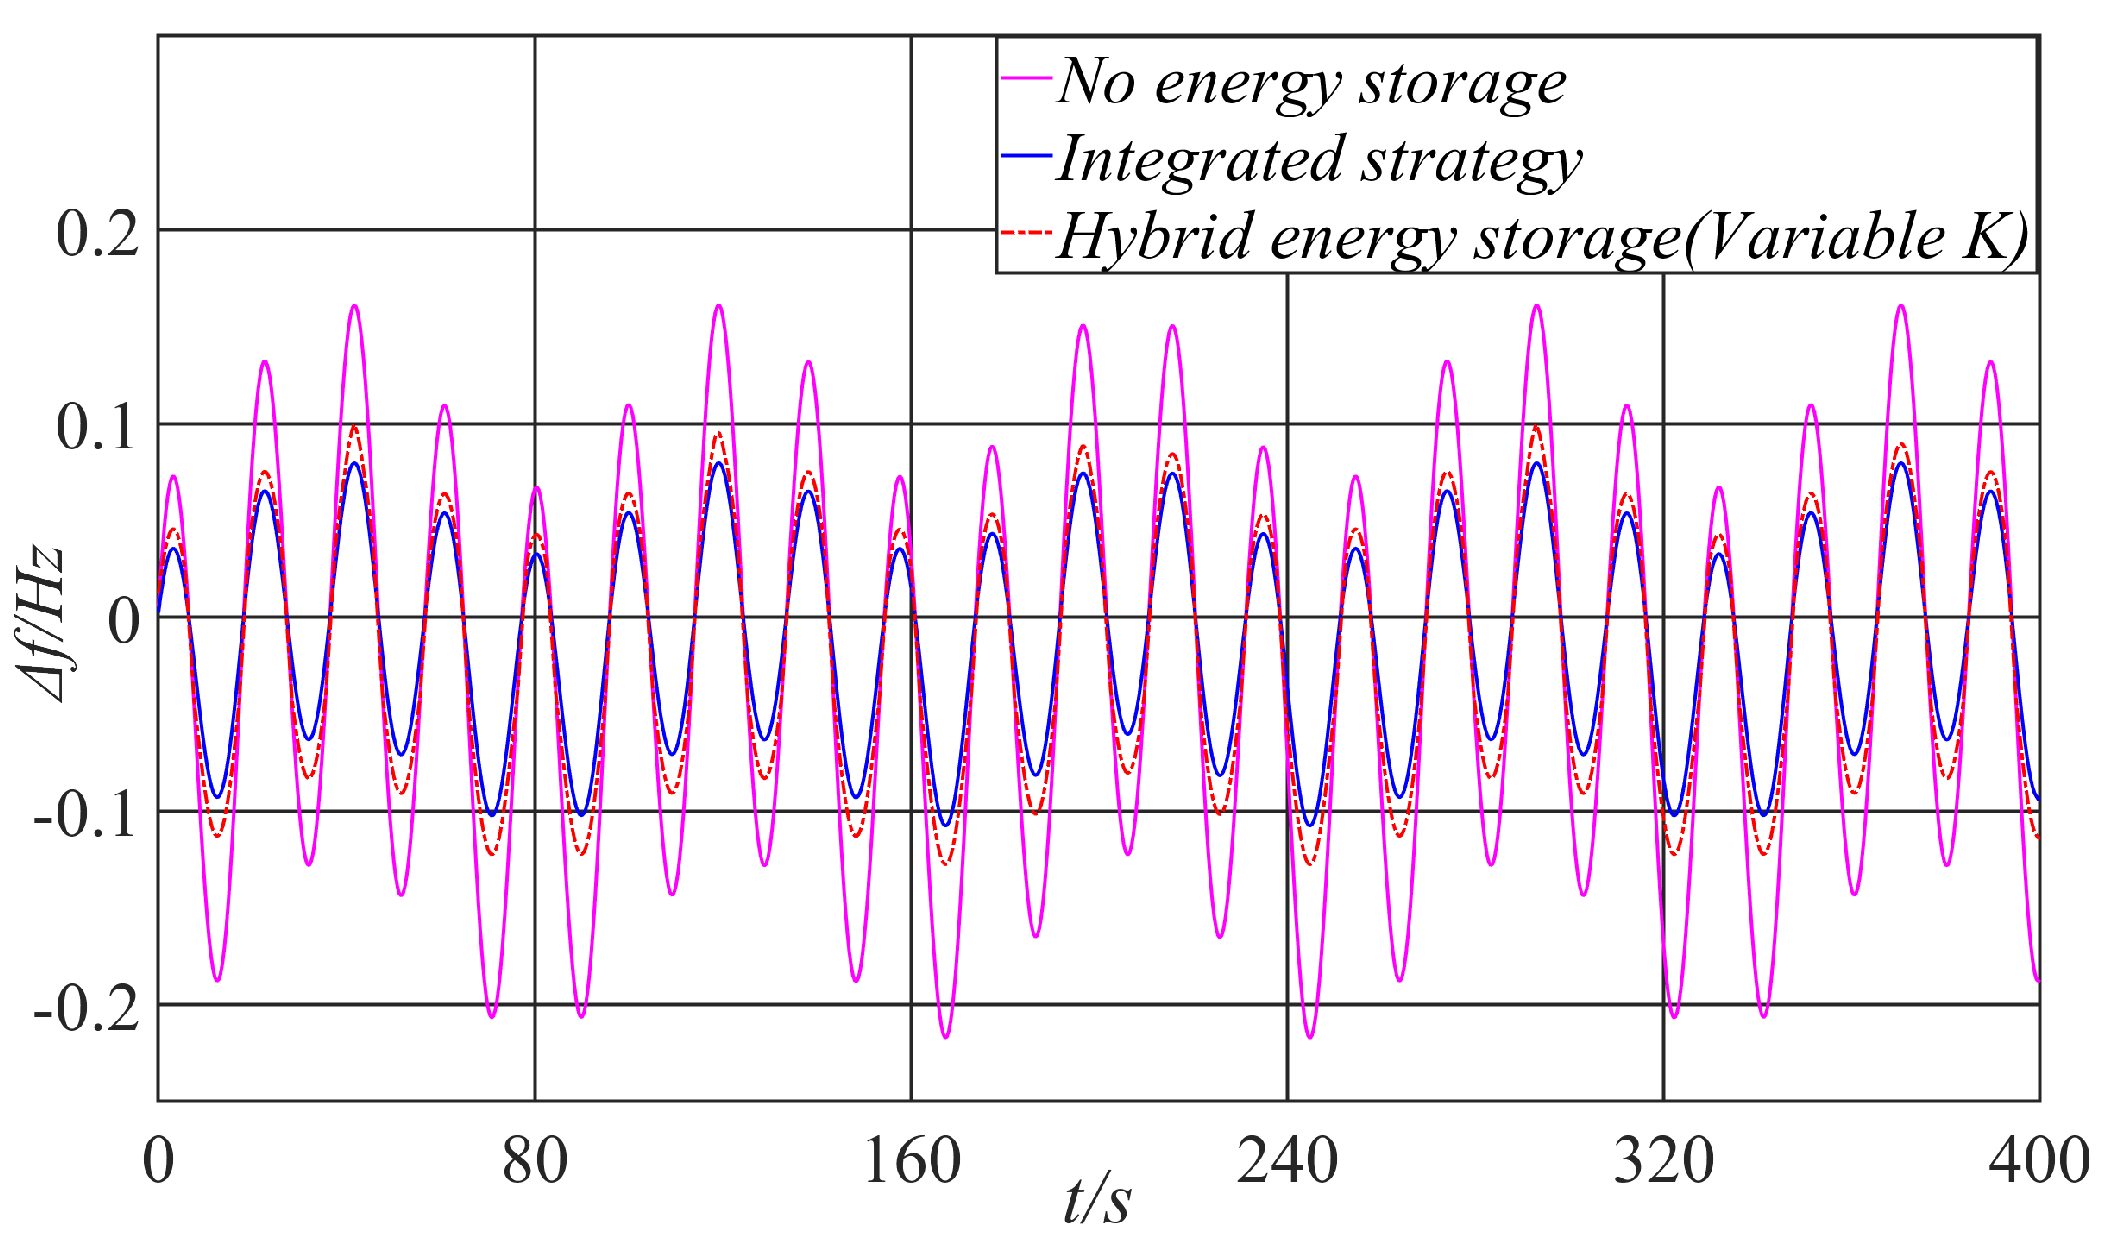
Figure 16.
Frequency deviation curve under 400 s continuous load disturbance.

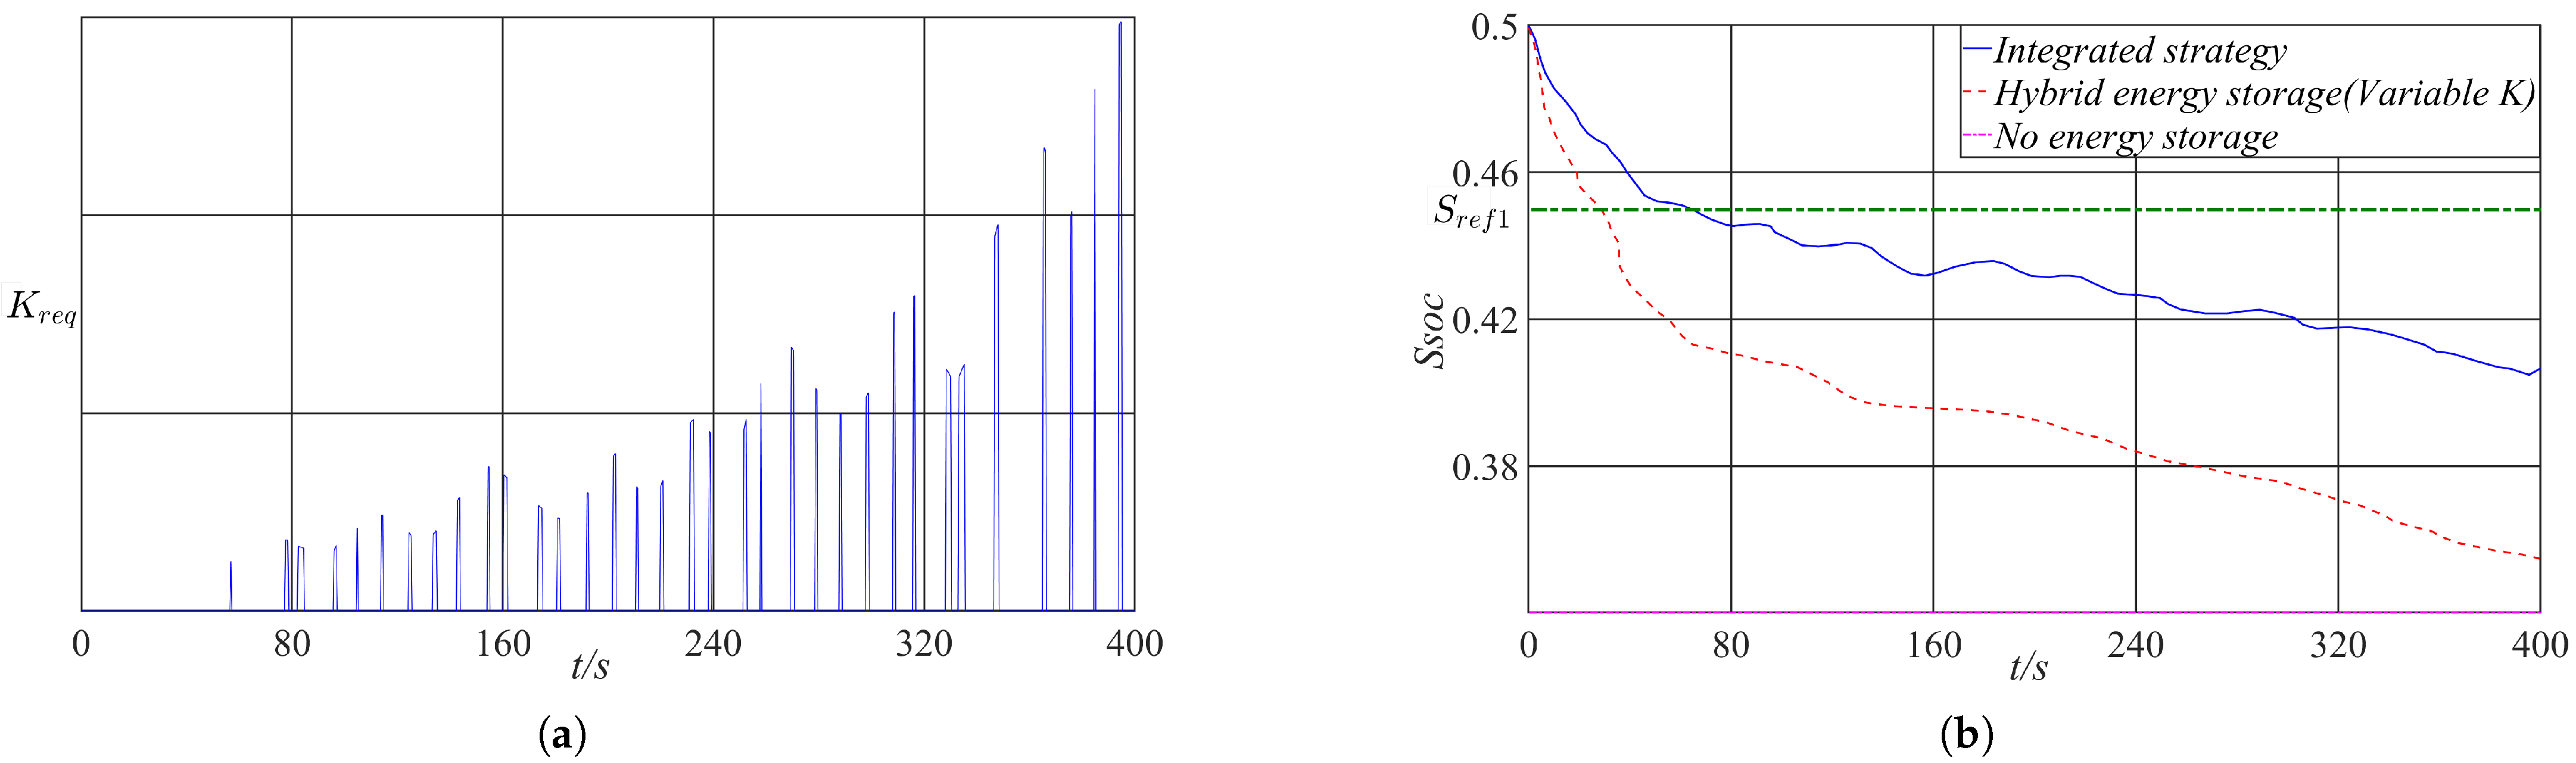
Figure 17.
The relationship between recovery coefficient and SOC. (a) Recovery coefficient under 400 s continuous load disturbance. (b) SOC curve under 400 s continuous load disturbance.
From Figure 16, it can be observed that under continuous load disturbances, the system frequency fluctuates, with the frequency fluctuation being significantly larger in the no-energy-storage strategy. The calculations in Table 4 show that the of the integrated strategy is reduced by 58.31% compared to that without energy storage, and the is reduced by 57.8%, demonstrating that the integration of the HESS significantly improves FR performance. Compared to the HESS (variable K), the integrated strategy reduces the by 23.22% and the by 26.43%. This improvement is attributed to the coordinated integration of adaptive droop control, virtual inertia control, and SOC recovery strategies in the integrated strategy, enabling the HESS to achieve superior FR performance under continuous load fluctuations.
Due to continuous disturbances, maintenance of the SOC of the BESS has become a focal point of interest. Under the integrated strategy, the frequency of the power grid remains within the DB of the HESS approximately 11.4% of the time, providing a certain recovery period of the SOC for the BESS during the FR phase. As shown in Figure 17a, the SOC recovery coefficient () is activated only when the frequency of the grid is within the HESS DB and the SOC is less than . Furthermore, as the SOC progressively decreases, the charge shows a gradual increasing trend. As indicated in Figure 17b, under the integrated strategy, the is approximately 52% better than that of the HESS (variable K). Based on the analysis presented above, the integrated strategy proposed in this document meets the requirements, demonstrates improved FR performance while maintaining the SOC, and possesses significant practical engineering value.
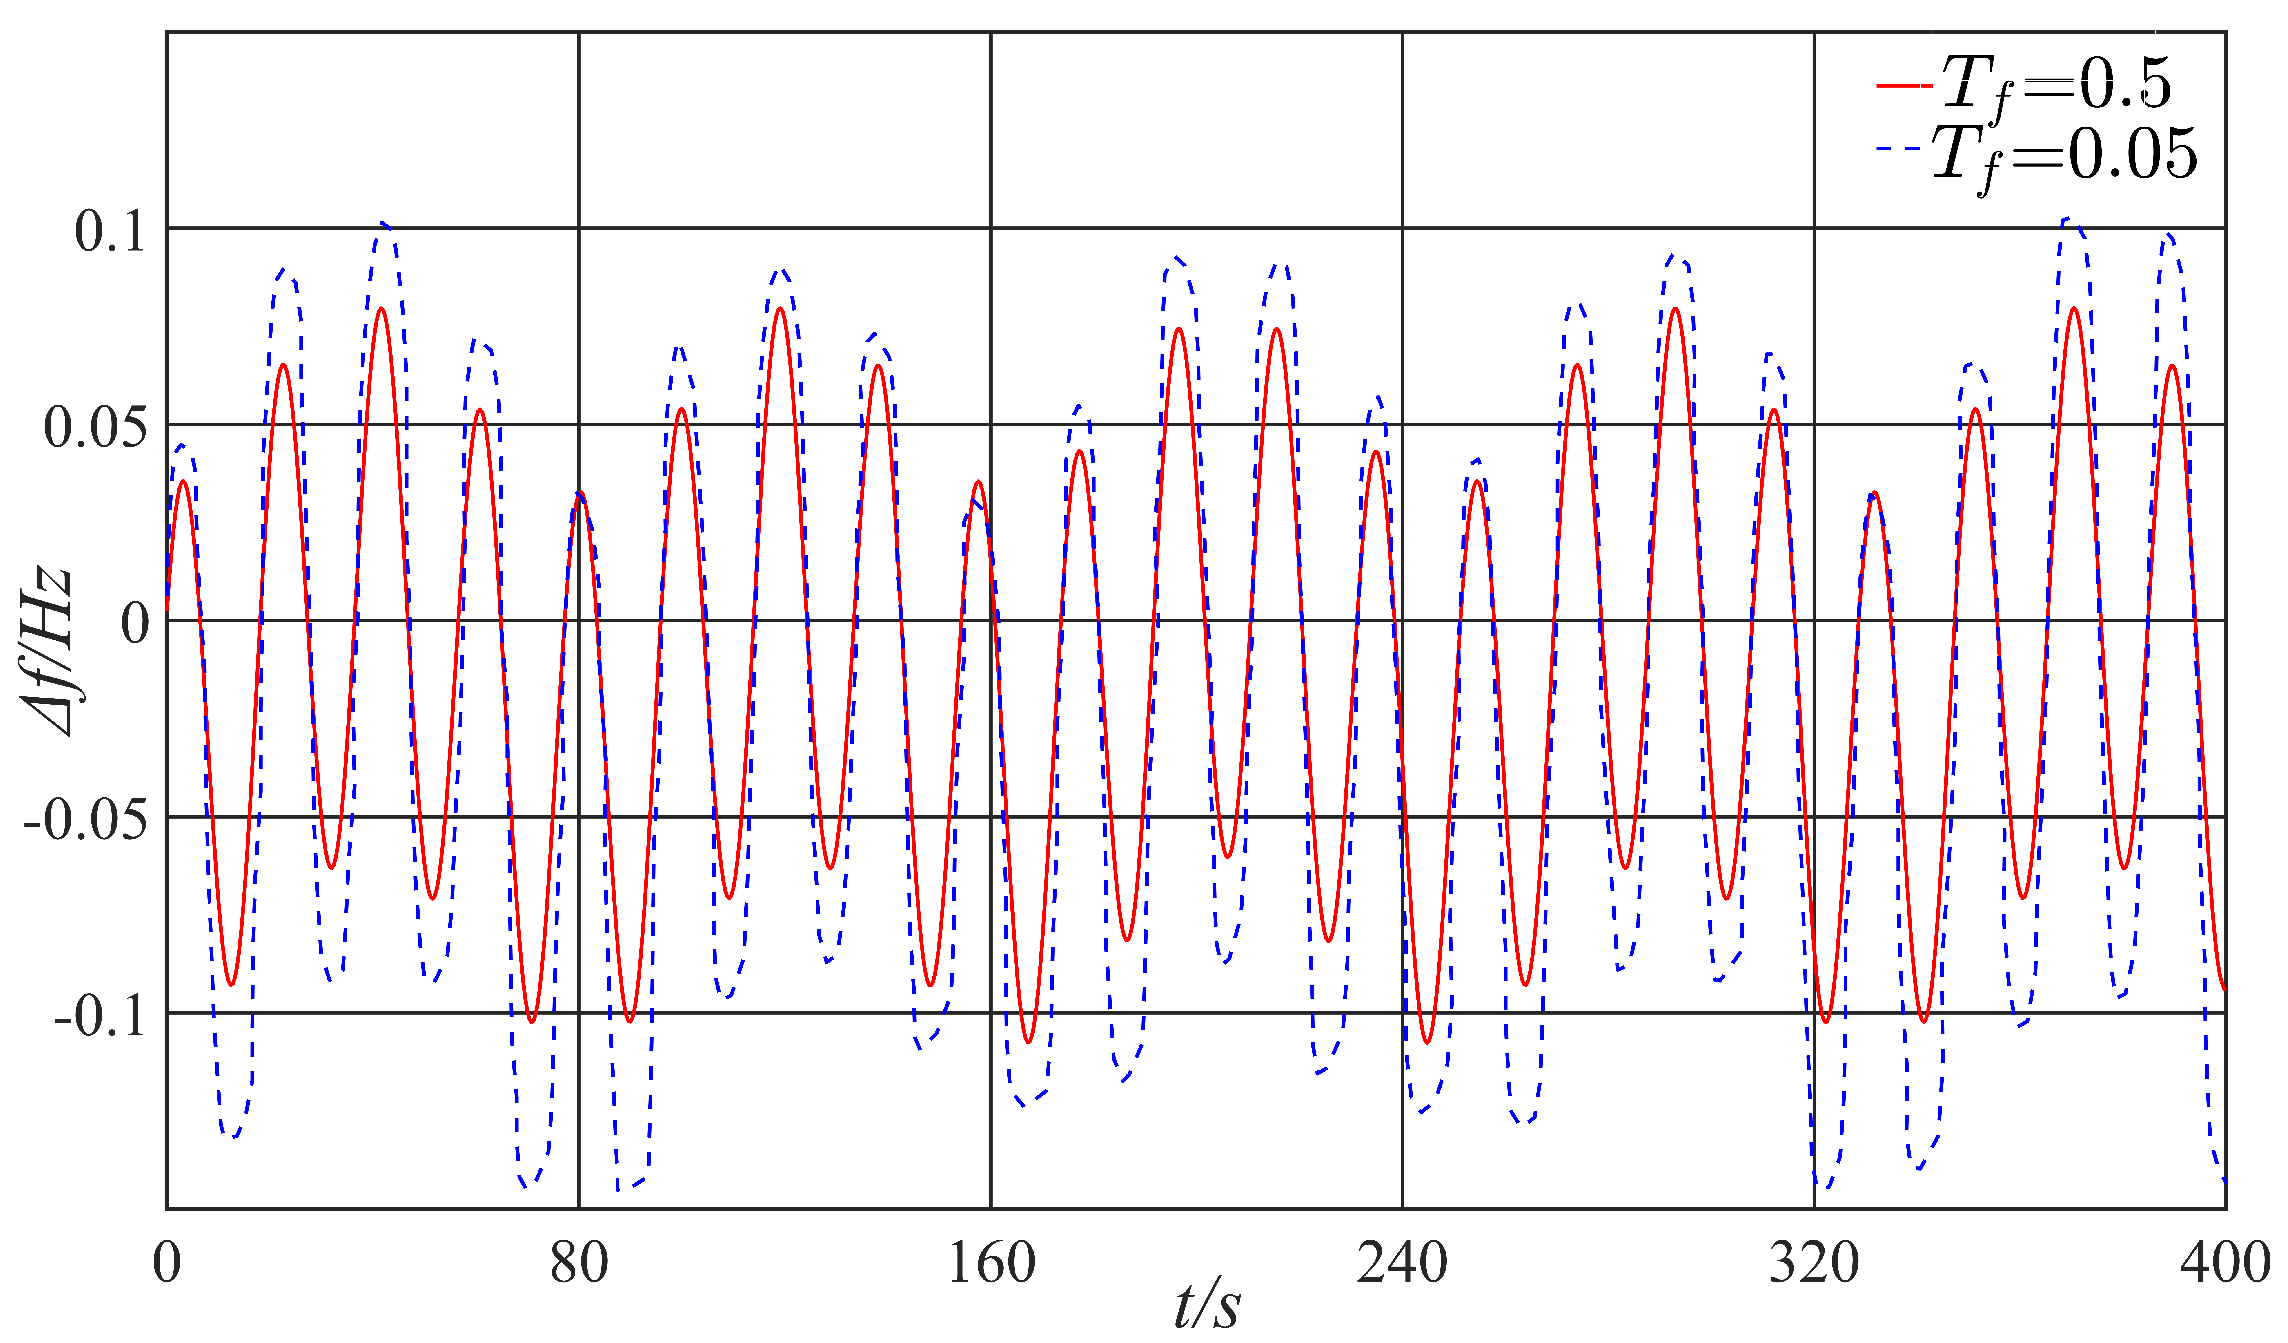
The selection of a frequency division constant must consider the capacity limitations of the HESS. The value of should not be too large, to avoid inefficiency, or too small, to ensure effective frequency division and regulation. To validate the auxiliary role of the HESS frequency division constant in FR, the FR effects of an integrated control strategy under continuous load fluctuation conditions were compared at different time constants. Figure 18 illustrates the variations in system frequency at various time constants. It can be observed from Figure 18 that both and perform better than at 0.5, and both are superior to the scenario without storage, which enhances the performance of FR. Therefore, it can be concluded that optimizing the frequency division constant can further enhance the effectiveness of PFR.
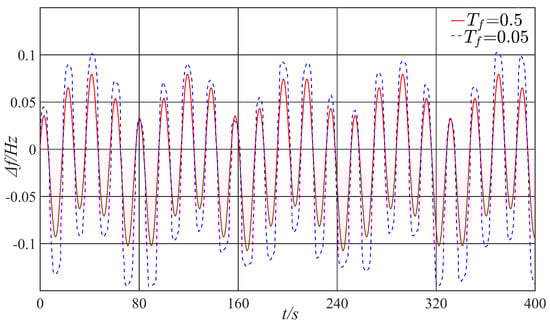
Figure 18.
Frequency deviation curve under different frequency division time constants.
4.4. Long-Term Continuous Disturbance in RES Output
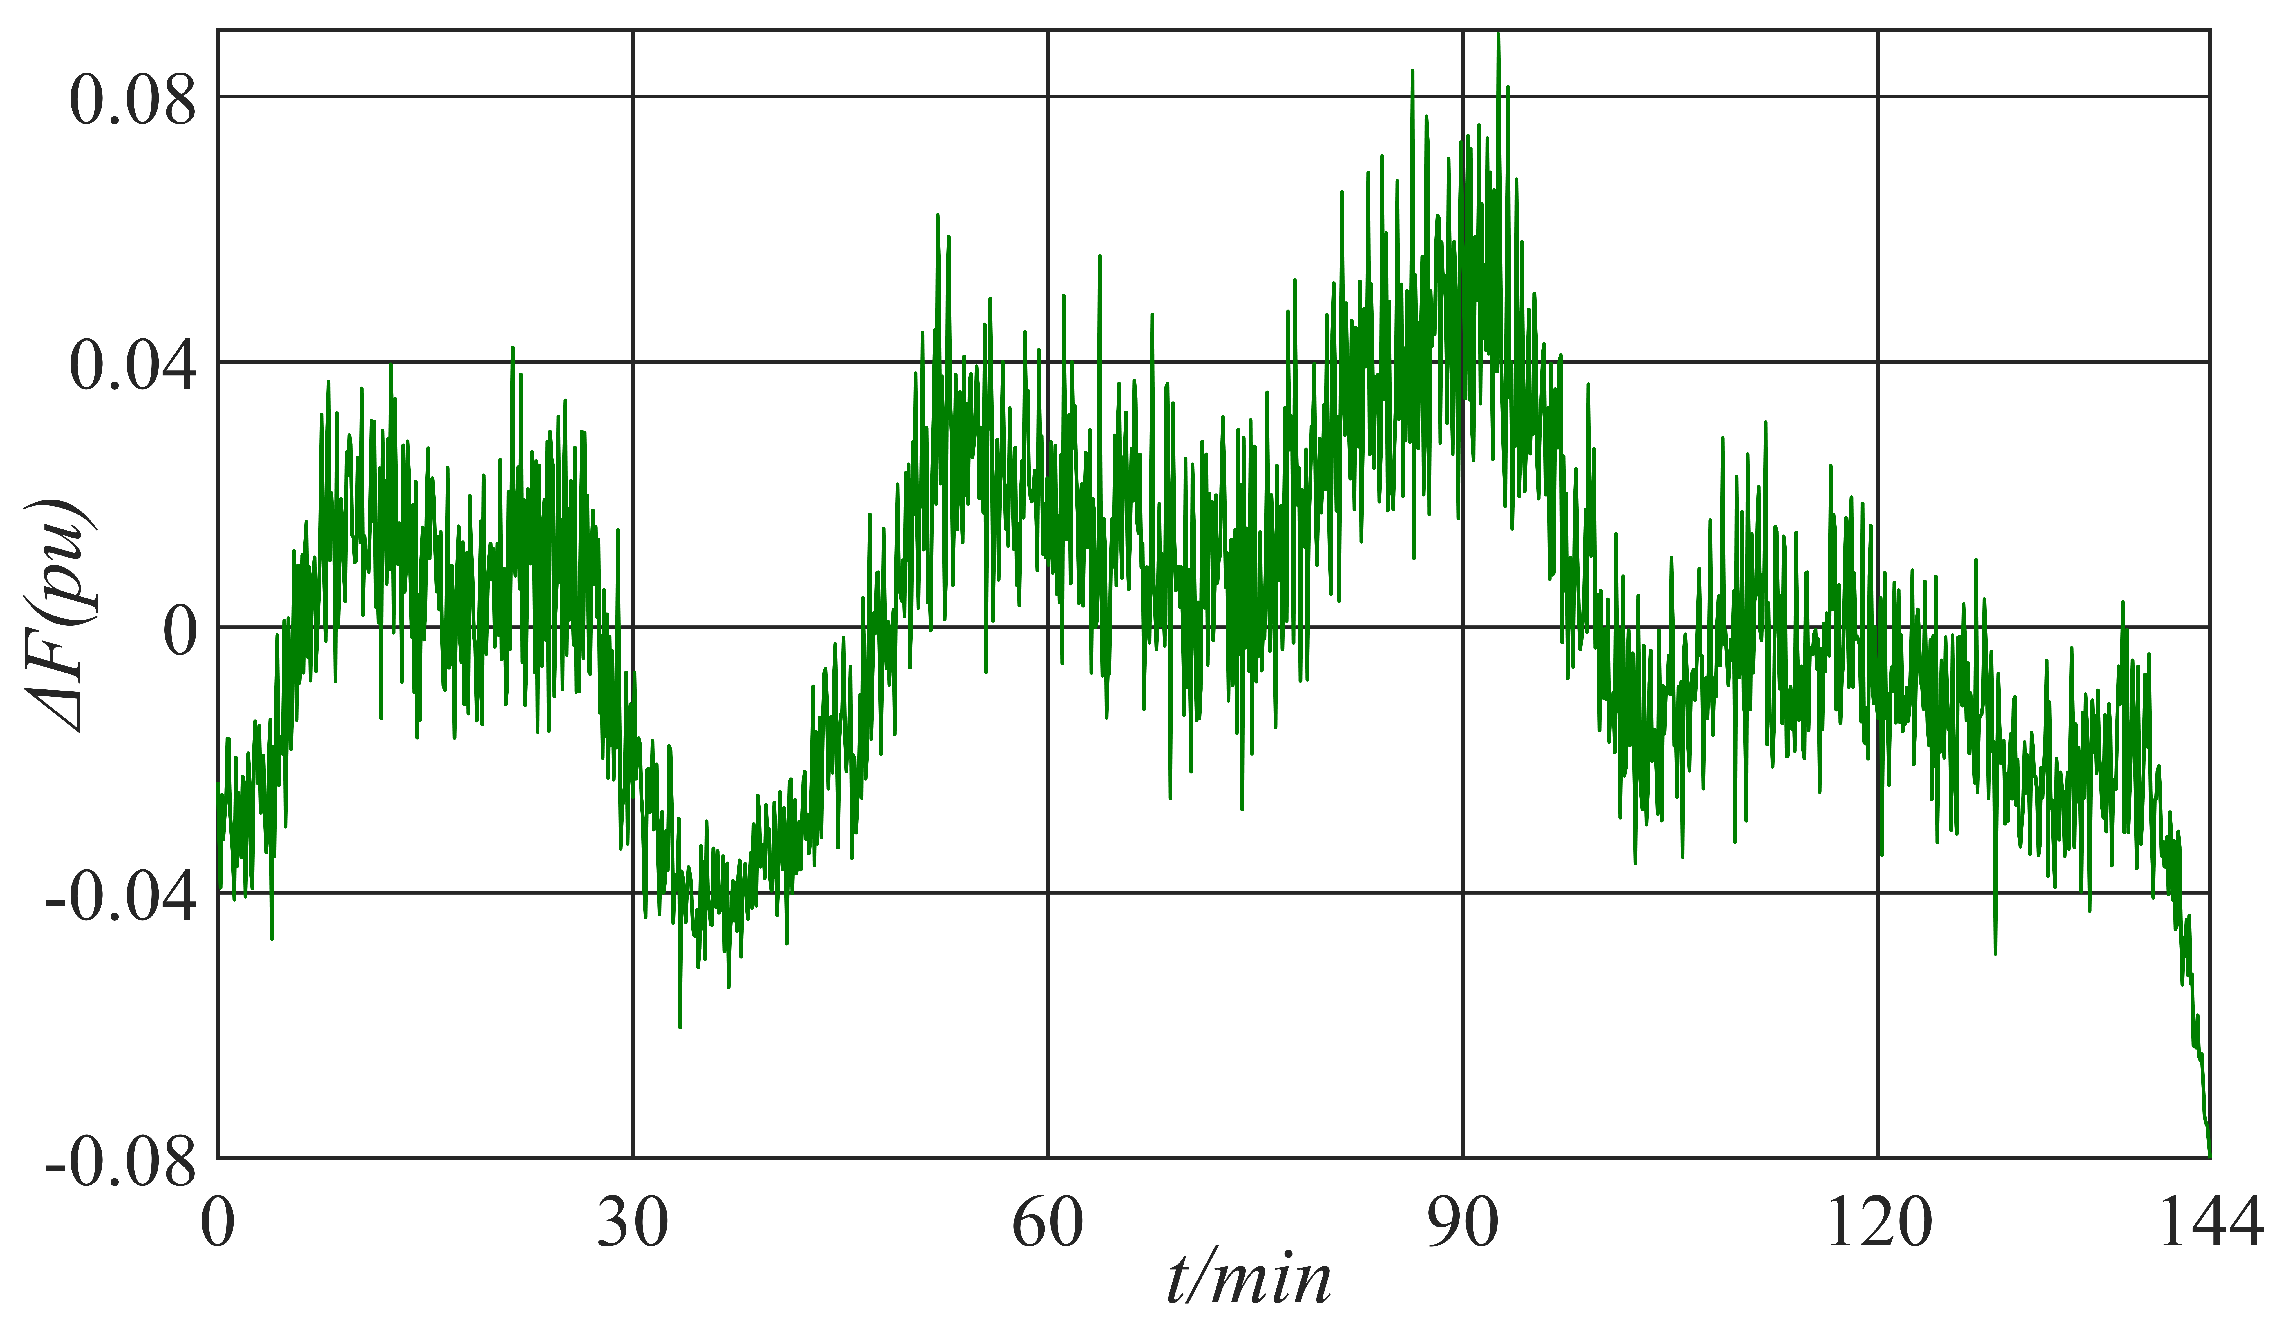
To study the FR performance of the integrated strategy under long-term RES fluctuations, a 144-min wind power fluctuation scenario was introduced. The maximum wind disturbance is 0.08 p.u.
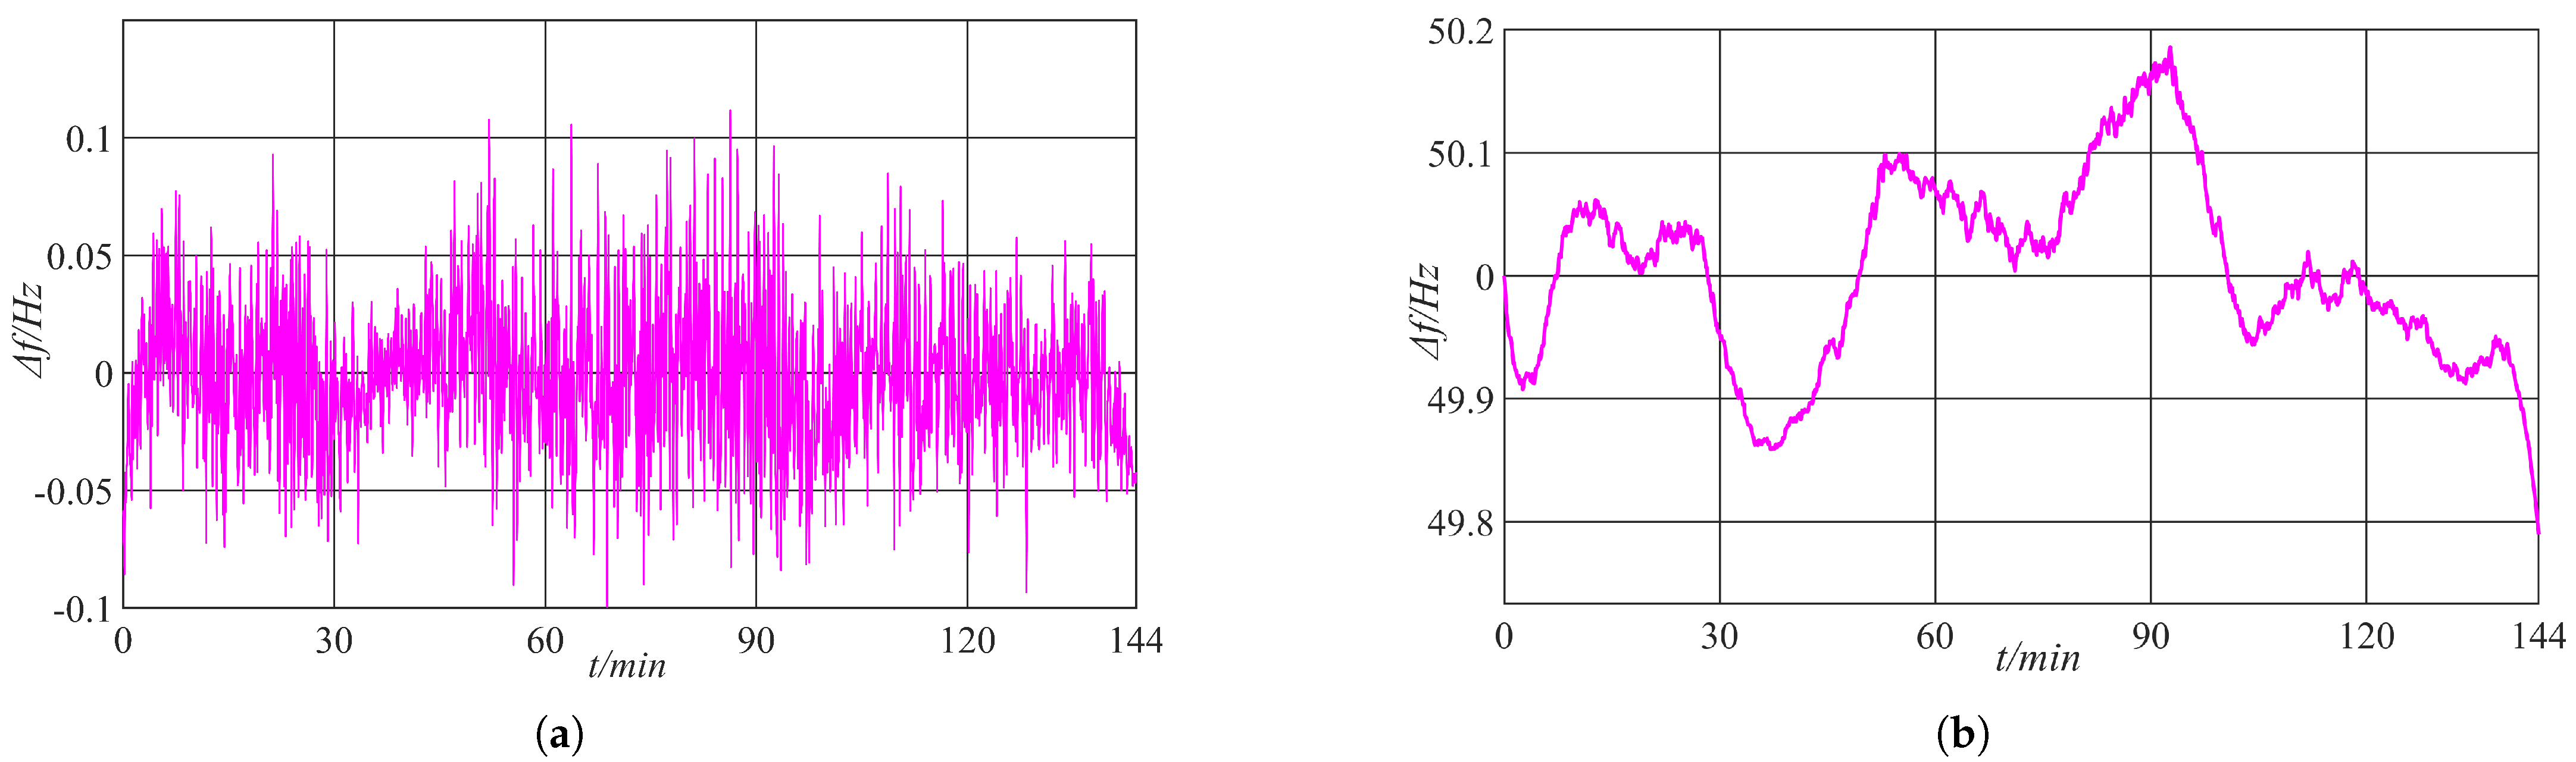
Figure 19 shows the curve of wind turbine output fluctuations due to changes in offshore wind speeds over 144 min in a specific area. Figure 20a and Figure 20b, respectively, correspond to the high-frequency and low-frequency components of system frequency fluctuations. The power grid frequency fluctuation curve in Figure 21. As mentioned above, by employing frequency division control, frequency fluctuations are rationally planned to isolate rapid frequency changes from slower fluctuations.
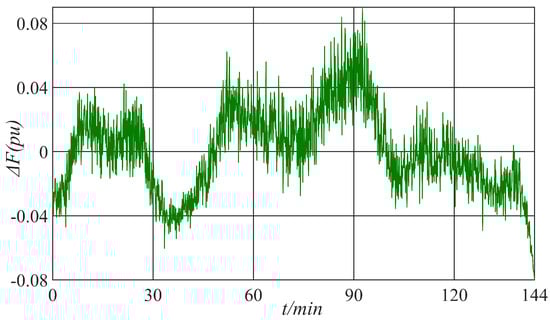
Figure 19.
Wind turbine fluctuation curve over 144 min.

Figure 20.
The (a) high- and (b) low-frequency fluctuation.

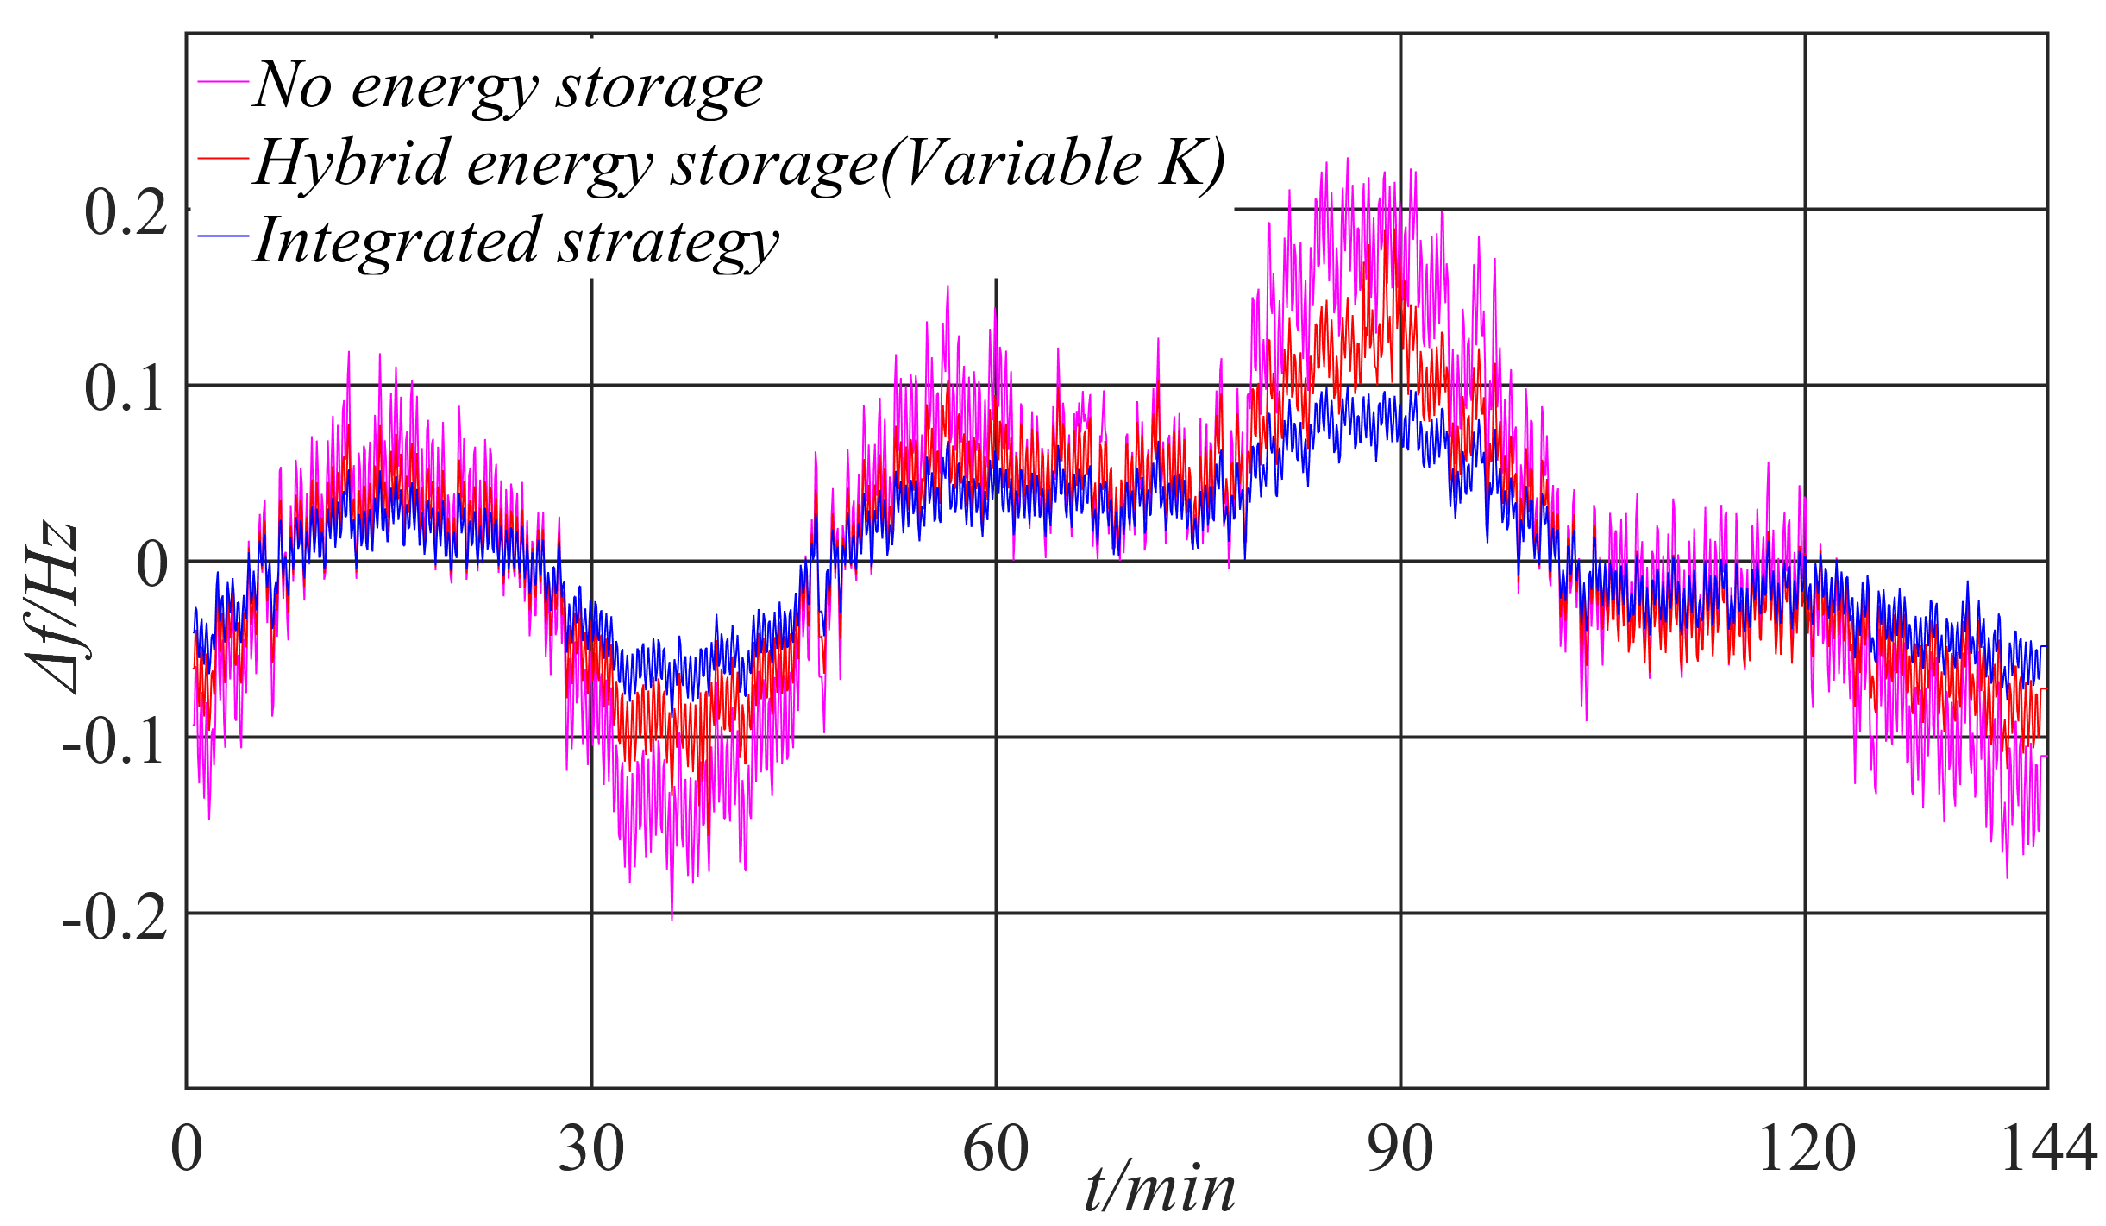
Figure 21.
Frequency deviation curve over 144 min.
From Figure 19, it can be observed that under continuous wind power output fluctuation, the system frequency fluctuations are significantly severe in the no-energy-storage strategy. The is smaller in the other two strategies. The calculations in Table 5 show that the HESS (variable K) reduces the and by 32.86% and 39.56%, respectively, compared to the no-energy-storage strategy. This indicates that the introduction of the HESS effectively enhances the FR performance of the system. According to Table 5, the and of the integrated strategy improve by 32.74% and 21.81%, respectively, compared to the HESS (variable K). This demonstrates that the adaptive droop control and positive/negative virtual inertia control of the BESS in the integrated strategy provide a more efficient output response when the SOC is in the ideal range, further improving the FR performance.
Table 5.
FR evaluation index under RES disturbance.
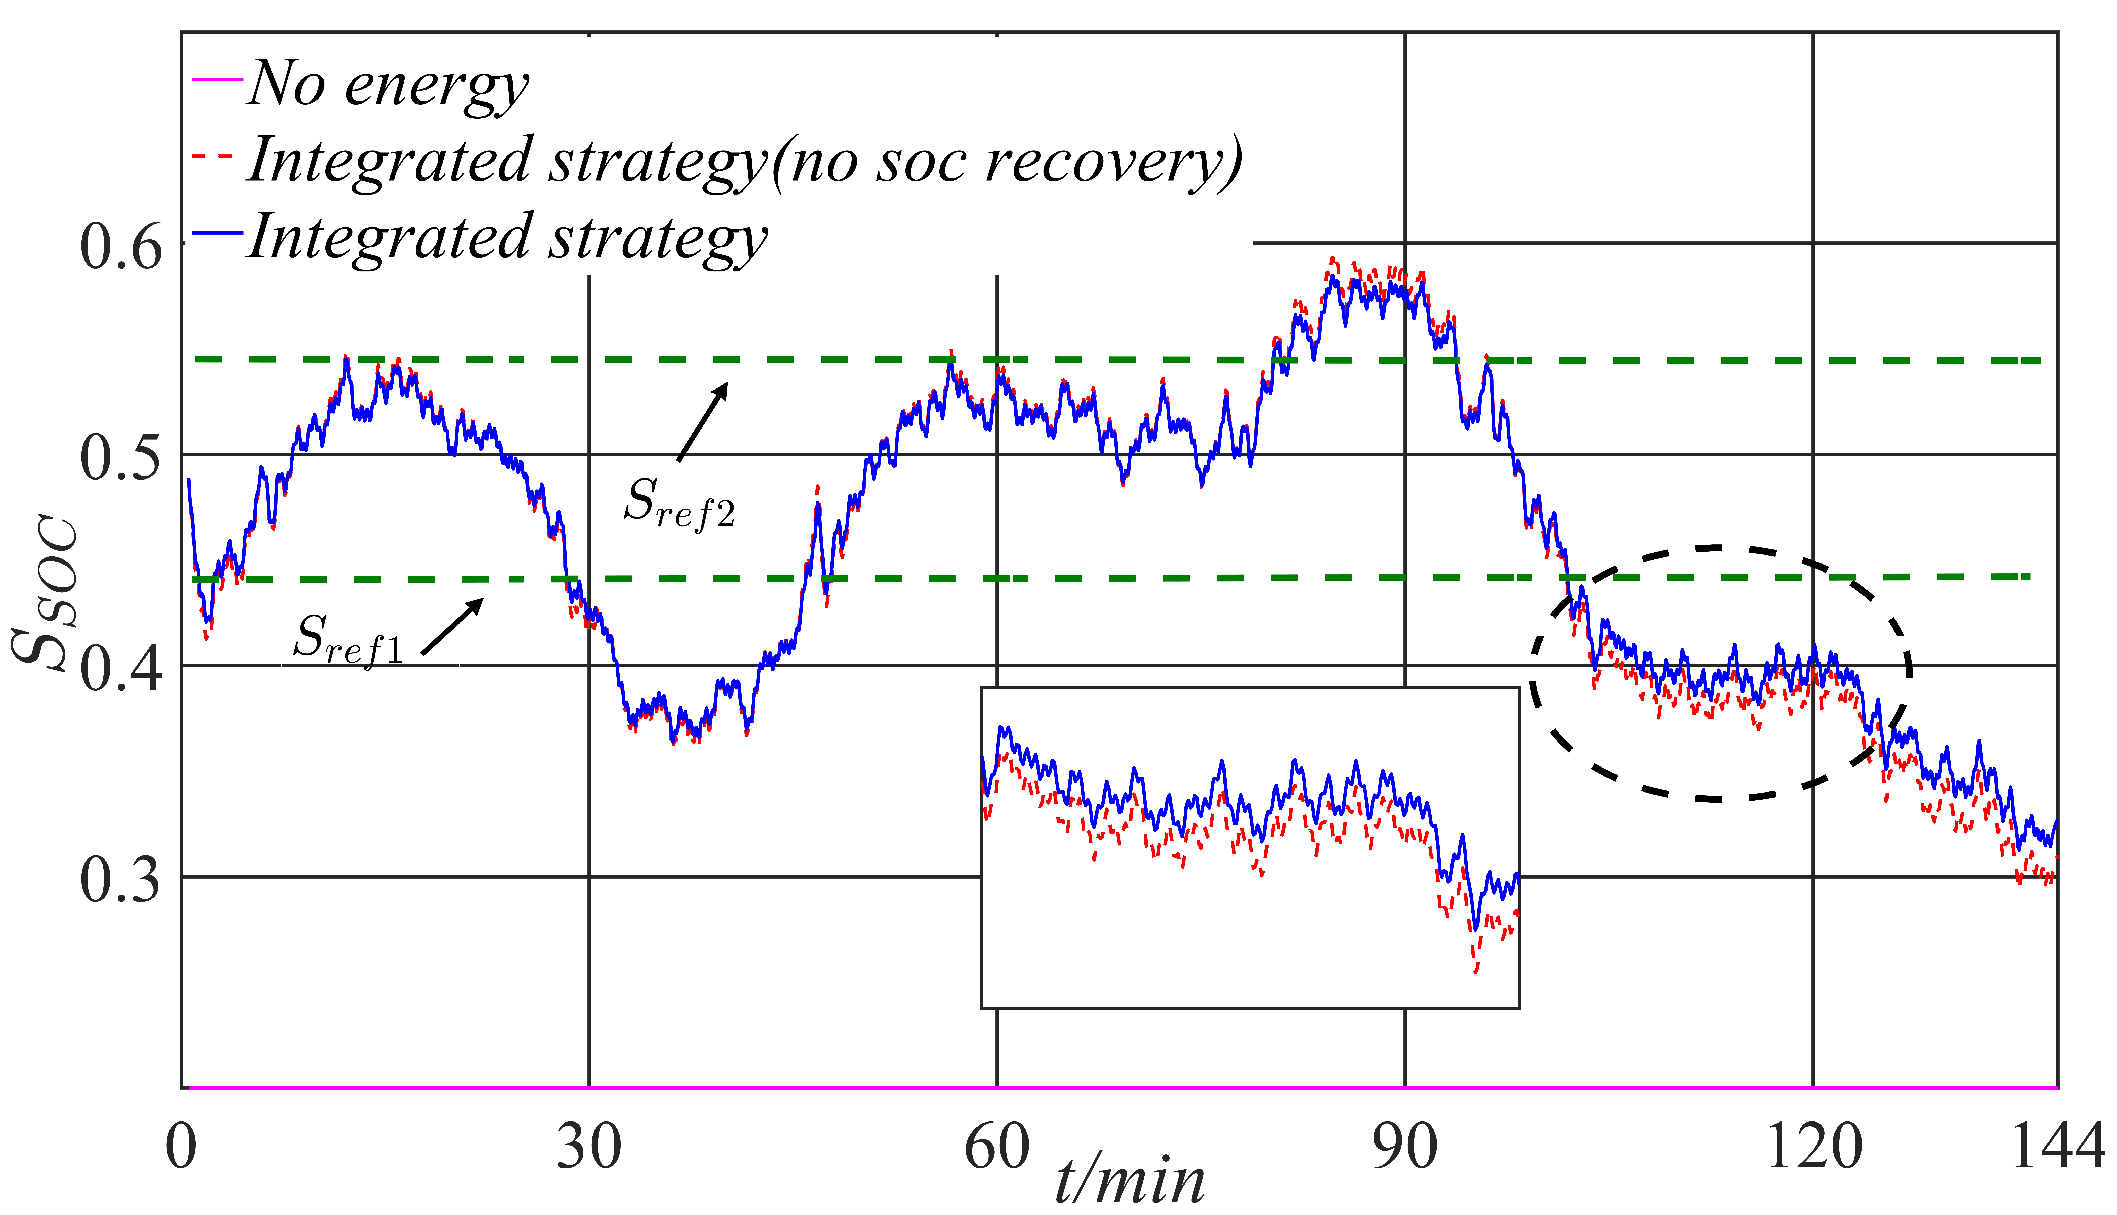
We further analyze the effectiveness of the SOC self-recovery strategy presented in this paper that under prolonged fluctuations in wind turbine output, the integrated strategy maintains = 0.0398, while the integrated strategy (no soc recovery) is = 0.0430. The SOC recovery strategy reduce by 7.5%. From the magnified details in Figure 22, it can be observed that the curve with the SOC recovery strategy is closer to the ideal SOC state compared to the curve without the recovery strategy.

Figure 22.
SOC curve over 144 min.
In general, the effective allocation of operating states between PHES and BESS fully utilizes the advantages of HESSs for FR. Furthermore, the implementation of positive/negative virtual inertia, droop control, and SOC recovery strategies further enhances the long-term frequency regulation capability of the BESS. After verification, the integrated strategy of the gathering station achieved better PFR effects under three different operating conditions, which is more in line with the importance of practical engineering.
4.5. Summary of Results
The above experiments demonstrate the effectiveness of the proposed integrated strategy for HESSs to participate in the PFR of the power grid, specifically in reducing frequency deviations and improving frequency stability.
The first experiment investigated the impact of the DB of the HESS on the PFR. The DB of the CGU was set to 1 DB, and an HESS with DBs of 0.7 DB and 1 DB was compared under a step disturbance of 0.5 p.u. The experiment revealed that while 0.7 DB improves the , the improvement is not particularly significant in 0.5 p.u. However, as the disturbance was reduced to 0.3 p.u., it was observed that 0.7 DB reduced by 15%. This suggests that in the actual system, setting the DB of the HESS smaller than that of the CGU enables the system to enter the FR response phase more quickly. Furthermore, the smaller the disturbance, the more pronounced the FR effect.
Step disturbance experiments were conducted to compare the FR performance of the three strategies mentioned in this paper. The introduction of an HESS significantly improves the system’s response efficiency to frequency fluctuations. As shown in Figure 15, the BESS in the integrated strategy delivers greater output when the SOC is in the ideal range. Through comprehensive comparative analysis, it is evident that the linear droop control in the HESS (variable K) lacks adaptive dynamic adjustment capabilities and inertia control to optimize the dynamic FR process. Consequently, its performance in aspects such as , , the , and the is inferior to that of the integrated strategy.
In a 400 s continuous load disturbance scenario, the integrated strategy demonstrates more significant advantages. The frequency of the system fluctuates frequently due to load changes, and during this phase, the BESS frequently participates in FR. Under continuous disturbances, the integrated strategy combines virtual inertia control and droop control to improve the and . Furthermore, the SOC recovery strategy enhances the FR performance of the BESS, resulting in an improved maintenance performance of the SOC. The is reduced by 52.22% compared to the HESS (variable K), enhancing the FR capability of the BESS for the next phase and achieving positive coordination.
In scenarios with wind continuous fluctuations, the randomness and variability of wind power make it difficult for the CGU to handle complex frequency signals, leading to severe frequency fluctuations. The integrated strategy leverages a reasonable frequency division strategy to maximize the advantages of the HESS. The high-power coordination ability of PHES is better suited for low-frequency signals in system, while the virtual inertia and adaptive droop control of the BESS effectively regulate high-frequency signals. Considering the impact of the SOC on FR performance, Figure 22 demonstrates how the SOC recovery strategy uses the remaining energy in the grid to restore the SOC when the frequency is within the DB, further enhancing the ability of the BESS to participate in prolonged FR.
In summary, the integrated strategy not only enables the rational utilization of different ESSs but also improves the FR capabilities of the HESS by optimizing the FR strategy. These cases offer new solutions for the current frequency disturbance challenges caused by large-scale integration of RESs into regional power grids.
5. Conclusions
To reduce frequency deviations caused by comprehensive disturbances and improve system frequency stability, this paper proposes an integrated strategy for HESSs to participate in the PFR of regional power grids. The main contributions are as follows:
- Under the same disturbance, setting the FR DB of the HESS to 70% of that of the CGU allows the HESS to respond more quickly to fluctuations in the frequency of the system, reducing the maximum frequency deviation and therefore improving the FR performance of the system. Moreover, the smaller the disturbance magnitude, the greater the impact on the maximum frequency deviation.
- The selection of frequency division time constants within the integrated control strategy should be based on the capacity of the HESS and the effectiveness of the frequency division. Based on the long-term FR capability of PHES and the rapid frequency regulation capability of the BESS, a coordinated control strategy is proposed. This method decomposes and reconstructs the power demand for the FR of the system into high-frequency and low-frequency components, which are, respectively, used as FR commands for the BESS and PHES. This approach fully exploits the complementary characteristics of HESS.
- Under step and continuous disturbances, the integrated strategy combines virtual inertia control with adaptive droop control in the BESS, effectively suppressing frequency fluctuations while avoiding overcharging and deep discharging of the BESS. In wind power disturbance scenarios, the frequency indicators are reduced by 15% and 12%, respectively, compared to the HESS (variable K).
- Under continuous wind power fluctuations, the proposed SOC recovery strategy reduces the by 7.5%, bringing it closer to the ideal state and enhancing the capability of the BESS to participate in long-term FR.This is beneficial for the rational allocation of power system resources.
Author Contributions
Conceptualization, D.Z.; Methodology, D.Z.; Software, D.Z.; Validation, Z.Z. and Y.D.; Formal analysis, Z.Z. and Y.Z.; Data curation, C.W.; Writing—original draft, Z.Z.; Writing—review & editing, C.T.; Supervision, Y.D. All authors have read and agreed to the published version of the manuscript.
Funding
This research received no external funding.
Data Availability Statement
The original contributions presented in this study are included in the article. Further inquiries can be directed to the corresponding author.
Conflicts of Interest
Authors Yangqing Dan and Chenxuan Wang were employed by the State Grid Zhejiang Electric Power Co., Ltd.; Yuanlong Zhu was employed by the Shengxing Energy Technology Co., Ltd. The remaining authors declare that the research was conducted in the absence of any commercial or financial relationships that could be construed as a potential conflict of interest.
Abbreviations
The following abbreviations are used in this manuscript:
| RES | Renewable energy source |
| PFR | Primary frequency regulation |
| PHES | Pumped hydroelectric energy storage |
| BESS | Battery energy storage system |
| DB | Deadband |
| HESS | Hybrid energy storage system |
| FR | Frequency regulation |
| SOC | State of charge |
| CGU | Conventional generator unit |
| PV | Photovoltaic |
| ESS | Energy storage system |
References
- Zhao, T.; Parisio, A.; Milanović, J.V. Location-dependent distributed control of battery energy storage systems for fast frequency response. Int. J. Electr. Power Energy Syst. 2021, 125, 106493. [Google Scholar] [CrossRef]
- Zhou, D.; Zhang, Q.; Dan, Y.; Guo, F.; Qi, J.; Teng, C.; Zhou, W.; Zhu, H. Research on renewable-energy accommodation-capability evaluation based on time-series production simulations. Energies 2022, 15, 6987. [Google Scholar] [CrossRef]
- Shu, H.; Wang, G.; Chen, J.; Ma, H.; He, T. Coordinated control of wind-storage combined with primary frequency regulation and variable coefficient based on wind speed and SOC. J. Energy Storage 2024, 87, 111356. [Google Scholar] [CrossRef]
- Ratnam, K.S.; Palanisamy, K.; Yang, G. Future low-inertia power systems: Requirements, issues, and solutions—A review. Renew. Sustain. Energy Rev. 2020, 124, 109773. [Google Scholar] [CrossRef]
- Lin, Z.; Cevasco, D.; Collu, M. A methodology to develop reduced-order models to support the operation and maintenance of offshore wind turbines. Appl. Energy 2020, 259, 114228. [Google Scholar] [CrossRef]
- Yan, G.; Liu, D.; Li, J.; Mu, G. A cost accounting method of the Li-ion battery energy storage system for frequency regulation considering the effect of life degradation. Prot. Control Mod. Power Syst. 2018, 3, 4. [Google Scholar] [CrossRef]
- Wang, Y.; Zou, R.; Liu, F.; Zhang, L.; Liu, Q. A review of wind speed and wind power forecasting with deep neural networks. Appl. Energy 2021, 304, 117766. [Google Scholar] [CrossRef]
- Rekioua, D. Energy storage systems for photovoltaic and wind systems: A review. Energies 2023, 16, 3893. [Google Scholar] [CrossRef]
- Lazenby, J.W.; Shwageraus, E.; White, A.J. A feedheat-integrated energy storage system for nuclear-powered steam plant. Proc. Inst. Mech. Eng. Part A J. Power Energy 2024, 238, 265–279. [Google Scholar] [CrossRef]
- Yanchun, X.; Weijun, J.; Sihan, S.; Lu, M. Quantitative Assessment Method for Transient Voltage of Distribution Network with High-Penetration Wind Power. Electr. Power 2022, 55, 152–162. [Google Scholar]
- Papakonstantinou, A.G.; Konstanteas, A.I.; Papathanassiou, S.A. Solutions to enhance frequency regulation in an island system with pumped-hydro storage under 100% renewable energy penetration. IEEE Access 2023, 11, 76675–76690. [Google Scholar] [CrossRef]
- Dratsas, P.A.; Psarros, G.N.; Papathanassiou, S.A. Capacity value of pumped-hydro energy storage. In Proceedings of the 2022 2nd International Conference on Energy Transition in the Mediterranean Area (SyNERGY MED), Thessaloniki, Greece, 17–19 October 2022; pp. 1–6. [Google Scholar]
- García-Pereira, H.; Blanco, M.; Martínez-Lucas, G.; Pérez-Díaz, J.I.; Sarasúa, J.I. Comparison and influence of flywheels energy storage system control schemes in the frequency regulation of isolated power systems. IEEE Access 2022, 10, 37892–37911. [Google Scholar] [CrossRef]
- Sarasúa, J.I.; Martínez-Lucas, G.; Lafoz, M. Analysis of alternative frequency control schemes for increasing renewable energy penetration in El Hierro Island power system. Int. J. Electr. Power Energy Syst. 2019, 113, 807–823. [Google Scholar] [CrossRef]
- Deguenon, L.; Yamegueu, D.; Gomna, A.; Gomna, A. Overcoming the challenges of integrating variable renewable energy to the grid: A comprehensive review of electrochemical battery storage systems. J. Power Sources 2023, 580, 233343. [Google Scholar] [CrossRef]
- Lee, J.; Kim, J.M.; Yi, J.; Won, C.Y. Battery management system algorithm for energy storage systems considering battery efficiency. Electronics 2021, 10, 1859. [Google Scholar] [CrossRef]
- Jiang, X.; Jin, Y.; Zheng, X.; Hu, G.; Zeng, Q. Optimal configuration of grid-side battery energy storage system under power marketization. Appl. Energy 2020, 272, 115242. [Google Scholar] [CrossRef]
- Turk, A.; Sandelic, M.; Noto, G.; Pillai, J.R.; Chaudhary, S.K. Primary frequency regulation supported by battery storage systems in power system dominated by renewable energy sources. J. Eng. 2019, 2019, 4986–4990. [Google Scholar] [CrossRef]
- Tang, Y.; Yang, C.; Yan, Z.; Xue, Y.; He, Y. Coordinated control of a wind turbine and battery storage system in providing fast-frequency regulation and extending the cycle life of battery. Front. Energy Res. 2022, 10, 927453. [Google Scholar] [CrossRef]
- Zhu, Z.; Ye, C.; Wu, S. Comprehensive control method of energy storage system to participate in primary frequency regulation with adaptive state of charge recovery. Int. Trans. Electr. Energy Syst. 2021, 31, e13220. [Google Scholar] [CrossRef]
- Liu, B.; Chen, Z.; Yang, S.; Wang, Y.; Yang, K.; Lu, C. Primary frequency regulation scheme applicable to LCC–VSC series hybrid HVDC considering AC voltage stability at receiving end. Int. J. Electr. Power Energy Syst. 2022, 140, 108071. [Google Scholar] [CrossRef]
- Yang, B.; Weng, L.; Li, Y.; Zhang, Y.; Zhou, C. Research on Coordinated Control Strategy of Energy Storage Participating in Primary Frequency Regulation Considering Frequency Deviation Change Rate. J. Phys. Conf. Ser. 2021, 1750, 012034. [Google Scholar] [CrossRef]
- Fan, F.; Xu, Y.; Zhang, R.; Wan, T. Whole-lifetime coordinated service strategy for battery energy storage system considering multi-stage battery aging characteristics. J. Mod. Power Syst. Clean Energy 2021, 10, 689–699. [Google Scholar] [CrossRef]
- Wang, Y.; Yang, M.; Xue, H.; Zhang, Y.; Mi, Y. Adaptive integrated control strategy for primary frequency regulation of battery energy storage system with SOC. Power Autom. Equip 2021, 41, 192–198. [Google Scholar]
- Chen, W.; Sun, N.; Ma, Z.; Liu, W.; Dong, H. A Two-Layer Optimization Strategy for Battery Energy Storage Systems to Achieve Primary Frequency Regulation of Power Grid. Energies 2023, 16, 2811. [Google Scholar] [CrossRef]
- Datta, U.; Kalam, A.; Shi, J. Battery energy storage system control for mitigating PV penetration impact on primary frequency control and state-of-charge recovery. IEEE Trans. Sustain. Energy 2019, 11, 746–757. [Google Scholar] [CrossRef]
- Stroe, D.I.; Knap, V.; Swierczynski, M.; Stroe, A.I.; Teodorescu, R. Operation of a grid-connected lithium-ion battery energy storage system for primary frequency regulation: A battery lifetime perspective. IEEE Trans. Ind. Appl. 2016, 53, 430–438. [Google Scholar] [CrossRef]
- Li, P.; Tan, Z.; Zhou, Y.; Li, C.; Li, R.; Qi, X. Secondary frequency regulation strategy with fuzzy logic method and self-adaptive modification of state of charge. IEEE Access 2018, 6, 43575–43585. [Google Scholar] [CrossRef]
- Tan, Z.; Li, X.; He, L.; Li, Y.; Huang, J. Primary frequency control with BESS considering adaptive SoC recovery. Int. J. Electr. Power Energy Syst. 2020, 117, 105588. [Google Scholar] [CrossRef]
- Kebede, A.A.; Kalogiannis, T.; Van Mierlo, J.; Berecibar, M. A comprehensive review of stationary energy storage devices for large scale renewable energy sources grid integration. Renew. Sustain. Energy Rev. 2022, 159, 112213. [Google Scholar] [CrossRef]
- Hajiaghasi, S.; Salemnia, A.; Hamzeh, M. Hybrid energy storage system for microgrids applications: A review. J. Energy Storage 2019, 21, 543–570. [Google Scholar] [CrossRef]
- Wang, Y.; Chen, J.; Liang, J.; Liu, Z.; Liu, H.; Shen, Z. Benefits analysis of energy storage system configured on the renewable energy gathering stations. Energy Rep. 2023, 9, 802–809. [Google Scholar] [CrossRef]
- Ren, Y.; Chen, S.; Marco, J. An adaptive power distribution scheme for hybrid energy storage system to reduce the battery energy throughput in electric vehicles. Trans. Inst. Meas. Control 2023, 45, 1367–1381. [Google Scholar] [CrossRef]
- Sun, B.; Wu, F.; Lin, K.; Li, Y.; Wang, Z.; Liu, H. Frequency Regulation Strategies of BESS and Doubly-fed Variable Speed Pumped Storage Unit Under Multiple Operating Conditions. In Proceedings of the 2022 IEEE 5th International Electrical and Energy Conference (CIEEC), Nanjing, China, 27–29 May 2022; pp. 2169–2174. [Google Scholar]
- Liu, Y.; Yin, Y.; Sun, B.; Lin, K.; Li, Y.; Wu, F.; Huang, W.; Jing, R. Coordinated Frequency Regulation Strategy of Pumped Storage Units and Battery Energy Storage System. In Proceedings of the 2021 IEEE Sustainable Power and Energy Conference (iSPEC), Nanjing, China, 23–25 December 2021; pp. 1195–1200. [Google Scholar]
- Datta, A.; Bhattacharjee, K.; Debbarma, S.; Kar, B. Load frequency control of a renewable energy sources based hybrid system. In Proceedings of the 2015 IEEE Conference on Systems, Process and Control (ICSPC), Bandar Sunway, Malaysia, 18–20 December 2015; pp. 34–38. [Google Scholar]
- Fernández-Guillamón, A.; Gómez-Lázaro, E.; Muljadi, E.; Molina-García, Á. Power systems with high renewable energy sources: A review of inertia and frequency control strategies over time. Renew. Sustain. Energy Rev. 2019, 115, 109369. [Google Scholar] [CrossRef]
- Knap, V.; Chaudhary, S.K.; Stroe, D.I.; Swierczynski, M.; Craciun, B.I.; Teodorescu, R. Sizing of an energy storage system for grid inertial response and primary frequency reserve. IEEE Trans. Power Syst. 2015, 31, 3447–3456. [Google Scholar] [CrossRef]
- Mendis, N.; Muttaqi, K.M.; Perera, S. Management of battery-supercapacitor hybrid energy storage and synchronous condenser for isolated operation of PMSG based variable-speed wind turbine generating systems. IEEE Trans. Smart Grid 2014, 5, 944–953. [Google Scholar] [CrossRef]
- Meng, Y.; Li, X.; Liu, X.; Cui, X.; Xu, P.; Li, S. A control strategy for battery energy storage systems participating in primary frequency control considering the disturbance type. IEEE Access 2021, 9, 102004–102018. [Google Scholar] [CrossRef]


Disclaimer/Publisher’s Note: The statements, opinions and data contained in all publications are solely those of the individual author(s) and contributor(s) and not of MDPI and/or the editor(s). MDPI and/or the editor(s) disclaim responsibility for any injury to people or property resulting from any ideas, methods, instructions or products referred to in the content. |
© 2025 by the authors. Licensee MDPI, Basel, Switzerland. This article is an open access article distributed under the terms and conditions of the Creative Commons Attribution (CC BY) license (https://creativecommons.org/licenses/by/4.0/).