Abstract
One of the reasons for using metallic sheaths in power cables is to provide a path for fault current flow. The aim of the study will be to determine the effect of the type of short circuit, the current that flows in the conductor of a three-phase MV cable line, on the level of voltages and overvoltages induced in the metallic screens of these cables with different configurations of their grounding. The appearance of voltage exceeding safe values in the screen can lead to damage to the outer sheath insulation cable. The simulation studies were carried out using an MV network model created in the DIgSILENT Power Factory program, which consists of basic elements of the power system and a system that duplicates connections of sheaths and grounding. The test results show the waveforms of voltages induced in the cable screens and the maximum values of overvoltage resulting from the simulation of ground faults and phase faults. The main achievement obtained as a result of the simulation tests was obtaining information on the level of overvoltage hazard in the event of various types of short-circuit disturbances. The analysis of the obtained results indicates the possibility of overvoltage in the considered system, posing a threat to the outer sheath of the cable; therefore, a solution will be proposed to avoid damage.
1. Introduction
Issues related to the use and operation of medium voltage (MV) cable lines currently concern primarily power cables with cross-linked polyethylene insulation, constructed as single-core cables with a metallic sheath that provides effective discharge of short-circuit current and cooperates with protection devices to quickly disconnect short-circuit currents that threaten cable insulation [1,2,3]. Therefore, cable connections in medium voltage networks are most often made of three single-core cables with copper cable screens grounded on both ends. This arrangement ensures discharge of short-circuit current and safety against shock and surges. Using this configuration, the voltage on the cable screen should be negligibly low, which means that the conditions for surge protection can be met without the need for additional protective measures. A significant disadvantage of this solution is the occurrence of significant electrical energy losses during normal operation, resulting from the flow of sheath currents induced by the electromotive force induced in the cable screen.
Energy losses in power cables constitute a significant cost for transmission and distribution network operators and are the subject of numerous research studies aimed at developing changes to cable line configuration and operation to minimize these losses. Their sources in cable lines include the cores, insulation, and conductive sheaths of the cable, such as the screen, armor, or semiconducting layer. Among these are losses in the core resulting from the impedance of the cable line, dielectric losses, the level of which depends, among other things, on the cable capacitance, and, most importantly from the perspective of this article, losses in the cable screen due to the flow of sheath currents. Methods to minimize electrical energy losses resulting from these phenomena include reducing the selected nominal cross-sections of the cores and screens [4,5] or changing the cable line layout and reducing the distance between the phases [6]. An increase in the distance between the phases of single-core power cables results in increased losses, which leads to the conclusion that losses in a triangle configuration will be significantly lower than in a flat configuration, even with minimal interphase distances. Electrical energy losses resulting from current flow through the cable screen can be reduced by changing the grounding configuration of the sheath [7,8,9]. The most popular method of grounding the cable screen of MV power cables is both-end bonding (BE), which is grounding at both ends of the cable line. This arrangement contributes to increased transmission losses by inducing an electromotive force in the cable screen, resulting from the current flow through the conductor during normal operation. Reduction in losses in MV cable networks is possible by using methods used in HV and EHV cable lines, namely the use of alternative methods of connecting and grounding the cable screen, such as single-point bonding (SPB) with surge voltage limiters (SVL), cross bonding (CS) with or without transposition, or adding additional resistance or reactance at the grounding point [10,11,12].
Appropriately changing the grounding configuration of the cable screen of single-core, three-phase MV power lines can solve the problem of transmission losses. This occurs by limiting the flow of sheath currents induced in the given metallic sheath. This condition is met when the current path is interrupted, meaning the cable screen is not grounded on both sides. The basic solution proposed in such a situation is the use of single-point bonding, with the simultaneous installation of SVL to protect the external insulation against potential overvoltage. Research conducted by the authors [13,14] has determined a grounding configuration for the return conductors in which the conductors are grounded on one side, with one or two phases of the cable screens ungrounded.
Ungrounding the cable screen can result in voltage induced on it, resulting from a lack of potential equalization at both ends of the conductors. Cable line configurations that reduce losses may, therefore, be accompanied by dangerous overvoltage events, which can result in damage to the external insulation of the power cable. Overvoltage can be induced in the cable screen as a result of both switching events and faults. The most common faults in medium-voltage networks accompanied by overvoltage are phase-to-phase and ground faults. This is due to the large presence of overhead lines in such networks. To determine the effect of the type of short-circuit fault on the level of overvoltage and the voltages induced during a fault, simulation studies were conducted using the PowerFactory tool. The computer program allows for modeling any section of the power network to obtain parameters appropriate for the model elements under the expected conditions.
Previously published in the Energies journal [13,14], research conducted by the authors of this article provides insight into the basics of the phenomena under investigation. Furthermore, they provide a basis for conducting ground fault overvoltage tests in the return conductors of MV cables using the computer tool described in the previous paragraph. This article summarizes research on ground fault overvoltage induced in sheaths when grounding methods are modified, and alternatives to commonly used methods are introduced due to a short circuit fault in the network. Chapter 2 presents the basic concepts of how voltages are induced in the sheaths of power cables, as well as graphics illustrating the sheath operation modes analyzed during simulation studies conducted to verify the issue. In Chapter 3, methods and materials provided to carry out studies are introduced. In further parts of the article results of conducted studies and conclusions are demonstrated.
2. Hazard of Induced Overvoltage in Cable Line Screens
The use of a cable line in a power system requires consideration of the physical phenomena occurring between the cable sheaths. Both operating currents and fault currents flowing through the conductor result in the induction of an electromotive force in the sheath. This phenomenon is called sheath current development in cable lines [1,15,16,17,18] and results from the magnetic coupling existing between the working conductor and the metallic sheaths. Therefore, the consequence of current flowing through the conductor is the induction of an electromotive force in the sheath material. Bilaterally closing the metallic sheath circuit through the ground, using both-end grounding, will result in the flow of sheath current and require the use of special grounding for the sheaths [19].
According to the theory of ground return circuits, in a conductor placed parallel to three conductors through which a symmetrical three-phase current flows, a voltage resulting from the electric field intensity E [V/m] is induced, with a value described by Formula (1):
where I2 –reference current [A], ω—angular frequency [Hz], D, D2p, D3p—distances between the axes of wire p and wires 1, 2 and 3 [m].
The parameters describing the characteristic values of the symmetrical system are presented by the relations (2) and (3):
For single-core power cables with screens, arranged in a three-phase configuration, the screens can be treated as parallel conductors separated from the conductor by a distance rp, which is the average radius of that conductor. Assuming there are no other current-carrying conductors in the vicinity of the cable system, the induced voltages can be determined using Formula (1):
where d—average radius of cable screen.
The formulas presented above allow for the calculation of the electric field strength of the cable screen, which consequently influences the voltage induced in this sheath. Based on the above formulas, it can be assumed that the most significant parameters influencing the possibility of voltage induced in the cable screen will be the current flowing in the conductor and the geometry of the individual conductors, and the three-phase cable system. Such conclusions, therefore, lead to the determination of quantities whose change will be significant when attempting to determine the change in the cable screen voltage.
The literature offers numerous solutions that can limit dangerous voltage levels appearing on metallic cable sheaths under various cable line operating conditions and minimize sheath current flow. The most commonly used grounding methods for cable screens are discussed in norms and standards [20,21]. Regardless of the method used, metallic sheath grounding must meet the following requirements:
- ensure grounding of the power cable;
- ensure a path for fault current through the cable screen;
- limit the voltage induced on the cable screen to an acceptable and minimum level;
- significantly reduce or eliminate electrical energy losses;
- limit transient overvoltage to an acceptable level, taking into account connections with surge voltage limiters.
Meeting all these conditions is an important issue that must be considered for cable lines at all voltage levels, but the most commonly used methods of connecting the cable screen to ground are capable of fully meeting some of these requirements. Below, a description of the most popular methods of grounding the cable screen is presented, along with an assessment of their application in medium-voltage cable lines, based on the requirements of norms and standards.
Figure 1 and Figure 2 present the grounding configurations of the screens selected for simulation studies. Figure 1a shows the most commonly used both-end grounding of the cable screens. Figure 1b shows the single-point grounding method, commonly used in HV lines. This method requires the use of an ECC cable (earth continuity conductor) to conduct the short-circuit current.

Figure 1.
Functional diagrams of the most popular methods of grounding the cable screens of power cables: (a) Both-end bonding (BE); (b) Single-point bonding (SPB) with cable ECC.
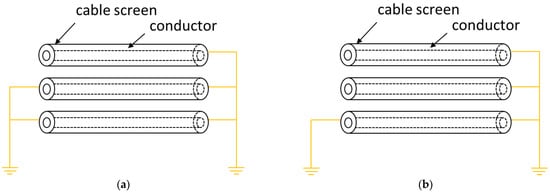
Figure 2.
Functional diagrams of variants of cable screens grounding methods: (a) variant a—one-sidedly ungrounded one of the cable screen phases from a three-phase cable line; (b) variant b—one-sidedly ungrounded two of the cable screen phases from a three-phase cable line.
Grounding variants for the cable screens based on the methods shown in the figures above are shown in Figure 2. For ease of identification, they will be referred to in the following sections as variant a and variant b. In these configurations, one or both of the cable screens of a three-phase cable line are ungrounded on one side. This configuration limits the flow of induced current through the conductors and, therefore, the losses. However, it can lead to a potential difference at the ends of the cable screen and, consequently, to the induction of voltage that may exceed a safe value from the perspective of the external insulation and further lead to its damage. According to standards, the external insulation of an MV cable should be able to withstand a voltage of 5 kV applied to it for 1 min [22].
3. Materials and Methods
The assessment of the impact of the change in the type of disturbance on the occurrence of ground fault overvoltage in the cable screen of the cable using the variants of their operation configuration proposed in the article will be based on simulation studies carried out using the Power Factory environment ver. 2022 (DIgSILENT GmbH, Gomeringern, Germany).
Figure 3 presents a schematic diagram of a section of the power grid, which served as the starting point for creating the simulation model. The grid, assumed as the basic configuration, consists of the power supply section at the HV/MV substation, which houses the HV/MV supply transformer and a grounding transformer with an arc-suppression coil. Furthermore, the substation is equipped with two feeder bays, one of which, the cable-to-overhead line, will be the point for the modifications. The tests will include the voltage waveforms induced in the cable screen and the maximum short-circuit overvoltage level generated in the cable screen of the power cable due to a short circuit occurring near the cable in the overhead line connected with the cable at the cable head. The network simulation model created for the tests is shown in Figure 4.
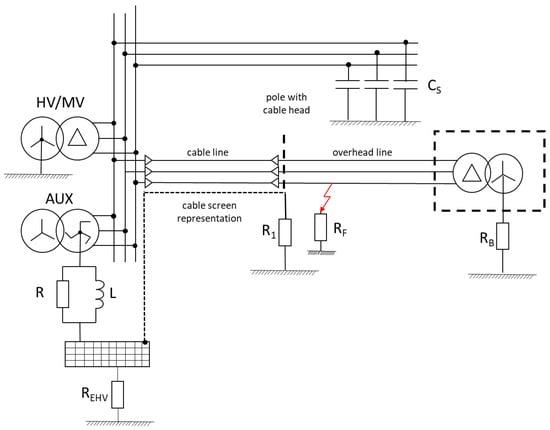
Figure 3.
Schematic diagram of a network fragment for testing overvoltage in the cable screens of a three-phase cable line.
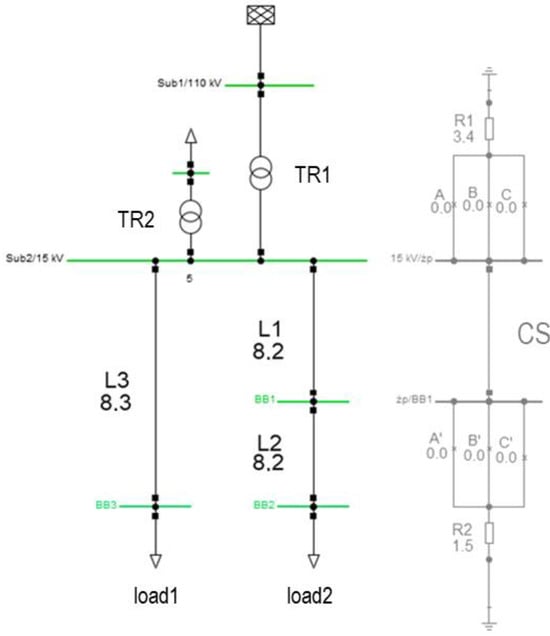
Figure 4.
Network model implemented in the Power Factory program for testing voltages induced in the cable screen of a three-phase cable line.
Due to the limitations of the tools used, simulation studies require careful consideration of the parameters of the selected devices modeled in the network. In studies determining the impact of variables on electrical quantity parameters, these changes must be controlled. Therefore, it was decided to use constant parameters for most circuit elements to avoid introducing additional uncertainties. Limitations also apply to the types of proposed fault scenarios.
Modeling the grounding configuration of the screens specified in Section 2 of this article was possible by isolating the screen from the cable line and then separating the screen phases in a three-phase system. Each phase, both at the substation connection and at the overhead line connection, was equipped with a switch that allowed the configuration to be changed from a both-end-grounded system to a system with any number of phases ungrounded. The parameters of the power grid model components selected for testing are presented in Table 1. Information regarding the parameters of the network model components was verified using the manufacturers’ catalogs [23,24,25,26].

Table 1.
Model elements parameters.
During the tests, it was decided to reconfigure the cable screens’ connections at the point of connection of the cable with the overhead line, with the cable head, due to the increased risk of overvoltage at such a connection point compared to the point of connection in the power substation.
The Power Factory program, version 2022 SP4, was used to conduct simulation tests. The computer simulation steps were selected to record voltages induced in the cable screens during normal operation and during the transition to a fault state resulting from a short circuit. Simulation parameters were selected according to Table 2. The Power Factory computer program used for simulation studies allows for the creation of simulation events with specific properties, during which characteristic quantities for all components of the modeled power network are calculated. In the case of internal overvoltage analysis, the primary goal of the event is to simulate any type of short circuit, the current of which will affect the voltages induced in the cable screens, while current flows through the cable’s cores.

Table 2.
Power Factory simulation event properties.
The characteristic value curves obtained from the simulation event were obtained using the Diagrams tool, which allows for the analysis of the variability of the values during the simulation. This solution allowed for the determination of both the maximum overvoltage values occurring during the fault and the nature of the voltage curve during the fault. An example voltage curve for the parameters listed in Table 1 and for the properties of the simulation events described in Table 2 is presented in Figure 5. The model curve was obtained by simulating a ground fault in phase A of an overhead line connected to a cable line operating with both ends bonded. The result is a voltage curve recorded in the cable screen of phase A at the point where the cable line connects to the overhead line, which in a real system would be a cable terminal located on an overhead line pole. In the model, this location is marked as node J. The trace below shows a significant difference between the voltage levels before and after the occurrence of a ground fault, induced in the cable screen, as well as the ground fault overvoltage associated with the occurrence of a ground fault near the grounding of the line pole to which the cable screens are connected.
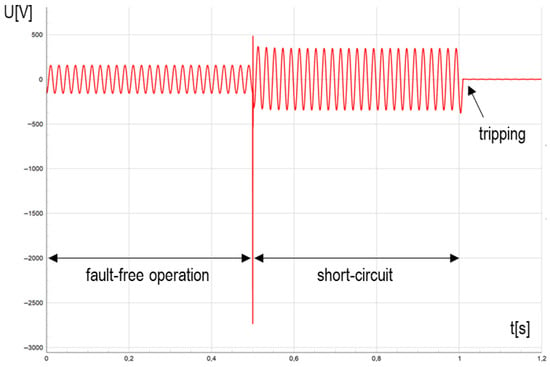
Figure 5.
An example of the events that occurred during the simulation, presented as a time-varying voltage for the cable screen in phase A.
To illustrate the nature of overvoltage occurring in the cable screens of power cables simulated in the program, Figure 6 shows an approximation of a fragment of the example waveform from Figure 5, in which a ground fault overvoltage occurs. According to the literature, this is an internal overvoltage with a steep front and a rise time T1 of less than 20 μs. The attenuation of the overvoltage wave in the system, which results in a reduction in the steepness of the front and amplitude, and consequently a return to a sinusoidal waveform, occurs as a result of resistive attenuation. These result, among other things, from energy losses in the resistance of the conductors or the ground.
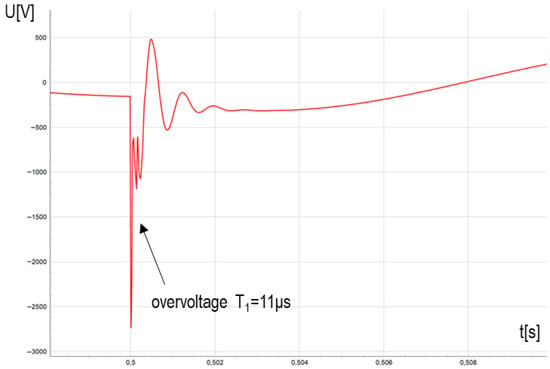
Figure 6.
An approximation of an overvoltage wave, which is a fragment of the induced voltage waveform in the cable screen of a cable line simulated in Power Factory.
4. Results
As part of the simulation studies, the waveforms of voltages induced in the cable screens of a three-phase cable line during the occurrence of phase-to-phase and ground faults will be presented as follows:
- single-phase ground fault in phase A;
- two-phase short-circuit to ground between phases A and B;
- two-phases short-circuit to ground between phases B and C;
- three-phase short circuit.
For each of the simulated faults, tests were conducted using four variants of the cable screens grounding method: BE, SPB, and variants a and b described in Section 2. All proposed short circuit types were implemented on an overhead line connected to a cable line in a line bay, a short distance from their connection point. Some of the short circuits selected for testing were phase-to-phase faults, which do not account for current flow in the ground return circuit. Therefore, the voltage induced in the sheaths will be related to the interactions of the cable line’s conductors. The results are presented below in a summary table of the maximum voltages induced in the screens of the three-phase cable line, taking into account the cable screens’ grounding variant. Selected voltage waveforms are also included to illustrate the voltage induced in the cable screens during the simulation.
The first test conducted was a simulation of a ground fault in phase A, according to the model in Figure 4. The results of the highest voltage values induced in the screens at the cable line connection point to the terminal on the overhead line pole are presented in Table 3. The results indicate that the maximum voltage induced in the screens will depend not only on the grounding method but also on the phase in which the fault occurs. This is best seen by comparing the results for variants a and b, where in variant a, only the screen of phase A is ungrounded, while in variant b, both the screens of phase A and phase B are ungrounded. The values presented in the table indicate, in accordance with the literature, an increase in induced overvoltage when the number of single-sided ungrounded screen phases increases.

Table 3.
Absolute maximum values of voltages induced in the cable screen during a single-phase ground fault.
To present the obtained results, waveforms were selected to compare the induced voltage in phase A, where modifications to the grounding method of the screen were also made. Furthermore, a ground fault was simulated in phase A, so the fault current will flow through the conductor of this phase. The voltage results in the screen of phase A are presented as waveforms for all four screen operating variants in Figure 7. As can be seen from the analysis of the results in Table 3 and the graphic below, the voltage differences in the screen resulting from the cable screen grounding method become visible only during fault operation. For SPB connection of the cable screens, these values are, as expected, the highest, while the lowest induced voltage appears in the screens, whose potential is equal at both ends, i.e., in the BE configuration. The proposed variants a and b are characterized by a relatively high value of the ground fault overvoltage, while the voltage during the disturbance is significantly lower.
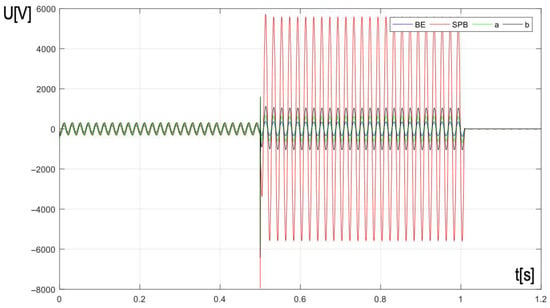
Figure 7.
Waveform of the voltage induced in the cable screen of phase A of a three-phase cable line during a single-phase ground fault.
The next simulations performed represented a two-phase-to-ground fault in an overhead line connected to a cable line. In the first configuration, the fault was modeled between phases A and B, while in the second, between phases B and C. Comparing the results of these configurations will allow to assess how the maximum voltage induced in the cable screen will be affected by the lack of grounding of this sheath of the phases through which the fault current flows. Table 4 and Table 5 present the highest voltage values obtained from the simulation of two-phase faults in the model.

Table 4.
Absolute maximum values of voltages induced in the cable screen during a two-phase short-circuit with ground (phases A and B).

Table 5.
Absolute maximum values of voltages induced in the cable screen during a two-phase short-circuit with ground (phases B and C).
To compare the variables in the phases affected by the fault, the maximum ground-fault overvoltage values were used. They indicate an increase in the overvoltage in the faulted phase, although the level of change will also depend on whether the cable screen of a given phase is grounded on both sides. This analysis was conducted based on the overvoltage values obtained for the cable screens of phase A and phase C, bearing in mind that phase A is ungrounded on one side in three variants, while phase C is ungrounded on one side in only one of the variants (SPB).
The waveforms presented in Figure 8 show the voltage induced in the cable screens of all three phases of a cable line when one screen of one phase, in this case phase A, remains ungrounded on one side. This is variant a for a situation where a two-phase-to-ground fault current flows in phases A and B of the line’s conductors. As can be seen, incomplete grounding of the cable screen of the faulted phase A causes the voltage on it to be higher during the fault than in the case of the also faulted phase B.
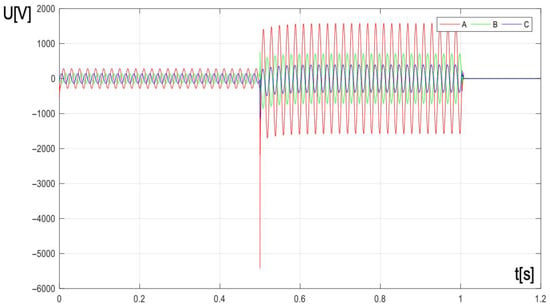
Figure 8.
Waveform of the voltage induced in the cable screen of phase A of a three-phase cable line during a two-phase ground fault of phases A and B for variant a.
Due to the selection of faults, which are based, among other things, on short circuits in phase B of the modeled overhead cable, Figure 8 and Figure 9 present the waveforms of voltages induced in these phases for both cases of two-phase faults. It can be seen that, depending on the type of fault and the method of grounding the screens, the current flow associated with the fault will change and significantly affect the shape and level of voltages induced in the screens during the fault. As previously assumed, the highest voltage values will occur when the two-phase fault also affects phase A. This case is illustrated in Figure 9.
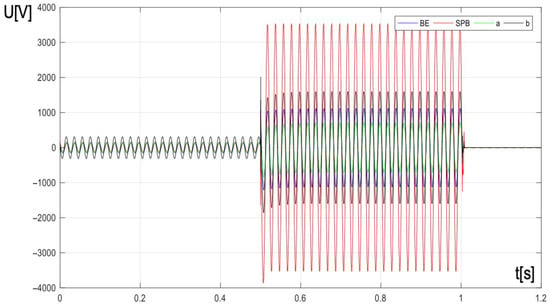
Figure 9.
Waveform of the voltage induced in the cable screen of phase A of a three-phase cable line during a two-phase ground fault of phases A and B.
As described, it can be seen that for a two-phase fault of phases B and C to earth, where only for variant b of earthing and SPB method, the screen of one or both of these phases is ungrounded, the voltage is significantly higher than in the other configurations, as it is shown in Figure 10.
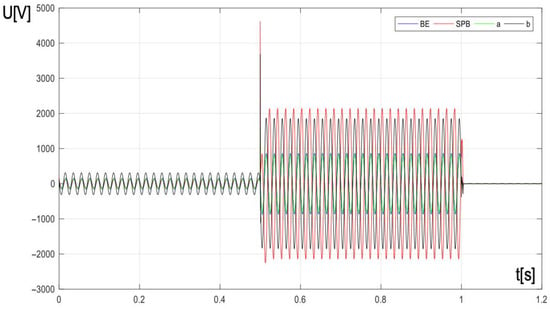
Figure 10.
Waveform of the voltage induced in the cable screen of phase A of a three-phase cable line during a two-phase ground fault of phases B and C.
The latest simulation results presented in this article concern the occurrence of a three-phase fault in an overhead line. The results, showing the maximum voltage induced in the cable screens in systems using various grounding methods, are presented in Table 6. Despite the highest currents expected during three-phase faults in MV networks, the overvoltage values obtained from the simulations are not the highest among the studies conducted. This is significantly influenced by the lack of grounding in the cable screen overvoltage calculations. The obtained results allow us to estimate the overvoltage values generated in the screens of a power cable as a result of a three-phase fault in the line at a level of up to approximately 5 kV.

Table 6.
Absolute maximum values of voltages induced in the cable screen during a three-phase short-circuit.
In order to present the relationship between the voltages induced in the cable screen of individual phases of the cable line in the event of a three-phase short circuit in the line, Figure 11 was created, which shows the voltages on the screens of phases A, B, and C for variant a. The results in the form of voltage waveforms and information on the maximum voltages given in Table 6 show that in the case of a three-phase short circuit, the overvoltage in the each individual phase differ significantly (for phase A, the overvoltage is 5 times bigger than for phases B and C), while for phase A, which is not grounded on one side, the voltage induced during the short circuit is only twice as big as the voltages in the cable screens grounded on both sides.
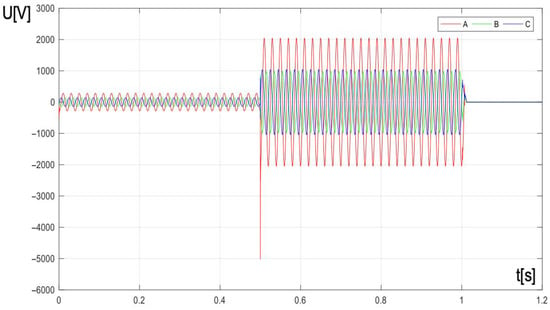
Figure 11.
Waveform of the voltage induced in the cable screen of phase A of a three-phase cable line during a three-phase short-circuit for variant a.
The most common ungrounded cable screen among the selected configurations is the one in phase A of the cable line; thus, it is most vulnerable to dangerous overvoltage and elevated voltages resulting from fault conditions. Figure 12 presents the simulated voltage waveforms in the cable screen of phase A of the cable for all four grounding configurations considered. As can be seen, in the case of a three-phase short circuit, despite significant changes in the overvoltage value in the phase shown in Table 6, the voltages induced during the fault range from approximately 1 kV to approximately 2.5 kV. As expected for the BE method, these values are the lowest and increase for each variant as the number of ungrounded phases increases.
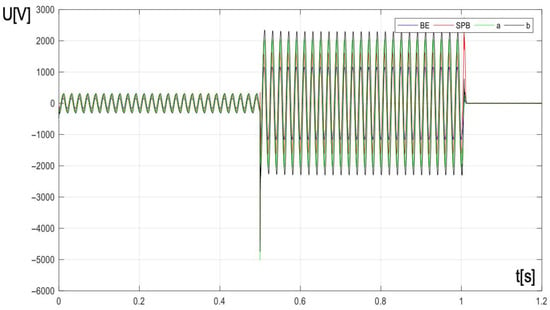
Figure 12.
Waveform of the voltage induced in the cable screen of phase A of a three-phase cable line during a three-phase short-circuit.
5. Conclusions
This article presents an analysis of voltages and overvoltages induced in the metallic sheath of the medium-voltage cable line as a result of fault currents flowing through the cable’s conductors, with particular focus on the grounding method for the cable’s screens. The study was conducted using computer simulations using Power Factory software, which resulted in voltage waveforms in the cable screens of a modeled three-phase cable line and the absolute maximum voltages occurring on the cable screens during a short circuit. Based on the results obtained, the impact of different grounding configurations of the cable screens was analyzed in conjunction with changes in the type of fault occurring in the network. The primary criterion for assessing the voltages discussed was the overvoltage protection of the cable’s outer sheath, which assumed that the voltage on the cable screen should not exceed 5 kV.
For the BE grounding configuration of the screens, ensuring the lowest voltage during the modeled faults, in none of the cases considered does it exceed a safe value from the perspective of the outer sheath. For the remaining configurations, this depends on the type of fault and the phase in which it occurs. It is worth noting that the voltages induced in the proposed variants a and b, which are designed to reduce transmission losses in the cable line relative to the grounding on both sides, in the network configuration specified in the article, are characterized by a significant increase in overvoltage in the phases that are not grounded on both sides. Such a solution would, therefore, require the introduction of an additional device into the ungrounded screen system, i.e., an SVL, that could protect the outer cable sheath against overvoltage.
It is also worth noting the voltages induced during a fault, which are presented in the form of selected waveforms from the simulations in Figure 7, Figure 8, Figure 9, Figure 10, Figure 11 and Figure 12. For the SPB method, the voltages during the fault are significantly higher, while for the other configurations, they remain at a similar level in most of the tests.
Summarizing the results obtained from the computer simulations, it can be seen that, as assumed, the voltages induced in the cable screens depend both on the grounding method and the type of fault that causes it. When selecting the screen configuration, the parameters of the network in which the cable line will operate should be taken into account to limit the risk of overvoltage to which the outer sheath may be exposed.
Author Contributions
Conceptualization, K.W. and A.S.-S.; methodology, A.S.-S.; software, A.S.-S.; validation, K.W. and A.S.-S.; formal analysis, A.S.-S.; investigation, A.S.-S.; resources, A.S.-S.; data curation, A.S.-S.; writing—original draft preparation, K.W. and A.S.-S.; writing—review and editing, K.W. and A.S.-S.; visualization, A.S.-S.; supervision, K.W.; project administration, A.S.-S.; funding acquisition, K.W. All authors have read and agreed to the published version of the manuscript.
Funding
This research was financed by the Poznan University of Technology’s financial resources for statutory activity. Number of the project: 0711/SBAD/4701/PB/2025.
Data Availability Statement
The original contributions presented in this study are included in the article. Further inquiries can be directed to the corresponding author.
Conflicts of Interest
The authors declare no conflicts of interest.
Abbreviations
The following abbreviations are used in this manuscript:
| MV | Medium Voltage |
| HV | High Voltage |
| EHV | Extra High Voltage |
| SVL | Surge Voltage Limiter |
| HV/MV | High Voltage/Medium Voltage Power transformer |
| AUX | Auxiliary transformer |
| BE | Both end bonding |
| SPB | Single point bonding |
| ECC | Earth continuity conductor |
References
- Czapp, S.; Dobrzynski, K. Safety Issues Referred to Induced Sheath Voltages in High-Voltage Power Cables—Case Study. Appl. Sci. 2020, 10, 6706. [Google Scholar] [CrossRef]
- Baayeh, A.G.; Cappelle, J.; Kleemann, M. Fault Location Method for Medium Voltage Cables Using Sheath Currents in Inverter-Based Resource Networks. IEEE Access 2025, 13, 84925–84940. [Google Scholar] [CrossRef]
- Lowczowski, K.; Nadolny, Z.; Olejnik, B. Analysis of Cable Screen Currents for Diagnostics Purposes. Energies 2019, 12, 1348. [Google Scholar] [CrossRef]
- Deng, X.; Ouyang, B.; Kong, X.; Zhao, J.; Xia, R. Optimization of AC Resistance of Large Cross-section High-voltage Cable Conductor. High Volt. Eng. 2016, 2, 522–527. [Google Scholar]
- IEEE Guide for Bonding Shields and Sheaths of Single-Conductor Power Cables Rated 5 kV trough 500 kV; IEEE Standard Association: Piscataway, NJ, USA, 2014.
- Gong, Q.; Li, K.; Zheng, J.; Sheng, Y.; Li, S.; Xu, Y. Study on Sheath Voltage and Earth Potential Rises of the Hybrid Overhead-cable Line. In Proceedings of the 5th International Conference on Energy, Electrical and Power Engineering, Chongqing, China, 19–21 September 2022; pp. 240–244. [Google Scholar]
- Czapp, S.; Dobrzyński, K.; Klucznik, J.; Lubośny, Z. Analysis of Induced Voltages and Power Losses in High Voltage Cables for Selected Methods of Cables Sheaths Bonding. Acta Energetica 2017, 2, 29–35. [Google Scholar] [CrossRef]
- Duda, D.; Szadkowski, M. Surge protection of HV cables sheaths in various shield connection systems. Przegląd Elektrotechniczny 2014, 10, 37–40. [Google Scholar]
- Guevara Asorza, J.E.; Colqui, J.S.L.; Filho, J.P. Analysis of bonding sheath methods of cables in multi-circuit systems of renewable energy parks. In Proceedings of the IET Powering Net Zero, (PNZ), Birmingham, UK, 14–17 November 2024; pp. 213–217. [Google Scholar] [CrossRef]
- Bian, J.; Cao, H.; Zhang, J.; He, W.; He, Z.; Xu, Y. Simulation of Power Frequency Overvoltage of 500kV Parallel Cable Sheath in Single-Ended Grounding. In Proceedings of the 11th International Forum on Electrical Engineering and Automation (IFEEA), Shenzhen, China, 22–24 November 2024; pp. 131–135. [Google Scholar] [CrossRef]
- Velsquez, R.M.A. Transient analysis of temporary overvoltage and cable faults in underground medium voltage systems. Results Eng. 2025, 25, 103875. [Google Scholar] [CrossRef]
- Nikolov, N.; Atanasov, V.; Stoilov, D. Methods for Metal Screens Bonding of High Voltage Cable Lines. In Proceedings of the 16th Electrical Engineering Faculty Conference (BulEF), Varna, Bulgaria, 10–13 September 2024; pp. 1–9. [Google Scholar] [CrossRef]
- Schött-Szymczak, A.; Walczak, K. Impact of Cable Configuration on the Voltage Induced in Cable Screen during Work with One-Sidedly Ungrounded Cable Screen. Energies 2021, 14, 4263. [Google Scholar] [CrossRef]
- Schött-Szymczak, A.; Walczak, K. Analysis of Overvoltages Appearing in One-Sidedly Ungrounded MV Power Cable Screen. Energies 2020, 13, 1821. [Google Scholar] [CrossRef]
- Cholewicki, T. Elektrotechnika Teoretyczna: Theoretical Electrical Engineering, Volume I, 2nd ed.; WNT: Warszawa, Poland, 1971. [Google Scholar]
- Cholewicki, T. Elektrotechnika Teoretyczna: Theoretical Electrical Engineering, Volume II, 2nd ed.; WNT: Warszawa, Poland, 1969. [Google Scholar]
- Krakowski, M. Obwody Ziemnopowrotne: Ground Return Circuits; Wydawnictwo Naukowe WNT: Warszawa, Poland, 1979. [Google Scholar]
- Krakowski, M. Elektrotechnika Teoretyczna. Pole Elektromagnetycze: Theorerical Electrical Engineering. Electromagnetic Field, Volume 2, 5th ed.; Wydawnictwo Naukowe PWN: Warszawa, Poland, 1995. [Google Scholar]
- Ye, H.; Zhang, W.; Huang, C.; Qin, H. A Method for Medium Voltage Underground Cables Incipient Fault Detection and Location using Sudden Change of Sheath Current. In Proceedings of the 7th Asia Conference on Energy and Electrical Engineering (ACEEE), Chengdu, China, 25–27 July 2024; pp. 155–160. [Google Scholar] [CrossRef]
- e-CIGRE. Technical Brochure 283: Special Bonding of High Voltage Power Cables, Working Group B1.18. 2005. Available online: https://www.e-cigre.org/publications/detail/283-special-bonding-of-high-voltage-power-cables.html (accessed on 24 August 2025).
- Heiss, A.; Balzer, G.; Schmitt, O.; Richter, B. Surge arresters for cable sheath preventing power losses in MV networks. In Proceedings of the 16th International Conference and Exhibition on Electricity Distribution, 2001. Part 1: Contributions. CIRED, Amsterdam, The Netherlands, 18–21 June 2001; Volume 1. [Google Scholar] [CrossRef][Green Version]
- HD 620 S2:2010; Distribution Cables with Extruded Insulation for Rated Voltages from 3,6/6 (7,2) kV up to and Including 20,8/36 (42) kV. NSAI: Dublin, Ireland, 2010.[Green Version]
- Catalogue of MVcable Lines with Isolation, X.L.P.E.; NKT. Available online: https://www.nkt.com.pl/fileadmin/user_upload/Products/Data_sheets/NA2XS_F_2Y__XUHAKXS__12_20_kV_DS_PL_EN.pdf (accessed on 20 May 2025).[Green Version]
- Catalogue of Overhead Line PAS 70 s. 26–27. Available online: https://www.eltrim.com.pl/assets/katalogi/Katalog-przewody-napowietrzne-2020.pdf (accessed on 20 May 2025).[Green Version]
- Catalogue of Grounding Transformer. Available online: http://www.ftz.pl/transformatory-uziemiajace-olejowe.php (accessed on 20 May 2025).[Green Version]
- Catalogue of Power Transformer 110/15. Available online: http://www.ftz.pl/download/Transformatory%20Mocy.pdf (accessed on 20 May 2025).[Green Version]
Disclaimer/Publisher’s Note: The statements, opinions and data contained in all publications are solely those of the individual author(s) and contributor(s) and not of MDPI and/or the editor(s). MDPI and/or the editor(s) disclaim responsibility for any injury to people or property resulting from any ideas, methods, instructions or products referred to in the content. |
© 2025 by the authors. Licensee MDPI, Basel, Switzerland. This article is an open access article distributed under the terms and conditions of the Creative Commons Attribution (CC BY) license (https://creativecommons.org/licenses/by/4.0/).