Article

Environmental and Economic Optimisation of Single-Family Buildings Thermomodernisation

Faculty of Geology, Geophysics and Environmental Protection, AGH University of Krakow, Mickiewicza 30, 30-059 Kraków, Poland
*
Author to whom correspondence should be addressed.
Energies 2025, 18(16), 4372; https://doi.org/10.3390/en18164372 (registering DOI)
Submission received: 9 July 2025 / Revised: 12 August 2025 / Accepted: 14 August 2025 / Published: 16 August 2025
(This article belongs to the Special Issue Heat Transfer Analysis: Recent Challenges and Applications)

Abstract

This study offers a detailed environmental, energy, and economic evaluation of thermal modernisation options for an existing single-family home in southern Poland. A total of 24 variants, combining different heat sources (solid fuel, biomass, natural gas, and heat pumps) with various levels of building insulation, were analysed using energy performance certification methods. Results show that, from an energy perspective, the most advantageous scenarios are those utilising brine-to-water or air-to-water heat pumps supported by photovoltaic systems, reaching final energy demands as low as 43.5 kWh/m2year and primary energy demands of 41.1 kWh/m2year. Biomass boilers coupled with solar collectors delivered the highest renewable energy share (up to 99.2%); however, they resulted in less notable reductions in primary energy. Environmentally, all heat pump options removed local particulate emissions, with CO2 reductions of up to 87.5% compared to the baseline; biomass systems attained 100% CO2 reduction owing to renewable fuels. Economically, biomass boilers had the lowest unit energy production costs, while PV-assisted heat pumps faced the highest overall costs despite their superior environmental benefits. The findings highlight the trade-offs between ecological advantages, energy efficiency, and investment costs, offering a decision-making framework for the modernisation of sustainable residential heating systems.

1. Introduction

To achieve climate neutrality, the need to transform our entire economy to reduce greenhouse gas emissions, in particular in the heat and power generation sector, has been raised [1] This requires the development of integrated energy, water, and environmental systems towards climate neutrality for sustainable development [2], especially in the context of climate mitigation ambitions, which should lead to carbon neutrality [3]. Developing energy generation based on renewable energy sources (RES) is also indispensable. Moreover, apart from increasing the share of renewable energy in electricity and heat production, another important task is to develop regulations favouring the development of local, sustainable energy areas within energy clusters or cooperatives [4]. Broader energy efficiency initiatives remain essential, including promoting the development of energy-efficient buildings and enhancing energy efficiency, with a primary focus on reducing energy consumption through energy renovation.
An energy assessment of buildings makes it possible to determine their energy intensity, which is the starting point for planning an energy transition. Forecasting future energy demand in the context of heating buildings is therefore important. In the broader context, the analysis of energy consumption in buildings provides valuable information on potential economic shocks and environmental impacts [5,6]. From a technological point of view, research in this area has been conducted by, among others, Tettey et al. (2016) [7], Guarino et al. (2016) [8], Jiang et al. (2021) [9], Gibbons and Javed (2022) [10]. The development of technologies for building energy management is a critical aspect in this context, especially for HVAC systems [11,12,13], and future optimisation will be related to the application of artificial intelligence algorithms [14,15] and building energy management [16].
Replacing heat sources in buildings in areas that take measures to improve energy efficiency is often a fundamental step towards success. However, these investments become much more effective if accompanied by measures to ensure appropriate building thermal insulation standards [17]. To operate efficiently (from both environmental and economic points of view), the heating systems must be installed in buildings with a favourable balance of heat losses and gains. Ensuring adequate thermal insulation of buildings reduces the energy demand for heating or cooling them to the minimum possible values [18]. Depending on the needs, ceilings and walls should be insulated and windows replaced. Many buildings constructed in the 1980s, 1990s, or earlier pose considerable energy renovation problems. Many buildings constructed according to the so-called old standards and technical requirements require significant financial outlays to improve their thermal insulation. It is, therefore, necessary to support energy renovation measures in private buildings to enable heating systems to work efficiently. Initiatives taken by local authorities and the refurbishment of public buildings used by all residents help raise the general public’s environmental awareness. Authorities play an important role in disseminating information about energy renovation measures and, above all, in actively and effectively raising funds to subsidise such measures [19]. In addition to active solutions such as efficient heating systems and renewable energy technologies, passive design strategies play a crucial role in reducing building energy demand. Measures including optimised orientation, appropriate glazing, improved airtightness, thermal mass utilisation, and effective natural ventilation can significantly lower the heating and cooling loads. When integrated with active systems, these approaches contribute to achieving low-or nearly zero-energy standards while improving indoor comfort and reducing operational costs [20].
As indicated by Błazy et al. (2021) [21], the demand for primary energy in a building is influenced by its proper thermal modernisation, especially the thermal insulation of external partitions. Similar conclusions were drawn by Lis and Ujma (2016) [22]. In the case of the research by Błazy et al. (2021) [21], the authors focused on the environmental assessment of the effects of thermal modernisation, specifically air quality. The research was carried out for two voivodships, Śląskie and Małopolskie. The authors proposed four scenarios to show the relationship between the emission reduction value and the level of co-financing for thermomodernisation. Finally, they concluded that the higher the level of co-financing, the greater the willingness of stakeholders to undertake thermal modernisation measures; thus, the more significant the effects of improving air quality. This is an obvious conclusion, and it should be considered universal. This article does not consider any level of co-financing resulting from the desire to show actual investment costs. It should be stated directly that in the case of the analysed facility, similar to other facilities of this type that are not insulated, the costs of thermal modernisation are very high, and only a small part of society can afford such an expense.
It is worthwhile to refer to the Energy Performance Certificate (EPC) determination methodology used in this article to calculate a building’s useful energy requirements. Indeed, it is a method that also allows the setting of energy efficiency targets for buildings [23,24,25] and certainly provides valuable information on energy efficiency and building performance. This is all the more reason to strive to make the results presented in energy performance certificates as accurate as possible and reflect the real impact of the building on the energy system, the environment, and the economic sector, as Kaczmarczyk [6,16] called for in his articles. Conticelli et al. (2024) [26] and Manso-Burgos et al. (2023) [27] presented a method using EPCs to support urban planning. In both cases, the importance of EPCs as analytical tools for diagnosing energy efficiency problems at the city level was highlighted. Also, from the point of view of environmental quality, this is crucial [28].
Dzikuć (2017) [29] conducted research in Zielona-Góra (Lubuskie Voivodeship) to determine what primarily affects air quality. The author emphasises that even though Zielona Góra is located in an area with few industrial plants, the air quality is unsatisfactory. He sees the reasons primarily in local pollutant emissions coming mainly from households heated with solid fuels, followed by transport. Similar studies were then conducted for the entire Lubuskie Voivodeship, drawing similar conclusions (Dzikuć et al., 2021) [30]. This is confirmed by the fact that the processes of energy combustion of fuels, especially coal, are the primary source of anthropogenic emissions of pollutants. Over 75% of NOx and SO2 emissions, approximately 70% of CO emissions, over 75% of dust emissions, and over 90% of CO2 emissions originate from the combustion of conventional fuels [31]. The situation in which solid fuels are still the dominant fuel is mainly explained by the lack of an appropriate number of financial instruments aimed at households that would allow for investments in the thermal modernisation of buildings, including the use of renewable energy sources. It is important to note that assessing the environmental impact of buildings throughout their life cycle is crucial in the context of sustainability. This was pointed out by Piccardo and Gustavsson (2021) [32], Alvarez Florez et al. (2023) [33], and Ramon et al. (2023) [34]. The latter highlights the importance of climate change in long-term energy consumption analyses. Their study showed, among other things, that the demand for cooling buildings will increase in the future, which will affect the energy balance and the need to modify energy-management strategies. These conclusions are somewhat identical to those obtained in this article, regarding building heating.
It is natural that not only single-family buildings should be an area of interest in thermal modernisation. For example, research on thermal modernisation of multi-family buildings was conducted in Lithuania by Staniunas et al. (2013) [35], and in Poland, e.g., by Basińska et al. (2015) [36]. The authors presented a comparative analysis of the profitability ratios of investments in thermomodernisation to meet WT2021, i.e., one of the variants also analysed in this article. The authors compared the cost method with the most commonly used economic assessment tools, i.e., SPBT and NPV. They indicated that the method of global costs for the assessment of thermal modernisation is better than SPBT or NPV because, in their opinion, it allows the building assessment process to be carried out from the future assumed time perspective. Considering economic factors, the authors concluded that there is a cost-effectiveness limit, indicating the optimal variant despite the possibility of using greater insulation thickness or better quality materials [36]. Szulgowska-Zgrzywa et al. (2022) [37] drew attention to thermal modernisation in multi-family buildings erected before World War II. The authors considered the effects of thermal modernisation to be energy consumption, pollutant emissions, energy costs, and comfort of use. At the same time, they drew attention to a significant issue, which is the wealth of society. Their conclusions show that the impact of human factors on the energy intensity of buildings is greater than that estimated based on theoretical assumptions at the building design stage. The modernisation activities analysed by the authors indicated that the average reduction in energy costs after modernisation in the original state was 41%, and the decrease in operating expenses was only 2%.
Solutions to improve air quality are sought not only in the context of replacing heat sources. Many studies have been conducted on the implementation of district heating solutions based on renewable energy sources. Such examples include research by Hajto and Kaczmarczyk (2022) [38], who analysed the possibility of improving air quality using geothermal heating systems. Thermal modernisation measures alone are not sufficient to achieve climate neutrality. An interesting proposal that goes beyond the scope of thermal modernisation and falls within the scope of energy management was proposed by Liu et al. (2021) [39]. They developed a short-term model for forecasting building energy consumption 24 h in advance using a neural network and a Multi-Input Multi-Output strategy. First, it is desirable to increase the energy autonomy of the building based on the use of renewable energy sources (e.g., increasing self-consumption from PV installations). Andrews and Jain (2022) [40] also draw attention to the problem of discontinuity of energy generation in zero-emission sources, pointing out that the flexibility of energy demand is necessary to achieve success in a sustainable and reliable energy transformation. The authors claim that the current comparative methods focusing on annual energy consumption fail. They considered the impact of energy consumption time on emissions under rapidly changing power grid operating conditions. The authors based their conclusions on an analysis of the energy consumption of 306 primary and secondary schools in Southern California, USA. From the point of view of the progressive electrification of our lives, including the electrification of heating, it is difficult to disagree with such a statement. Shimoda et al. (2020) [41] argue that to develop a decarbonised society, two opposing requirements must be met: reducing the demand for energy and creating flexibility in the demand for it. This responds to fluctuations in electricity production from renewable sources. Renewable energy sources are significant factors [5].
Climate neutrality is tantamount to phasing out emissions of all greenhouse gases [1]. In the fuel and energy sectors, climate neutrality means zero life cycle greenhouse gas emissions (net life cycle assessment). One of the most important issues in this context is low stack emissions. It is defined as a phenomenon involving the emission of combustion products of solid, liquid, and gaseous fuels into the atmosphere from emission sources located at 40 m or less. These encompass different types of emissions, including traffic emissions, emissions resulting from heat production for central and water heating purposes, and industrial emissions [42]. The combustion products most frequently taken into account in quantitative assessments are carbon dioxide, carbon monoxide, sulphur dioxide, nitrogen oxides, polycyclic aromatic hydrocarbons, e.g., benzo(a)pyrene, and dioxins, as well as heavy metals, PM10, PM2.5, and frequently unidentified pathogens floating on dust particles. Pollution is further aggravated by the still unresolved problem of burning waste in domestic stoves. In Poland, the main sources of low-stack emissions are heat production and water heating (82.3%), 9.6% of the pollution originates from transport, 5.4% from industrial emissions, and other sources of low-stack emissions account for 2.7% [42,43]. In particular, the southern part of Poland is considered one of the most polluted areas in the European Union. This is due to climate conditions, as the heating season in Poland lasts from September to the end of April [44]. Addressing this problem requires various measures, such as replacing non-ecological boilers in homes, improving insulation, enhancing public transport, and limiting older vehicles. Some answers to this issue were a case of air pollution in Kraków and changes observed according to the implementation of a solid fuel ban. Kaczmarczyk and Sowiżdżał (2024) [28] analysed the data, which showed impressive effects on air quality improvements and potential in thermo-modernisation and ecological energy source utilisation in urban areas.
Local initiatives aimed at building energy renovations and installing renewable energy sources are becoming increasingly popular. However, these measures are perceived as capital-intensive. As a result, their implementation requires a thorough assessment of the energy demand of the building and specific individual targets, which can be achieved through energy audits. In this context, interesting research has been presented by Kaczmarczyk (2024) [6]. In assessing building energy performance, both the efficiency of its operation and its environmental impact play a decisive role in determining the overall energy intensity of the residential sector and shaping strategies for energy transition. Reliable planning of such measures requires an accurate determination of a building’s energy demand. In this study, a static calculation model was applied to conduct a multi-scenario evaluation of the analysed single-family building, considering various heating system configurations. This approach, based on the methodology for preparing energy performance certificates, was extended to include an assessment of the efficiency of individual energy systems and their associated pollutant emissions. For each of the twenty-four examined scenarios, values of final and primary energy demand, fuel consumption, and emissions were calculated. The findings revealed a lack of direct correlation between the primary energy indicator commonly used in building energy assessments and both the actual energy intensity and environmental burden of the building. Regarding the model building, which represents an individual customer, the issue of “efficient individual heating and cooling” has been considered. According to European Union regulations, this term refers to a separate heating and cooling supply option that, compared to efficient district heating and cooling, measurably reduces the input of non-renewable primary energy required to supply one unit of delivered useful energy within a relevant system boundary or requires the same input of non-renewable primary energy but at a lower environmental cost, taking into account the energy required for extraction, conversion, transport, and distribution. In many cases, the achievement of this goal must be preceded by a so-called “substantial refurbishment”, which means a refurbishment whose cost exceeds 50% of the capital cost for a new comparable unit.
Solid fuels, especially coal, are commonly used as energy carriers in Poland, accounting for most of the national energy mix. According to data from the Central Statistical Office [45], in 2021, 42.5% of all households were heated by solid fuel boilers. Burning solid fuels results in the emission of harmful substances into the atmosphere. The amount of these emissions depends primarily on the fuel combustion technology and quality. The increasingly noticeable effects of low-stack emissions, especially in the municipal and household sectors, make replacing outdated conventional stoves a crucial factor in improving the quality of life of residents of Polish municipalities.
Additionally, the thermal energy required for heating buildings accounts for as much as 65.1% of the total energy consumption by households in Poland, broken down by energy carriers and their types of use. This figure highlights the significant share of heating in household energy consumption [45]. Therefore, in newly constructed houses, considerable emphasis is placed on limiting heat loss through penetration and ventilation, which translates into lower heating costs. In buildings that do not meet high energy standards, it is necessary to carry out energy renovations, including external wall, ceiling, and roof insulation, replacing old windows, and upgrading the heating installation. This may involve replacing elements that distribute heat throughout the building (pipes, radiators) and replacing the existing heating source with a new, higher-efficiency, or more environmentally friendly system.
The purpose of this paper is to indicate environmentally friendly and energy-efficient alternatives for heating and hot water preparation in a model single-family building. The proposed methodology can be implemented in other buildings and locations, which adds value to this article. The added value of this article lies in its multivariate analysis of the use of different green energy sources, which contributes to the understanding of the effects of modernisation work. This is particularly important from the point of view of the investor and those responsible for energy planning in the municipality. The presented modernisation variants, the analysis of their ecological impact, and the economic effects possible from an investment point of view provide an auxiliary tool in the decision-making process of reducing the energy demand of buildings, justifying the investment decisions made.

2. Research Methodology

To this end, the thermal performance of the building was determined using an energy audit and thermal imaging. The feasibility of implementing solutions to reduce energy consumption, such as installing thermal insulation, mechanical ventilation with heat recovery, or heating system refurbishment, was analysed, as well as the feasibility of replacing a heat source with an environmentally friendly solution. Environmentally friendly solutions for electricity generation were selected, including the equipment and components required for refurbishment, and an economic analysis of the installation was conducted.
The study was carried out using Audytor OZC 7.0 Pro software developed by SANKOM. It is a tool that enables the generation of building energy performance certificates following the standards and regulations in force in Poland. The guidelines and calculation methodology implemented are based on the following documents:
  • ISO 6946 “Building components and building elements–Thermal resistance and thermal transmittance–Calculation methods”–the standard for calculating thermal transmittance coefficients of multilayer walls [46].
  • ISO 13370 “Thermal performance of buildings–Heat transfer via the ground–Calculation methods”–the standard for calculating thermal transmittance of building elements in contact with the ground [47].
  • ISO 10077-1 “Thermal performance of windows, doors and shutters–Calculation of thermal transmittance” [48].
  • ISO 12831 “Heating systems in buildings. Method for calculation of the design heat load”–the standard for calculating the heat load of a building [49].
  • ISO 13788 “Hygrothermal performance of building components and building elements. Internal surface temperature to avoid critical surface humidity and interstitial condensation. Calculation methods”–the standard for analysing the humidity of building elements [50].
  • Journal of Laws [Dz. U.] of 2015 item 376: Regulation of the Minister of Infrastructure and Development of 27 February 2015 on the methodology for determining the energy performance of a building or part of a building and certificates [51].
  • Journal of Laws [Dz. U.] of 2023 item 697: Regulation of the Minister of Development and Technology of 13 April 2023 changing Regulation of the Minister of Infrastructure and Development of 27 February 2015 on the methodology for determining the energy performance of a building or part of a building and energy performance certificates [52].
The methodology used to calculate primary energy in this study involved assessing the annual demand for non-renewable primary energy for the technical systems of the building and dividing it by the area of the heated or cooled space. The yearly energy demand was divided into specific components, including the demand for heating, domestic hot water, cooling, and built-in lighting. Each element was calculated based on the annual demand for final energy for the respective systems, which was then adjusted using specific coefficients to account for the non-renewable energy input required for energy production and delivery. The auxiliary energy required to operate the technical systems was also considered.
Final energy was determined by calculating the total annual final energy demand for the systems and dividing it by the heated or cooled area. The total energy demand for buildings with simple technical systems included all technical systems, and the final energy was adjusted accordingly. Lastly, usable energy was calculated by assessing the actual energy required to maintain the desired indoor conditions and normalised by the building’s heated or cooled area. This step-by-step approach allowed for a comprehensive assessment of the energy performance of the building, accounting for both the energy used and the efficiency of energy conversion processes. The methodology used is utilitarian and generally available in the aforementioned standards and regulations; therefore, it is replicable in other cases.
The analysed building is located in southern Poland in climate zone 3 (according to ISO 12831 [49]). The design external temperature during the heating season is −20 °C, and the average annual external temperature is 7.6 °C. The meteorological station closest to the building analysed is located in Nowy Sącz. The model is a four-story single-family house (Figure 1). The total area is 265.4 m2, the area of rooms with controlled air temperature is 191.98 m2, and the usable area is 188.26 m2. The total volume of the building is 529.8 m3, and the volume of rooms with controlled air temperature is 453.3 m3. The building has a south-facing gabled roof with a pitch of approximately 30°. The internal temperatures in the building were determined based on the guidelines contained in the Journal of Laws [Journal of Laws U.] of 2015 item 376 [51], which determines the heat demand of rooms depending on their function and purpose, and ultimately determines the heat demand of the entire building, concerning the design outside temperature. Based on these guidelines, the amount of energy required to heat domestic water was calculated. These issues are independent of the individual preferences of building users, which is consistent with the regulations and calculation methods used in this article.
The building was constructed in the 1970s, and as it stands, it is under-insulated, with a useful energy demand of 207.7 kWh/m2year. The design heat loss by penetration is 15,245.6 W, the design heat loss by ventilation is 2619.8 W, and the design heat load of the building is 17,865.4 W. Thermal needs, both concerning central heating and domestic hot water preparation, are met using a solid-fuel boiler, with the fuel consisting of 50% biomass and 50% of hard coal. However, these percentages are related to central heating. In the case of domestic hot water preparation, the needs of building users are met using biomass. With the energy needs met in this manner, the final energy demand for this building is 389.3 kWh/m2year, and the primary energy demand is 214 kWh/m2year. It should be emphasised that final energy takes into account the demand for useful energy and the efficiency of the building’s energy systems. At the same time, primary energy also takes into account the so-called non-renewable primary energy input factor. In the analysed case, this is partially biomass, for which the input factor is 0.2; hence, the value of primary energy is lower than the final energy. The share of renewable energy sources is 62.8% due to the use of biomass. The exact methodology for calculating the data presented above is described in Section 2.2. An extract from the energy performance certificate relating to the useful, final, and primary energy values is shown in Table 1.

2.1. Energy Analysis

For the model building analysis, 24 options for energy source switching and energy renovation works were assessed, and energy performance certificates were generated for each option. The basis for determining the number of variants was the desire to compare all available ecological forms of heat production for central heating and hot water needs. To enable the performance of these works, an on-site inspection was carried out before their commencement, which consisted of reading design documentation, verifying whether the building permit design corresponds to the actual state of affairs, and discussing with building owners to obtain any missing information. Options P0–P7 relate to the current state of affairs regarding the building’s useful energy demand, with P0 being the baseline option. P1–P7 are options in which the building structure is not altered, but the heat source is replaced to analyse how such a measure would change the final and primary energy values. Analogously, analysis was conducted concerning options T0–T7 and M0–M7, but for the options marked with the “T” symbol, energy renovation of the building was carried out to meet the technical conditions in force at the time of the study, i.e., WT2017 (Journal of Laws [Dz. U.] of 2017 item 2285) [53]. In the case of the options marked with the “M” symbol, the building was optimised to meet the technical conditions that will apply from 2021 onwards (WT2021) (Journal of Laws [Dz. U.] of 2017 item 2285) [53]. It is essential to understand the differences between the technical conditions mentioned. They set requirements for newly constructed buildings and buildings undergoing thermal modernisation using public financial resources (subsidies) regarding the maximum value of primary energy. For single-family buildings, this value, according to WT2017, was 95 kWh/m2 year, and according to WT2021, it is 70 kWh/m2year. Additionally, the maximum allowable heat-transfer coefficients for building partitions have changed. A summary of all options is presented in Table 2.
It should be noted that for options involving a 50% biomass and 50% hard coal mix, it is assumed that 100% of domestic hot water is generated using biomass. These values were adopted based on discussions with the facility owners during the site inspection. Additionally, it has been assumed that solar collector installations accounted for 40% of domestic hot water preparation, which is a typical value for Polish weather conditions. Of note is also the fact that the building is equipped with high-temperature radiator heating (80/60 °C); therefore, in the energy renovation options adopted, it was assumed that the operating parameters of heat pump-based systems would be as follows: a flow temperature of 55 °C and a return temperature of 45 °C. This is because no conversion of the central heating system from radiator to underfloor heating is assumed, and, of course, also because the heat demand of the building and its rooms will be reduced, allowing the existing system to be used with a lower flow temperature.
In the simulations, the coefficient of performance (COP) of the heat pumps was assumed to be a constant value based on typical operating conditions. Specifically, a COP of 3.3 was used for brine-to-water heat pumps, and 2.6 for air-to-water heat pumps. These values correspond to the operational characteristics of the heat pumps under the conditions described in this study. The fixed COP assumption reflects standard operation with flow temperatures suitable for high-temperature radiators (80/60 °C reduced to 55/45 °C after renovation). Although COP typically varies seasonally with outdoor temperatures, this study uses static values to maintain consistency and allow comparison across all scenarios. These values ensure compatibility with the building’s heating system and facilitate direct comparisons between variants, simplifying modelling and aligning with expected performance for the specific climate zone and building features. Future research could include dynamic COP variations affected by seasonal temperature changes to provide more detailed and accurate insights.
In all cases, the share of RES should be understood as the percentage of RES in the total energy utilisation of the building for heating purposes. To meet the technical conditions stipulated in WT2017, it was necessary to carry out an energy renovation of walls and floors that did not meet the required Umax thermal transmittance coefficient value. To this end, the ground floor was insulated with 10 cm-thick expanded polystyrene foam, the external walls were insulated with 15 cm-thick expanded polystyrene foam, the ceiling under the unheated attic was insulated with 22 cm-thick mineral wool, the roof was insulated with 30 cm-thick mineral wool, and the external doors and windows were replaced. A summary of energy renovation works, including thermal transmittance coefficients before and after energy renovation, is shown in Table 3.
Similarly, to achieve the WT2021 standard, energy renovation work involving the same measures was carried out. However, it was necessary to increase the thickness of the thermal insulation and use windows and doors with correspondingly lower thermal transmittance coefficients. Table 4 summarises the work carried out.

2.2. Economic Analysis

Several factors were taken into account to determine the economic effects. Reference was made to the costs of thermomodernisation works (investment costs) and operating costs. In the case of expenses incurred for the thermal modernisation of the building, the costs based on the average values of materials and work are listed in Table 5 and Table 6. As can be seen, the difference in the costs of modernisation work between the technical conditions of 2017 and 2021 is 7405.13 Euro. This results from using different insulating materials to meet the required heat transfer coefficients for individual partitions.
An economic analysis was carried out based on the energy demand determined for some of the options. In defining the fuels analysed, the following assumptions were made (concerning their Qw calorific values and net purchase prices of energy carriers), and on this basis, the consumption of the energy carrier in question was subsequently determined in measurement units given below in Table 7.
To determine the fixed costs of using the energy source, an estimate of the required capital expenditure is necessary. Based on experience and market research, the net capital expenditure rates for the technologies analysed were adopted as follows: biomass-fired boilers–EUR 217.39 per kW, solid-fuel boilers–EUR 173.91 per kW, solar collectors–EUR 1021.74 per kW, natural gas-fired boilers–EUR 147.83 per kW, brine-to-water heat pumps (including the installation of the lower heat source)–EUR 1086.96 per kW, photovoltaic cells–EUR 1086.96 per kW, and air-source heat pumps (including the installation of the lower heat source)–EUR 804.35 per kW. The depreciation period for the above installations, which is necessary to estimate fixed costs, was assumed to be 15 years. The capital expenditure figures stated here do not consider the costs associated with upgrading the boiler room, but only represent the cost of the heating source. It was assumed that the costs of upgrading the boiler room would be similar for all types of heating sources. It should be noted that the present cost analysis does not account for differences in the service life of individual components. This discrepancy can have a significant impact on the results of a life cycle cost assessment, particularly when comparing investment options with markedly different replacement intervals. Since the scope of this study did not include a payback period analysis or complete life cycle economic modelling, the calculations presented are based solely on uniform depreciation periods for all technologies. Future research should incorporate technology-specific lifespans to provide a more precise economic comparison over the entire operational horizon of the analysed systems.

2.3. Environmental Analysis

The environmental analysis aimed to determine the pollutant emissions of the model building from the combustion of solid fuels in the baseline option and to compare these emissions with those of the other energy renovation options. The analysis and calculations were carried out using data from the building’s energy audit, annual useful energy demand, and emission factors for fuels calculated by the National Centre for Emissions Management–KOBiZE [54]. The indicators were based on values applicable during the project’s implementation period. Although it is recognised that the carbon intensity of Poland’s electricity mix has decreased in recent years due to the rising share of renewable energy sources, dynamic modelling of this trend was beyond the scope of the current analysis. Future research could include time-dependent emission factors to account for the expected decarbonisation pathways of the national grid. The reduction in the emissions of individual substances compared to the baseline was also determined. The following pollutants were taken into account: total particulate matter (also broken down into PM10 and PM2.5), carbon dioxide (CO2), carbon monoxide (CO), nitrogen oxides (NOx), sulphur dioxide (SO2), and benzo(a)pyrene (BaP).
The amount of existing emissions and the degree of the expected environmental effect depend on several factors. The most important factors among these are the types of energy carriers used for central heating and hot water preparation, the amount of fuel consumed, and its physical and chemical parameters.
To calculate the pollutant emissions for heat production from fuel combustion, pollutant emission factors from fuel combustion for sources with a nominal heat capacity of up to 5 MW [54] were applied. For pollutant emissions from electricity generation, factors for electricity [55] were applied, as shown in Table 8. The emission factor value depends on the fuel type and technological solutions used in the heating source. For the P0 baseline option, emission factors for traditional coal-fired and wood-fired boilers were used. For options P1, P2, M1, M2, T1, and T2, emission factors for a manually loaded wood-fired boiler that met the Ecodesign Framework Directive 2009/125/EC requirements were used. For options P3, P4, M3, M4, T3, and T4, emission factors for natural gas were used, and for options involving heat pumps (P5–P7, M5–M7, and T5–T7), emission factors for electricity for the end customer (mixed electricity production) were used according to KOBiZE (2020) [55]. The energy provided by solar thermal and photovoltaic installations has emission factors of zero for all pollutants analysed. For energy renovation options involving a photovoltaic (PV)-powered heat pump, it was assumed that 70% of the annual electricity is supplied by the PV installation and 30% comes from the electricity grid. This is due to the limitations in the possibility of installing PV systems on roofs with greater electrical power. Before performing the calculations, the authors conducted a site visit and audit. Based on this, the technical condition of the building, including the roof, its orientation, pitch, and shading, was assessed. Therefore, a value of 70% was adopted. No local low-stack emissions are present for energy renovation options involving heat pumps (P5–P7, T5–T7, and M5–M7). Therefore, when these options are selected, the problem of low-stack emissions at the site is completely eliminated.
To calculate individual emissions based on the emission factors per unit of fuel consumed, the following formula was used:
E   =   Q   ×   W 1000 [ g / GJ ; Kg / MWh ]
where:
Q—seasonal energy consumption [GJ/year, MWh/year]
E—seasonal substance emissions [kg/year]
W—emission factor [g/GJ, kg/MWh]

3. Results

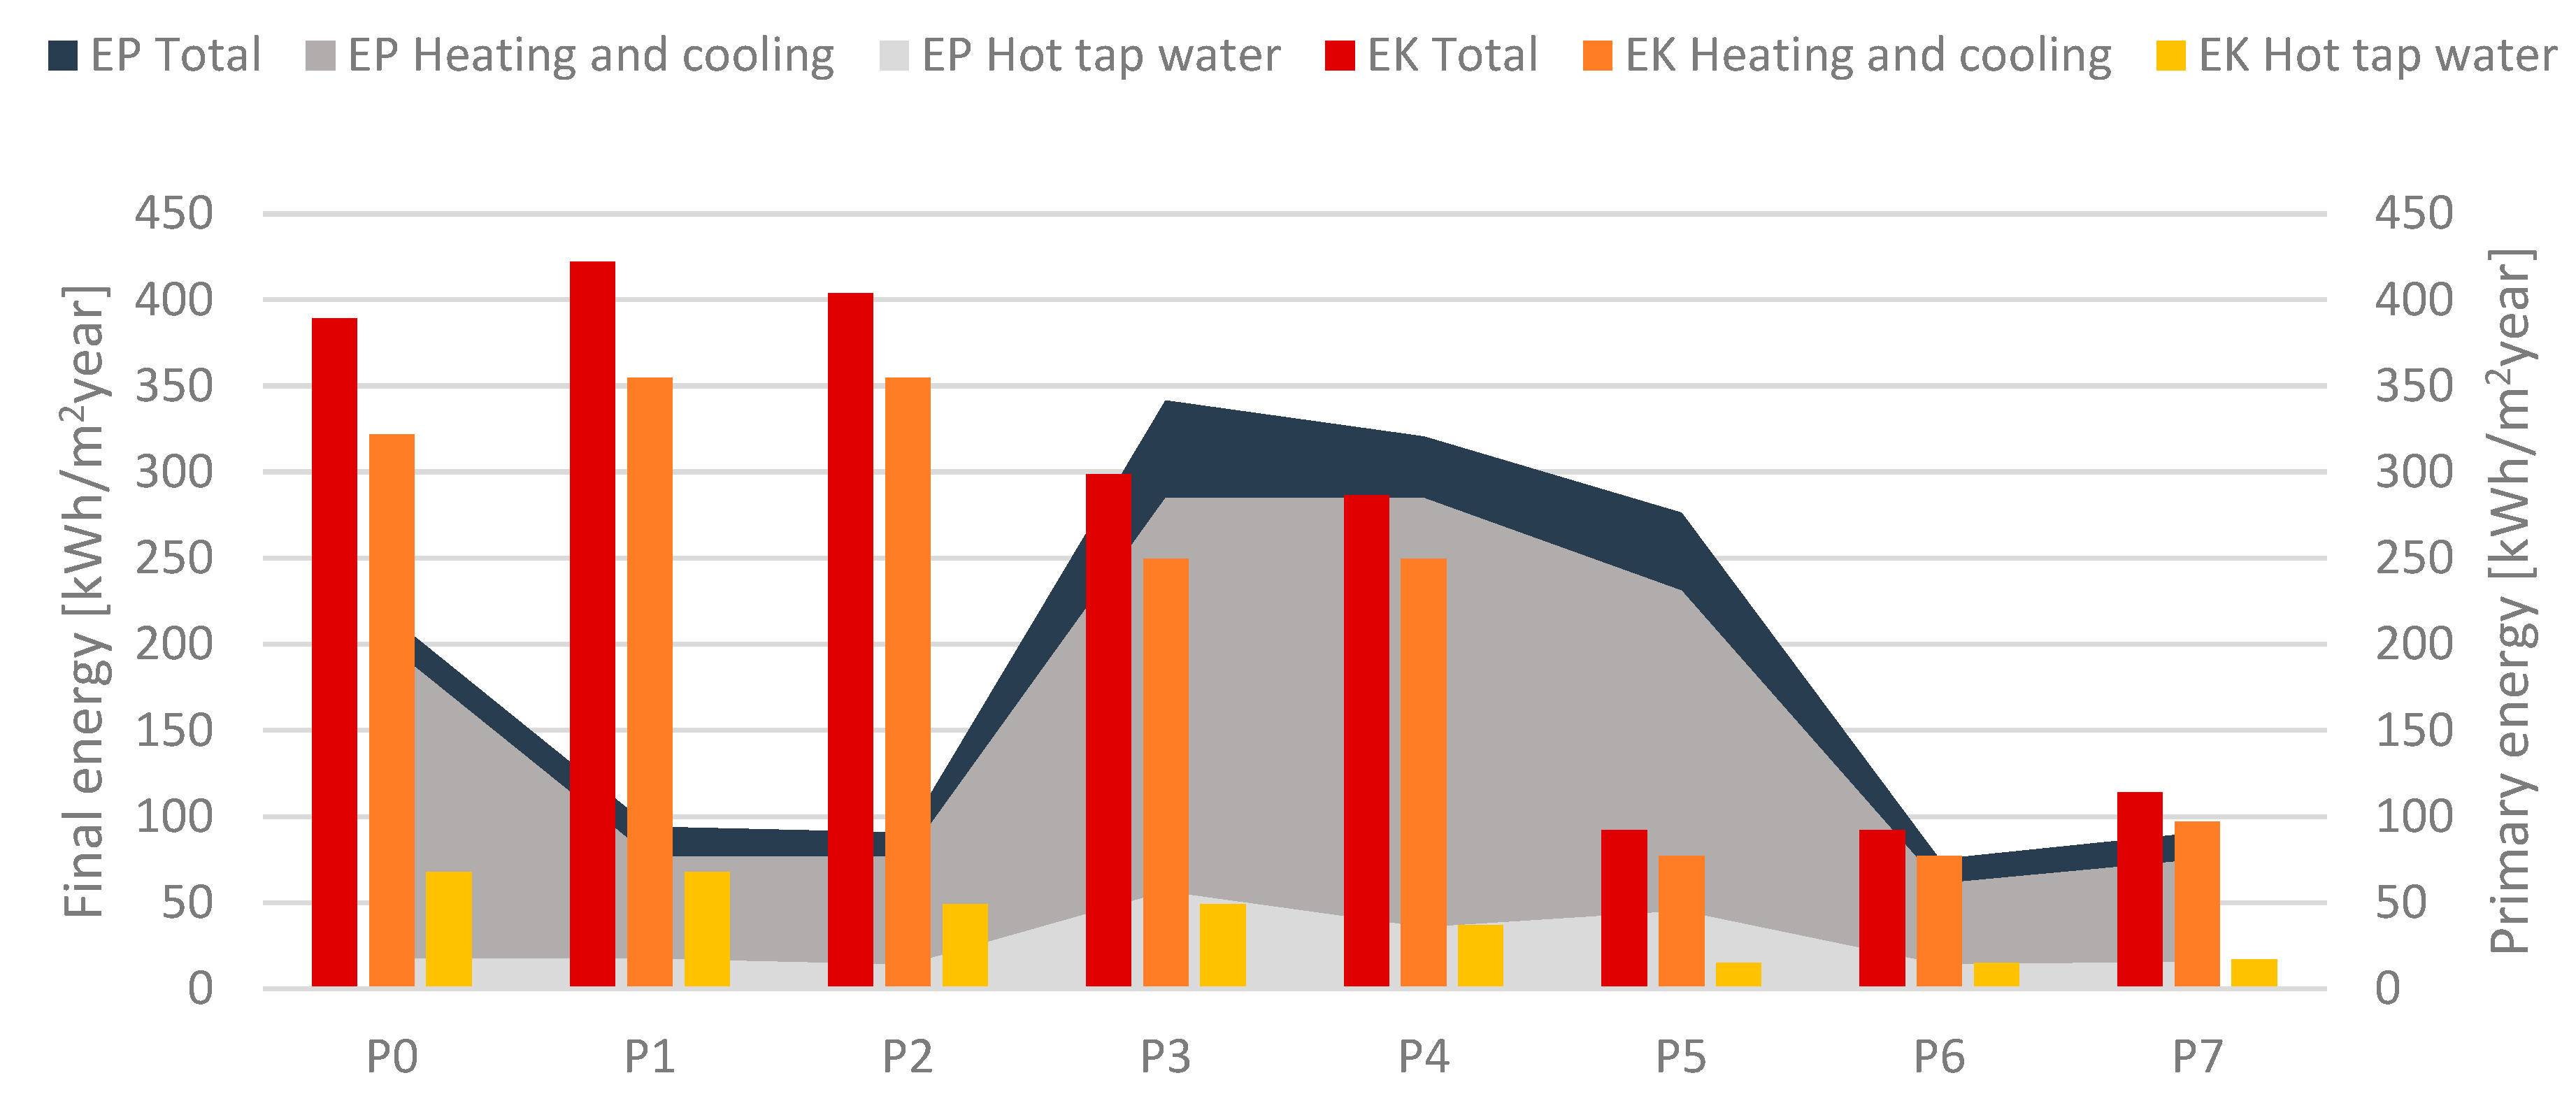
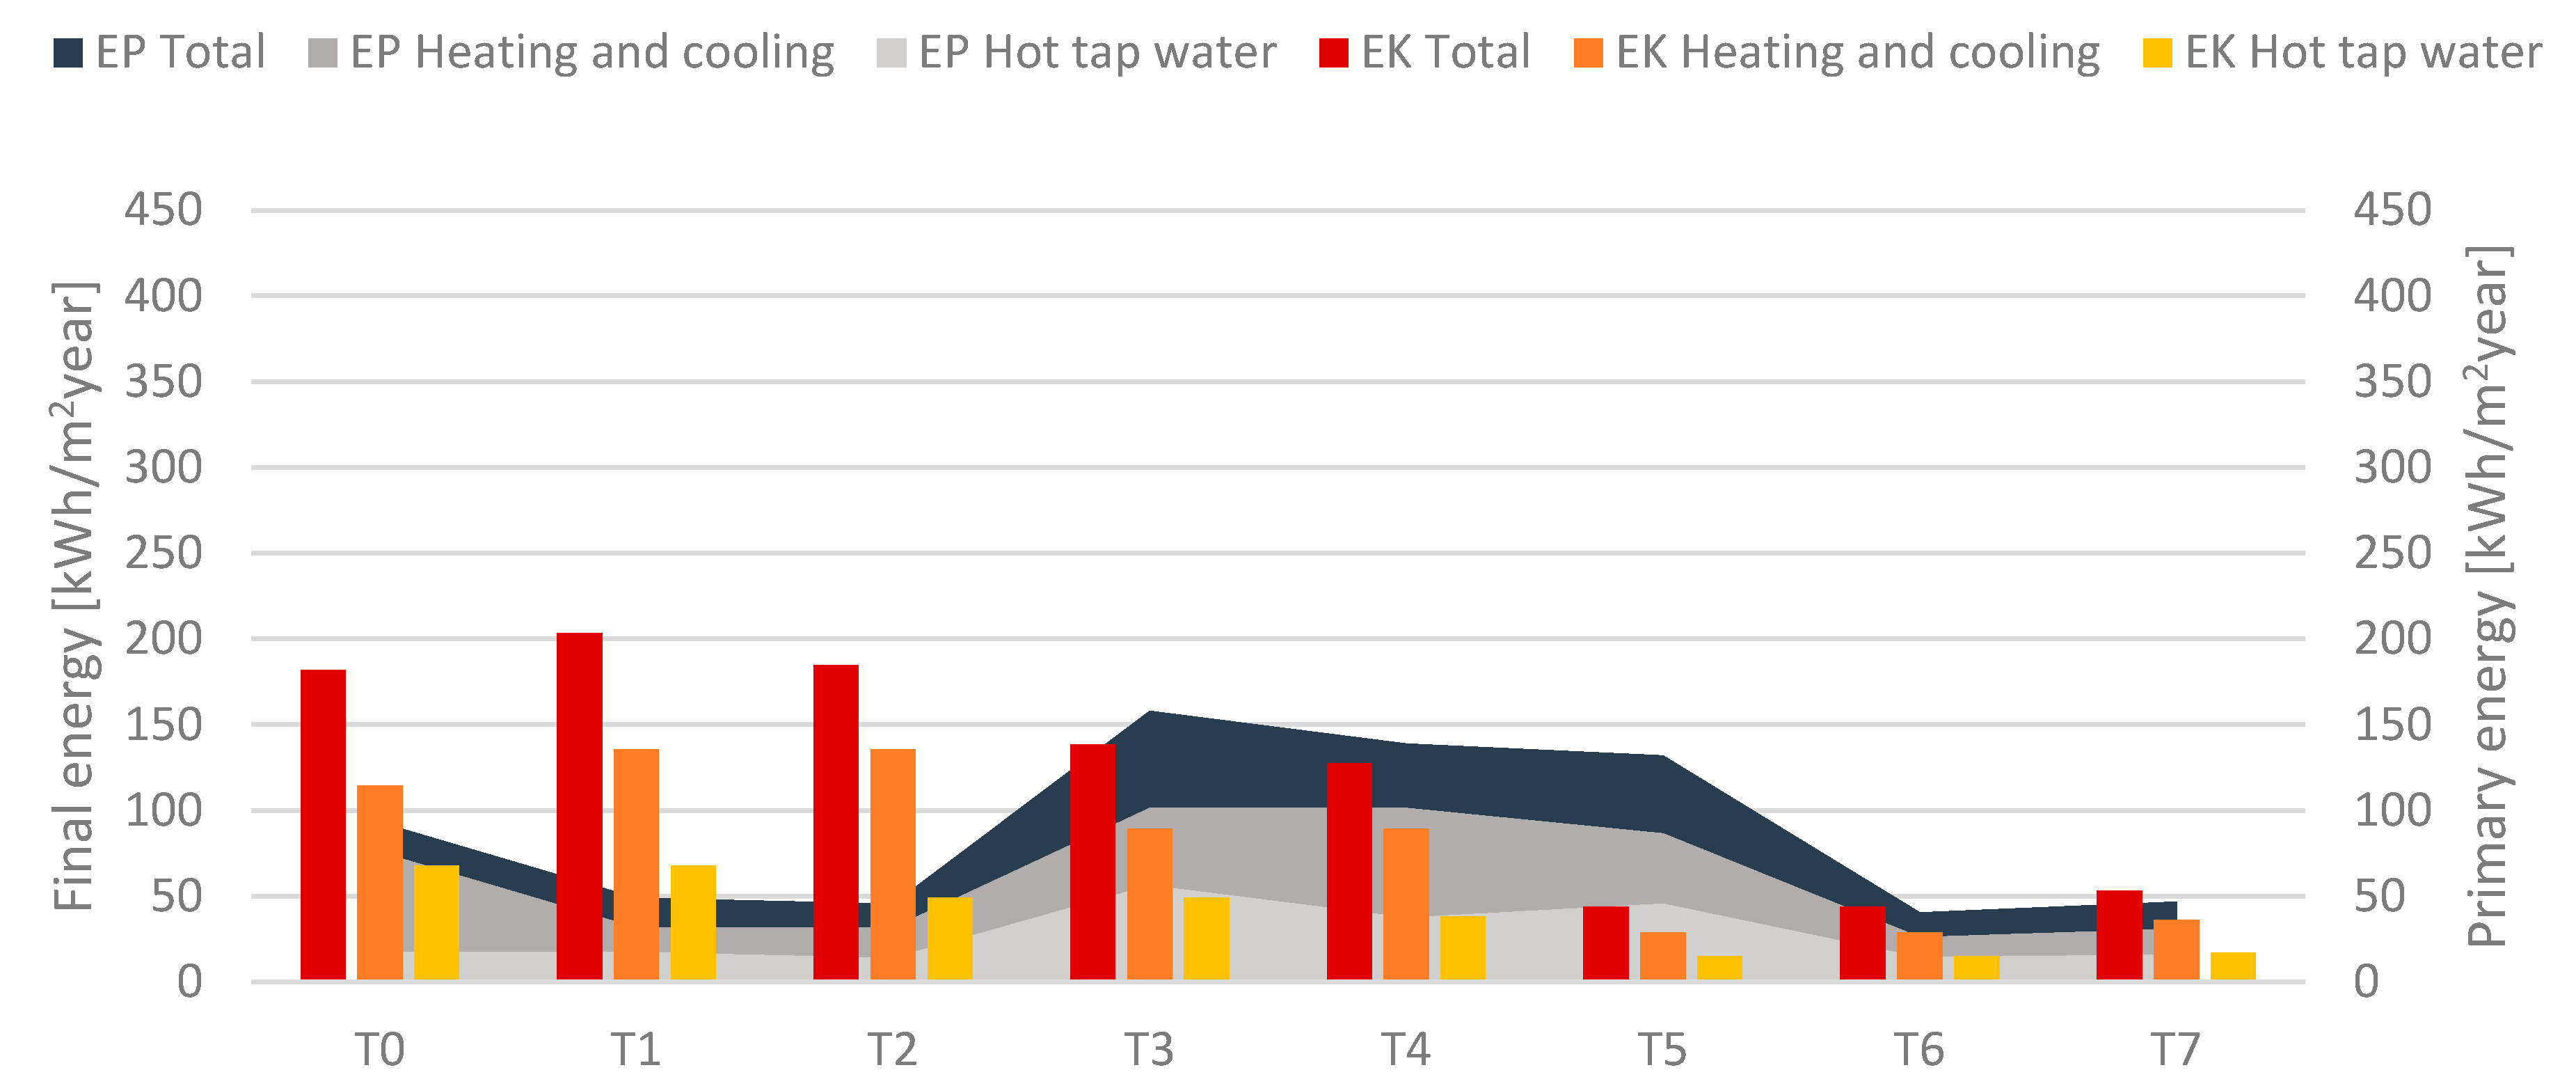
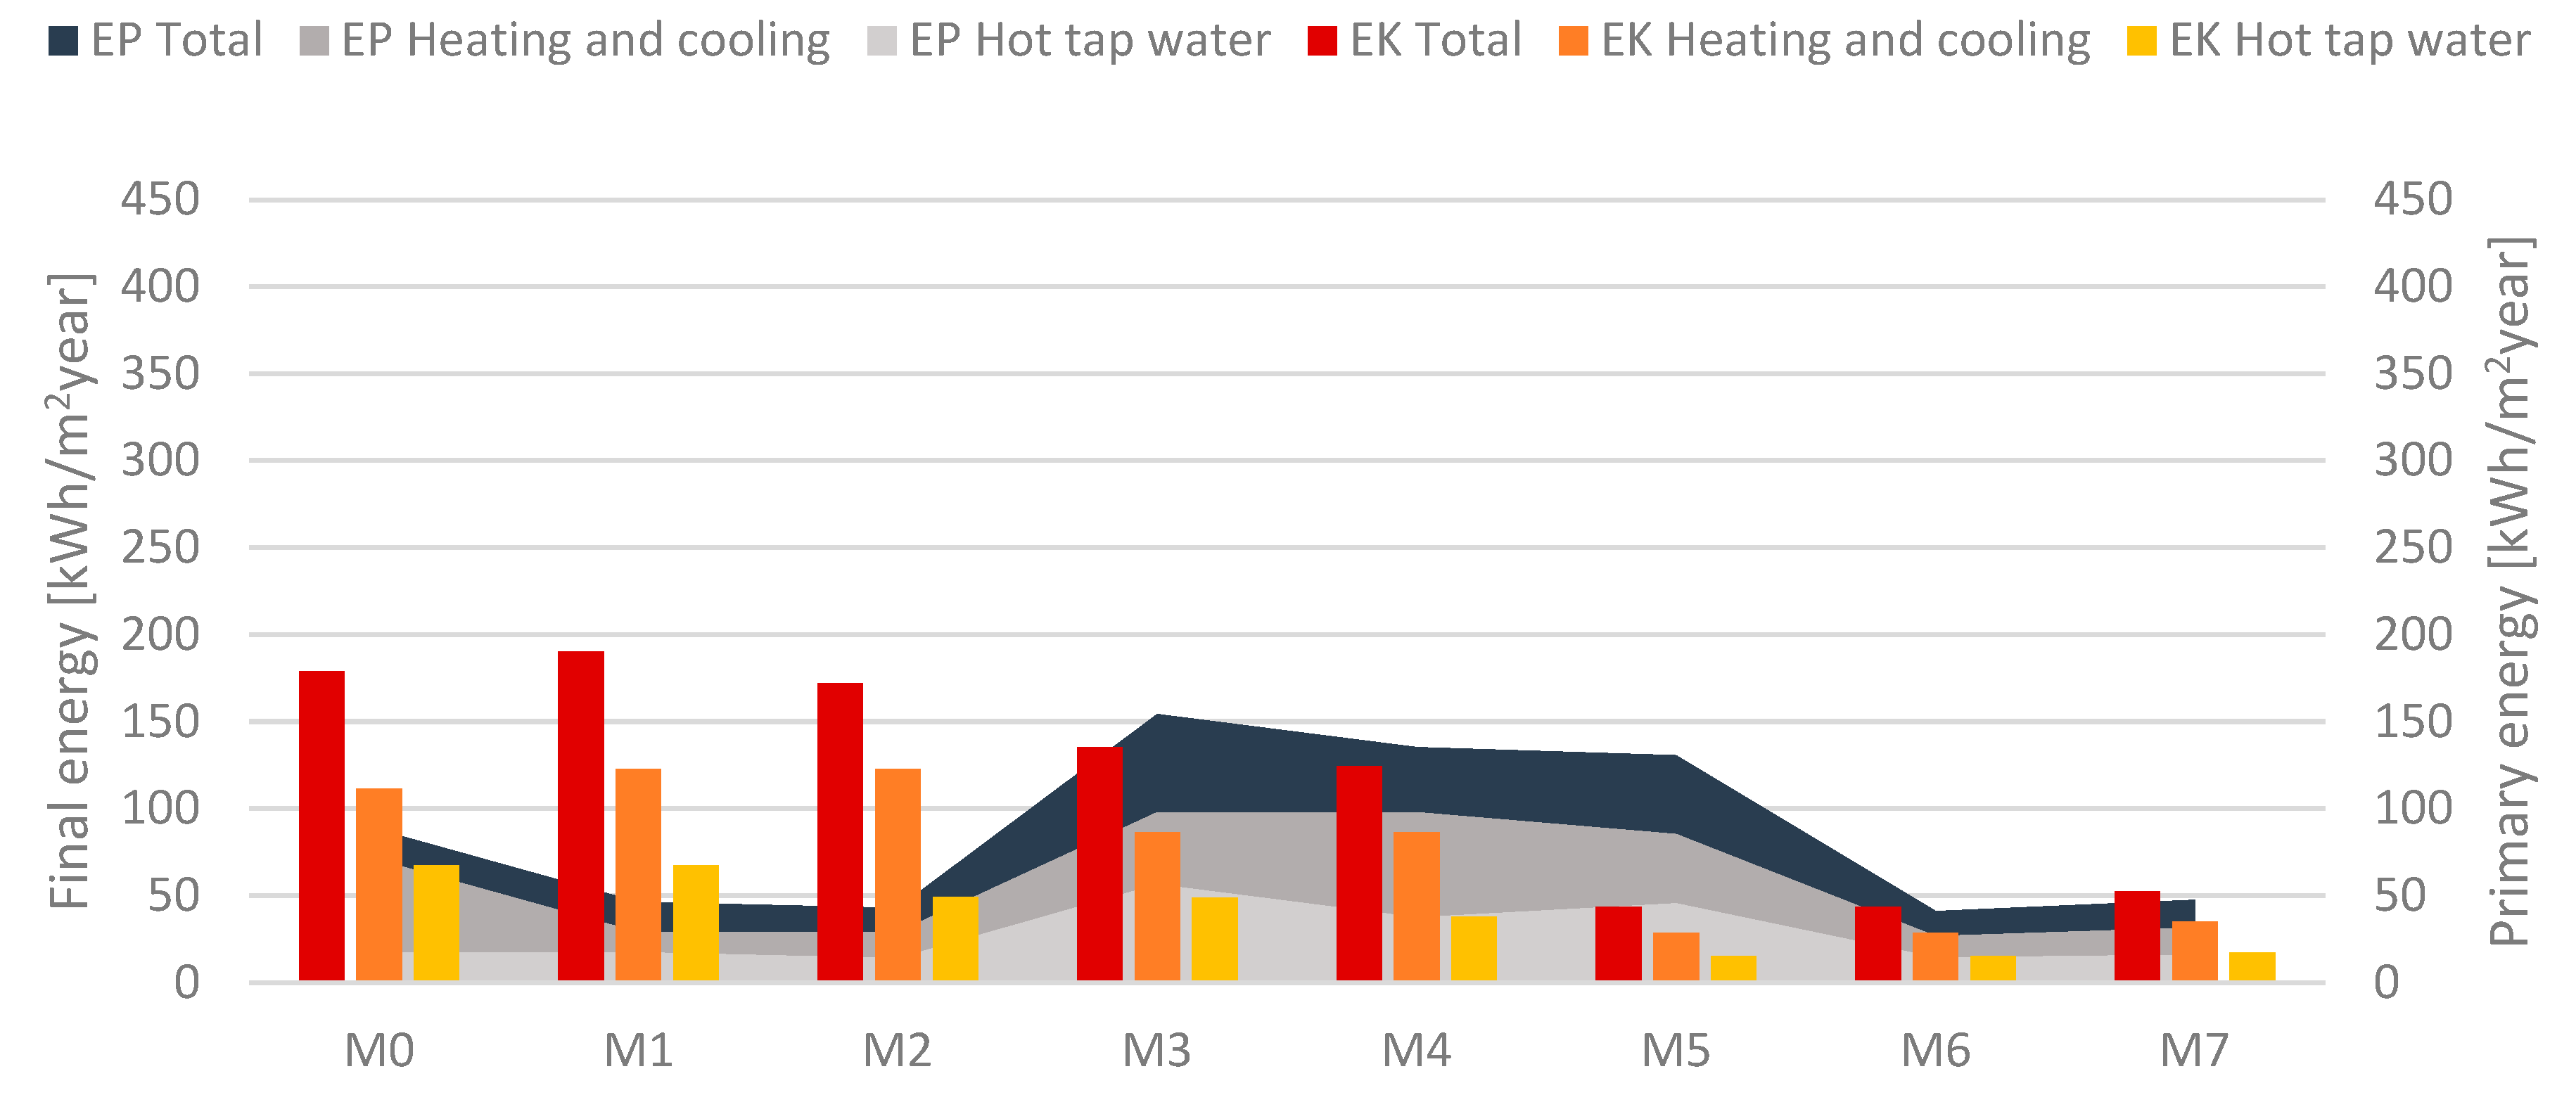
Calculation results for the different options are presented in Table 9, Table 10 and Table 11 and Figure 2, Figure 3 and Figure 4. The analysis of final energy consumption, which is the most important figure from the building owner’s point of view, indicates that the most efficient solutions are those based on the use of heat pumps. This applies to all three cases (P5–P7), for which the final energy value ranges from 92.1 to 114.1 kWh/m2year. The difference in the final energy value between the P5 variant and the P6 and P7 variants results from the change in the lower source for the heat pump from ground exchangers to air. Consequently, this causes a decrease in efficiency and an increase in the final energy value for the variant with an air/water heat pump. In the case of primary energy, the options involving heat pumps combined with photovoltaic installations (P6 and P7) exhibit the most favourable values, ranging from 61 to 75 kWh/m2year. The difference in these values is a derivative of the efficiencies of the brine/water and air/water heat pumps and the electricity consumption by the heat pump compressor. However, it should be noted that these are not the options with the highest share of renewables. The highest share of renewables is achieved for the options based on a biomass-fired boiler plus solar collectors, with RES shares of 99–99.2%. For hybrid systems with heat pumps and PV, this value is 94.9–95.5%, which is slightly lower.
For options T0–T7, useful energy demand was 93.9 kWh/m2year, with heating and ventilation accounting for 69.8 kWh/m2year and hot water preparation accounting for 24.1 kWh/m2year. Therefore, both the final and primary energy demands have been more than halved. There is also a slight decrease in the total share of RES, which is 98.1–98.5% for the most favourable options (T1 and T2). The slight reduction in the share of renewable energy sources between the P and T variants is because the demand for heat is reduced. At the same time, there is no change in the electrical energy necessary for the operation of auxiliary devices, such as central heating circulation pumps, and the domestic hot water circulation pump.
For options M0–M7, useful energy demand was 87.2 kWh/m2year, with heating and ventilation accounting for 63.1 kWh/m2year and hot water preparation accounting for 24.1 kWh/m2year, similar to the “P” and “T” options. It should, of course, be noted that these are the most favourable results obtained where, e.g., options P1, T1, and M1 are compared, i.e., those using the same heat production technology for central heating and domestic hot water preparation.
From a technological standpoint, the building materials used for insulation influenced the utility energy results obtained for the individual variants. The thickness of the thermal insulation and heat transfer coefficient directly affect the thermal resistance of the building envelope, and consequently reduce the demand for usable energy. Adapting the building to the technical conditions of WT2021 requires the use of higher-quality materials than those used in the case of WT2017. However, in this case, the energy effects do not show a linear relationship, e.g., with the insulation thickness. Consequently, the obtained energy effects are not necessarily commensurate with the financial outlays incurred for better-quality insulating materials. From the point of view of final energy, the analysis is much simpler, as the difference in the obtained values results directly from the efficiency of the heating devices used.
By analysing all variants in terms of energy, the one characterised by the lowest values of demand for useful energy, final energy, and, consequently, primary energy should be considered sought or desirable. The analysis may differ if economic or ecological factors are taken into account. In the case of the building analysed, it should be stated that, from the energy point of view, the optimal options result in the building meeting the WT2021 technical conditions in conjunction with the use of heat pumps assisted by a photovoltaic installation. The M6 option with the brine-to-water heat pump and the M7 option with the air-to-water heat pump exhibited the lowest final and primary energy values. This results directly from the production of electricity for heat pump operation. The heat pumps themselves, owing to the high COP coefficient, allow for achieving low final energy values. In contrast, the PV installation with a primary energy input index of 0, assuming that it would provide 80% of the electricity required by the heat pump, allowed for a significant reduction in the primary energy value in the variants where it was applied. This assumption was made based on the balance of energy produced and drawn from the grid on an annual basis.
However, it should be noted that regarding the capital expenditure associated with the energy renovation work required, options T6 and T7, which meet the WT2017 technical conditions, may be more viable. They are also based on renewable energy sources, i.e., heat pumps and a photovoltaic installation, and the difference in final and primary energy values compared to options M6 and M7 is small.

3.1. Economic Analysis Results

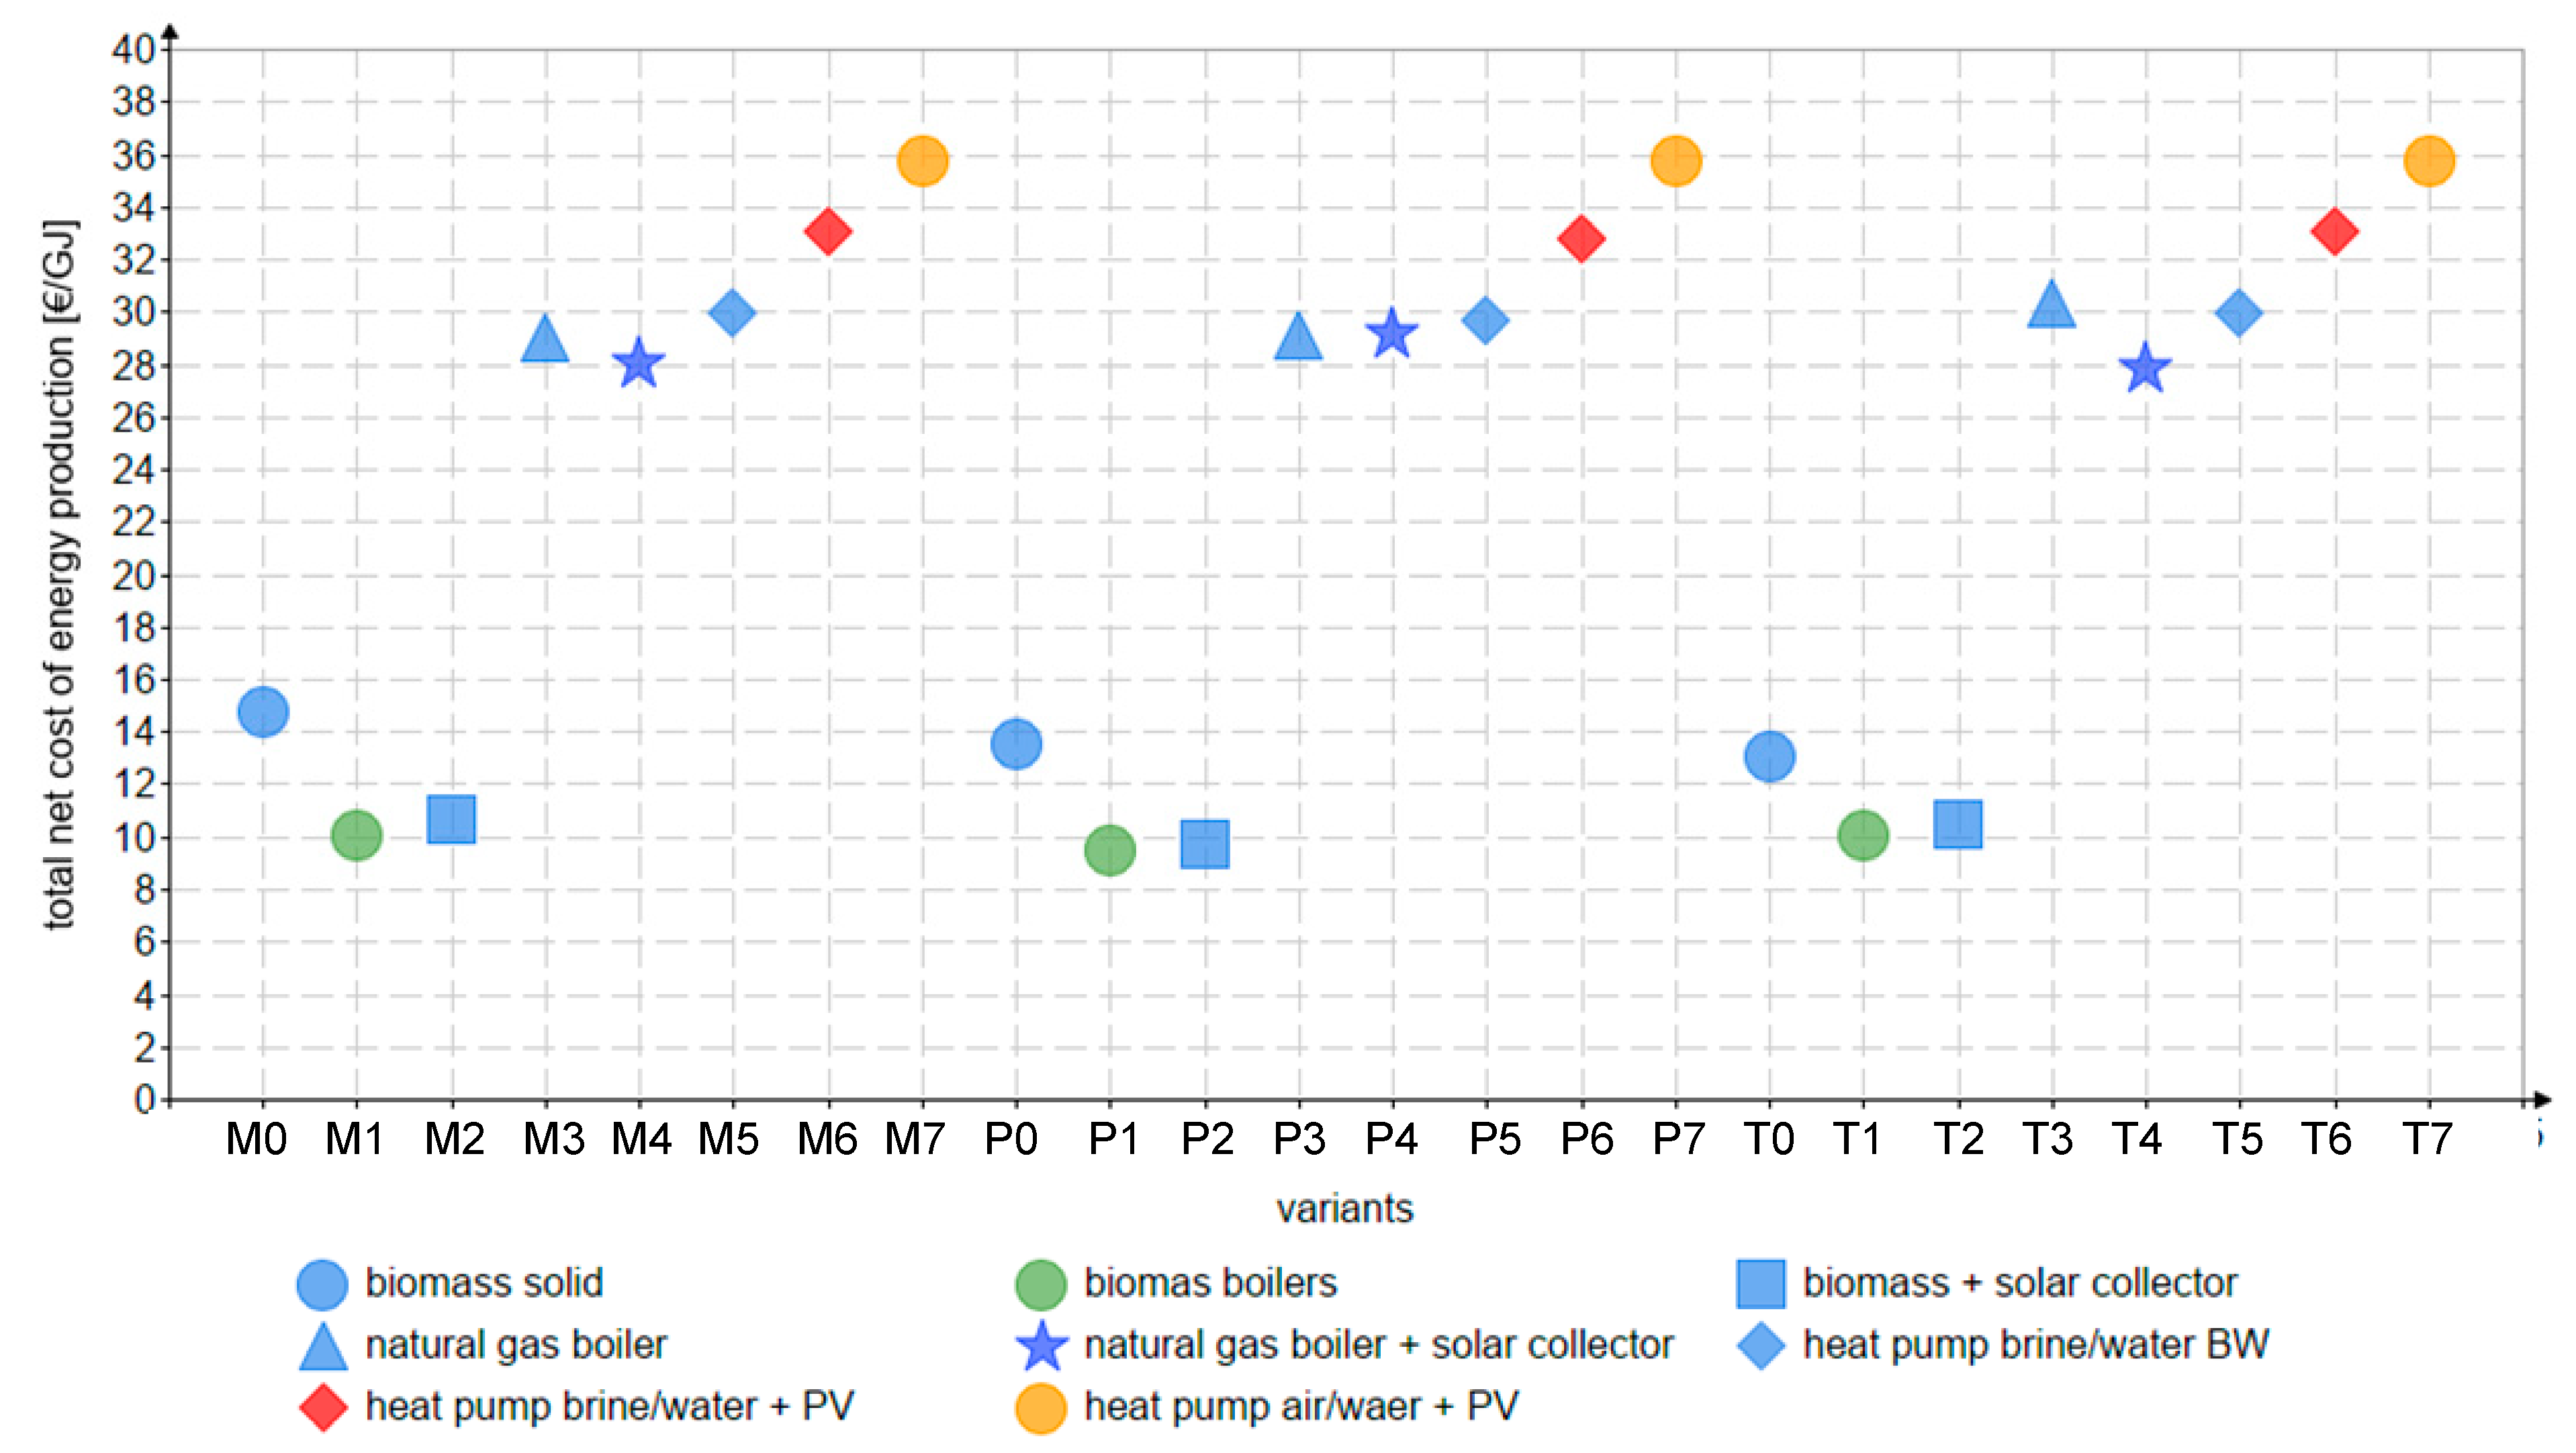
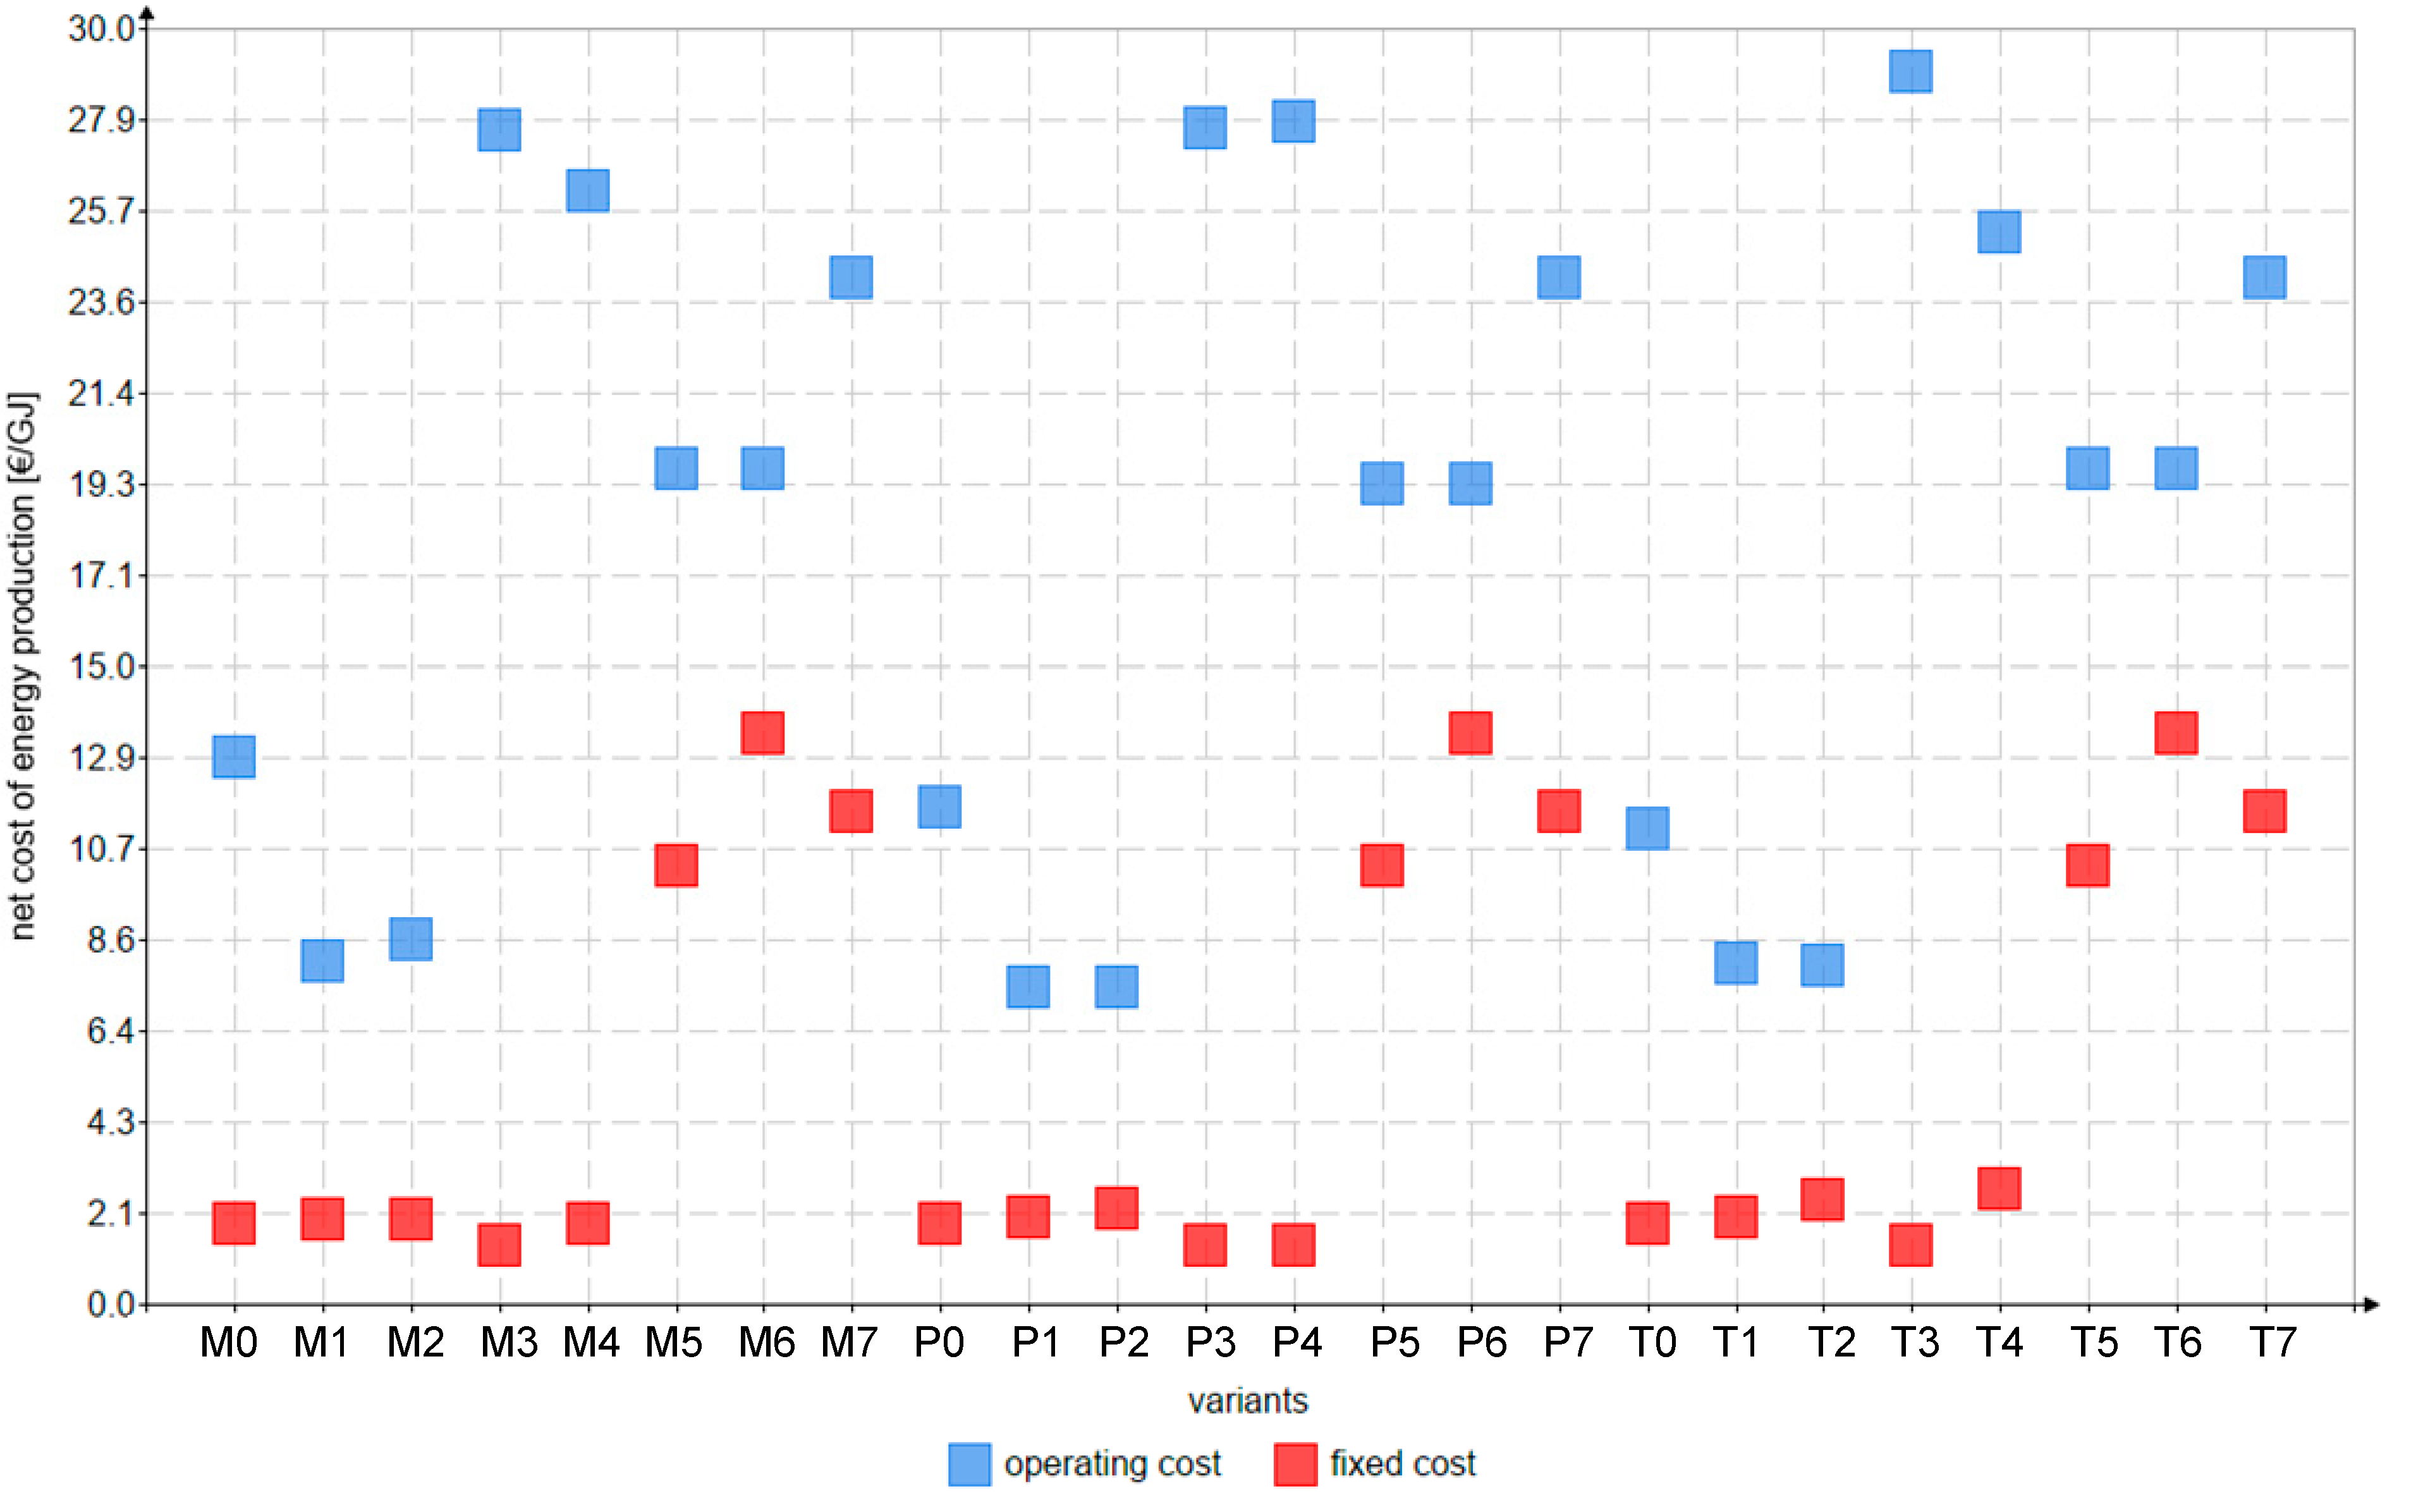
Figure 5 presents the total net unit energy production costs for the individual options analysed. These costs do not account for any subsidies for purchasing heat sources and energy carriers. From the comparison of results, it can be concluded that the lowest energy production costs are achieved for options M1, M2, P1, P2, T1, and T2. The options involve biomass-fired boilers (M1, P1, and T1) and biomass-fired boilers combined with solar panels (M2, P2, and T2). Using heat pumps fed by grid electricity (options M5 and P3) resulted in somewhat higher or similar (T5) energy production costs to the cost of generating energy from natural gas. Supplementing a heat pump with a photovoltaic installation increases the total cost of energy production. The highest costs are associated with installations involving heat pumps and PV cells (options M6, M7, P6, P7, T6, and T7). It is worth noting that this is one of Poland’s most common energy source configurations, especially for new buildings or those undergoing thermal retrofitting.
Figure 6 present a summary of these costs. The charts have been prepared assuming an exchange rate of 1 EUR = 4.2 PLN (03.2025). Operating (variable) costs in the options involving the use of PV cells assisting a heat pump and grid-powered heat pumps are lower than variable costs in the options involving the use of natural gas.
Regarding the total unit cost of energy production, biomass- and coal-fired boilers remain the cheapest energy sources (Figure 5). Unfortunately, the assumptions made regarding the purchase costs of primary energy carriers are correct. Heat pumps cannot compete with solid fuel boilers, even when exclusively considering operating costs (Figure 6). The situation looks even worse after fixed costs, which are affected by capital expenditures, are considered.
An economic analysis was presented concerning the unit of energy produced and investment costs per unit of power (kW). In this context, two fundamental differences in investment costs should be indicated when comparing the T6–T7 and M6–M7 variants. The first is the difference in the costs of modernising the building, amounting to approximately EUR 2347.83. The second is the cost of energy installation. In the case of a heat pump, there is a difference of EUR 282.60 per kW between a brine/water heat pump and an air/water heat pump. This is mainly due to the cost of the lower heat source. The heat load of the building after modernisation is approximately 8 kW, which results in a difference of EUR 2260.87. A separate issue is the selection of the power of the PV installation concerning the heat pump energy demand to drive the compressor, which is directly related to the COP coefficient. However, this issue has not been analysed.

3.2. Environmental Analysis Results

Emission volumes for all energy renovation options considered are presented in Table 12, while percentage reductions in emissions for individual energy renovation options compared to the baseline option are presented in Table 13. The analysis has made it possible to draw the following conclusions:
  • Total Suspended Particles (TSP): The energy renovation options utilising gas-fired boilers and heat pumps demonstrate the most significant reductions in TSP emissions. Options P3 and P4 achieve a remarkable 99.9% reduction, while options T3, T4, M3, and M4 approach near-total reductions of nearly 100%, as illustrated in Figure 7.
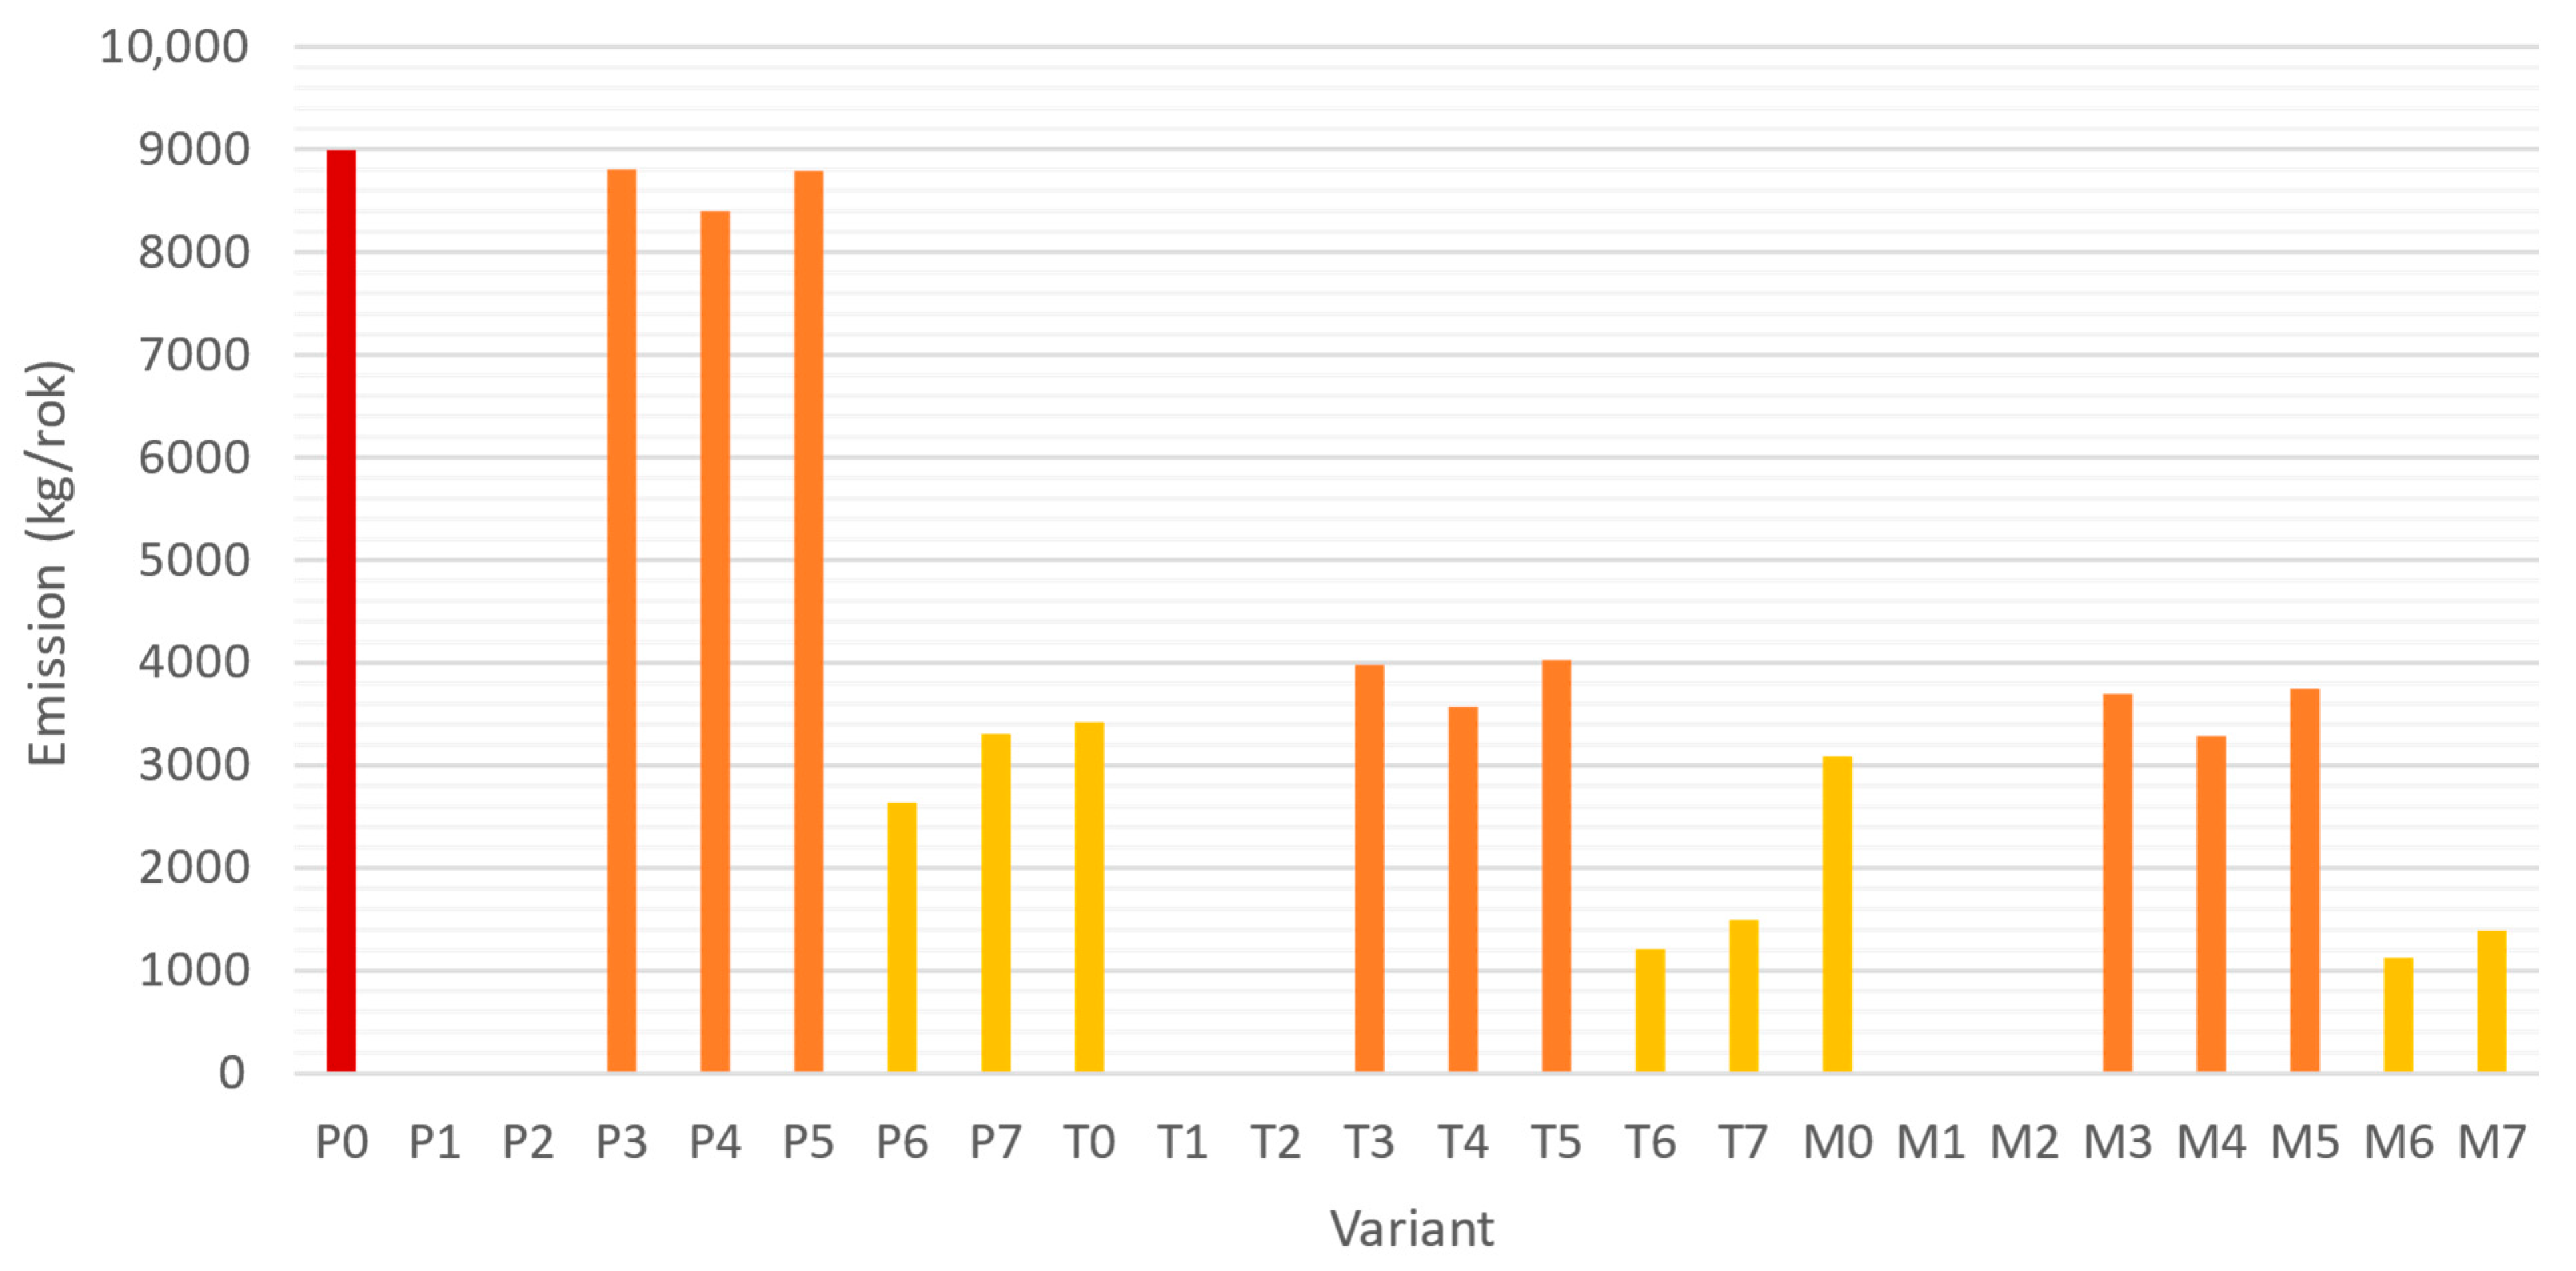
  • Carbon Dioxide (CO2): The highest reduction of 100% in CO2 emissions is linked to biomass-fired boiler options (P1–P2, T1–T2, M1–M2). Furthermore, energy renovation options employing heat pumps powered by photovoltaic (PV) installations (P6–P7, T6–T7, M6–M7) result in substantial CO2 reductions, ranging from 63.2% to 87.5% compared to the P0 baseline option. This analysis assumes a 70% contribution of PV electricity to the heat pump operation.
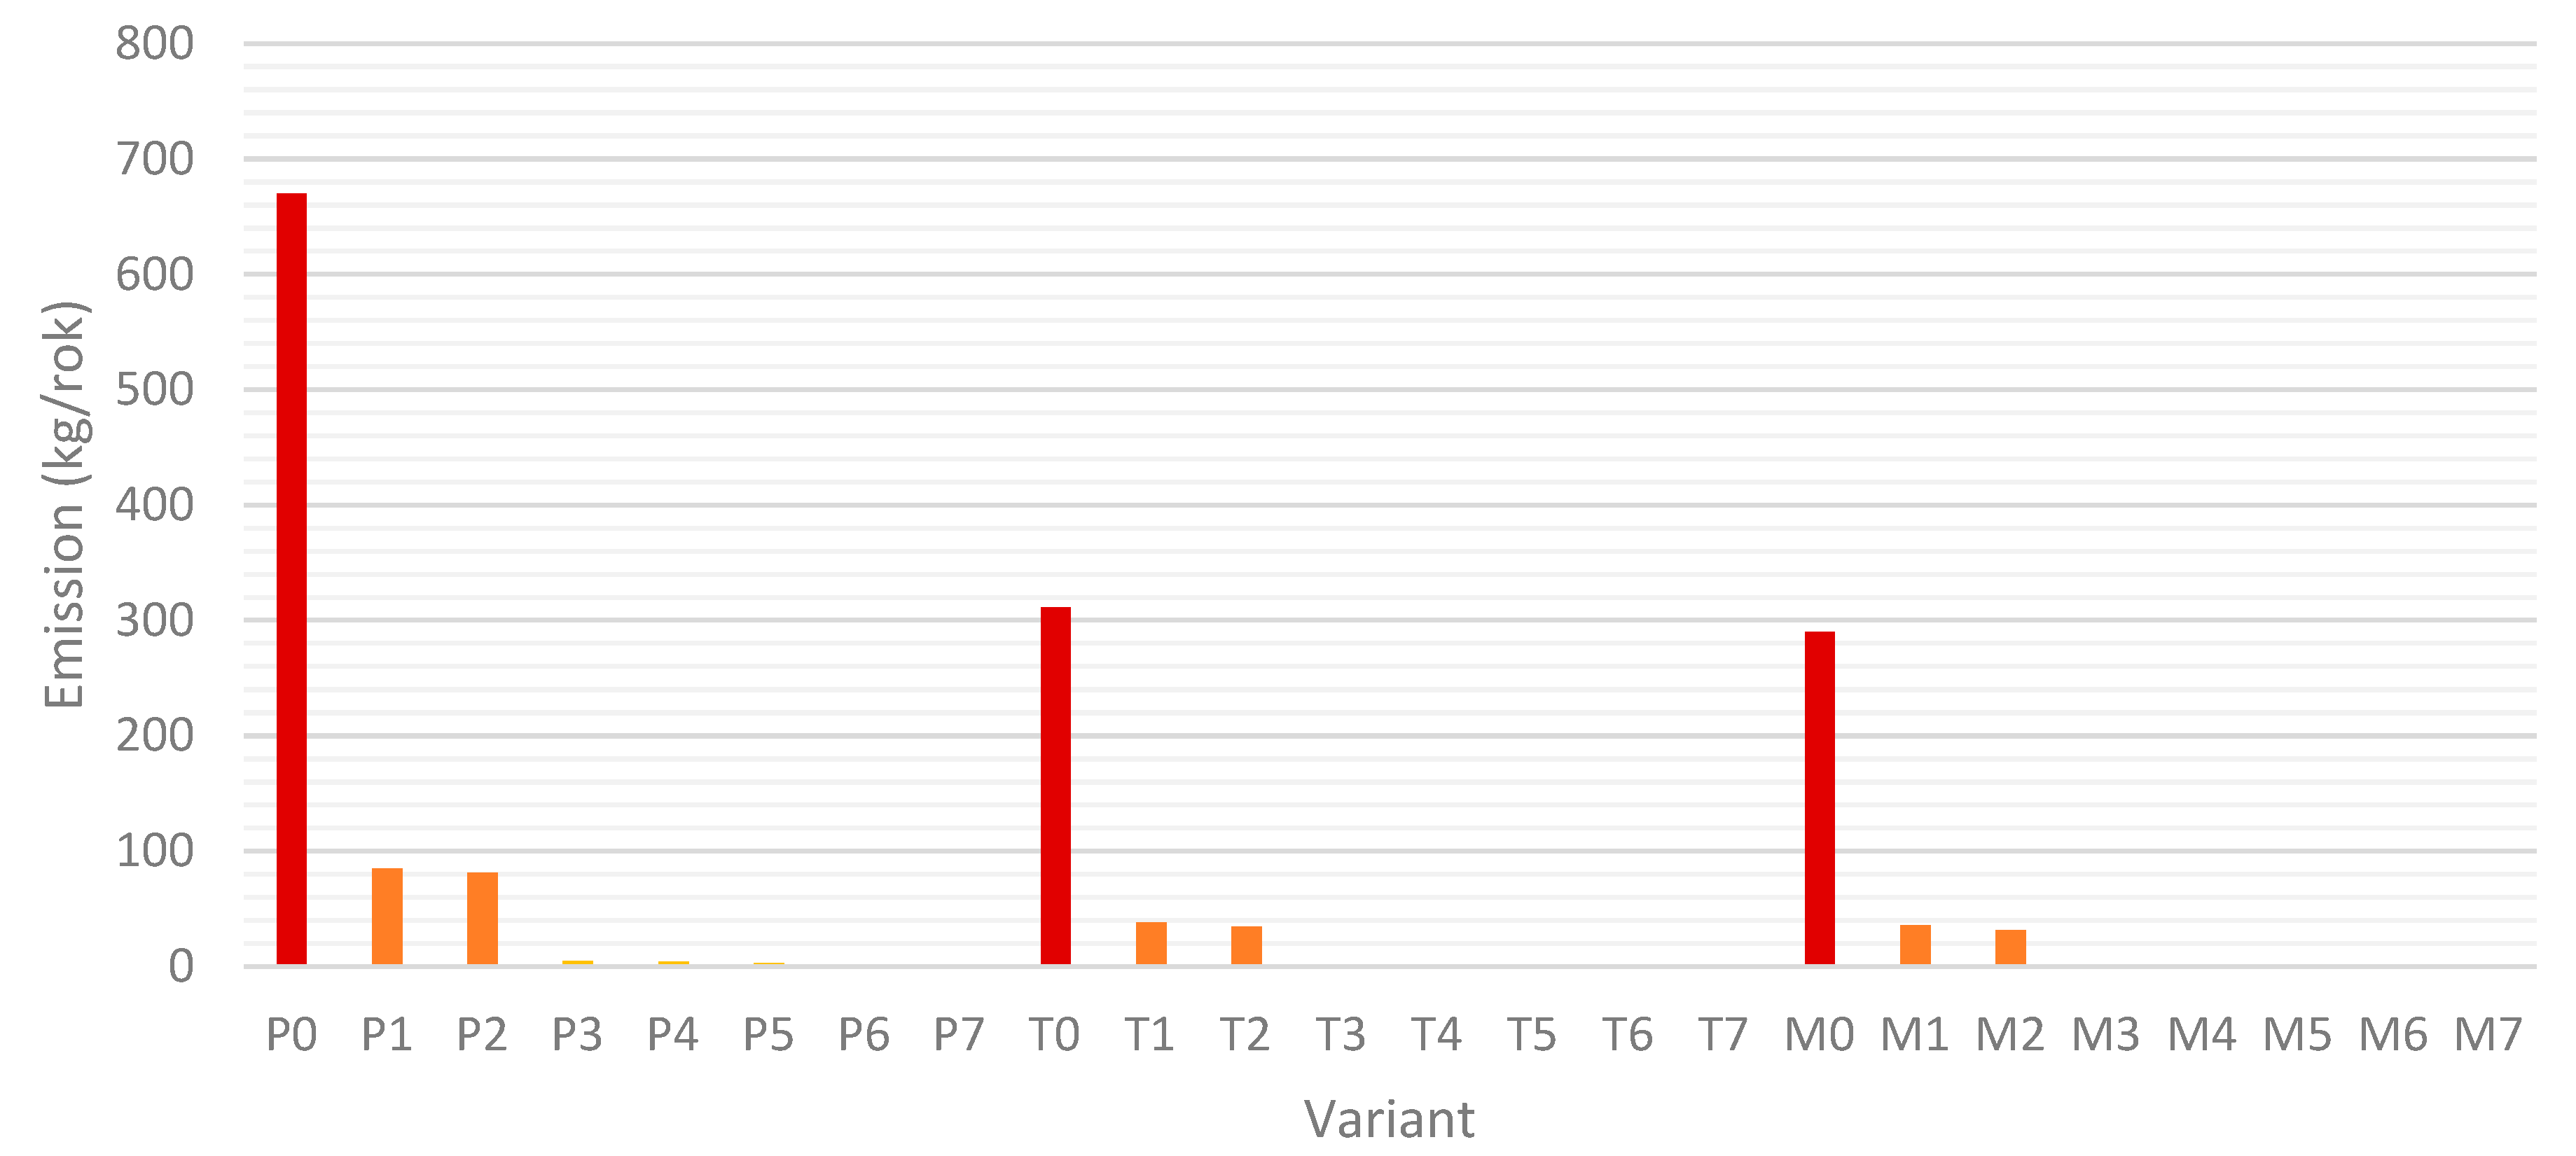
  • Carbon Monoxide (CO): All options involving a switch in heat sources exhibit significant reductions in CO emissions, ranging from 87.3% for biomass-fired boilers to 99.9% for heat pumps powered by photovoltaics.
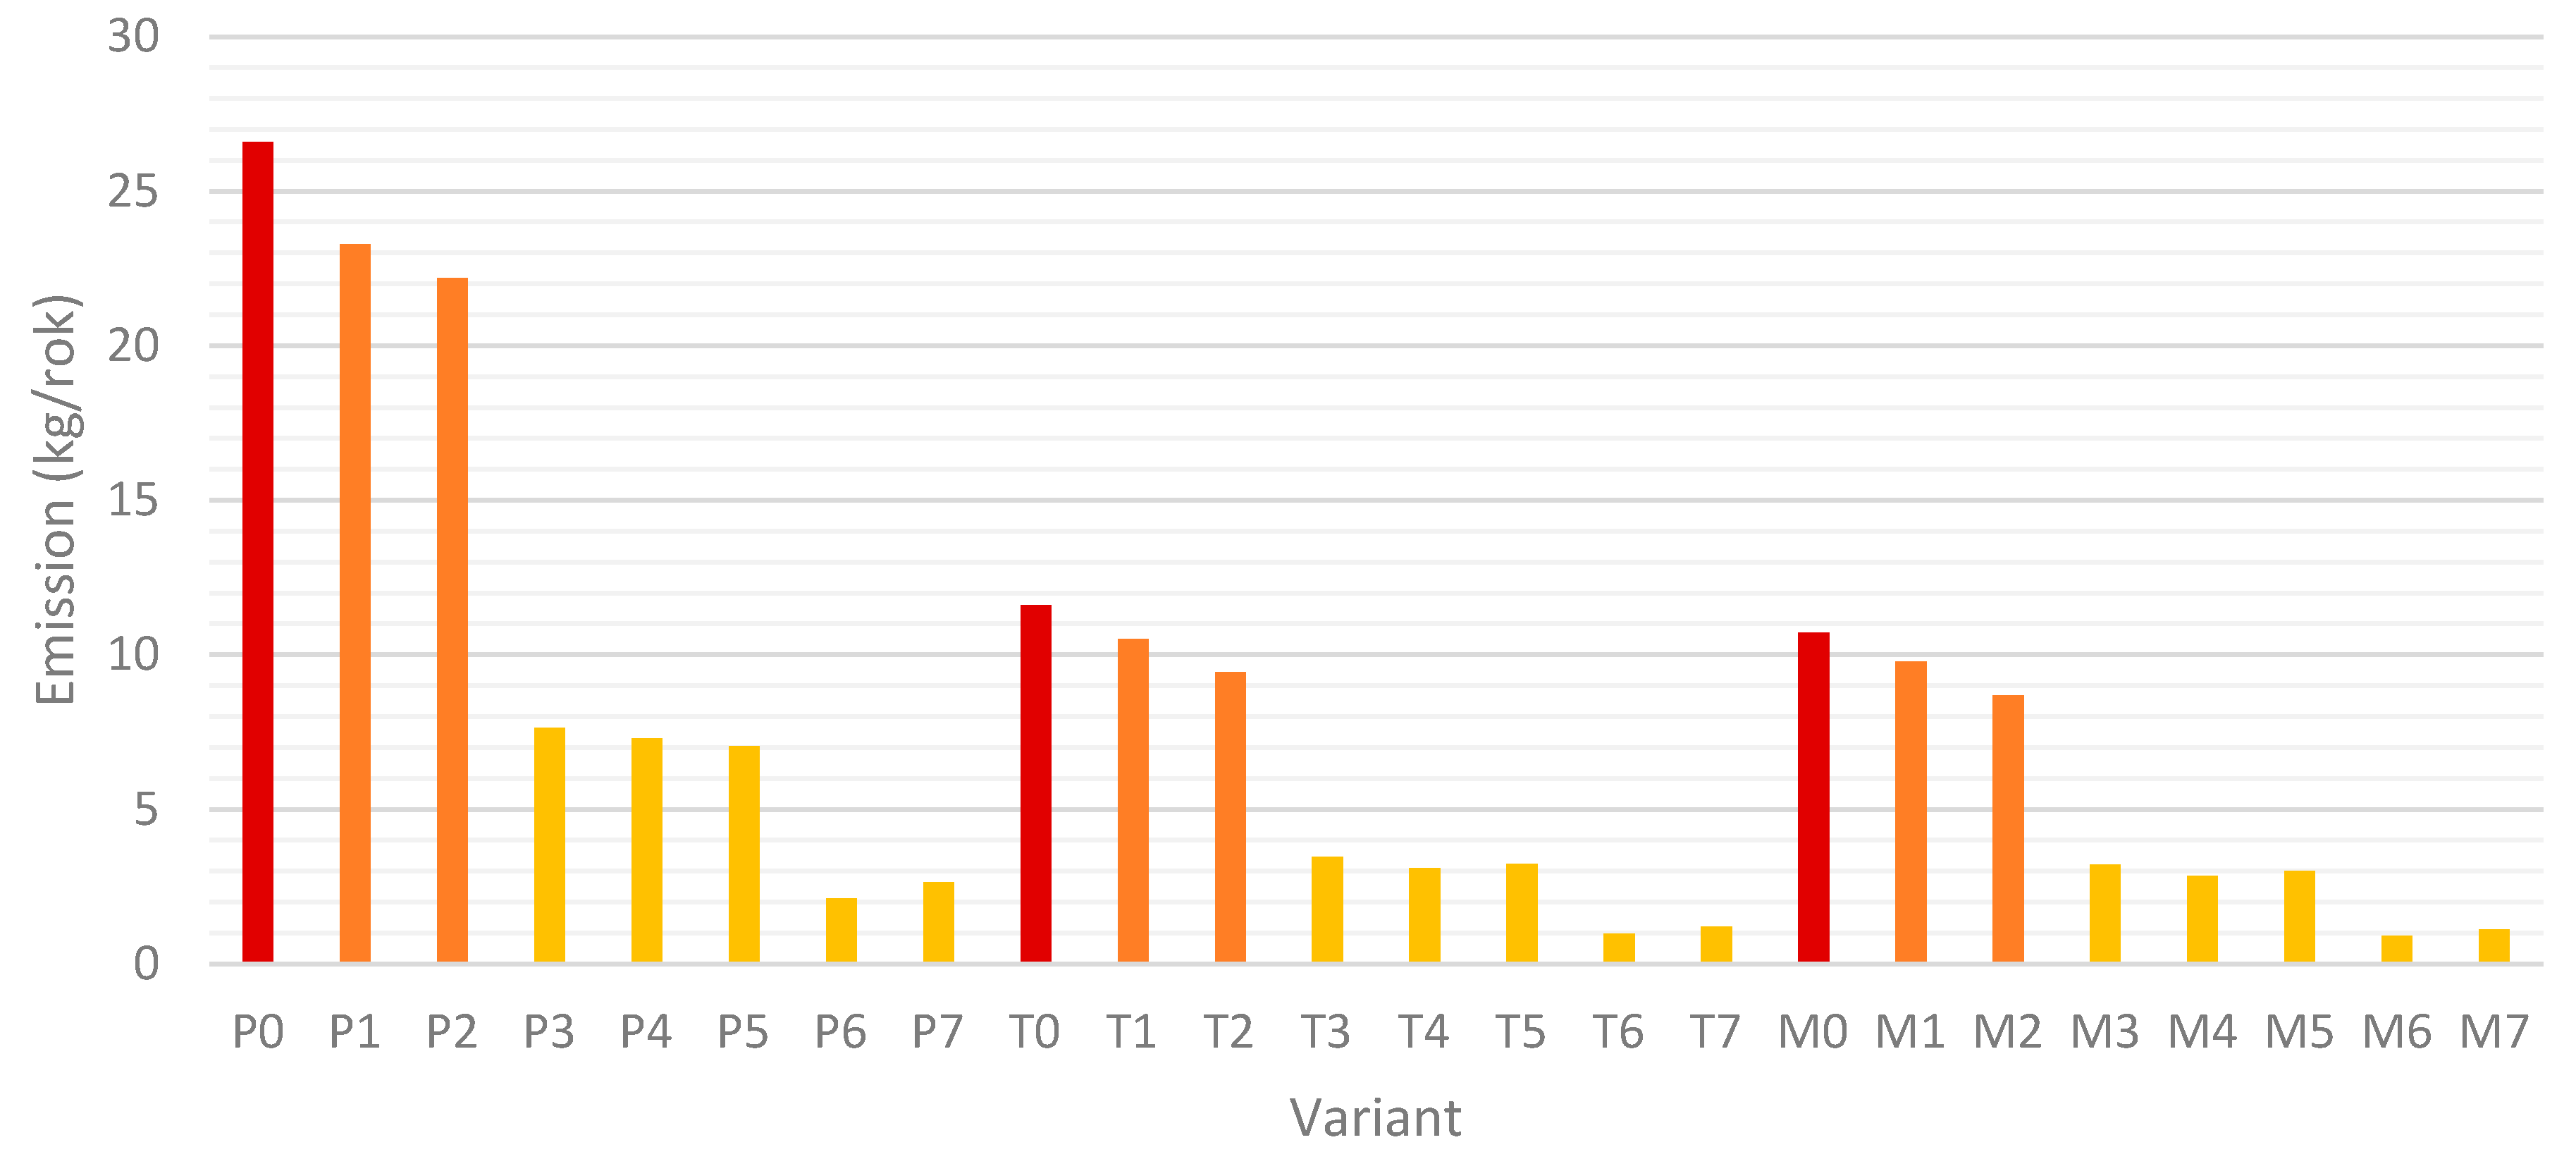
  • Nitrogen Oxides (NOx): The most effective options for reducing nitrogen oxide emissions are those that employ heat pumps in conjunction with photovoltaics, achieving reductions between 90% and 96.6%. Options utilising gas-fired boilers (P3, P4, T3, T4, M3, and M4) also yield notable reductions, varying from 71.3% to 87.9%.
  • Benzo(a)pyrene (BaP): The analysis indicates that all energy renovation options that involve switching heat sources result in a minimum reduction of 94.4% in BaP emissions for biomass-fired boilers, with reductions reaching up to 100% for gas-fired boilers and heat pumps.
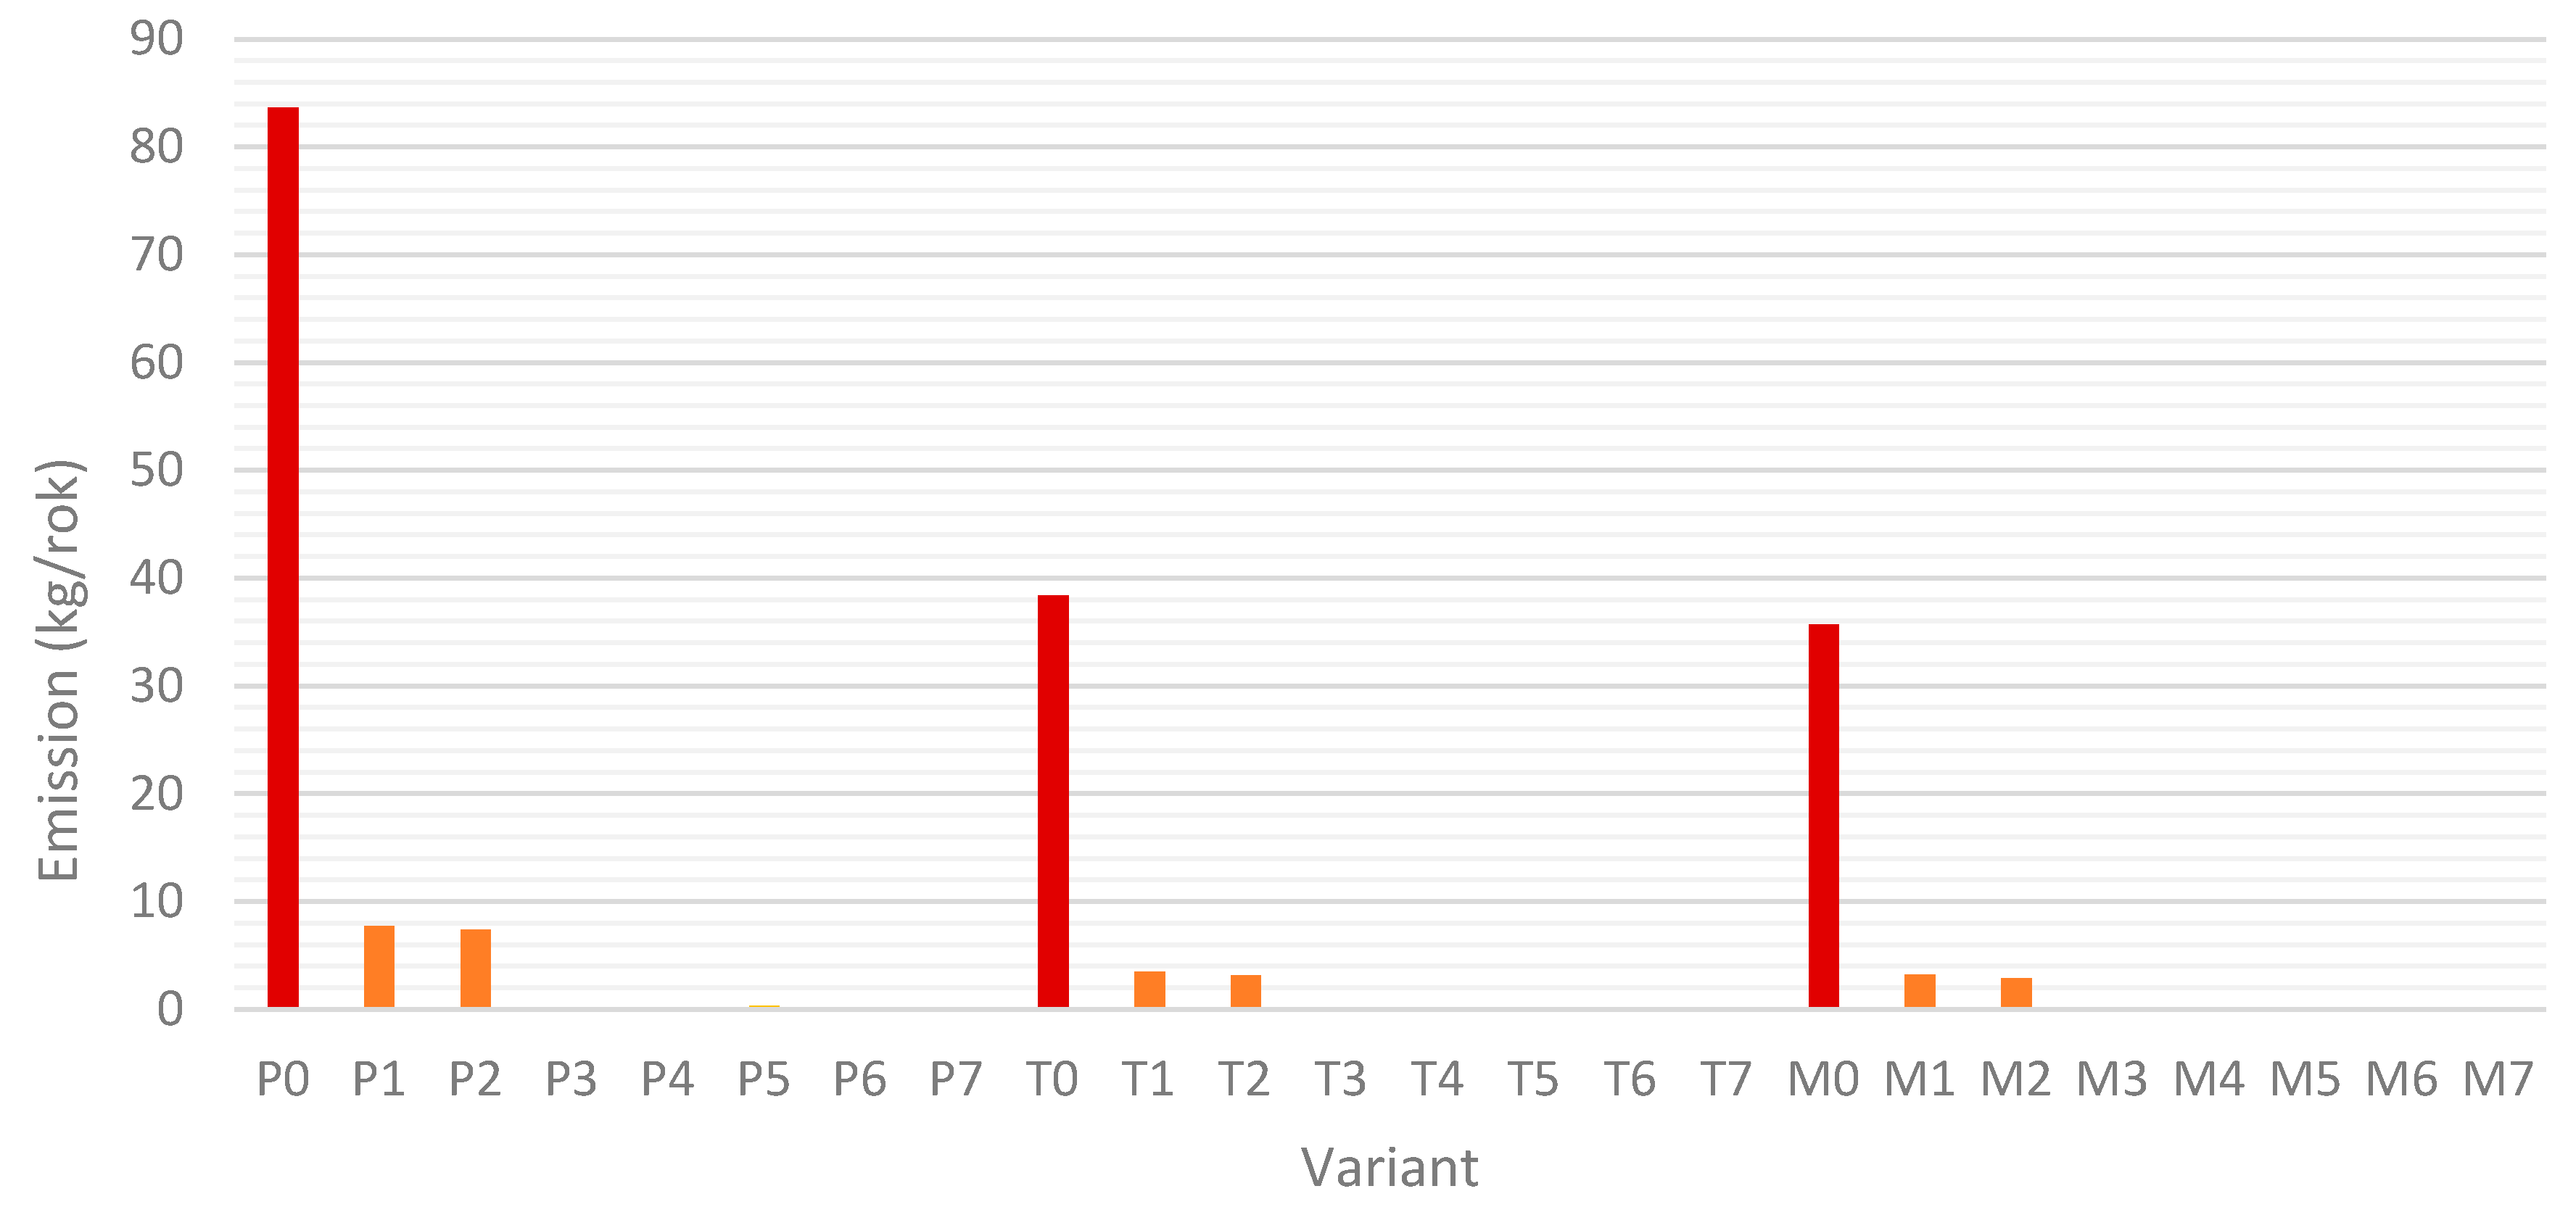
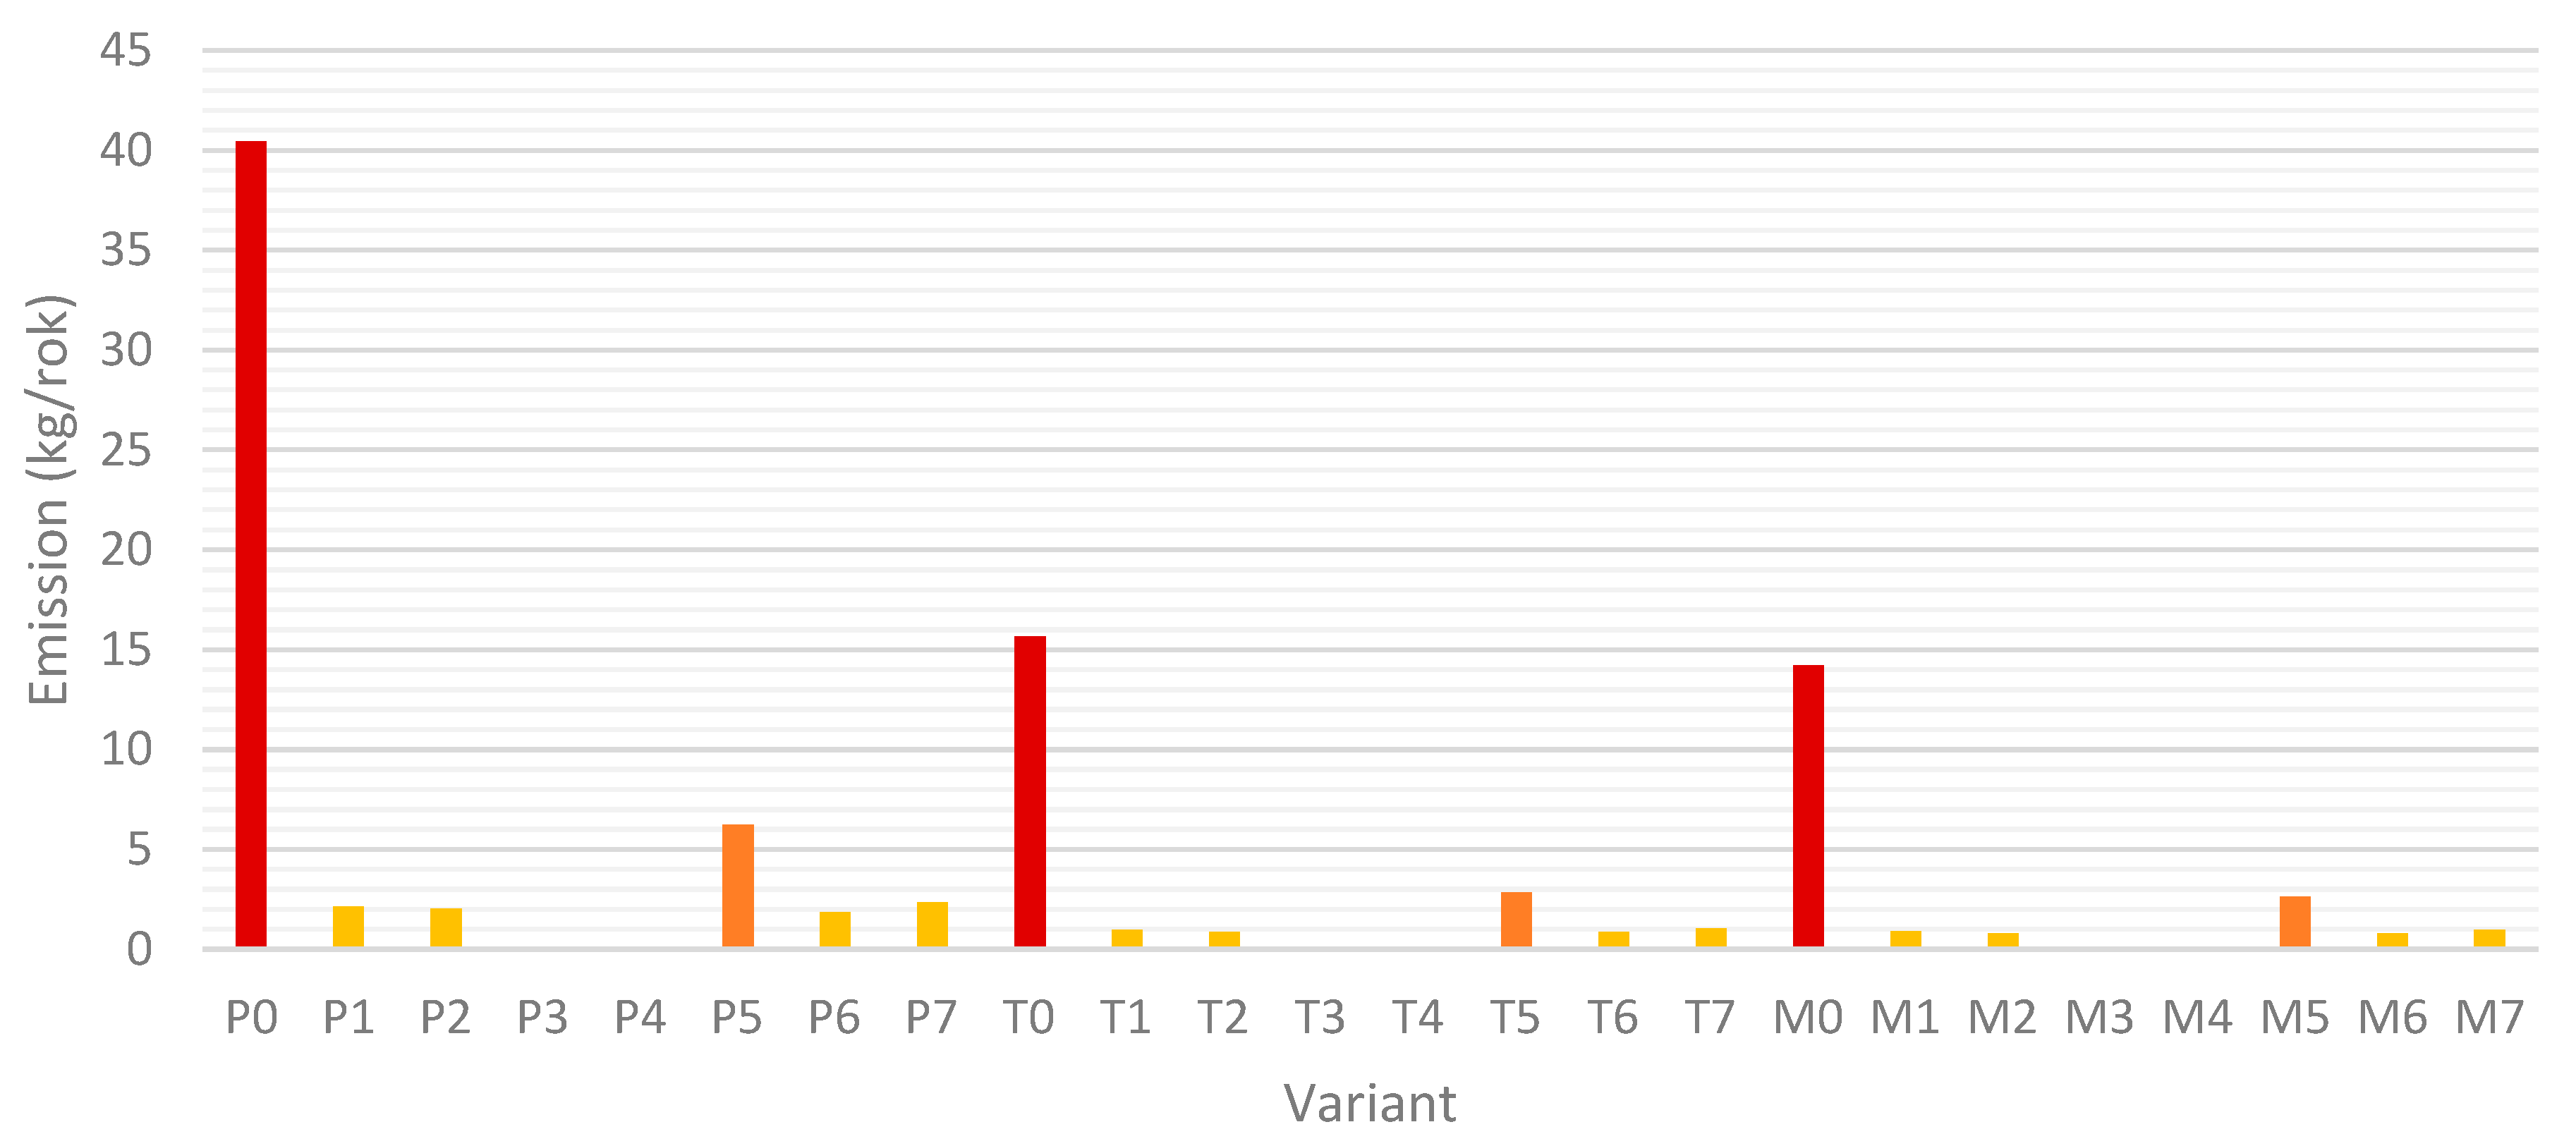
Figure 7, Figure 8, Figure 9, Figure 10 and Figure 11 provide a graphical presentation of emissions of individual pollutants for energy renovation options, with the P0 baseline option highlighted in red.
Figure 7. Total particulate matter emissions from individual energy renovation options.
Energies 18 04372 g007
Figure 8. Carbon dioxide emissions from individual energy renovation options.
Energies 18 04372 g008
Figure 9. Carbon monoxide emissions from individual energy renovation options.
Energies 18 04372 g009
Figure 10. Nitrogen oxide emissions for individual energy renovation options.
Energies 18 04372 g010
Figure 11. Sulphur dioxide emissions for individual energy renovation options.
Energies 18 04372 g011
In conclusion, the analysis of the emission evaluation results for various energy renovation options shows that modern technologies, such as heat pumps and gas boilers, significantly reduce air pollutant emissions, including particulate matter, carbon dioxide, and nitrogen oxides. The most significant emission reductions, approaching nearly 100%, were observed for options utilising heat pumps powered by solar energy and biomass boilers. These results highlight the substantial ecological benefits of implementing efficient heating technologies, which can significantly improve air quality and reduce negative impacts on the natural environment. This is crucial for combating climate change and striving for sustainable development.

4. Conclusions

The most efficient solutions from the analysis involve the use of heat pumps. This applies to all three cases (P5–P7), for which the final energy value ranges from 92.1 to 114.1 kWh/m2year. In the case of primary energy, the options involving heat pumps combined with photovoltaic installations exhibit the most favourable values, ranging from 61 to 75 kWh/m2year.
The options with the highest share of renewables are those based on a biomass-fired boiler plus a solar collector system, with RES shares of 99–99.2%. In the case of options involving energy renovation (T0–T7), both final and primary energy demand have been more than halved. Useful energy demand was 93.9 kWh/m2year, with heating and ventilation accounting for 69.8 kWh/m2year and hot water preparation accounting for 24.1 kWh/m2year. There was also a slight decrease in the total share of RES, which amounted to 98.1–98.5% for the most favourable options. This is due to the percentage change in the proportion of thermal energy to the electrical energy required to drive auxiliary equipment, such as circulation pumps. Options M0–M7 exhibit the most favourable results compared to options P1, T1, and M1, i.e., those using the same heat production technology for central heating and domestic hot water preparation. For options M0–M7, the calculated useful energy demand was 87.2 kWh/m2year, with heating and ventilation accounting for 63.1 kWh/m2year and hot water preparation accounting for 24.1 kWh/m2year, similar to the “P” and “T” options.
From an energy perspective, the optimal options result in the building meeting the WT2021 technical conditions. Options M1, M2, P1, P2, and T1, T2 exhibit the lowest energy generation costs. The options involve biomass-fired boilers (M1, P1, and T1) and biomass-fired boilers combined with solar panels (M2, P2, and T2). All options using heat pumps fed by grid electricity (options M5, P5, and T5) resulted in energy production costs that are slightly higher or similar to the cost of generating energy from natural gas. Supplementing a heat pump with a photovoltaic installation increases the total cost of energy production. Despite the lower capital expenditure associated with using air-source heat pumps, the total unit cost of energy generation for these sources was higher than that of brine-to-water heat pumps. The highest costs are associated with installations involving heat pumps driven by energy from PV cells (options M6, M7, P6, P7, T6, and T7). Based on the assumptions made regarding the purchase costs of primary energy carriers, heat pumps cannot compete with solid fuel boilers, even when exclusively variable costs are considered. Only in the case of natural gas are operating costs similar to those of heat pumps.
The model building selected for analysis currently exhibits a high demand for useful energy (for central heating purposes). The solid fuel boiler currently in use, which serves central heating and hot water preparation purposes, has low energy efficiency (68% when burning coal and 55% when burning wood), which also results in high fuel consumption (almost 3.6 tonnes of coal per year and 8.8 tonnes of wood per year, which gives about 19 spatial meters of wood).
The fuel burnt in the boiler currently results in annual pollutant emissions of around 9 tonnes of CO2, 670 kg of CO, 40 kg of SO2, 84 kg of particulate matter, and 52 g of benzo(a)pyrene. Comprehensive energy renovation measures involving heat source switching can significantly reduce both fuel consumption and pollutant emissions. All energy renovation options involving heat pumps (P5–P7, T5–T7, and M5–M7) eliminate pollutant emissions into the atmosphere at the installation site, contributing to the elimination of the low-stack emission problem in the municipality. In the case of the building considered, any energy renovation measure will result in at least a 50% reduction in particulate matter emissions and a 50% reduction in carbon monoxide and benzo(a)pyrene emissions. For most energy renovation options, the reduction in nitrogen oxide emissions is also higher than 50% (only for options P1 and P2, their emissions into the atmosphere are reduced just slightly). Carbon dioxide emissions comparable to the current state will only be present for energy renovation options P3 and P4 (replacing the heat source with a gas-fired boiler without insulating the building) and P5 (using a heat pump supplied with electricity from the power grid without insulating the building). There is at least a 50% reduction in CO2 emissions for the remaining energy renovation options, and for options with biomass-fired boilers (options P1, P2, T1, T2, M1, and M2), the reduction in CO2 emissions will be 100%.
Regarding this article, further research should be directed toward a broader spectrum of modelling. An interesting direction in this regard was indicated by Rashad et al. (2022) [56], who presented a similar position as Andrews and Jain (2022) [40], claiming that the static calculations used so far do not provide a detailed answer to questions such as: what is the energy demand for individual purposes in a building, and how does it change during the day, month, and year. The same conclusions, but concerning domestic hot water only, were formulated by Bergel et al. (2016) [57], who claimed that real water consumption is inadequate to that calculated based on applicable guidelines. Andrews and Jain (2022) [40] based their research on the use of TRNSYS software for year-round building energy analysis. A dynamic energy chewing analysis of an academic building in Pisawas was conducted by Franco et al. (2021) [58]. By analysing an HVAC system based on a heat pump, chiller, and mechanical ventilation with heat recovery, they concluded that such a system should be dynamically controlled in response to the presence of building occupants and their needs. At the same time, they pointed to the value of 44% energy savings with this energy management method in the building, of which 33% will be for the ventilation system. Heracleous et al. (2022) [59] analysed educational buildings in Cyprus using dynamic modelling, but in the Integrated Environmental Software Virtual Environment software. The optimal variants of thermal modernisation were identified using the life cycle cost analysis (LCCA) method, confirming that this direction for further research is appropriate. Leiria et al. (2023) [60] and Kaczmarczyk et al. (2025) [61] conduct research based on the readings of smart heat meters for the assessment of forecasted and actual energy consumption values in buildings. Martinez-de-Alegria et al. (2021) [62] searched for ways to optimise energy consumption in existing facilities in Spain. Perhaps, in the context of this article, it is not directly related, but it shows that limiting oneself to thermal modernisation alone is currently insufficient. Dynamic analyses of energy demand and the search for new solutions that increase energy efficiency should be the focus of future research. This requires a lot of interdisciplinarity; however, as indicated by the analyses of Li et al. (2021) [63], interdisciplinary, interactive research that combines the natural and social environment will attract new research ideas in the context of the energy intensity of buildings.
An important aspect of assessing heating technologies is their compliance with current and upcoming regulatory frameworks, especially the EU Ecodesign Directive (2009/125/EC) and its delegated regulations for space and water heaters (EU) No. 813/2013 and No. 814/2013. The directive establishes minimum seasonal space heating efficiency and maximum allowable pollutant emission levels for boilers and heat pumps sold in the EU. From 2027, more rigorous eco-design standards will come into effect, including higher minimum seasonal efficiency thresholds (SCOP for heat pumps and seasonal efficiency ηs for boilers) and stricter limits on NOx, particulate matter, and organic gaseous compounds. In this study, the analysed heat pumps, brine-to-water and air-to-water, are technologies that, in their current market configurations, already meet or surpass the anticipated 2027 requirements for seasonal efficiency and local emissions. Likewise, the biomass boilers examined are compliant Eco-design units equipped with high-efficiency combustion and flue gas cleaning systems. However, actual compliance relies on the specific model chosen for installation, and any investment decision should verify conformity with the updated EU product database (EPREL) to ensure compatibility with post-2027 regulatory standards.
Apart from energy issues, aspects that may influence the decision regarding the modernisation of the building are worth mentioning. It is essential that the building provides comfortable conditions for its residents or users. This may include ensuring adequate ventilation, lighting, acoustics, and temperature regulation. Sometimes, the choice may be dictated by aesthetic or architectural considerations. Some solutions may be more visually appealing or better fit into existing infrastructure. While investing in more advanced technologies may be more expensive upfront, they can provide long-term savings or benefits. Analysing investment costs and return on investment can be significant in making decisions. Some solutions may be more durable and require less maintenance over the long term, thereby saving money or reducing the risk of failure. In addition to energy efficiency, other environmental aspects, such as water consumption and impact on local wildlife, can influence the selection of optimal options. Sometimes, your choice may be limited by building regulations, energy standards, or other legal regulations. Not all advanced technologies are always available or profitable in a given region. The availability of building materials and technology may influence this choice. In practice, decisions regarding the construction or renovation of a building often require consideration of many of these factors simultaneously to find the optimal solution that meets various needs and constraints.

Author Contributions

A.S. and M.K.—Conceptualisation, A.S., M.K., L.P. and B.T.—methodology, L.P. and M.K.—software, M.K.—validation, B.T.—formal analysis, M.K., W.L. and G.P.—resources, W.L., G.P. and M.K.—data curation, A.S. and M.K.—writing—original draft preparation, M.K., L.P., B.T., W.L. and G.P.—writing—review and editing, M.K. and L.P.—visualisation, A.S.—supervision, A.S.—project administration, A.S.—funding acquisition. All authors have read and agreed to the published version of the manuscript.

Funding

The project was co-financed by the funds of the National Centre for Research and Development within the framework of the research and development programme Social and economic development of Poland in the conditions of globalising markets GOSPOSTRATEG/contract No Gospostrateg1/385085/21/NCBR/19. This research project was supported by the program “Excellence initiative–research university” for the AGH University of Krakow. This research was funded by a statutory research program at the Faculty of Geology, Geophysics, and Environmental Protection AGH University of Krakow, Poland, statutory work No. 16.16.140.315.

Data Availability Statement

The data that support the findings of this study are available from the corresponding author, [M.K.], upon reasonable request.

Conflicts of Interest

The authors declare no conflicts of interest. The funders had no role in the design of the study; in the collection, analyses, or interpretation of data; in the writing of the manuscript, or in the decision to publish the results.

Nomenclature

B(a)Pbenzo(a)pyrene
COcarbon monoxide
NOxnitrogen oxides
CO2carbon dioxide
COPheat pump coefficient of performance
ECO2carbon dioxide emission
EKfinal energy
EPprimary energy
EUuseful energy
EPCEnergy Performance Certificate
GHGgreenhouse gases
LCCAlife cycle cost analysis
NPVnet present value
PM10particulate matter ≤ 10 µg
PM2.5particulate matter ≤ 2.5 µg
PVphotovoltaic
RESrenewable energy source
SO2sulphur dioxide
SPBTsimple payback time
URESshare of renewable energy sources in annual final energy demand
Qseasonal energy consumption [GJ/year, MWh/year]
Qwcalorific value
Wemission factor [g/GJ, kg/MWh]
WT2021technical conditions for new buildings created from 2021
WT2017technical conditions for buildings that have been created in 2017–2020

References

  1. Capros, P.; Zazias, G.; Evangelopoulou, S.; Kannavou, M.; Fotiou, T.; Siskos, P.; De Vita, A.; Sakellaris, K. Energy-system modelling of the EU strategy towards climate-neutrality. Energy Policy 2019, 134, 110960. [Google Scholar] [CrossRef]
  2. Kilkis, S.; Krajacic, G.; Duic, N.; Rosen, M.A.; Al-Nimr, M.A. Advances in integration of energy, water and environment systems towards climate neutrality for sustainable development. Energy Convers. Manag. 2020, 225, 113410. [Google Scholar] [CrossRef]
  3. Salvia, M.; Reckien, D.; Pietrapertosa, F.; Eckersley, P.; Spyridaki, N.A.; Krook-Riekkola, A.; Olazabal, M.; De Gregorio Hurtado, S.; Simoes, S.G.; Geneletti, D.; et al. Will climate mitigation ambitions lead to carbon neutrality? An analysis of the local-level plans of 327 cities in the EU. Renew. Sustain. Energy Rev. 2021, 135, 11025. [Google Scholar] [CrossRef]
  4. Oudes, D.; Stremke, S. Spatial transition analysis: Spatially explicit and evidence-based targets for sustainable energy transition at the local and regional scale. Landsc. Urban Plan. 2018, 169, 1–11. [Google Scholar] [CrossRef]
  5. Kaczmarczyk, M.; Sowiżdżał, A.; Tomaszewska, B. Energetic and Environmental Aspects of Individual Heat Generation for Sustainable Development at a Local Scale—A Case Study from Poland. Energies 2020, 13, 454. [Google Scholar] [CrossRef]
  6. Kaczmarczyk, M. Building energy characteristic evaluation in terms of energy efficiency and ecology. Energy Convers. Manag. 2024, 306, 118284. [Google Scholar] [CrossRef]
  7. Tettey, U.; Dodoo, A.; Gustavsson, L. Primary energy implications of different design strategies for an apartment building. Energy 2016, 104, 132–148. [Google Scholar] [CrossRef]
  8. Guarino, F.; Cellura, M.; Longo, S.; Gulotta, T.; Mistretta, M.; Tumminia, G.; Ferraro, M.; Antonucci, V. Integration of building simulation and life cycle assessment: A TRNSYS application. Energy Procedia 2016, 101, 360–367. [Google Scholar] [CrossRef]
  9. Jiang, Z.; Risbeck, M.J.; Ramamurti, V.; Murugesan, S.; Amores, J.; Zhang, C.; Lee, Y.M.; Drees, K.H. Building HVAC control with reinforcement learning for reduction of energy cost and demand charge. Energy Build. 2021, 239, 110833. [Google Scholar] [CrossRef]
  10. Gibbons, L.; Javed, S. A review of HVAC solution-sets and energy performance of nearly zero-energy multi-story apartment buildings in Nordic climates by statistical analysis of environmental performance certificates and literature review. Energy 2022, 238, 121709. [Google Scholar] [CrossRef]
  11. Zhou, S.L.; Shah, A.A.; Leung, P.K.; Zhu, X.; Liao, Q. A comprehensive review of the applications of machine learning for HVAC. DeCarbon 2023, 2, 100023. [Google Scholar] [CrossRef]
  12. Zhang, F.; Saeed, N.; Sadeghian, P. Deep learning in fault detection and diagnosis of building HVAC systems: A systematic review with meta analysis. Energy AI 2023, 12, 100235. [Google Scholar] [CrossRef]
  13. Liang, X.; Chen, K.; Chen, S.; Zhu, X.; Jin, X.; Du, Z. IoT-based intelligent energy management system for optimal planning of HVAC devices in net-zero emissions PV-battery building considering demand compliance. Energy Convers. Manag. 2023, 292, 117369. [Google Scholar] [CrossRef]
  14. Wang, C.; Ferrando, M.; Causone, F.; Jin, X.; Zhou, X.; Shi, X. An innovative method to predict the thermal parameters of construction assemblies for urban building energy models. Build. Environ. 2022, 224, 109541. [Google Scholar] [CrossRef]
  15. Askeland, M.; Georges, L.; Korpas, M. Low-parameter linear model to activate the flexibility of the building thermal mass in energy system optimization. Smart Energy 2023, 9, 100094. [Google Scholar] [CrossRef]
  16. Kaczmarczyk, M. Energy environmental matrix for buildings energy performance certificate evaluation. Energy Build. 2025, 341, 115859. [Google Scholar] [CrossRef]
  17. Wi, S.; Kang, Y.; Yang, S.; Kim, Y.U.; Kim, S. Hazard evaluation of indoor environment based on long-term pollutant emission characteristics of building insulation materials: An empirical study. Environ. Pollut. 2021, 285, 117223. [Google Scholar] [CrossRef]
  18. Anh, L.-D.H.; Pasztory, Z. An overview of factors influencing thermal conductivity of building insulation materials. J. Build. Eng. 2021, 44, 102604. [Google Scholar] [CrossRef]
  19. Edelenbosch, O.Y.; Rovelli, D.; Levesque, A.; Marangoni, G.; Tavoni, M. Long term, cross-country effects of buildings insulation policies. Technol. Forecast. Soc. Change 2021, 170, 120887. [Google Scholar] [CrossRef]
  20. Lim, T.; Yim, W.S.; Kim, D.D. Evaluation of Daylight and Cooling Performance of Shading Devices in Residential Buildings in South Korea. Energies 2020, 13, 4749. [Google Scholar] [CrossRef]
  21. Błazy, R.; Błachut, J.; Ciepiela, A.; Łabuz, R.; Papież, R. Thermal Modernization Cost and the Potential Ecological Effect—Scenario Analysis for Thermal Modernization in Southern Poland. Energies 2021, 14, 2023. [Google Scholar] [CrossRef]
  22. Lis, A.; Ujma, A. Redukcja emisji pyłów zawieszonych w wyniku poprawy izolacyjności cieplnej przegród i zmiany nośnika energii. Reducing of particulate matter emissions as a result of walls thermal insulation improvement and energy carriers changes. Constr. Optimazed Energy Potential 2016, 1, 47–54. [Google Scholar]
  23. Kim, Y.; Yu, K.H. Study on the certification policy of zero-energy buildings in Korea. Sustainability 2020, 12, 5172. [Google Scholar] [CrossRef]
  24. Yousefi, M.; Hajizadeh, A.; Soltani, M.N.; Hredzak, B.; Kianpoor, N. Profit assessment of home energy management system for buildings with A-G energy labels. Appl. Energy 2020, 277, 115618. [Google Scholar] [CrossRef]
  25. Andelkovic, A.S.; Kljajić, M.; Macura, D.; Munćan, V.; Mujan, I.; Tomić, M.; Stepanov, B. Building energy performance certificate—A relevant indicator of actual energy consumption and savings? Energies 2021, 14, 3455. [Google Scholar] [CrossRef]
  26. Conticelli, E.; Falcioni, S.; Marzani, G.; Morini, G.L.; Tondelli, S. Assessing energy efficiency at urban scale through the use of energy performance certificates: An application in the Emilia-Romagna region, Italy. Cities 2024, 145, 104728. [Google Scholar] [CrossRef]
  27. Manso-Burgos, A.; Ribo-Perez, D.; Van As, J.; Montagud-Montalva, C.; Royo-Pastor, R. Diagnosis of the building stock using Energy Performance Certificates for urban energy planning in Mediterranean compact cities. Case of study: The city of Valencia. in Spain. Energy Convers. Manag. X 2023, 20, 100450. [Google Scholar] [CrossRef]
  28. Kaczmarczyk, M.; Sowiżdżał, A. Environmental friendly energy resources improving air quality in urban area. Energy Rep. 2024, 11, 3383–3394. [Google Scholar] [CrossRef]
  29. Dzikuć, M. Problems associated with the low emission limitation in Zielona Góra (Poland): Prospects challenges. J. Clean. Prod. 2017, 166, 81–87. [Google Scholar] [CrossRef]
  30. Dzikuć, M.; Piwowar, A.; Szufa, S.; Adamczyk, J.; Dzikuć, M. Potential and Scenarios of Variants of Thermo-Modernization of Single-Family Houses: An Example of the Lubuskie Voivodeship. Energies 2021, 14, 191. [Google Scholar] [CrossRef]
  31. Piotrowska-Woroniak, J.; Woroniak, G. Redukcja emisji zanieczyszczeń w wyniku termomodernizacji zabytkowych obiektów sakralnych. Reduction of emission pollution as a result of thermomodernisation historic sacral buildings. Civ. Environ. Eng. 2014, 5, 73–77. [Google Scholar]
  32. Piccardo, C.; Gustavsson, L. Implications of different modelling choices in primary energy and carbon emission analysis of buildings. Energy Build. 2021, 247, 111145. [Google Scholar] [CrossRef]
  33. Alvarez Florez, L.; Pean, T.; Salom, J. Hourly based methods to assess carbon footprint flexibility and primary energy use in decarbonized buildings. Energy Build. 2023, 294, 113213. [Google Scholar] [CrossRef]
  34. Ramon, D.; Allacker, K.; Trigaux, D.; Wouters, H.; Lipzig, N.P.M. Dynamic modelling of operational energy use in a building LCA: A case study of a Belgian office building. Energy Build. 2023, 278, 112634. [Google Scholar] [CrossRef]
  35. Staniunas, M.; Medineckiene, M.; Zavadskas, E.; Kalibatas, D. To modernize or not: Ecological-economical assessment of multi-dwelling houses modernization. Archiv. Civ. Mech. Eng. 2013, 13, 88–98. [Google Scholar] [CrossRef]
  36. Basińska, M.; Koczyk, H.; Kosmowski, A. Assessment of thermo modernization using the global cost method. Energy Procedia 2015, 78, 2040–2045. [Google Scholar] [CrossRef]
  37. Szulgowska-Zgrzywa, M.; Piechurski, K.; Stefanowicz, E. Multi-criteria assessment of the scenarios of changing the heating system in apartments in historical buildings in Wroclaw (Poland)—Case study. Energy Build. 2022, 254, 111611. [Google Scholar] [CrossRef]
  38. Hajto, M.; Kaczmarczyk, M. The potential to improve air quality by increasing the use of deep geothermal energy. Geol. Geophys. Environ. 2022, 48, 147–175. [Google Scholar] [CrossRef]
  39. Liu, J.; Zhang, Q.; Dong, Z.; Li, X.; Li, G.; Li, K. Quantitative evaluation of the building energy performance based on short-term energy predictions. Energy 2021, 223, 120065. [Google Scholar] [CrossRef]
  40. Andrews, A.; Jain, R.K. Beyond Energy Efficiency: A clustering approach to embed demand flexibility into building energy benchmarking. Appl. Energy 2022, 327, 119989. [Google Scholar] [CrossRef]
  41. Shimoda, Y.; Yamaguchi, Y.; Iwafune, Y.; Hidaka, K.; Meier, K.; Yagita, Y.; Kawamoto, H.; Nishikiori, S. Energy demand science for a decarbonized society in the context of the residential sector. Renew. Sustain. Energy Rev. 2020, 132, 110051. [Google Scholar] [CrossRef]
  42. Kaczmarczyk, M.; Kaczmarczyk, M.A.; Pełka, G.; Luboń, W.; Będkowska, A.; Piechowicz, Ł.; Ciapała, B.; Blok, M. Niska Emisja od Przyczyn Występowania do Sposobów Eliminacji [Low-Stack Emissions: Causes and Methods of Elimination]; Geosystem Burek, Kotyza S.C.: Kraków, Poland, 2015. [Google Scholar]
  43. Kaczmarczyk, M.; Kaczmarczyk, M.A.; Pełka, G.; Luboń, W.; Będkowska, A.; Ciapała, B.; Malik, D.; Podlewska, E.; Zboina, M. Niska Emisja—Efektywność Energetyczna w Gminach i Samorządach [Low-Stack Emissions: Energy Efficiency in Municipalities and Local Governments]; Globenergia Sp. z o.o.: Kraków, Poland, 2017. [Google Scholar]
  44. POP. Program Ochrony Powietrza Dla Województwa Małopolskiego, Urząd Marszałkowski Województwa Małopolskiego [Air Protection Programme for the Małopolska Province, Marshal’s Office of the Małopolska Province], Kraków. 2017. Available online: https://powietrze.malopolska.pl/program-ochrony-powietrza (accessed on 6 August 2025).
  45. GUS. 2024: Zużycie Nośników Energii w Gospodarstwach Domowych w 2021 r.; Główny Urząd Statystyczny: Warszawa, Poland, 2024. [Google Scholar]
  46. ISO 6946; “Building Components and Building Elements—Thermal Resistance and Thermal Transmittance—Calculation Methods”—The Standard for Calculating Thermal Transmittance Coefficients of Multilayer Walls. ISO: Geneva, Switzerland, 2017.
  47. ISO 13370; Thermal Performance of Buildings—Heat Transfer via the Ground—Calculation Methods. ISO: Geneva, Switzerland, 2017.
  48. ISO 10077-1; Thermal Performance of Windows, Doors and Shutters—Calculation of Thermal Transmittance. ISO: Geneva, Switzerland, 2017.
  49. EN 12831:2006; Heating systems in buildings—Method for calculating the design heat load. ISO: Geneva, Switzerland, 2006.
  50. ISO 13788; Hydrothermal Performance of Building Components and Building Elements. Internal Surface Temperature to Avoid Critical Surface Humidity and Interstitial Condensation. Calculation Methods. ISO: Geneva, Switzerland, 2012.
  51. Journal of Laws [Dz. U.] of 2015 Item 376: Rozporządzenie Ministra Infrastruktury i Rozwoju z Dnia 27 Lutego 2015 r. w Sprawie Metodologii Wyznaczania Charakterystyki Energetycznej Budynku lub Części Budynku oraz Świadectw [Regulation of the Minister of Infrastructure and Development of 27 February 2015 on the Methodology for Determining the Energy Performance of a Building or Part of a Building and Certificates]. Available online: https://isap.sejm.gov.pl/isap.nsf/DocDetails.xsp?id=WDU20150000376 (accessed on 6 August 2025).
  52. Journal of Laws [Dz. U.] of 2023 Item 697: Regulation of the Minister of Development and Technology of 13 April 2023 Changing Regulation of the Minister of Infrastructure and Development of 27 February 2015 on the Methodology for Determining the Energy Performance of a Building or Part of a Building and Energy Performance Certificates. Available online: https://isap.sejm.gov.pl/isap.nsf/DocDetails.xsp?id=WDU20230000697 (accessed on 6 August 2025).
  53. Journal of Laws [Dz. U.] of 2017 Item 2285: Rozporządzenie Ministra Infrastruktury i Budownictwa z Dnia 14 Listopada 2017 r. Zmieniające Rozporządzenie w Sprawie Warunków Technicznych, Jakim Powinny Odpowiadać Budynki i Ich Usytuowanie [Regulation of the Minister of Infrastructure and Construction of 14 November 2017 Amending the Regulation on Technical Conditions to be Met by Buildings and Their Location]. Available online: https://isap.sejm.gov.pl/isap.nsf/DocDetails.xsp?id=WDU20170002285 (accessed on 6 August 2025).
  54. KOBiZE, 2021, Wskaźniki Emisji Zanieczyszczeń ze Spalania Paliw dla Źródeł o Nominalnej Mocy Cieplnej do 5 MW, Zastosowane do Automatycznego Wyliczenia Emisji w Raporcie do Krajowej Bazy za 2020 r. [Emission Factors for Pollutants Produced by Fuel Combustion for Sources with Nominal Thermal Power of up to 5 MW, Used for Automatic Emission Calculation in the Report to the National Database for 2020]. Available online: https://krajowabaza.kobize.pl/docs/MATERIAL_wskazniki_male_kotly_2020.pdf (accessed on 6 August 2025).
  55. KOBiZE, 2020, Wskaźniki Emisyjności CO2, SO2, NOx, CO i Pyłu Całkowitego dla Energii Elektrycznej na Podstawie Informacji Zawartych w Krajowej Bazie o Emisjach Gazów Cieplarnianych i Innych Substancji za 2019 rok [CO2, SO2, NOx, CO and Total Particulate Matter Emission Factors for Electricity Based on Information Contained in the National Database on Greenhouse Gas and Other Substance Emissions for 2019]. Available online: https://www.kobize.pl/uploads/materialy/materialy_do_pobrania/wskazniki_emisyjnosci/Wskazniki_emisyjnosci_grudzien_2020.pdf (accessed on 6 August 2025).
  56. Rashad, M.; Żabnieńska-Góra, A.; Norman, L.; Jouhara, H. Analysis of energy demand in a residential building using TRNSYS. Energy 2022, 254, 124357. [Google Scholar] [CrossRef]
  57. Bergel, T.; Kotowski, T.; Woyciechowska, O. Daily water consumption for household purposes and its variability in a rural household. J. Ecol. Eng. 2016, 17, 47–52. [Google Scholar] [CrossRef]
  58. Franco, A.; Miserocchi, L.; Test, D. A method for optimal operation of HVAC with heat pumps for reducing the energy demand of large-scale non residential buildings. J. Build. Eng. 2021, 43, 103175. [Google Scholar] [CrossRef]
  59. Heracleous, C.; Michael, A.; Savvides, A.; Hayles, C. A methodology to assess energy-demand savings and cost-effectiveness of adaptation measures in educational buildings in the warm Mediterranean region. Energy Rep. 2022, 8, 5472–5486. [Google Scholar] [CrossRef]
  60. Leiria, D.; Johra, H.; Marszal-Pomiarnowska, A.; Pomianowski, M.Z. A methodology to estimate space heating and domestic hot water energy demand profile in residential buildings from low-resolution heat meter data. Energy 2023, 263, 125705. [Google Scholar] [CrossRef]
  61. Kaczmarczyk, M.; Książek, R.; Hałaj, E.; Gdowska, K.; Kapłan, R.; Pełka, G.; Luboń, W. Assessing discrepancies in heat demand: A case study of diverse energy management systems within the energy performance certificate framework in a student’s dormitory. Energy Builds 2025, 329, 115235. [Google Scholar] [CrossRef]
  62. Martínez-de-Alegría, I.; Río, R.M.; Zarrabeitia, E.; Alvarez, I. Heating demand as an energy performance indicator: A case study of buildings built under the passive house standard in Spain. Energy Policy 2021, 159, 112604. [Google Scholar] [CrossRef]
  63. Li, L.; Sun, W.; Hu, W.; Sun, Y. Impact of natural and social environmental factors on building energy consumption: Based on bibliometrics. J. Build. Eng. 2001, 37, 102136. [Google Scholar] [CrossRef]
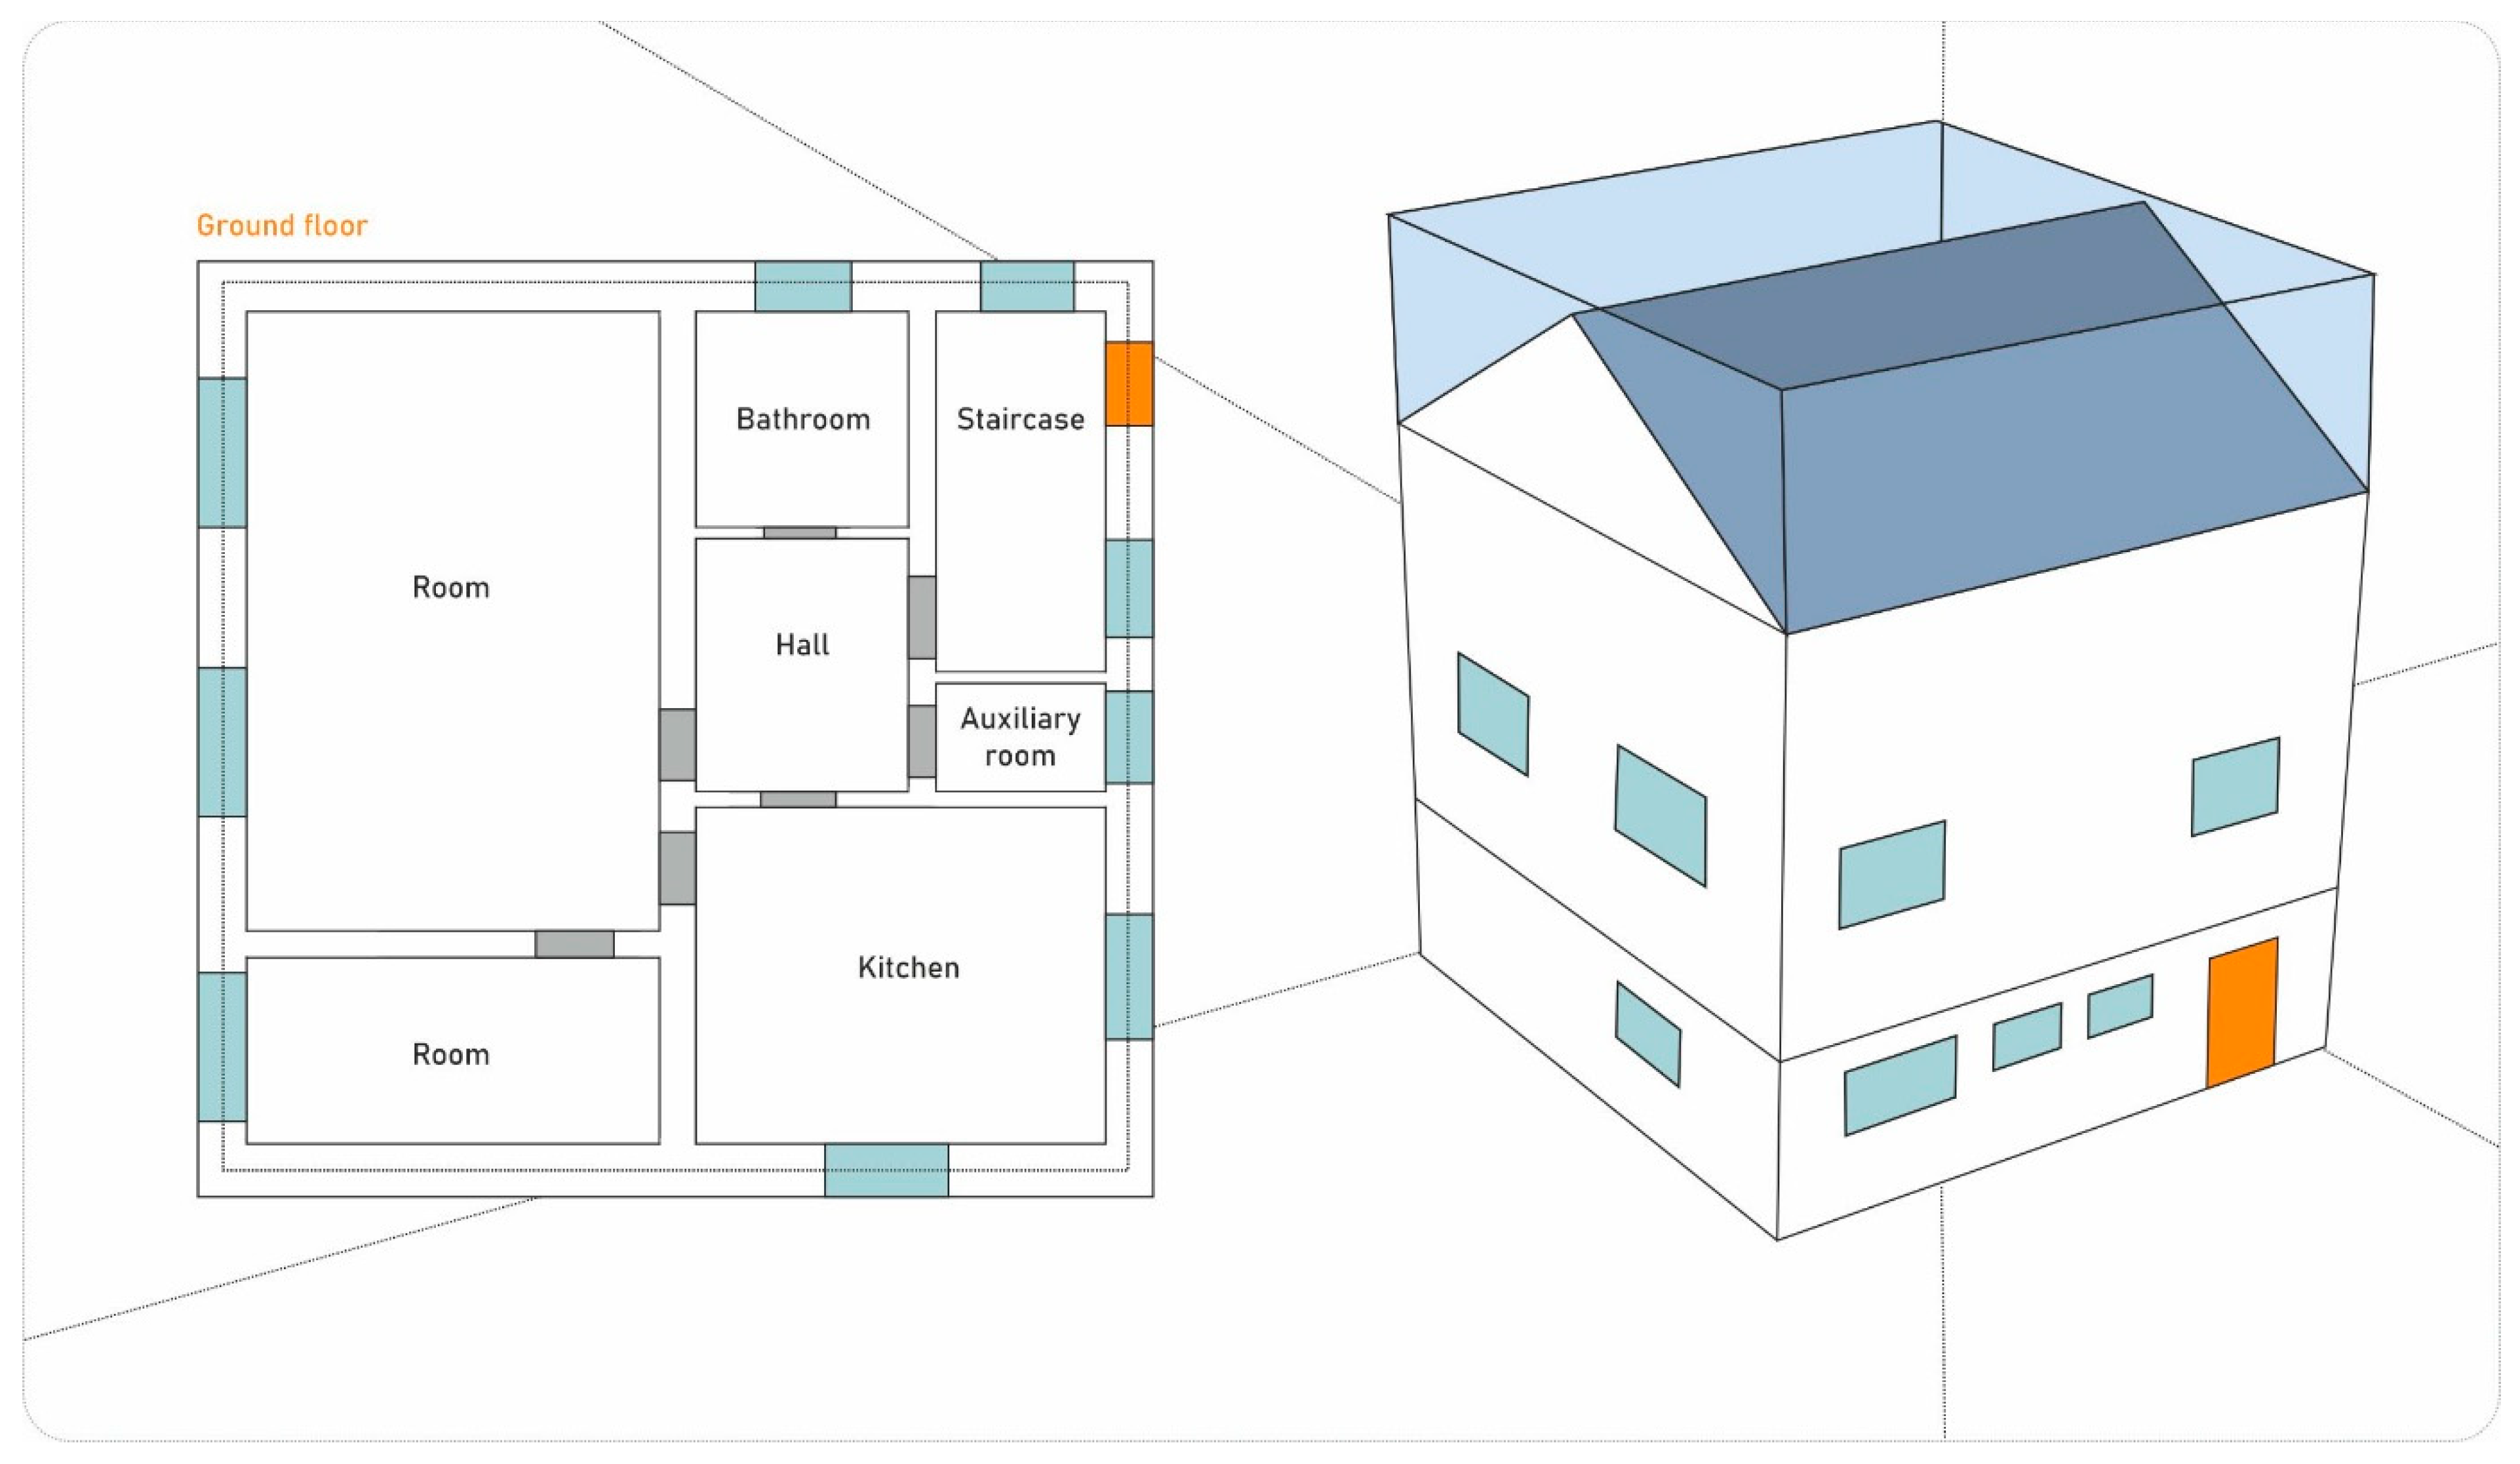
Figure 1. 3D view of the model building analysed and plan of one of the floors.
Energies 18 04372 g001
Figure 2. Analysis results for heat source switching (building left as is) (options P0–P7).
Energies 18 04372 g002
Figure 3. Analysis results for heat source switching (options T0–T7).
Energies 18 04372 g003
Figure 4. Analysis results for heat source switching (options M0–M7).
Energies 18 04372 g004
Figure 5. Comparison of total net unit costs of energy generation for individual options [EUR/GJ].
Energies 18 04372 g005
Figure 6. Comparison of net unit fixed and variable costs of energy generation for individual options [EUR/GJ] (values stated do not include subsidies).
Energies 18 04372 g006
Table 1. Extract from the energy performance certificate.
Energy Performance IndicatorRated BuildingRequirements for a New Building Pursuant to Technical and Construction Regulations
Annual useful energy demandEU = 207.7 kWh/m2year
Annual final energy demandEK = 389.3 kWh/m2year
Annual primary energy demandEP = 214.8 kWh/m2yearEP = 70.0 kWh/m2year
Unit CO2 emissionsECO2 = 0.051 t CO2/m2year
Share of renewable energy sources in annual final energy demandURES = 62.8%
Table 2. Summary of energy source switching and energy renovation options analysed.
VariantsType of Installation
P0T0M0Solid fuel boiler (50% coal, 50% biomass)
P1T1M1Biomass boiler
P2T2M2Biomass boiler + solar collectors
P3T3M3Gas boiler
P4T4M4Gas boiler + solar collectors
P5T5M5Heat pump brine/water (COP = 3.3)
P6T6M6Heat pump brine/water (COP = 3.3) + PV
P7T7M7Heat pump air/water (COP 2.6) + PV
Option designations are as follows: P0—baseline option. P1–P7—options in which the building structure is not altered in any way, but the heat source is replaced to analyse how such a measure would change the final and primary energy values. T0–T7—heat sources as for the “P” options, but the building is subject to energy renovation to meet the technical conditions in force at the time of the study, i.e., WT2017. M0–M7—optimisation to meet the technical conditions that will apply from 2021 onwards (WT2021).
Table 3. Summary of energy renovation works for options T0–T7 (WT2017).
No.Type of ThermomodernisationUo (Before
Thermomodernisation)
[W/(m2 K)]
Uo (After
Thermomodernisation)
[W/(m2 K)]
Umax
[W/(m2 K)]
1Thermal insulation of the floor on the ground with 10 cm of polystyrene0.5540.2360.30
2Thermal insulation of external walls with 15 cm polystyrene0.9320.2270.23
3Thermal insulation of the ceiling under the unheated attic with 22 cm mineral wool0.7290.1790.18
4Roof thermal insulation with 30 cm mineral wool4.9460.1760.18
5Replacement of external doors2.5001.5001.50
6Windows replacement1.5001.1001.10
Table 4. Summary of energy renovation works for options M0–M7 (WT2021).
No.Type of ThermomodernisationUo (Before
Thermomodernisation)
[W/(m2 K)]
Uo (After
Thermomodernisation)
[W/(m2 K)]
Umax
[W/(m2 K)]
1Thermal insulation of the floor on the ground with 10 cm polystyrene0.5540.2360.30
2Thermal insulation of external walls with 18 cm polystyrene0.9320.1970.20
3Thermal insulation of the ceiling under the unheated attic with 30 cm mineral wool0.7290.1400.15
4Roof thermal insulation with 35 cm mineral wool4.9460.1500.15
5Replacement of external doors2.5001.1001.10
6Windows replacement1.5000.9000.90
Table 5. Costs of energy renovation works for options T0–T7 (WT2017).
No.Type of Thermomodernisation Single ActionArea [m2]Cost [EUR/m2]Total Costs [EUR]
1Thermal insulation of the floor on the ground with 10 cm of polystyrene67.9343.002920.99
2Thermal insulation of external walls with 15 cm polystyrene96.8557.005520.45
3Thermal insulation of the ceiling under the unheated attic with 22 cm mineral wool77.9557.004443.15
4Roof thermal insulation with 30 cm mineral wool278.1247.5013,210.70
5Replacement of external doors1.90276.00524.40
6Windows replacement34.95193.506762.83
7TOTAL33,382.85
Table 6. Costs of energy renovation works for options M0–M7 (WT2021).
No.Type of Thermomodernisation Single ActionArea [m2]Cost [EUR/m2]Total Costs [EUR]
1Thermal insulation of the floor on the ground with 10 cm of polystyrene67.9343.009290.99
2Thermal insulation of external walls with 18 cm polystyrene96.8558.505665.73
3Thermal insulation of the ceiling under the unheated attic with 30 cm mineral wool77.9559.504638.03
4Roof thermal insulation with 35 cm mineral wool278.1250.0013,906.00
5Replacement of external doors1.90276.00524.40
6Windows replacement34.95193.506762.83
7TOTAL 40,787.98
Table 7. Assumptions of selected fuel parameters taken into account in the economic analysis.
No.Type of FuelCalorific Value QwNet Price [EUR]
1firewood, birch, moisture content 0%15.6 MJ/kg [m3/(m2year)]96.67 per m3
2hard coal26 MJ/kg [Mg/(m2year)]333.33 per Mg
3wood chips with moisture content
20–60%, density 150–400 kg/m3
(275 kg/m3 assumed) [kg/(m2year)]
6–16 MJ/kg (11 MJ/kg assumed)48.33 per Mg
4electricity[kWh/(m2year)]0.23 per kWh
5solar energy[kWh/(m2year)]
6natural gas48 TJ/Gg (~34.23 MJ/m3) [m3/(m2year)]0.86 per m3
Table 8. Emission factors W for the energy carriers and combustion technologies used in the baseline and energy renovation options [54,55].
No.PollutantEmission Factor W
Coal–Traditional Boiler with Manual Loading
(g/GJ)
Wood–Traditional Boiler with Manual Loading
(g/GJ)
Wood–Boiler with Manual Loading–Eco-Design (g/GJ)Fuel Gas (g/GJ)Electricity (kg/MWh)
1TSP350350400.50.029
2PM10312333380.5No data
3PM2,5242315360.5No data
4CO296,3700057650719
5CO25003000440300.233
6NOx16080120500.576
7SO241015110.40.511
8BaP0.350.130.0150.0000008No data
Table 9. Analysis results for heat source switching (building left as is) (options P0–P7).
VariantFinal Energy [kWh/m2year]Primary Energy [kWh/m2year]RES Share [%]
TotalHeating and
Ventilation
Domestic Hot WaterTotal Heating and
Ventilation
Domestic Hot Water
P0389.3321.867.6214.8197.417.462.8
P1422.3354.767.694.176.817.499.2
P2403.8354.749.190.776.813.999.0
P3298.6249.649.0341.6285.056.50.0
P4286.5249.636.9320.6285.035.62.4
P592.177.015.1276.3231.145.265.7
P692.177.015.175.261.014.194.9
P7114.197.017.190.675.015.695.9
Table 10. Analysis results for heat source switching (options T0–T7).
VariantFinal Energy [kWh/m2year]Primary Energy [kWh/m2year]RES Share [%]
TotalHeating and
Ventilation
Domestic Hot WaterTotalHeating and
Ventilation
Domestic Hot Water
T0181.9114.367.693.175.717.468.8
T1203.2135.667.649.031.617.498.5
T2184.7135.649.145.531.613.998.1
T3138.589.549.0158.0101.556.50.0
T4127.489.538.0138.9101.537.45.8
T544.028.915.2132.086.645.562.2
T644.028.915.240.426.014.490.5
T753.236.017.246.830.915.992.2
Table 11. Analysis results for heat source switching (options M0–M7).
VariantFinal Energy [kWh/m2 year]Primary Energy [kWh/m2 year]RES Share [%]
TotalHeating and
Ventilation
Domestic Hot WaterTotalHeating and
Ventilation
Domestic Hot Water
M0179.0111.467.687.770.417.471.2
M1190.3122.867.646.328.917.498.5
M2171.8122.849.142.828.913.997.9
M3135.386.349.0154.497.956.50.0
M4124.386.338.0135.397.937.45.9
M543.528.415.2130.685.245.561.3
M643.528.415.241.126.714.489.4
M752.535.217.247.431.515.991.2
Table 12. Pollutant emissions for individual energy renovation options.
VariantType of InstallationEmission (kg/year)
TSPPM 10PM 2.5CO2CONOxSO2B(a)P
P0Solid fuel boiler
(50% coal, 50% biomass)
83.6477.6268.468992.48670.2426.5840.440.0516
P1Biomass boiler7.767.376.980.0085.3623.282.130.0029
P2Biomass boiler
+ solar collectors
7.407.036.660.0081.4022.202.030.0028
P3Gas boiler0.080.080.088804.644.587.640.060.0000
P4Gas boiler
+ solar collectors
0.070.070.078395.994.377.280.060.0000
P5Heat pump brine/water0.350.000.008789.472.857.046.250.0000
P6Heat pump brine/water
+ PV
0.110.000.002636.840.852.111.870.0000
P7Heat pump air/water
+ PV
0.130.000.003308.371.072.652.350.0000
T0Solid fuel boiler
(50% coal, 50% biomass)
38.3735.7631.943418.71311.1311.6115.660.0221
T1Biomass boiler3.513.333.160.0038.5910.520.960.0013
T2Biomass boiler
+ solar collectors
3.152.992.830.0034.639.440.870.0012
T3Gas boiler0.030.030.033980.532.073.450.030.0000
T4Gas boiler
+ solar collectors
0.030.030.033571.881.863.100.020.0000
T5Heat pump brine/water0.160.000.004028.911.313.232.860.0000
T6Heat pump brine/water
+ PV
0.050.000.001208.670.390.970.860.0000
T7Heat pump air/water
+ PV
0.060.000.001495.700.481.201.060.0000
M0Solid fuel boiler
(50% coal, 50% biomass)
35.7033.2929.793090.55289.9810.7314.200.0203
M1Biomass boiler3.263.102.930.0035.849.770.900.0012
M2Biomass boiler
+ solar collectors
2.902.752.610.0031.888.690.800.0011
M3Gas boiler0.030.030.033696.511.923.210.030.0000
M4Gas boiler
+ solar collectors
0.030.030.033287.861.712.850.020.0000
M5Heat pump brine/water0.150.000.003748.631.213.002.660.0000
M6Heat pump brine/water
+ PV
0.050.000.001124.590.360.900.800.0000
M7Heat pump air/water
+ PV
0.060.000.001388.980.451.110.990.0000
Table 13. Pollutant emissions for individual energy renovation options.
VariantType of InstallationEmission Reduction in Relation to the Variant P0 (%)
TSPPM 10PM 2.5CO2CONOxSO2B(a)P
P1Biomass boiler90.790.589.8100.087.312.494.794.4
P2Biomass boiler
+ solar collectors
91.290.990.3100.087.916.595.094.6
P3Gas boiler99.999.999.92.199.371.399.8100.0
P4Gas boiler
+ solar collectors
99.999.999.96.699.372.699.9100.0
P5Heat pump brine/water99.6100.0100.02.399.673.584.6100.0
P6Heat pump brine/water
+ PV
99.9100.0100.070.799.992.195.4100.0
P7Heat pump air/water
+ PV
99.8100.0100.063.299.890.094.2100.0
T0Solid fuel boiler
(50% coal, 50% biomass)
54.153.953.362.053.656.361.357.3
T1Biomass boiler95.895.795.4100.094.260.497.697.5
T2Biomass boiler
+ solar collectors
96.296.195.9100.094.864.597.997.7
T3Gas boiler100.0100.099.955.799.787.099.9100.0
T4Gas boiler
+ solar collectors
100.0100.0100.060.399.788.399.9100.0
T5Heat pump brine/water99.8100.0100.055.299.887.992.9100.0
T6Heat pump brine/water
+ PV
99.9100.0100.086.699.996.497.9100.0
T7Heat pump air/water
+ P
99.9100.0100.083.499.995.597.4100.0
M0Solid fuel boiler
(50% coal, 50% biomass)
57.357.156.565.656.759.664.960.6
M1Biomass boiler96.196.095.7100.094.763.297.897.6
M2Biomass boiler
+ solar collectors
96.596.596.2100.095.267.398.097.9
M3Gas boiler100.0100.0100.058.999.787.999.9100.0
M4Gas boiler
+ solar collectors
100.0100.0100.063.499.789.399.9100.0
M5Heat pump brine/water99.8100.0100.058.399.888.793.4100.0
M6Heat pump brine/water
+ PV
99.9100.0100.087.599.996.698.0100.0
M7Heat pump air/water
+ PV
99.9100.0100.084.699.995.897.6100.0
Disclaimer/Publisher’s Note: The statements, opinions and data contained in all publications are solely those of the individual author(s) and contributor(s) and not of MDPI and/or the editor(s). MDPI and/or the editor(s) disclaim responsibility for any injury to people or property resulting from any ideas, methods, instructions or products referred to in the content.