Abstract
This study delves into the response characteristics of core grounding current signals in power transformers across different operating conditions, aiming to enhance the accuracy of transformer condition assessment. Existing detection technologies often rely on single-parameter methods, which fall short in providing a comprehensive evaluation of transformer conditions. To address this limitation, this research develops a wideband circuit model based on multi-conductor transmission line theory and backed by experimental validation. The model systematically investigates the response mechanisms of core grounding current to various electrical stresses, including impulse voltages, power-frequency harmonics, and partial discharges. The findings reveal distinct response characteristics of core grounding current under different stresses. Under impulse voltage excitation, the core current exhibits high-frequency oscillatory decay with characteristics linked to voltage waveform parameters. In harmonic conditions, the current spectrum shows linear correspondence with excitation voltages, with no resonance below 1 kHz. Partial discharges induce high-frequency oscillations in the grounding current due to multi-resonant networks formed by distributed winding-core parameters. This study establishes a new theoretical framework for transformer condition assessment based on core grounding current analysis, offering critical insights for optimizing detection technologies and overcoming the limitations of traditional methods.
1. Introduction
In modern power systems, power transformers, as key devices, play a vital role in electric energy transmission and conversion [1,2]. Their stable operation is crucial for ensuring the reliability and safety of power supply. During transformer operation, windings and the core, coupled via distributed capacitance, form complex coupling paths [3,4,5]. When subjected to various electrical stresses such as power-frequency voltage, harmonic voltage, impulse voltage, and partial discharges, these stresses generate current signals through capacitive coupling paths between the windings and the core [6,7,8,9]. These current signals contain various information about the transformer’s condition. Thus, accurately monitoring and analyzing core grounding current signals is essential for transformer condition assessment.
However, traditional transformer condition detection techniques often rely on single-parameter methods [10,11,12]. While these methods provide some insight into transformer characteristics, they fail to offer a comprehensive analysis of multiple parameters [13,14,15]. This makes it difficult to accurately assess the overall transformer condition. For instance, single measurements like insulation resistance or partial discharge quantity can only provide limited information about insulation performance [16,17,18]. Such limitations increase the risk of undetected potential faults and catastrophic failures.
To address these limitations, this research focuses on core grounding current response characteristics under different operating conditions. We propose a physics-based hybrid model integrating MTL theory with finite element method (FEM)-derived parameters to simulate transformer behavior across wide frequencies. This approach captures distributed electromagnetic properties of windings and their coupling with cores/tanks. Recent advances provide valuable references: Zhou et al. (2024) developed a homogenized FEM to evaluate multi-point grounding currents in laminated cores, explicitly addressing anisotropic conductivity and skin effects [19]. In contrast to their conductivity-focused model, our MTL + FEM hybrid captures distributed electromagnetic coupling along windings and cores through transmission line theory combined with FEM-calculated capacitances, generating explicit time-domain and frequency-domain waveforms of core grounding currents under diverse operating conditions.
Following model development, four electrical stresses were applied to the high-voltage terminal: power-frequency harmonics, switching impulses, lightning impulses, and partial discharge pulses. Core grounding current characteristics under these conditions were obtained and validated on a laboratory transformer platform. Consistency between simulations and experiments confirmed model reliability. Characteristic summaries provide a theoretical basis for transformer condition assessment. These findings enhance detection accuracy and reliability while supporting field-test optimization.
2. Modeling and Parameter Extraction
In the process of transformer winding modeling, each conductor turn is treated as an independent transmission line unit to construct a multi-conductor uniform transmission line model (assuming uniform axial distribution of turn parameters) [20,21]. By applying the Fast Fourier Transform (FFT) to convert the time-domain problem into the frequency domain, the frequency-domain multi-conductor transmission line equations are solved to obtain the winding voltage response. Compared with traditional lumped-parameter models, this method significantly improves simulation accuracy in high-frequency regimes.
Each winding turn is defined as a transmission line element connected sequentially according to the actual winding geometry, forming the multi-conductor transmission line network shown in Figure 1. Here, S denotes the line starting terminal and n the ending terminal; Us and Is represent the input voltage and current at the winding head, while Un and In correspond to the output quantities at the winding tail. The slash symbols indicate electrical continuity between winding terminals. For continuous windings, the numbering starts from the first turn at the high-voltage terminal and ends at the last turn connected to the grounding lead.
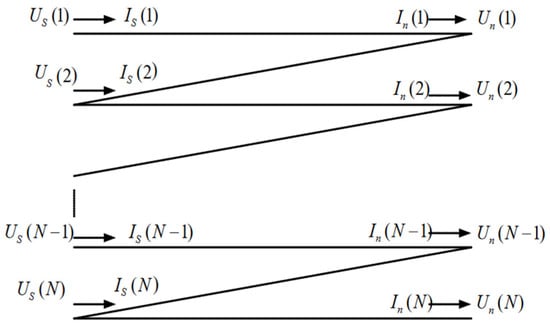
Figure 1.
Transformer multi-conductor model.
The time-domain multi-conductor transmission line equations are expressed as
where U (x, t) and I (x, t) are N-dimensional voltage/current column vectors, and R, L, G, and C represent per-unit-length resistance, inductance, conductance, and capacitance matrices, respectively. The following simplifications are adopted for the 10/0.4 kV distribution transformer model: (1) The high-voltage winding is divided into 12 layers, each layer is divided into 14 sections, and each section corresponds to 6 turns; the low-voltage winding is divided into 3 layers, each layer is divided into 14 sections, and each section corresponds to 1 turn. (2) Structural components such as clamping pieces are ignored, and only the main coupling paths between the winding and the core/tank are considered, that is, the tank is only coupled with the high-voltage winding, and the core is only coupled with the low-voltage winding.
The established model is shown in Figure 2, where CWC is the coupling capacitance between each section of the high-voltage winding and the tank; CD is the coupling capacitance between different sections of the winding; Ck is the coupling capacitance between adjacent sections of the same layer of the winding; CZ is the coupling capacitance between the high- and low-voltage windings; CWD is the coupling capacitance between each section of the low-voltage winding and the core; R is the internal resistance of each section of the high- and low-voltage windings; and L is the self-inductance of each section of the high- and low-voltage windings.
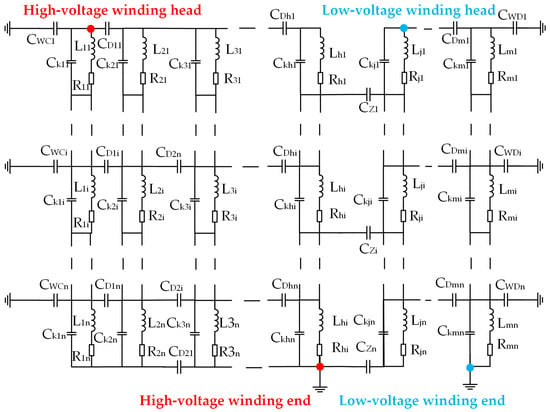
Figure 2.
Transformer wideband-equivalent circuit model.
In this paper, the finite element method is used to discretize the transformer model into a series of simple calculation models to obtain parameters [22,23,24]. Considering that the windings of each column of the transformer have basically the same structure and size except for different winding directions, modeling the windings of one column of the transformer can accurately calculate the resistance, inductance, and capacitance parameters corresponding to the windings of one phase. The finite element model of a transformer is established in the finite element software. The FEM model was established with the following boundary conditions: the core grounding lead was set to floating potential, the winding head received voltage/current excitation, and the winding tail was grounded. Adaptive meshing was applied throughout the computational domain to ensure convergence in high-gradient regions, as shown in Figure 3. The capacitance parameters calculated by the finite element model are listed in Table 1.
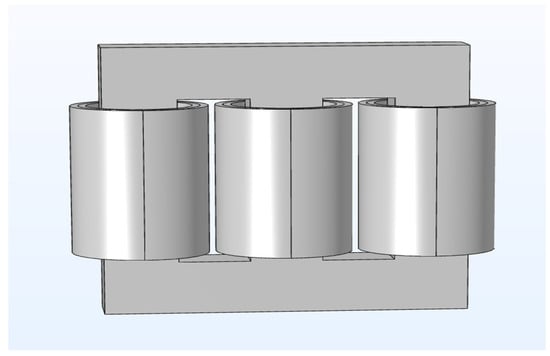
Figure 3.
Transformer finite element model.

Table 1.
Values of each capacitor parameter.
Winding inductance consists of self-inductance and mutual inductance components. Figure 4a and Figure 4b, respectively, depict the mutual inductance distributions of the 7th section (geometric center) in the 1st layer of high-voltage and low-voltage windings, where the mutual inductance of the 7th section equals its self-inductance value. Observations reveal that the mutual inductance between adjacent sections is maximal (approximately 85% of the self-inductance value), decaying exponentially with increasing spacing (less than 5% of the self-inductance value when the spacing exceeds 3 sections). The mutual inductance distribution between high-voltage and low-voltage windings (Figure 4c) indicates that the mutual inductance of corresponding sections (e.g., the 7th section of the high-voltage winding and the 7th section of the low-voltage winding) is maximal, while the mutual inductance of non-opposing sections decreases sharply with the increase in section number.

Figure 4.
Partial self- and mutual-inductance values in broadband-equivalent circuit models: (a) inductance of the first layer of the high-voltage winding; (b) inductance of the first layer of the low-voltage winding; (c) mutual inductance between the first layer of high-voltage windings and low-voltage windings.
The finite element parameters are imported into the wideband multi-conductor circuit model, after which the MLT matrix operation code is run in MATLAB 2022b to simulate the core ground current response under different electrical stress conditions, thus revealing the correlation law between the electrical stress characteristics and the ground current behavior.
3. Simulation of Core Grounding Current Response Characteristics
Following the completion of the broadband multi-conductor transmission line model for the transformer, four categories of typical electrical stresses were systematically applied in this study: lightning impulse voltage, switching impulse voltage, power-frequency-harmonic-combined voltage, and partial discharge. This experimental configuration aims to investigate the time–frequency-domain response mechanisms of core grounding current under different electrical stress conditions. Through comparative analysis of the waveform characteristics, spectral distribution patterns, and energy evolution properties of the grounding current under various operating conditions, the influence laws of different electrical stresses on current response features are systematically revealed.
3.1. Core Grounding Current Response Characteristics Under Lightning Impulse Voltage
A standard lightning impulse voltage waveform (1.2 μs ± 30% front time/50 μs ± 20% time-to-half value, spectral range 1–100 kHz) was applied to the high-voltage winding of the model, as shown in Figure 5 [25]. This excitation enables acquisition of the core grounding current’s time-domain waveform, spectral characteristics, and core-to-HV winding transfer function. Analysis of these data elucidates the response features and energy transfer mechanisms of the core grounding current under lightning impulse voltage, with typical response waveforms presented in Figure 6.
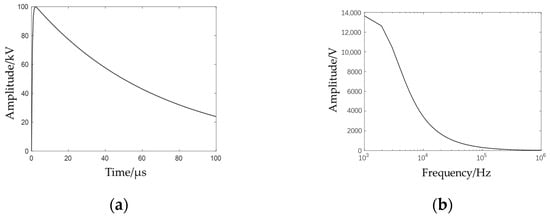
Figure 5.
Lightning impulse voltage time-domain and frequency-domain diagrams: (a) time-domain diagram; (b) frequency-domain diagram.

Figure 6.
Core grounding current under lightning impulse voltage: (a) time-domain diagram, (b) frequency-domain diagram, (c) voltage–current transfer function.
As shown in Figure 6, during the initial phase of impulse voltage application, rapid voltage variations on the winding induce transient current in the core enclosed by the windings. The high-voltage gradient (dv/dt) generates a prominent current spike, followed by oscillatory decay characteristics within the wave front duration. As the winding voltage transitions from rapid variation to gradual attenuation, the oscillatory amplitude of the core grounding current progressively diminishes, with the entire process lasting approximately 500 μs. Spectral analysis reveals that the sub-10 kHz low-frequency components exhibit amplitude variations synchronized with the gradual voltage decay phase (corresponding to the voltage tail from peak to zero), while the 10–100 kHz components concentrate in the wave front period. Energy in this frequency band attenuates during winding-core coupling and shifts toward higher frequencies, manifesting as rapid oscillations in the time-domain current waveform. Integrated analysis of the spectrum and transfer function identifies the oscillatory decay frequency as the inherent resonant frequency of the core-winding system.
3.2. Core Grounding Current Response Characteristics Under Switching Impulse Voltage
A standard switching impulse voltage full-wave (with a front time of 250 μs ± 20%, a half-peak time of 2500 μs ± 60%, and a frequency spectrum ranging from 0.1 kHz to 10 kHz) was applied to the high-voltage winding of the model [25]. The waveform is shown in Figure 7. With this excitation, the time-domain waveform of the core grounding current, its frequency-spectrum characteristics, and the transfer function between the core and the high-voltage winding can be obtained. In-depth analysis of these data can help explain the response characteristics of the core grounding current and the energy transmission laws under switching impulse voltage. The typical response waveform is shown in Figure 8.
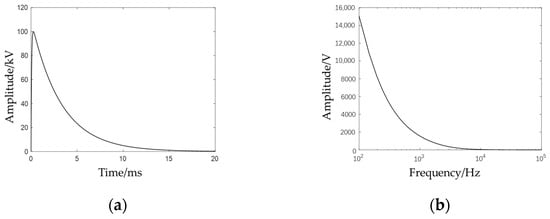
Figure 7.
Switching impulse voltage time-domain and frequency-domain diagrams: (a) time-domain diagram; (b) frequency-domain diagram.

Figure 8.
Core grounding current under switching impulse voltage: (a) time-domain diagram, (b) frequency-domain diagram, (c) voltage–current transfer function.
As can be seen from Figure 8, when the high-voltage winding is subjected to a switching impulse, the core grounding current exhibits a composite characteristic of low-frequency decay components superimposed on high-frequency oscillation components. The low-frequency component is mainly affected by the frequency-spectrum characteristics of the switching impulse voltage, while the high-frequency oscillation is dominated by the resonance effect caused by the distributed capacitance between the winding and the core. Further transfer-function analysis shows that the system has significant nonlinear resonance frequency points.
The evolution law of core current under switching impulse voltage is similar to that under lightning impulse conditions: oscillating current is generated at the moment of impact and then gradually decays. However, there are also some differences. Compared with lightning impulse conditions, the current amplitude under switching impulse is reduced by 96%, the oscillation decay time is extended to 2.3 ms, and the energy transmission frequency band shifts to a lower frequency by about one order of magnitude. Meanwhile, compared with lightning impulse conditions, the proportion of low-frequency components in the core current under switching impulse increases by 62%. This is due to the increase in the front time and half-peak time of the impulse voltage, which enhances the system’s capacitive coupling.
3.3. Core Grounding Current Response Characteristics Under Power-Frequency-Harmonic-Combined Voltage
During actual operation, transformer windings continuously endure power-frequency fundamental waves and associated harmonic voltages. To simulate steady-state operating conditions of the HV winding, a composite voltage waveform comprising 50 Hz fundamental and 3rd/5th/7th characteristic harmonics (Figure 9) was applied.
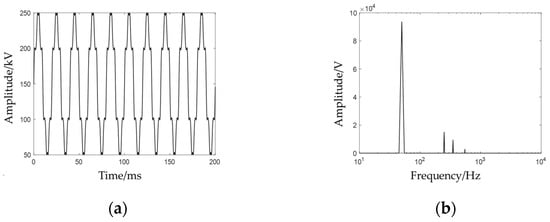
Figure 9.
Power-frequency-harmonic-combined voltage time-domain and frequency-domain diagrams: (a) time-domain diagram; (b) frequency-domain diagram.
The core grounding current response (Figure 10) exhibits spectral components at precisely 1×/3×/5×/7× harmonics, confirming that fundamental and harmonic currents in the HV winding couple to the core circuit through inter-winding stray capacitances. Significant variations in transfer gain across frequencies—particularly a 1.8× higher gain at higher harmonics—induce harmonic distortion in the core current. Transfer function analysis reveals no resonant points in this operational mode, with monotonically increasing gain versus frequency, aligning with the high-frequency conductive behavior of capacitive coupling networks.

Figure 10.
Core grounding current under power-frequency-harmonic-combined voltage: (a) time-domain diagram, (b) frequency-domain diagram, (c) voltage–current transfer function.
3.4. Core Grounding Current Response Characteristics Under Partial Discharge Excitation
In partial discharge simulation, Gaussian pulses model the pulses of partial discharges, expressed as
Figure 11 illustrates the time-domain and frequency-domain waveforms of partial discharge pulses. These pulses have a duration of T = 70 ns, a 1 V amplitude, a symmetry axis at 100 ns, and a frequency range of 0–30 MHz.
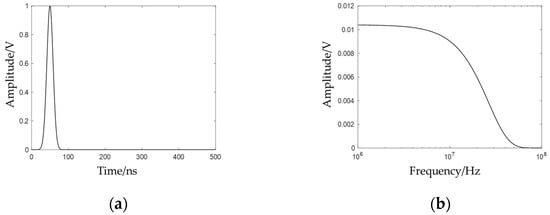
Figure 11.
Partial discharge excitation time-domain and frequency-domain diagrams: (a) time-domain diagram; (b) frequency-domain diagram.
Figure 12 shows the core grounding current’s response characteristics. Like lightning and switching impulse voltages, partial discharge currents couple to the core capacitively. The complex LC network in the path induces multiple high-frequency oscillations (1–30 MHz) in the core. In the frequency domain, spectrum energy concentrates in the high-frequency band of the electric stress. Due to coupling path impacts, the core grounding current’s time-domain waveform loses the original features of the winding-borne electric stress.
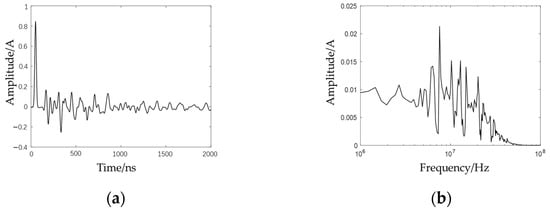
Figure 12.
Core grounding current under partial discharge excitation: (a) time-domain diagram, (b) frequency-domain diagram.
Compared to switching and lightning impulse voltages, partial discharge signals have a broader frequency domain. In the winding-core coupling path, low-frequency signals (<10 kHz) attenuate much more than high-frequency ones (>10 kHz). Thus, core grounding current energy focuses on the high-frequency band. Also, resonance points in the high-frequency band cause oscillations in the core grounding current, which lasts 2 μs with a peak frequency of 8 MHz.
In summary, core grounding current responses are shaped by both the winding-core coupling path and the windings’ electric stress. In the coupling path, low-frequency signal (<10 kHz) attenuation is much higher than that of the high-frequency signal (>10 kHz), decreasing logarithmically with frequency. Here, the path’s capacitive impedance dominates. So, the core grounding current’s time-domain waveform shows the winding-borne electric stress but with harmonic distortion from less attenuation of the harmonic-frequency components than the fundamental-frequency component.
For high-frequency signals (>10 kHz), the core’s energy-concentrated band is affected by high-frequency resonance points in the coupling path. This makes the core grounding current’s waveform unrelated to the winding-borne electric stress. Then, spectrum energy can distinguish core grounding currents under different electric stresses. That is, under low-frequency electric stress on the windings, core grounding current responses are dominated by the electric stress in the time and frequency domains. But under high-frequency electric stress, responses are dominated by the coupling path.
4. Experimental Verification of Core Grounding Current Response Characteristics
Following the simulation, this study used a 250 kVA three-phase Yyn0 oil-immersed distribution transformer (Figure 13) for impulse voltage, power-frequency voltage, and partial discharge tests. By combining the test results, the response characteristics of core grounding current under different electric stresses were investigated.
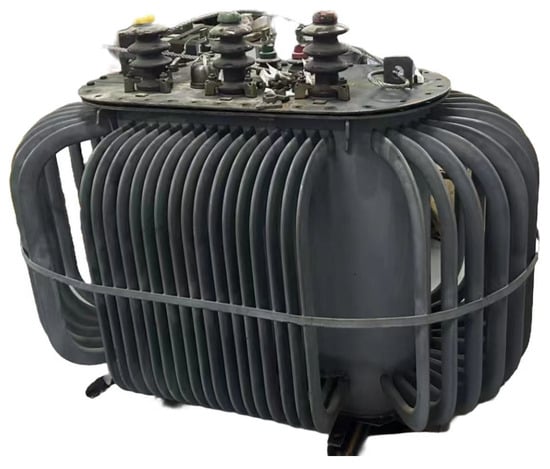
Figure 13.
Distribution transformer.
4.1. Experimental Results of Core Grounding Current Under Lightning Impulse Voltage
When subjecting the transformer to a lightning impulse test, a standard lightning impulse voltage was applied to one high-voltage winding, with the remaining two high-voltage windings and all low-voltage windings grounded. The core grounding wire was connected to an indicating resistor, and the core grounding current was obtained by measuring the voltage across this resistor. The specific connection is shown in Figure 14.
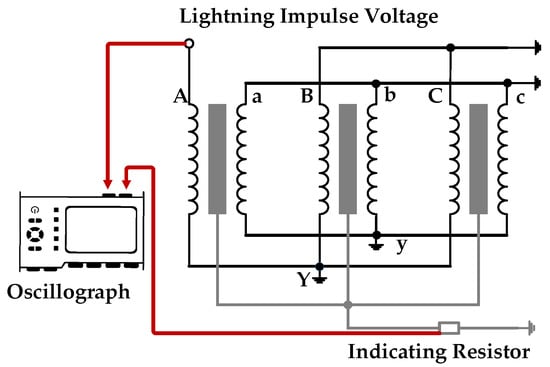
Figure 14.
Lightning impulse experiment wiring diagram.
As depicted in Figure 15, upon application of the impulse voltage, the winding voltage undergoes a rapid change, inducing a current in the core surrounded by the winding. The steep voltage gradient on the winding results in a transient current peak in the core, followed by oscillations during the wave front period. After the rapid voltage change, the winding voltage enters a relatively slow decay phase. Correspondingly, the core grounding current, influenced by the voltage gradient, evolves from an initial oscillating current into a gradually decaying current over approximately 200 microseconds.
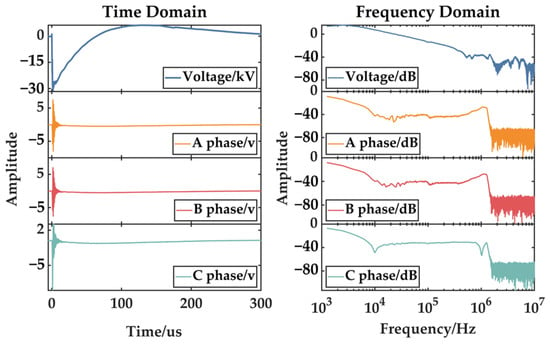
Figure 15.
Core grounding current under lightning impulse voltage.
As shown in Table 2, phases A/B exhibit single-resonance characteristics, while phase C (with insulation paper delamination near the core) shows dual resonance at 10 kHz and 1.1 MHz with 17% lower amplitude. This confirms that insulation differences significantly affect high-frequency energy transfer.

Table 2.
Characteristic value of core grounding current under lightning impulse voltage.
Spectral analysis reveals that the amplitude of the core grounding current components below 10 kHz mirrors the lightning impulse voltage, corresponding to the slowly decaying portion of the voltage from its peak. In contrast, the energy of the signal within the 10 kHz to 100 kHz band of the impulse voltage attenuates during transmission from the winding to the core, shifting towards higher frequencies. This corresponds to the rapid voltage changes during the wave front period, where the core current exhibits swift oscillations.
Figure 16 illustrates the core grounding current response within a few microseconds of the wave front period. For phases A and B, the core grounding current exhibits oscillations in the wave front period, with energy transmission from the winding to the core causing energy to shift from low to high frequencies in the 10 kHz to 100 kHz band. However, for phase C, the core grounding current oscillations in the wave front period have a smaller amplitude and duration than for A and B. The frequency-domain energy shift is less pronounced. Inspection revealed that the insulation paper of part of phase C’s winding near the core had peeled off, exposing some windings and facilitating low-frequency signal transmission. This caused the high-frequency deficiency in phase C’s core grounding current, highlighting how internal structural differences in three-phase windings affect core grounding current responses.
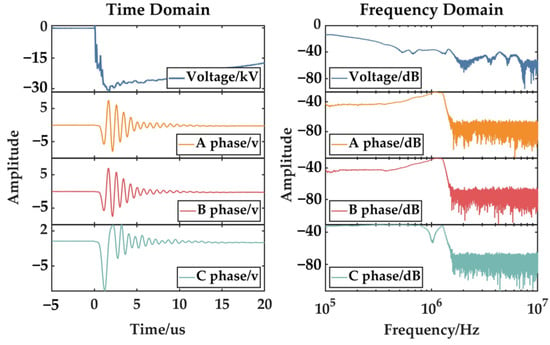
Figure 16.
Core grounding current during the wave-front period of the lightning impulse voltage.
4.2. Experimental Results of Core Grounding Current Under Switching Impulse Voltage
In the switching impulse test on the transformer, a standard switching impulse voltage was applied to one high-voltage winding, with the other two high-voltage windings left open-circuited. The low-voltage winding neutral was grounded, and the core grounding wire was connected to an indicating resistor. The core grounding current was obtained by measuring the voltage across this resistor. The specific connection is shown in Figure 17.
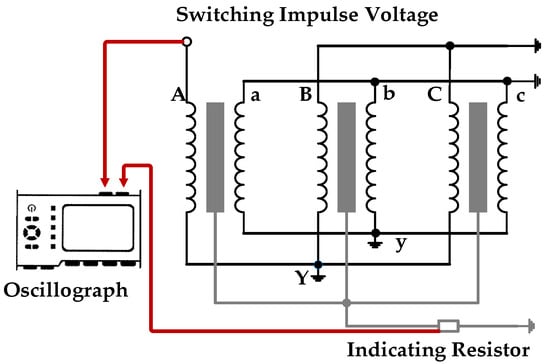
Figure 17.
Switching impulse experiment wiring diagram.
As depicted in Figure 18, under switching impulse voltage, the core grounding current displayed a similar pattern to that in the lightning impulse test. An oscillating current was induced in the core grounding circuit upon voltage application, followed by a gradual decay after oscillation ceased. However, compared to lightning impulse voltage, the current amplitude was smaller, and the oscillation and decay times were longer. During energy transfer from the winding to the core, the frequency band of energy concentration was much lower than in the lightning impulse test.
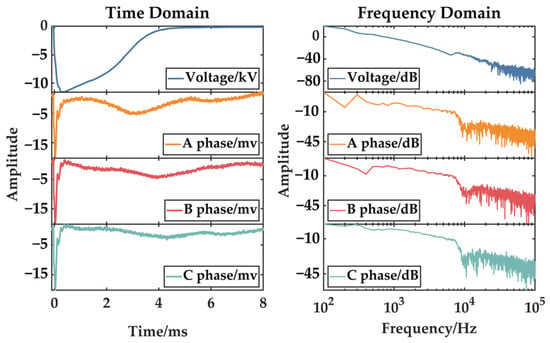
Figure 18.
Core grounding current under switching impulse voltage.
Figure 19 shows that the switching impulse voltage spanned 0.1–1 kHz, while the core grounding current was concentrated in the 1–10 kHz band. Small oscillating currents during core grounding current decay were likely due to minor partial discharges caused by transformer insulation damage from operations like disassembly and oil removal. In the switching impulse test, non-tested phases were open-circuited, making weak insulation points prone to partial discharges.
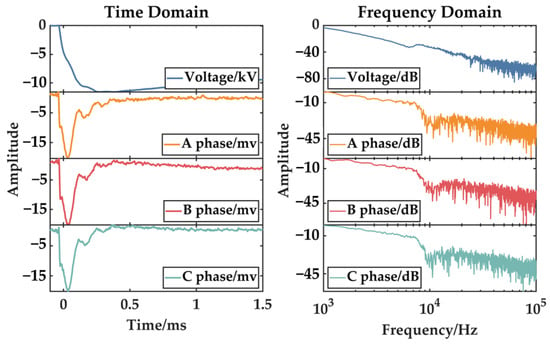
Figure 19.
Core grounding current during the wave-front period of the switching impulse voltage.
As indicated in Table 3, the core grounding currents of phases A, B, and C exhibit no resonant characteristics under switching impulse conditions. The measured current amplitudes show close agreement across all three phases. Crucially, the upper cutoff frequencies fall below the resonant frequencies observed during lightning impulse tests, accounting for the absence of oscillatory current phenomena.

Table 3.
Characteristic values of core grounding current under switching impulse voltage.
In the switching impulse voltage test on the three-phase windings, no significant differences in core grounding current were observed in either the time or frequency domains. Even phase C, with winding exposure issues, showed no discrepancies with the other two phases under low-frequency switching impulse voltage. When zooming into the wave front period, it was found that after high-frequency oscillation ended, the core grounding current decayed with slow oscillations. The overall frequency distribution was concentrated in the 1–10 kHz band, reflecting the inductive nature of the winding-core coupling path in the switching impulse test. This also highlighted the structural similarities of the three-phase windings, which led to consistent core grounding current responses under identical test conditions.
4.3. Experimental Results of Core Grounding Current Under Power-Frequency Harmonics
In the power-frequency voltage test on the transformer, a power-frequency voltage was applied to one high-voltage winding, with the other two high-voltage windings open-circuited. The low-voltage winding neutral was grounded, and the core grounding wire was connected to an indicating resistor. The core grounding current was obtained by measuring the voltage across the indicating resistor. The specific connection is shown in Figure 20.
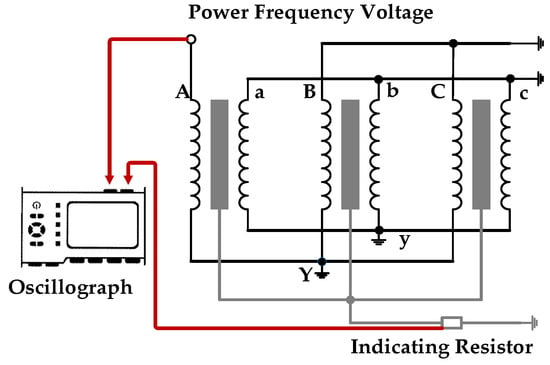
Figure 20.
Power-frequency voltage experiment wiring diagram.
As shown in Figure 21, under power-frequency steady-state voltage, the core grounding current is a power-frequency current in phase with the applied voltage. When the same voltage was applied to different windings, the core grounding current characteristics in the three tests were similar, indicating that the signal transmission from the winding to the core at the power frequency is consistent for each phase.
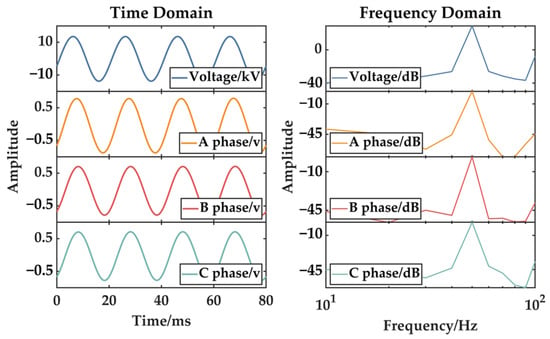
Figure 21.
Core grounding current under power-frequency voltage.
As presented in Table 4, the core grounding currents of phases A, B, and C under power-frequency excitation exhibit a fundamental component at 50 Hz. Measured amplitudes demonstrate close agreement across all three phases.

Table 4.
Characteristic value of core grounding current under power-frequency voltage.
As shown in Figure 22, as the voltage amplitude increased, the core grounding current amplitude rose slightly, with a maximum of just 1.4 mA. This is because the winding-to-core signal transmission is capacitive, limiting power-frequency signal transmission and resulting in a small core grounding current amplitude.
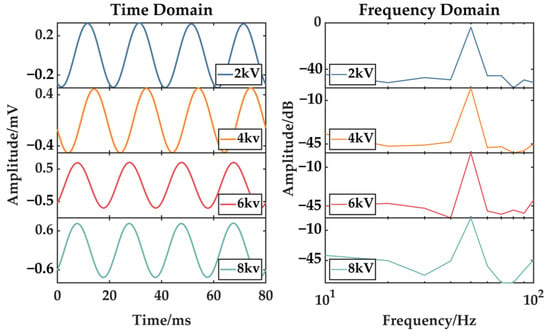
Figure 22.
Core grounding currents at different amplitudes of power-frequency voltage.
4.4. Experimental Results of Core Grounding Current Under Partial Discharge Excitation
In this study, to analyze the core grounding current response during partial discharges under power-frequency steady-state voltage, a needle-plate partial discharge (PD) defect was paralleled at the winding terminal to simulate PD occurrences under power-frequency voltage [26]. The specific connection is shown in Figure 23.
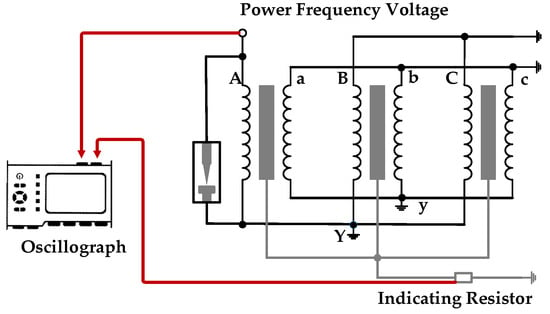
Figure 23.
Partial discharge excitation experiment wiring diagram.
As shown in Figure 24, the needle-plate PD defect triggers discharges at the rising and falling edges of the voltage.
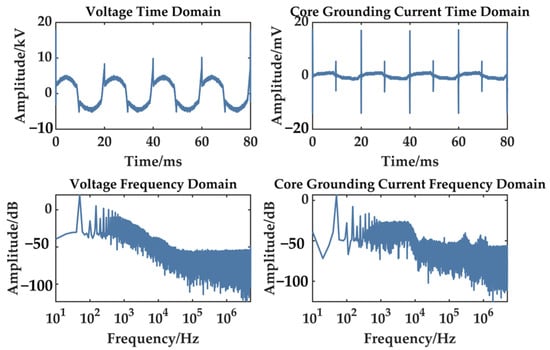
Figure 24.
Core grounding current under partial discharge excitation.
As indicated in Table 5, the core grounding current following partial discharge events contains both a fundamental 50 Hz component and superimposed partial discharge (PD) pulse signals, exhibiting significant spectral separation and distinct amplitude disparity between these components.

Table 5.
Characteristic value of core grounding current under partial discharge excitation.
Figure 25 reveals that the core grounding current also exhibits high-frequency oscillating current pulses at these edges during PD events, which is typical of PD currents.
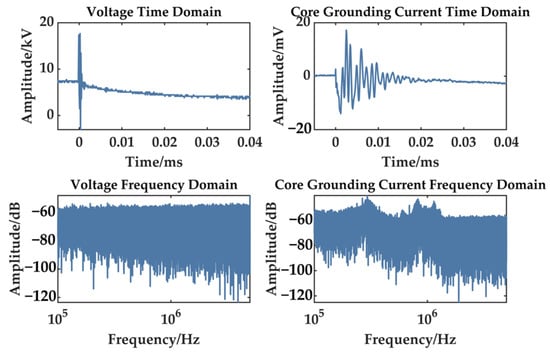
Figure 25.
Partial discharge pulse signal in the core grounding current.
5. Discussion
The results of this study hold significant implications for the field of transformer condition assessment. They demonstrate that the core grounding current response is highly sensitive to different types of electrical stresses, making it a valuable indicator for evaluating transformer health. The high-frequency oscillatory decay characteristics observed under impulse voltages provide a means to analyze the transient behavior of transformers during overvoltage events. The direct correlation between the wave front oscillation intensity, attenuation rate, and voltage waveform parameters offers a new perspective for understanding the impact of impulse voltages on transformer insulation. The identification of nonlinear resonance features in the transfer function further enriches the knowledge of transformer dynamic responses.
In harmonic conditions, the strict linear correspondence between the current spectrum and excitation voltages, along with the absence of resonance below 1 kHz, suggests that the core grounding current can be effectively used to monitor power quality and harmonic distortion in transformers. This is particularly important as harmonics become more prevalent in modern power systems with the increasing use of nonlinear loads. Notably, established thresholds for core grounding currents remain limited. While China’s GB/T 24846-2018 [27] permits currents exceeding 100 mA in high-voltage three-phase transformers during operation, it specifies no unified alarm threshold, relying primarily on anomaly analysis.
The response characteristics of core grounding current under partial discharge excitation highlight the potential for using this current as a diagnostic tool for early-stage insulation defects. The characteristic high-frequency oscillations induced by partial discharges can be utilized to detect and locate insulation weaknesses before they escalate into severe failures. This proactive approach to maintenance can significantly enhance the reliability and lifespan of transformers.
The innovation of this study lies in the development of a wideband circuit model that captures the complex interactions between electrical stresses and core grounding current. This model, validated through experiments, provides a more accurate and comprehensive understanding of transformer behavior than traditional single-parameter detection methods. It establishes a solid foundation for the optimization of detection technologies and the development of advanced transformer condition monitoring systems.
This research also underscores the necessity for a multi-dimensional analysis of core grounding current. By constructing a mapping model between electrical stress states and current features, this study paves the way for a more holistic assessment of transformer conditions. This approach not only improves the accuracy of fault detection but also enables the early identification of potential issues, allowing for timely maintenance and reducing the risk of unexpected failures.
Future research will expand this study by conducting experiments on a wider range of transformers, incorporating various operational conditions, including different power ratings, transformer configurations, and environmental factors. Additionally, we will integrate more precise accuracy metrics and criteria to evaluate the performance of the proposed diagnostic methods. This will involve assessing the system’s sensitivity to various electrical stresses and quantifying the reliability of grounding current-based diagnostic signals across different fault scenarios. Future work will also explore non-uniform geometries (e.g., clamping elements) to improve model fidelity. Validation across a broader spectrum of transformer ratings and configurations is essential, particularly given the current limitation to 250 kVA units. Parameter sensitivity analysis and nonlinear modeling (such as core saturation effects under extreme conditions) will be prioritized. Furthermore, long-term aging mechanisms, including insulation and thermal degradation, which progressively alter dielectric properties, should be incorporated to enhance the diagnostic system’s applicability. Subsequent research will focus on early fault detection using grounding current signatures. In summary, this study marks a significant advancement in the field, providing both theoretical insights and practical guidance for the reliable operation and maintenance of power transformers.
Author Contributions
L.W.: jointly defined research aims, conducted laboratory tests on grounding sensors, drafted the full manuscript, and is accountable for experimental methods/results; H.D.: formulated research goals, designed test protocols, critically revised the manuscript for technical accuracy, and is accountable for technical integrity; D.C.: developed the signal-processing code, performed statistical analysis, validated software reproducibility, and is accountable for the software content; Y.L.: assisted field data collection, curated/metadata datasets, provided scientific edits, and is accountable for data integrity; P.D.: validated experiments via repetition, conducted uncertainty analysis, revised the results/discussion, and is accountable for validation; X.D.: procured sensors/hardware, maintained experimental datasets, co-performed measurements, and is accountable for resources/raw data; Z.S.: performed finite-element simulations, prepared technical figures, revised simulation sections, and is accountable for modeling accuracy; X.H.: co-conceived the study, developed the analytical framework, coordinated the team, finalized the manuscript, and is accountable as the corresponding author. All authors have read and agreed to the published version of the manuscript.
Funding
This research received no external funding.
Data Availability Statement
The original contributions presented in the study are included in the article; further inquiries can be directed at the corresponding author.
Acknowledgments
The authors would like to thank all those who provided valuable comments and suggestions to improve the quality of this study.
Conflicts of Interest
Author Mr. Li Wang, Mr. Dong Cai, Mr. Yu Liu, Mr. Peng Du, Mr. Xiankang Dai and Mr. Zhenghai Sha were employed by the company Yangtze Three Gorges Group Jiangsu Energy Investment Co., Ltd., The remaining authors declare that the research was conducted in the absence of any commercial or financial relationships that could be construed as a potential conflict of interest.
References
- Bian, J.Y.; Qiu, G.Y. The Application of Power Electronic Transformer in Distribution Power System. In Proceedings of the 4th International Conference on Information Technology and Management Innovation, Shenzhen, China, 19–20 September 2015; Yang, S.F., Ed.; Atlantis Press: Paris, France, 2015; Volume 28, pp. 304–310. [Google Scholar]
- Wang, X.; He, A.; Li, Z.; Jiao, Z.; Lu, N. Reinforcement Learning Based Early Classification Framework for Power Transformer Differential Protection. Expert Syst. Appl. 2025, 292, 128632. [Google Scholar] [CrossRef]
- Zhou, X.; Tian, T.; Wu, P.; Luo, Y.; Bai, J.; He, N.; Li, X. Analytical Modeling and Calculation of Core Grounding Current in Converter Transformer. Front. Energy Res. 2023, 10, 1074501. [Google Scholar] [CrossRef]
- Bai, H.; Chen, D.; Zhao, G.; Zhou, X.; Xin, Z.; Zheng, X. Grounding Current Mechanism of Converter Transformer Core and Clamp. In Proceedings of the 2024 IEEE 21st Biennial Conference on Electromagnetic Field Computation CEFC, Jeju, Republic of Korea, 2–5 June 2024; IEEE: New York, NY, USA, 2024. [Google Scholar]
- Wu, H.; Song, Y.; Liu, Y.; Ji, G. Heterogeneous Integration of Transformer Windings-Fundamentals, Principles, and Implementations. IEEE Trans. Power Electron. 2025, 40, 11246–11256. [Google Scholar] [CrossRef]
- Raman, S.J.; Mukherjee, P.; Panda, S.K. Modelling Transformer Core with Appropriate Boundary Conditions for Partial Discharge Studies. In Proceedings of the 2019 IEEE Electrical Insulation Conference (EIC), Calgary, AB, Canada, 16–19 June 2019; IEEE: New York, NY, USA, 2019; pp. 156–159. [Google Scholar]
- Bhuyan, K.; Chatterjee, S. Electric Stresses on Transformer Winding Insulation under Standard and Non-Standard Impulse Voltages. Electr. Power Syst. Res. 2015, 123, 40–47. [Google Scholar] [CrossRef]
- Hui, M.; Liu, C.-X. Effect of Power Frequency Excitation Character on Ferroresonance in Neutral-Grounded System. Chin. Phys. B 2010, 19, 120509. [Google Scholar] [CrossRef]
- Zhou, L.; Jiang, J.; Liu, H.; Gao, S.; Li, W.; Zhang, C. Homogenisation Model for Calculating Multi-Point Grounding Current of Transformer Core. IET Electr. Power Appl. 2019, 13, 243–250. [Google Scholar] [CrossRef]
- van der Walt, F.; Doorsamy, W. Analytical Condition Monitoring System for Liquid-Immersed Transformers. In Proceedings of the 2018 IEEE PES/IAS Powerafrica Conference, Cape Town, South Africa, 28–29 June 2018; IEEE: New York, NY, USA, 2018; pp. 396–401. [Google Scholar]
- Jin, L.; Kim, D.; Abu-Siada, A.; Kumar, S. Oil-Immersed Power Transformer Condition Monitoring Methodologies: A Review. Energies 2022, 15, 3379. [Google Scholar] [CrossRef]
- McGrail, T.; Borcham, P.; Sutton, S.; Rowbottom, M.; Beardsall, J.; Prout, P.; Rhoads, S. Practical Condition Monitoring: Experiences with Large Power Transformers. In Proceedings of the 2022 9th International Conference on Condition Monitoring and Diagnosis (CMD), Kitakyushu, Japan, 13–18 November 2022; IEEE: New York, NY, USA; 2022; pp. 351–354. [Google Scholar]
- de Faria, H.; Spir Costa, J.G.; Mejia Olivas, J.L. A Review of Monitoring Methods for Predictive Maintenance of Electric Power Transformers Based on Dissolved Gas Analysis. Renew. Sustain. Energy Rev. 2015, 46, 201–209. [Google Scholar] [CrossRef]
- Sun, Y.; Ma, H. Research Progress on Oil-Immersed Transformer Mechanical Condition Identification Based on Vibration Signals. Renew. Sustain. Energy Rev. 2024, 196, 114327. [Google Scholar] [CrossRef]
- Balabantaraya, R.; Sahoo, A.K.; Sahoo, P.K.; Abir, C.M.; Panda, M.K. A Novel Infrared Thermography Image Analysis for Transformer Condition Monitoring. e-Prime-Adv. Electr. Eng. Electron. Energy 2024, 10, 100758. [Google Scholar] [CrossRef]
- Rostaminia, R.; Saniei, M.; Vakilian, M.; Mortazavi, S.S. Evaluation of Transformer Core Contribution to Partial Discharge Electromagnetic Waves Propagation. Int. J. Electr. Power Energy Syst. 2016, 83, 40–48. [Google Scholar] [CrossRef]
- Barkas, D.A.; Chronis, I.; Psomopoulos, C. Failure Mapping and Critical Measurements for the Operating Condition Assessment of Power Transformers. Energy Rep. 2022, 8, 527–547. [Google Scholar] [CrossRef]
- Dhara, S.; Koley, C.; Chakravorti, S. An Ultrawideband Partial Discharge Sensor for High-Voltage Power Transformers. IEEE Sens. J. 2024, 24, 16261–16269. [Google Scholar] [CrossRef]
- Zhou, X.; Tian, T.; Wu, P.; Luo, Y.; Bai, J.; He, N.; Li, X. Mathematical Modeling and Experimental Research on Grounding Current Calculation of Converter Transformer Core. Meas. Control 2024, 57, 68–76. [Google Scholar] [CrossRef]
- Hettiwatte, S.N.; Crossley, P.A.; Wang, Z.D.; Darwin, A.; Edwards, G. Simulation of a Transformer Winding for Partial Discharge Propagation Studies. In Proceedings of the 2002 IEEE Power Engineering Society Winter Meeting. Conference Proceedings (Cat. No.02CH37309), New York, NY, USA, 27–31 January 2002; Volume 2, pp. 1394–1399. [Google Scholar] [CrossRef]
- Jafari, A.M.; Akbari, A. Partial Discharge Localization in Transformer Windings Using Multi-Conductor Transmission Line Model. Electr. Power Syst. Res. 2008, 78, 1028–1037. [Google Scholar] [CrossRef]
- Zhou, X.; Tian, T.; Wu, P.; Luo, Y.; Bai, J.; He, N.; Li, X.; Chen, D.; Bai, H. Research on Finite Element Simulation of Converter Transformer Core under Multi-Point Grounding Fault. Energy Rep. 2023, 9, 449–457. [Google Scholar] [CrossRef]
- Sun, L.; Xu, M.; Ren, H.; Hu, S.; Feng, G. Multi-Point Grounding Fault Diagnosis and Temperature Field Coupling Analysis of Oil-Immersed Transformer Core Based on Finite Element Simulation. Case Stud. Therm. Eng. 2024, 55, 104108. [Google Scholar] [CrossRef]
- Yang, W.; Pan, Y.; Qiu, Z.; Zhai, G. Electromagnetic Transient Model and Field-Circuit Coupling Numerical Calculation of Sen Transformer Based on Finite-Element Method. Electr. Power Syst. Res. 2023, 214, 108941. [Google Scholar] [CrossRef]
- IEC 60060-1:2010; High-Voltage test Techniques—Part 1: General Definitions and Test Requirements. IEC: Geneva, Switzerland, 2010.
- IEC 60270; High-Voltage Test Techniques—Partial Discharge Measurements. IEC: Geneva, Switzerland, 2015.
- GB/T 24846-2018; Preventive Test Standards of 1 000 kV AC Electric Equipments. China Electric Power Press: Beijing, China, 2018.
Disclaimer/Publisher’s Note: The statements, opinions and data contained in all publications are solely those of the individual author(s) and contributor(s) and not of MDPI and/or the editor(s). MDPI and/or the editor(s) disclaim responsibility for any injury to people or property resulting from any ideas, methods, instructions or products referred to in the content. |
© 2025 by the authors. Licensee MDPI, Basel, Switzerland. This article is an open access article distributed under the terms and conditions of the Creative Commons Attribution (CC BY) license (https://creativecommons.org/licenses/by/4.0/).