Abstract
In the context of advancing sustainable energy solutions, this paper provides a detailed modelling study of the process integration of biomass gasification to produce syngas and subsequent methanation for methane production. The process is assumed to take place in a circulating fluidised bed and three adiabatic fixed-bed reactors. To address the low H2/CO ratio of syngas produced from biomass gasification using air, three pre-methanation scenarios were evaluated: water gas shift reaction (scenario 1), H2 addition through Power-to-Gas (scenario 2), and splitting syngas into pure H2 and CO and then recombining them in a 3:1 ratio (scenario 3). The findings reveal that each scenario presents a unique balance of efficiency, decarbonisation potential, and technological integration. Scenario 2 achieves the highest overall efficiency at 62%, highlighting the importance of integrating renewable electricity into the methane industry. Scenario 1, which incorporates WGS and CO2 capture, offers an environmentally friendly solution with an overall efficiency of 59%. In contrast, Scenario 3, involving H2/CO separation and recombination, achieves only 44.4% efficiency due to energy losses during separation, despite its operational simplicity. Methane yields were highest in Scenario 1, while Scenario 2 offers the most significant potential for integration with decarbonised power systems. The model was validated using published data and feedstock characteristics from experimental work and industrial projects. The results showed good agreement and supported the accuracy of the simulation in reflecting realistic biomass processing for methane production.
1. Introduction
Biomass is a renewable, carbon-neutral, and sustainable feedstock. Gasification is one way of converting biomass into a gaseous product, consisting mainly of hydrogen and carbon monoxide, that can then be processed in various ways, e.g., by extracting the hydrogen or serving as a feedstock for the chemical industry. Methanation is one way of converting syngas into a versatile product that is compatible with the current energy system and infrastructure, effectively replacing natural gas with green methane. Methane is a carbon-neutral fuel, as the CO2 released during biomass conversion is balanced by CO2 absorbed during biomass growth [1]. Moreover, the process integration of gasification and methanation can achieve high overall process efficiencies by harnessing the heat from the highly exothermic reactions, such as methanation, for internal energy recovery.
Biomass, such as wood processing waste, agricultural waste, or dedicated energy crops, is gasified at high temperatures (800 to 1000 °C) in the presence of a gasifying agent (air, steam, oxygen, or a mixture of the two) to produce syngas [2]. Raw syngas typically contains H2, CO, CH4, CO2, H2O, and trace amounts of impurities (e.g., tars, NH3, H2S, and particulates). Before methanation, the syngas must be cleaned and conditioned to remove the impurities. Failure to remove these impurities can deactivate downstream catalysts and lead to operational issues in the process [3].
The H2/CO ratio is crucial in the methanation process, affecting the reaction rate, selectivity, and methane yield [4]. The optimal H2/CO ratio depends on the specific feed gas composition, operating conditions, temperature, pressure, and catalyst composition [5]. Generally, a ratio of 3:1 is ideal for syngas methanation to achieve high methane yields and selectivity while avoiding the formation of unwanted byproducts such as CO2 and higher molecular weight hydrocarbons (tars) [6]. The H2/CO ratio in the gasifier off-gas is typically between 0.3 and 2, lower than the optimal ratio for methanation. The water gas shift (WGS) reaction converts CO into H2 to increase hydrogen and reduce CO. Alternatively, external H2 from electrolysis (Power-to-Gas) can be added to adjust the H2/CO ratio [7].
Nickel-based catalytic methanation is an exothermic chemical process that converts carbon oxides (CO2 or CO) and hydrogen into methane at high temperatures (>250 °C) [1]. The methanation process typically occurs in a series of adiabatic fixed-bed reactors with inter-stage cooling [8,9] or fluidised bed reactors [10,11] to manage the exothermic heat generated during the reaction. Efficient cooling is crucial to avoid hot spots that can deactivate the catalyst [4].
The combination of biomass gasification and methanation research and development efforts to generate methane has been successfully implemented in real-world projects such as the BioSNG Demonstration Plant [12], operated by ABSL, a UK technology company. The plant converts household waste into high-quality methane using gasification and methanation technology, significantly reducing the environmental impact of waste. The process involves converting waste into syngas, which is then further processed into methane and carbon dioxide. The methane produced is injected into the national grid, while the carbon dioxide is captured, stored, or used as a feedstock for other chemical production processes. Additionally, the GAYA platform [13], a semi-industrial demonstration project launched in 2010 by ENGIE, operates in Saint–Fons, France, with a 600 kW gasifier, producing up to 30 to 40 Nm3/h of methane from biomass and solid recovered fuel (SRF). The process employs a dual fluidised bed (DFB) gasifier for efficient fuel conversion, followed by a fixed-bed reactor system for methanation, where the cleaned syngas is converted into synthetic methane using a nickel-based catalyst.
Aspen Plus version 11 is a powerful process simulation software widely used to model various chemical processes. This software enables detailed analysis and optimisation of processes, providing insight into the thermochemical conversion of feedstock into valuable products. To the authors’ knowledge, no other publications have been found that simulate the integration of methane production, including biomass gasification, syngas cleaning, and methanation, while considering the H2/CO adjustment step. While there are studies focused on individual components of this process, such as biomass gasification and methanation of syngas, the holistic integration of these steps into a single simulation appears to be unique. Numerous studies have modelled biomass gasification using Aspen Plus, exploring different biomass types and operating conditions to optimise syngas production, following thermodynamic [14,15] and kinetic [14,15,16,17] approaches. Other research has focused on modelling the methanation process of syngas derived from biomass gasification, with investigations into reactor design, operating conditions, and catalyst type to maximise methane yield [5,18,19,20,21].
This study utilises Aspen Plus simulation software to model an integrated route of methane production, including biomass gasification, syngas cleaning, Power-to-Gas (PtG), and methanation. It will explore three approaches to adjusting the H2/CO ratio. The first approach, the Water Gas Shift (WGS) reaction, involves increasing the H2 content by introducing steam to the syngas stream, which shifts the equilibrium and raises the H2/CO ratio. The second approach consists of adding external hydrogen through Solid Oxide Electrolysis (SOE), utilising renewable electricity to produce hydrogen sustainably. The third approach involves separating the syngas into pure hydrogen and carbon monoxide and combining them in the desired ratio. Each of the three scenarios offers a unique pathway to adjust the H2/CO ratio in the syngas, resulting in more effective methanation. Modelling these scenarios in Aspen Plus provides valuable insight into their performance and can assist engineers in selecting the most suitable approach for methane production from biomass gasification.
2. Materials and Methods
2.1. Feedstock Characteristics
In this study, wood pellets were selected as a representative and widely available feedstock due to their well-characterised composition and frequent use in industrial gasification systems. However, the developed simulation model is designed to apply to various lignocellulosic biomass types by adjusting the input parameters based on the ultimate and proximate analyses of the selected feedstock.
The biomass is fed as single streams of its elementary compositions: C, H2, O2, N2, S and H2O (moisture), taken from the feedstock ultimate and proximate analysis, as shown in Table 1 [22]. The ultimate and proximate analyses of the biomass feedstock were expressed on a dry basis, excluding moisture, to ensure consistent input data for the gasification model. Equation (1) represents the balanced chemical equation of biomass oxidation and allows the estimation of the amount of air for the gasification process.

Table 1.
Wood ultimate and proximate chemical analysis (dry basis) [22].
2.2. Aspen Plus Biomass Gasification Model
A 15 MWth wood gasification process was modelled using an auto-thermal circulating fluidised bed gasifier (CFB), in which biomass partial combustion provides the heat required in the gasifier. Gasification occurs at 800 °C and atmospheric pressure, using CaO (dolomite) as a catalyst and a combination of air and steam as a gasifying agent. Gasification is a process that occurs in sequential non-boundary steps of drying, pyrolysis, and char gasification. This model omits the pyrolysis step due to the number of possible intermediate products formed. Thus, the gasification process is modelled in two distinct regions: (a) dense and (b) diluted; in the dense region, heterogeneous reactions take place, while in the diluted region, homogeneous reactions take place.
Figure 1 illustrates the biomass gasification flowsheet in Aspen Plus, wherein four streams (wood, air, steam, and catalyst) are introduced into a fluidised bed gasifier. The present model employs the Peng–Robinson–Boston–Mathias (PR–BM) equation of state, which is well-suited for high-temperature gas-phase applications [23]. The equivalence ratio (ER) for this study is set to be 0.25, and the air stream is heated by cooling the exiting syngas in the heat exchanger ‘HE’. Two in-series plug-flow reactors (PFR) model the gasifier, representing dense and dilute zones. In the first reactor, biomass enters a high-temperature zone and is converted into volatiles and char. Supplying sub-stoichiometric oxygen, the carbon is partially oxidised into CO and CO2, and hydrogen is oxidised into water. The exothermic nature of oxidation reactions provides heat that can be effectively harnessed in the reduction zone. The reactions in both the dense and dilute zones are based on Wang and Kinoshita’s model [24], Appendix A.1. The CO2 is captured in the form of calcium carbonate (CaCO3) [25].
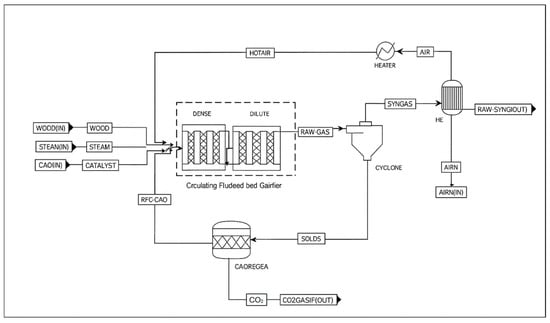
Figure 1.
Wood gasification process flowsheet in Aspen Plus.
The ‘RAW-GAS’ stream includes syngas, byproducts, CaO and CaCO3. A cyclone is necessary to separate the gases from solids in a circulating fluidised bed, where ‘SOLIDS’ are circulated back to the gasifier to optimise the yield, while gases ‘SYNGAS’ are sent to downstream cleaning units. CaO can be regenerated by heating beyond its decomposition temperature in a separate reactor, ‘CAOREGA’. This endothermic reaction occurs at approximately 700 °C [26].
2.3. Aspen Plus Syngas Cleaning and Conditioning Model
The syngas exiting the gasifier was subjected to several cleaning steps, including cooling, particulate matter filtration, tar cracking, and acid gas removal. The steps used for syngas cleaning are summarised in Table 2. The syngas cleaning Aspen Plus process flowsheet is shown in Figure 2.
Table 2.
Cleaning techniques and unit operations used for cleaning syngas in Aspen Plus.
Table 2.
Cleaning techniques and unit operations used for cleaning syngas in Aspen Plus.
| Impurities in Raw Syngas | Cleaning Technique | Unit Operation in Aspen Plus, Figure 3 |
|---|---|---|
| Particulate matter | Cyclone | Cyclone |
| Tars -In situ tar cracking -Downstream tar removal | CaO catalyst Physical scrubber | ‘CFB’: RPlug reactors ‘TAR-ABS’: Five-stage low-temperature absorber using palm oil as an absorbent [27] |
| NH3 | Chemical scrubber | ‘AMMONIA’: Rstoick reactor [28] |
| Acid gases (CO2 and H2S) | Physical scrubber | A Selexol (DEPG) scrubber for acid gas removal, i.e., H2S and CO2. The Selexol process consists of two columns: absorber ‘ACIDGASR’ and stripper ‘STRIPPER’ [29]. |

Figure 2.
Aspen Plus flowsheet of syngas cleaning in four steps.

Figure 3.
Scenario 1: WGS reaction for H2/CO ratio adjustment.
2.4. H2/CO Ratio Adjustment
To optimise the H2/CO ratio for methanation, this paper discusses three scenarios for adjusting the H2/CO ratio, all with distinct operational implications.
Scenario 1 (S1): WGS involves adding water (steam) to the syngas stream, which causes a shift in the equilibrium of the reaction [30,31]. Adequate supply and proper management of steam are crucial for this reaction. Following the WGS reaction, CO2 is removed to purify the syngas for methanation. Figure 3 shows the Aspen Plus flowsheet adjustment to attain the desired H2/CO ratio by adding an equilibrium reactor REquil, operating at 270 °C and 1 bar. The CO2 is then removed from the product stream before entering the methanation unit in a separation unit, ‘CO2-SEP’.
Scenario 2 (S2): Adding external H2 [32] involves producing H2 through water electrolysis using a solid oxide electrolyser (SOE). This H2 is mixed with the syngas to achieve the desired H2/CO ratio. The water electrolysis requires electricity from renewable sources to make the process sustainable. The SOE model flowsheet developed in Aspen Plus is illustrated in Figure 4. In the beginning, hydrogen gas obtained from the cathode channel ‘RECYCLE’ is mixed with steam from the steam generator ‘STEAM-IN’ to prevent nickel oxidation on the cathode. This mixture then passes through the CATHODE, a RStoic reactor that mimics the electrochemical reaction of the steam under specific reaction conditions of 781.3 °C and 1 bar. The utilisation factor of this reaction is given as a design specification to determine the thermal energy required for the reaction. The product leaving the cathode channel is divided at the ‘SPLIT’ block by varying the splitting ratio to achieve the desired steam-to-hydrogen ratio of 0.1 to 0.9. The cathode product contains hydrogen and oxygen and is separated using an ‘ELECT’ block that simulates the electrolyte. Oxygen is permeated into the anode channel while the sweep gas ‘SWEEP-IN’ is introduced to displace the oxygen. The sweep gas also serves as a heating medium to transport heat between the cathode and the anode. Before leaving the anode, the sweep gas is heated to the cathode temperature at the ‘HEATX1’ block and combined with oxygen at the ‘ANODE’ mixer block. The solid oxide electrolysis (SOE) model was adapted based on the approaches described in [33,34,35].
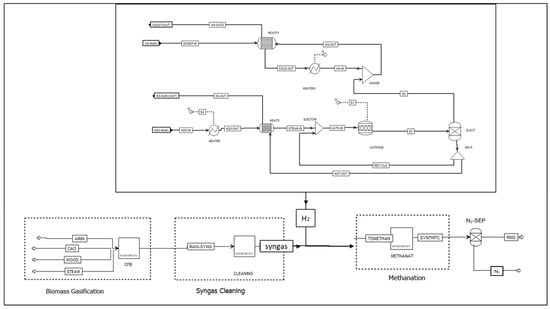
Figure 4.
Scenario 2: Aspen Plus flowsheet for adding H2 from the solid oxide electrolyser for adjusting the H2/CO ratio.
Scenario 3 (S3): Splitting and recombining syngas entails splitting the syngas into pure H2 and pure CO using technologies such as membrane separation or pressure swing adsorption (PSA). The Aspen Plus flowsheet for scenario 3 is shown in Figure 5. The CO stream is divided into two streams. Part of the CO stream is combined with H2 to achieve the desired H2/CO ratio, and the remainder is available for heat recovery through combustion. A design specification tool in Aspen Plus controls the splitting fraction in the CO-SEP unit to ensure that the H2/CO ratio in the stream entering the methanation unit is 3:1.
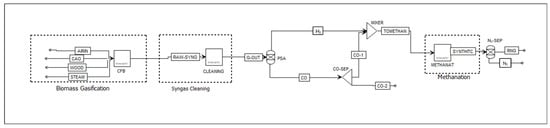
Figure 5.
Scenario 3: Aspen Plus flowsheet of H2-CO separation for H2/CO ratio adjustment.
2.5. Aspen Plus Syngas Methanation Model
The methanation of syngas was modelled using a series of three RPlug reactors in Aspen Plus, with nickel-based catalysts to facilitate CO and CO2 conversion into CH4, based on the ADAM I and ADAM II demonstration projects [8,9]. The reactors were set to operate at 250 °C and 27 bar. Intercooling between reactors was achieved using heat exchanger blocks to manage the exothermic reaction. The property method used was the Redlich–Kwong–Soave equation of state with modified Huron–Vidal mixing rules, RKSMHV2. The reaction kinetics rate models for syngas methanation over a commercial catalyst Ni/Al2O3 (50 wt% Ni/Al2O3, BET surface area = 183 m2/g) in a fixed-bed reactor were taken from the Zhang [21] model, Appendix A.2.
Figure 6 illustrates the methanation process flowsheet in Aspen Plus. The methanation process was modelled as a series of three fixed-bed reactors, R1, R2, and R3, loaded with spherical nickel catalyst particles to promote syngas methanation. Due to the highly exothermic nature of methanation reactions, adiabatic systems undergo a significant increase in temperature. This leads to a quick achievement of thermodynamic equilibrium, but with only limited conversion. To manage the temperature within the system, heat exchangers, ‘COOLER1’ and ‘COOLER2’, were installed after R1 and R2, respectively, to reduce the gas temperature by heating steam. Recycling the gas product after the first reactor dilutes the inlet gas, significantly improves conversion, and aids temperature management with the recycle ratio being controlled within an appropriate range of 0.5 to 3 [36]. A design specification tool in Aspen Plus was set by varying the splitting fraction so that the recycle ratio equals 0.5.
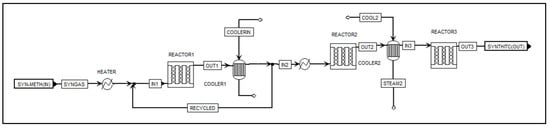
Figure 6.
Aspen Plus flowsheet for the multistage adiabatic methanation reactor.
2.6. Process Evaluation
The performance of a gasification process was assessed based on syngas heating value (HHV) [37], Carbon conversion efficiency (CCE), and cold gas efficiency (CGE) [1]. The performance of the methanation process was typically evaluated based on the extent of CO conversion and the yield of CH4 produced per unit of reactants [38]. CO conversion is the ratio between CO feeding and consumption rates (Equation (2)); CH4 yield was determined by the net amount of CH4 produced from a reaction per CO feed flow rate (Equation (3)).
The overall efficiency of a given scenario can be understood as the combined efficiency of the individual processes. Each process’s efficiency was calculated by comparing the energy content of the output to the energy content of the input. This is often expressed in terms of the fuel HHV. In Aspen Plus, a calculator block was configured to calculate the energy flow and efficiency of the process in each scenario.
For model validation, the gasification and methanation models were individually compared with published experimental data from the literature [39] and an industrial project [8], respectively. Adjustments were made to the model feedstock composition and operating conditions to ensure that the model accurately represented the setup used in the literature.
3. Results
3.1. Sensitivity Analysis
Figure 7 illustrates a sensitivity analysis of the effect of increasing air flow (ER) on syngas composition. With an increase in air flow, the concentration of H2 in the syngas decreases due to the dilution by the surplus nitrogen provided by the increased air flow. At lower ER, the concentration of CO initially increases (ER = 0.2 to 0.25) due to incomplete combustion of the feedstock and decreases as an increase in ER promotes the oxidation of CO to CO2. Methane concentration is generally low due to the reaction conditions. Increasing airflow may slightly reduce methane concentrations due to increased oxidation reactions, but the effect is usually minimal (2% reduction). Nitrogen concentrations in syngas primarily depend on the nitrogen content of the feedstock and the amount of air or oxygen introduced into the gasifier. Increasing airflow leads to higher N2 content and therefore decreases the desired product (e.g., H2, CO, CH4) concentration, lowering the gas heating value.
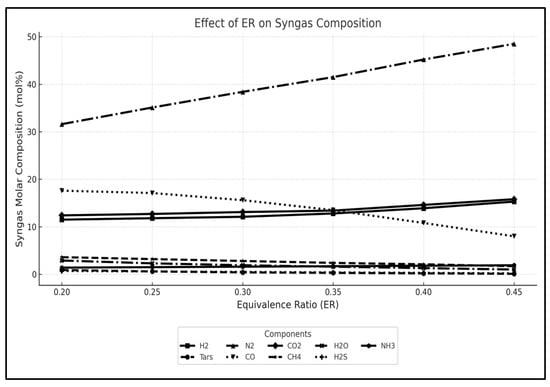
Figure 7.
Sensitivity analysis showing the effect of varying equivalence ratio (ER) on syngas molar composition. While the base case uses ER = 0.25, additional values were tested to assess trends in H2, CO, CH4, and other species.
Figure 8 presents the effect of increasing operating pressure on the molar composition of produced methane and other components in the methanation reactor. The CH4 content increases steadily with pressure, exceeding 40 mol% at 38 bar, indicating enhanced methanation efficiency. The concentrations of H2 and CO decline as they are progressively consumed in the exothermic methanation reactions. In contrast, CO2 remains relatively stable across the pressure range, while H2O exhibits a slight increase, consistent with its formation as a reaction byproduct. This behaviour is consistent with the thermodynamic principle that elevated pressures favour the formation of products in reactions involving a reduction in gas volume [40], as is the case for methanation reactions.
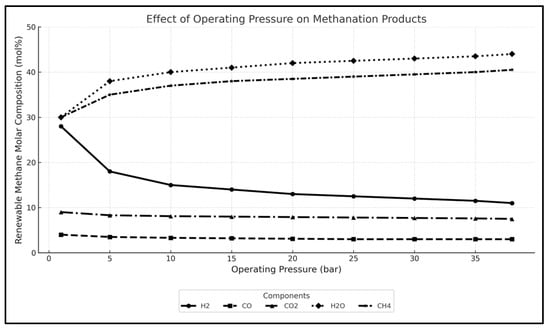
Figure 8.
The effect of increasing pressure in the methanation reactor on the methane composition.
3.2. Syngas Cleaning
In Figure 9, the syngas composition before and after cleaning is compared. The cleaned gas has a higher concentration of H2 and CO, while there is less CO2 and fewer traces of byproducts.
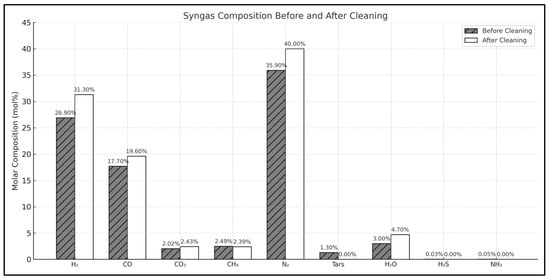
Figure 9.
Syngas mole composition before and after the syngas cleaning processes.
3.3. System Level Efficiency
Table 3 displays the efficiency of each process in every pathway, with the efficiency of the biomass gasification and cleaning processes remaining constant across all paths. Accordingly, all reported efficiencies in this study should be interpreted as idealised process-level chemical energy efficiencies under steady-state and loss-minimised assumptions, consistent with values reported in advanced pilot and demonstration-scale systems.
Table 3.
Scenarios of H2/CO syngas molar stoichiometric ratio adjustment calculated efficiency.
In this study, sensible heat effects are not considered in the calculation of chemical energy transformation. Only the chemical energy content, defined by the HHV of each process stream, is used to evaluate energy balances and efficiencies.
In S1, the efficiency of CO2 capture post-WGS is typically 80% [41]. The efficiency calculation in S2 considers two energy inputs: syngas energy content and H2 produced via SOE. The efficiency of PSA in S3 for H2 and CO separation is usually evaluated in terms of recovery and purity. The H2 and CO recovery rates are assumed to be 99.9% and 70%, respectively [42].
Integrating biomass gasification and Power-to-Gas technology through solid oxide electrolysis presents significant energy losses in the electrolysis stage. Additionally, each process involves energy conversions, such as converting chemical energy from biomass to heat and electricity, which inherently results in losses. Table 4 summarises the pros and cons of each scenario.
Table 4.
Summary of the advantages and disadvantages of the scenarios for H2/CO ratio adjustment to achieve the desired stoichiometric feed rate for methanation.
The WGS reaction is a well-established technology with proven industrial applications. S1 includes CO2 capture, which is advantageous for meeting environmental regulations and producing cleaner methane. Considering renewable integration and technological innovation, S2 has the potential for high-purity hydrogen production and integration with renewable energy. Still, its low efficiency and high costs currently make it less attractive. S3 offers flexibility but at the expense of efficiency and complexity. Therefore, the choice between these scenarios is not arbitrary; it depends on the system’s specific goals: efficiency, environmental impact, or simplicity.
Heat recovery is a notable feature of the process, particularly the steam generation from the excess heat produced during methanation. This steam is then integrated into other system stages, such as providing heat for biomass gasification or covering some of the SOE thermal requirements. This integration improves the system’s thermal efficiency and significantly reduces the need for external energy. While this study focuses on integrating biomass gasification, Power-to-Gas technology, and methanation for methane production, future work will need to explore heat recovery within the cycle further. Optimising this heat exchange will further improve the overall efficiency of the three scenarios.
3.4. Model Validation
The Aspen Plus model for biomass gasification was validated by comparing it with experimental data from relevant literature [39]. To ensure the model accurately represented the experimental setup, the feedstock composition and operating conditions (such as temperature, pressure, and gasifying agent) were carefully adjusted to match those used in the experiment. While the predicted values for major syngas components (H2, CO, CO2, CH4) show relatively low relative errors (all under 5.5%) as shown in Table 5, the carbon conversion and cold gas efficiency (CGE) exhibit noticeably larger deviations—10.1% and 7.2%, respectively. These two metrics are highly sensitive to several factors that may not be fully captured in the Aspen Plus model, particularly when relying on equilibrium or simplified kinetic assumptions. The carbon conversion and cold gas efficiency exhibit noticeably larger deviations—10.1% and 7.2%, respectively. These two metrics are highly sensitive to several factors that may not be fully captured in the Aspen Plus model, particularly when relying on equilibrium or simplified kinetic assumptions. These deviations are probably due to limitations in the model’s treatment of char conversion, tar formation, and heat losses. Aspen Plus underestimates carbon conversion by not fully capturing solid-phase reaction kinetics or post-gasification char burnout. Similarly, the overestimation of CGE can result from idealised thermal conditions and an overprediction of combustible gases. Incorporating detailed reaction kinetics and accounting for system-level heat losses could improve model accuracy.
Table 5.
Gasification of the Aspen Plus model validation compared with experimental results from [39].
Table 6 shows a comparison of Aspen Plus methanation results and the research project, ADAM I [8]. The feedstock for ADAM I was obtained from natural gas reforming and was used in the Aspen Plus methanation model with similar conditions and feedstock composition. In the table, the relative error is shown in brackets. The comparison demonstrates strong agreement and accuracy of the model, with a relatively minor deviation of 5% or less from the project results. The difference could be due to an inaccurate kinetic model used in Aspen, leading to different reactant consumption rates.
Table 6.
Methanation Aspen Plus model results validation compared with industrial project ADAM I [8]. The numbers in brackets state the relative discrepancy with the ADAM I experiment (shown in the lower part of the table) at the different process stages. Rin1, Rout1, Rout2, and Rout3 from Figure 3.
4. Conclusions
This study modelled the integrated process for methane production using Aspen Plus, from biomass gasification, via syngas cleaning up to final methanation. The H2/CO ratio is crucial for the integration and adjustment through three distinct scenarios, which were analysed. Biomass gasification offers a carbon-neutral way to produce syngas, as no additional carbon dioxide is released to the atmosphere. Methanation converts the syngas into methane, a versatile drop-in fuel that can be fed into the existing natural gas infrastructure. The integrated approach chosen enhances overall system efficiency, reduces greenhouse gas emissions, and provides a reliable pathway for transitioning to methane. The results of this study underscore the potential of integrated systems to balance efficiency and decarbonisation goals. Each scenario, with its unique advantages, offers a flexible and adaptable approach depending on the desired system characteristics. The model was validated using experimental data and feedstock from laboratory experiments and industrial projects. The comparison of the model’s results with real-world data showed good agreement, supporting the accuracy of the simulation in reflecting realistic biomass gasification and methanation processes. The model provides a flexible simulation framework for evaluating different process configurations and integration strategies for methane production. By adjusting feedstock properties and process parameters, the model can support techno-economic and environmental assessments, guide early-stage design decisions, and assist in scenario planning for industrial implementation. Future work will focus on extending the model to include a wider range of biomass feedstocks, such as agricultural residues and forest waste. This will enable a comparative assessment of feedstock influence on process performance and syngas composition. In addition, the integration of renewable electricity sources will be explored in greater detail, particularly under dynamic operating conditions, to evaluate the flexibility of electrolysis-assisted scenarios. The model will also be expanded to include techno-economic (TEA) and life cycle assessments (LCA) to quantify the cost and environmental impacts of each scenario. Incorporating detailed kinetic models for gasification and methanation, as well as investigating scale-up and system-level integration, will further improve the model’s applicability to industrial implementation.
Author Contributions
Conceptualization, S.A.Z., R.S.-W. and M.O.; methodology, S.A.Z.; software, S.A.Z. and K.M.; validation, S.A.Z.; formal analysis, S.A.Z.; investigation, S.A.Z.; resources, S.A.Z.; data curation, S.A.Z.; writing—original draft preparation, S.A.Z.; writing—review and editing, S.A.Z.; visualization, S.A.Z.; supervision, R.S.-W. and M.O.; project administration, R.S.-W. and M.O.; funding acquisition, R.S.-W. All authors have read and agreed to the published version of the manuscript.
Funding
This research was funded by Sultan Qaboos University grant number 2024/2021. And the APC was funded by University of Birmingham.
Data Availability Statement
Data is contained within the article. The raw data supporting the conclusions of this article will be made available by the authors on request.
Acknowledgments
The authors sincerely thank Sultan Qaboos University for financially supporting this project. Additionally, they thank Amirpiran Amiri, Senior Lecturer in Chemical Engineering at Aston University, for his invaluable guidance and support throughout this research.
Conflicts of Interest
The authors declare no conflict of interest.
Appendix A
Appendix A.1. Biomass Gasification Chemical Reactions Kinetics
Table A1.
Main reactions occurring in the dense and dilute zones from the model developed by Wang and Kinoshita [24].
Table A1.
Main reactions occurring in the dense and dilute zones from the model developed by Wang and Kinoshita [24].
| Reaction | Reaction Kinetics | Reference | ||
|---|---|---|---|---|
| Dense Zone | Partial oxidation | [43,44,45] | ||
Mc = 12.01 kg/kmol and g/m3 | ||||
| Hydrogen oxidation | [] [O2] | |||
| Dilute Zone | Heterogeneous Water-gas | [H2O] [H2][CO] | [46,47,48] | |
| Boudouard | [CO2] [CO]2 | |||
| Methanation | [H2] []0.5 | |||
| Water-gas shift | [CO]0.5[ [H2]0.5 [] | [49,50] | ||
| Methane-reforming | [] [] [CO] [H2]2 | [46,50,51] |
Table A1: Gasification reaction rate kinetics of the dense and dilute zones from the model developed in [24].
The following reactions take place in the gasification bed as undesired side reactions (Equations (A1) and (A2)) as well as CO2 absorption by dolomite, Equation (A3).
Appendix A.2. Methanation Chemical Reaction Kinetics
For this study, the reaction kinetics rate models for syngas methanation over a commercial catalyst Ni/Al2O3 (50 wt% Ni/Al2O3, BET surface area = 183 m2/g) in a fixed-bed reactor are taken from Zhang’s [21] model.
- CO methanation reaction
- Water-Gas-Shift reaction
- CO2 methanation reaction [52]
Table A2.
Kinetic constants for the CO methanation model [21,52].
Table A2.
Kinetic constants for the CO methanation model [21,52].
| CO Methanation Reaction | WGS Reaction | Steam Reforming Reaction |
|---|---|---|
| 7.83 | 1.25 | |
| 8.23 (bar) | ||
| 6.12 (bar) | ||
| 6.65 (bar) | () | |
| 1.77 (bar) | () | |
The equilibrium constant of the water gas shift reaction (KWGS) is calculated as a function of temperature according to Elnashaie and Elshishini [53].
And the equilibrium constant of the Steam reforming reaction [52] is calculated as follows:
References
- de Jong, W.; van Ommen, J.R. Biomass as a Sustainable Energy Source for the Future: Fundamentals of Conversion Processes; John Wiley & Sons, Inc.: Hoboken, NJ, USA, 2015. [Google Scholar]
- Sofer, S.S.; Zaborsky, O.R. Biomass Conversion Processes for Energy and Fuels, 2nd ed.; Plenum Press: New York, NY, USA, 1981. [Google Scholar] [CrossRef][Green Version]
- Kohl, A.L.; Nielsen, R. Gas Purification, 5th ed.; Gulf Pub: Houston, TL, USA, 1997. [Google Scholar][Green Version]
- Mills, G.A.; Steffgen, F.W. Catalytic Methanation. Sci. Eng. 2006, 8, 159–210. [Google Scholar] [CrossRef]
- Hayes, R.E.; Thomas, W.J.; Hayes, K.E. A study of the nickel-catalysed methanation reaction. J. Catal. 1985, 92, 312–326. [Google Scholar] [CrossRef]
- Twigg, M.V. Catalyst Handbook, 2nd ed.; Manson Publishing: London, UK, 1996. [Google Scholar][Green Version]
- Rönsch, S.; Schneider, J.; Matthischke, S.; Schlüter, M.; Götz, M.; Lefebvre, J.; Prabhakaran, P.; Bajohr, S. Review on methanation—From fundamentals to current projects. Fuel 2016, 166, 276–296. [Google Scholar] [CrossRef]
- Hohlein, M.B.; Niessen, H.; Range, J.; Schiebahn, H.J.R.; Vorwerk, M. Methane from synthesis gas and operation of high-temperature methanation. Nucl. Eng. Des. 1984, 78, 241–250. [Google Scholar] [CrossRef]
- Kernforschungsanlage Jülich GmbH. Projekt Nukleare Fernenergie: Zusammenfassender Bericht zum Projekt Nukleare Fernenergie (NFE); Internal Report; Kernforschungsanlage Jülich GmbH: Jülich, Germany, 1985. [Google Scholar][Green Version]
- Kopyscinski, J. Production of Synthetic Natural Gas in a Fluidised Bed Reactor; Eidgenössische Technische Hochschule ETH Zürich: Zürich, Switzerland, 2010. [Google Scholar] [CrossRef]
- Seemann, M. Methanation of Biosyngas in a Fluidized Bed Reactor. 2006. Available online: https://research.chalmers.se/en/publication/125548 (accessed on 6 April 2023).
- Swindon Plant. Advanced Biofuel Solutions Ltd. Available online: https://absl.tech/swindon-plant (accessed on 20 June 2024).
- ENGIE Produces Renewable Gas from Solid Non-Recyclable Waste Gasification|Bioenergy International. Bioenergy International [Online]. 2024. Available online: https://bioenergyinternational.com/engie-produces-renewable-gas-from-solid-non-recyclable-waste-gasification/ (accessed on 7 October 2024).
- Begum, S.; Rasul, M.G.; Akbar, D.; Ramzan, N. Performance Analysis of an Integrated Fixed Bed Gasifier Model for Different Biomass Feedstocks. Energies 2013, 6, 6508–6524. [Google Scholar] [CrossRef]
- Suwatthikul, A.; Limprachaya, S.; Kittisupakorn, P.; Mujtaba, I.M. Simulation of Steam Gasification in a Fluidised Bed Reactor with Energy Self-Sufficient Condition. Energies 2017, 10, 314. [Google Scholar] [CrossRef]
- Damartzis, T.; Michailos, S.; Zabaniotou, A. Energetic assessment of a combined heat and power integrated biomass gasification–internal combustion engine system by using Aspen Plus®. Fuel Process. Technol. 2012, 95, 37–44. [Google Scholar] [CrossRef]
- Eikeland, M.S.; Thapa, R.K.; Halvorsen, B.M. Aspen Plus Simulation of Biomass Gasification with known Reaction Kinetic. In Proceedings of the 56th Conference on Simulation and Modelling (SIMS 56), Linköping, Sweden, 7–9 October 2015; Volume 119, pp. 149–156. [Google Scholar] [CrossRef]
- Höhlein, B.; Menzer, R.; Range, J. High temperature methanation in the long-distance nuclear energy transport system. Appl. Catal. 1981, 1, 125–139. [Google Scholar] [CrossRef]
- Topsøe, H. From Solid Fuels to Substitute Natural Gas (SNG) Using TREMPTM Topsøe Recycle Energy-Efficient Methanation Process; Haldor Topsøe: Lyngby, Denmark, 2009. [Google Scholar]
- Bouallou, C. Modeling and simulation of CO methanation process for renewable electricity storage. Energy 2014, 75, 81–88. [Google Scholar] [CrossRef]
- Zhang, J.; Fatah, N.; Capela, S.; Kara, Y.; Guerrini, O.; Khodakov, A.Y. Kinetic investigation of carbon monoxide hydrogenation under realistic conditions of methanation of biomass derived syngas. Fuel 2013, 111, 845–854. [Google Scholar] [CrossRef]
- Santos, J.; Hornung, A.; Ouadi, M. Thermochemical Conversion of Biomass and Upgrading of Bio-Products to Produce Fuels and Chemicals. In Catalysis for Clean Energy and Environmental Sustainability: Biomass Conversion and Green Chemistry; Pant, A.E., Gupta, K.K., Eds.; Springer International Publishing: Cham, Switzerland, 2021; Volume 1, pp. 1–47. [Google Scholar] [CrossRef]
- Sreejith, C.C.; Muraleedharan, C.; Arun, P. Performance prediction of steam gasification of wood using an Aspen Plus thermodynamic equilibrium model. Int. J. Sustain. Energy 2014, 33, 416–434. [Google Scholar] [CrossRef]
- Wang, Y.; Kinoshita, C.M. Kinetic model of biomass gasification. Sol. Energy 1993, 51, 19–25. [Google Scholar] [CrossRef]
- Simell, P.; Kurkela, E.; Ståhlberg, P.; Hepola, J. Catalytic hot gas cleaning of gasification gas. Catal. Today 1996, 27, 55–62. [Google Scholar] [CrossRef]
- Florin, N.H.; Harris, A.T. Hydrogen production from biomass coupled with carbon dioxide capture: The implications of thermodynamic equilibrium. Int. J. Hydrogen Energy 2007, 32, 4119–4134. [Google Scholar] [CrossRef]
- Giakoumis, E.G. Analysis of 22 vegetable oils’ physico-chemical properties and fatty acid composition on a statistical basis, and correlation with the degree of unsaturation. Renew. Energy 2018, 126, 403–419. [Google Scholar] [CrossRef]
- Ammonia in Syngas. [Online]. Available online: https://www.envitechinc.com/air-pollution-control-innovations/bid/20554/Ammonia-in-Syngas (accessed on 6 December 2022).
- Fahim, M.A.; Alsahhaf, T.A.; Elkilani, A. Acid Gas Processing and Mercaptans Removal. In Fundamentals of Petroleum Refining, 1st ed.; Elsevier: Oxford, UK, 2010; Volume 15, pp. 377–402. [Google Scholar] [CrossRef]
- Aziz, M.; Darmawan, A.; Juangsa, F.B. Hydrogen production from biomasses and wastes: A technological review. Int. J. Hydrogen Energy 2021, 46, 33756–33781. [Google Scholar] [CrossRef]
- Sazali, N. Emerging technologies by hydrogen: A review. Int. J. Hydrogen Energy 2020, 45, 18753–18771. [Google Scholar] [CrossRef]
- Wulf, C.; Linssen, J.; Zapp, P. Power-to-Gas—Concepts, Demonstration, and Prospects. In Hydrogen Supply Chain: Design, Deployment and Operation; Academic Press: London, UK, 2018; Volume 9, pp. 309–345. [Google Scholar] [CrossRef]
- Cai, Q.; Luna-Ortiz, E.; Adjiman, C.S.; Brandon, N.P. The Effects of Operating Conditions on the Performance of a Solid Oxide Steam Electrolyser: A Model-Based Study. Fuel Cells 2010, 10, 1114–1128. [Google Scholar] [CrossRef]
- Defner, B.; Krenn, U.-P.H. Modeling and Simulation of System Concepts for High-Temperature, Solid Oxide Electrolysis. Master’s Thesis, University of Graz, Graz, Austria, 2016. [Google Scholar]
- Ni, M.; Leung, M.K.; Leung, D.Y. Parametric study of solid oxide fuel cell performance. Energy Convers. Manag. 2007, 48, 1525–1535. [Google Scholar] [CrossRef]
- Gao, J.; Wang, Y.; Ping, Y.; Hu, D.; Xu, G.; Gu, F.; Su, F. A thermodynamic analysis of methanation reactions of carbon oxides for the production of synthetic natural gas. RSC Adv. 2012, 2, 2358. [Google Scholar] [CrossRef]
- Wan, C.; Yu, F.; Zhang, Y.; Li, Q.; Wooten, J. Material Balance and Energy Balance Analysis for Syngas Generation by a Pilot-Plant Scale Downdraft Gasifier. J. Biobased Mater. Bioenergy 2013, 7, 690–695. [Google Scholar] [CrossRef]
- Chein, R.-Y.; Yu, C.-T.; Wang, C.-C. Numerical simulation on the effect of operating conditions and syngas compositions for synthetic natural gas production via methanation reaction. Fuel 2016, 185, 394–409. [Google Scholar] [CrossRef]
- Wu, J.; Xu, B.; Lou, Z.; Zhou, X. Performance analysis of a biomass circulating fluidized bed gasifier. Biomass-Bioenergy 1992, 3, 105–110. [Google Scholar] [CrossRef]
- Jens Rostrup-Nielsen, L.; Christiansen, J. Concepts in Syngas Manufacture; Imperial College Press: London, UK, 2011. [Google Scholar]
- Samipour, S.; Manshadi, M.D.; Setoodeh, P. CO2 Removal from Biogas and Syngas. In Advances in Carbon Capture; Elsevier: Amsterdam, The Netherlands, 2020; pp. 455–477. [Google Scholar] [CrossRef]
- You, Y.-W.; Lee, D.-G.; Yoon, K.-Y.; Moon, D.-K.; Kim, S.M.; Lee, C.-H. H2 PSA purifier for CO removal from hydrogen mixtures. Int. J. Hydrogen Energy 2012, 37, 18175–18186. [Google Scholar] [CrossRef]
- Petersen, I.; Werther, J. Experimental investigation and modeling of gasification of sewage sludge in the circulating fluidized bed. Chem. Eng. Process.-Process. Intensif. 2005, 44, 717–736. [Google Scholar] [CrossRef]
- Westbrook, C.K.; Dryer, F.L. Chemical kinetic modeling of hydrocarbon combustion. Prog. Energy Combust. Sci. 1984, 10, 1–57. [Google Scholar] [CrossRef]
- Champion, W.M.; Cooper, C.D.; Mackie, K.R.; Cairney, P. Development of a chemical kinetic model for a biosolids fluidized-bed gasifier and the effects of operating parameters on syngas quality. J. Air Waste Manag. Assoc. 2013, 64, 160–174. [Google Scholar] [CrossRef]
- Syamlal, M.; Bissett, L.A. METC Gasifier Advanced Simulation (MGAS) Model; Technical Report No. DOE/MC/24146–3117; U.S. Department of Energy, Morgantown Energy Technology Center: Morgantown, WV, USA, 1992.
- Solli, K.-A.; Thapa, R.K.; Moldestad, B.M.E. Screening of Kinetic Rate Equations for Gasification Simulation Models. In Proceedings of the 9th EUROSIM 2016 & SIMS 2016, Oulu, Finland, 12–16 September 2016. [Google Scholar] [CrossRef]
- de Souza-Santos, M. Comprehensive modelling and simulation of fluidized bed boilers and gasifiers. Fuel 1989, 68, 1507–1521. [Google Scholar] [CrossRef]
- Snider, D.M.; Clark, S.M.; O’ROurke, P.J. Eulerian–Lagrangian method for three-dimensional thermal reacting flow with application to coal gasifiers. Chem. Eng. Sci. 2011, 66, 1285–1295. [Google Scholar] [CrossRef]
- Bustamante, F.; Enick, R.M.; Cugini, A.; Killmeyer, R.P.; Howard, B.H.; Rothenberger, K.S.; Ciocco, M.V.; Morreale, B.D.; Chattopadhyay, S.; Shi, S. High-temperature kinetics of the homogeneous reverse water–gas shift reaction. AIChE J. 2004, 50, 1028–1041. [Google Scholar] [CrossRef]
- Gómez-Barea, A.; Leckner, B. Modeling of biomass gasification in fluidized bed. Prog. Energy Combust. Sci. 2010, 36, 444–509. [Google Scholar] [CrossRef]
- Xu, J.; Froment, G.F. Methane steam reforming, methanation and water-gas shift: I. Intrinsic kinetics. AIChE J. 1989, 35, 88–96. [Google Scholar] [CrossRef]
- Elnashaie, S.S.E.H.; Elshishini, S.S. Modelling, Simulation, and Optimization of Industrial Fixed Bed Catalytic Reactors; Gordon and Breach Science: London, UK, 1993. [Google Scholar]
Disclaimer/Publisher’s Note: The statements, opinions and data contained in all publications are solely those of the individual author(s) and contributor(s) and not of MDPI and/or the editor(s). MDPI and/or the editor(s) disclaim responsibility for any injury to people or property resulting from any ideas, methods, instructions or products referred to in the content. |
© 2025 by the authors. Licensee MDPI, Basel, Switzerland. This article is an open access article distributed under the terms and conditions of the Creative Commons Attribution (CC BY) license (https://creativecommons.org/licenses/by/4.0/).