Communication

Multi-Level Coordination-Level Evaluation Study of Source-Grid-Load-Storage Based on AHP-Entropy Weighting

1
China Yangtze Power Co., Ltd., Yichang 443000, China
2
School of Power and Mechanical Engineering, Wuhan University, Wuhan 430000, China
*
Author to whom correspondence should be addressed.
Energies 2025, 18(16), 4321; https://doi.org/10.3390/en18164321
Submission received: 10 June 2025 / Revised: 26 July 2025 / Accepted: 12 August 2025 / Published: 14 August 2025

Abstract

With the development of the power system, the ability to present a comprehensive and reasonable evaluation of its coordination level has become important for the collaborative optimization of source-grid-load-storage. By identifying uncertain risk factors fully, the present work develops a multi-level coordination-level evaluation of source-grid-load-storage based on AHP-entropy weighting. Building on previous studies, the present work reflects interactive characteristics of the collaborative optimization of source-grid-load-storage. Meanwhile, to determine the indicator weighting more reasonably, AHP-entropy weighting is adopted; this method combines the advantages of subjective AHP weighting and objective entropy weighting. Firstly, the multi-level coordination-level evaluation of source-grid-load-storage is introduced and includes both direct factors and indirect factors. Next, based on AHP-entropy weighting, the indicator weighting of the multi-level coordination-level evaluation is determined. Lastly, a case study is conducted that involves evaluating the coordination levels of the power systems of three regions. Additionally, the effectiveness of the multi-level coordination-level evaluation of source-grid-load-storage is validated.

1. Introduction

With the development of the power system, energy flow and information flow have become deeply integrated and include the operation and regulation of energy sources, power grids, load resources, and energy storage [1,2,3,4,5,6]. To address the growing integration of renewable energy sources and storage systems into distribution networks, Simonic et al. [4] investigated the impact of integrating residential rooftop photovoltaic (PV) systems and battery energy-storage systems (BESSs) into low-voltage (LV) distribution networks. To enhance the fault ride-through (FRT) ability of large-scale wind farms (WFs) while reducing wind-power losses during the fault conditions, Wei et al. [6] proposed an optimal-coordinated post-event voltage-control (OPVC) scheme with energy storage boundary analysis. However, the integration of a number of renewable energy sources into power grids, the participation of flexible load resources, and the application of new energy storage technologies bring a series of uncertain risk factors, which affect the coordination level of the power system significantly [7,8,9,10,11,12]. Therefore, it is important to develop the capacity for a comprehensive coordination-level evaluation of the power system.
Given the aim of collaborative optimization of source-grid-load-storage, the comprehensive coordination-level evaluation of the power system is studied widely [13,14,15,16,17,18,19,20]. To address the effects of large-scale intermittent consumption of renewable energy and power-load instability on power-grid dispatching, Huang et al. [13] developed an optimal dispatching strategy for a multi-source complementary power-generation system that takes source-load uncertainty into account. To cope with the efficient consumption and flexible regulation of resource scarcity that arises due to grid integration of renewable energy sources, Mi et al. [14] presented a scheduling strategy that takes into account the coordinated interaction of source, grid, load, and storage. Considering the complementary nature of flexible carbon-capture systems (FCCS) and hydrogen-storage systems (HSS) in terms of rotating standby and time-shift characteristics, Zhao et al. [15] developed a source-storage–load flexible scheduling strategy. Considering wind and photovoltaic power-generation systems, Wang et al. [16] presented a new method for power-system planning, the collaborative planning of source-grid-load-storage. To improve the system’s ability to absorb large-scale renewable energy such as light and wind, Che et al. [17] developed a source-grid-load-storage power system coordinated expansion-planning model that considers demand-response services. To coordinate and control the complementary interactions between the power side and the flexible load side, Qi et al. [18] established a cooperative operation optimization model for the power system source-grid-load-storage based on Gurobi mathematical programming under the dual carbon objective. Based on large-scale system theory, Liu et al. [19] studied the planning method used for distribution-network structures in the centralized-distributed form and the regional source-load coordination planning method, considering the power-probability balance. To realize the better utilization of energy-storage technology for renewable-energy-dominated power systems, Wang et al. [20] proposed a method for planning energy storage that is adapted to the development of renewable-energy-dominated power systems.
The previous comprehensive coordination-level evaluation of the power system was developed based on economy and technology, making it less likely to reflect the interactive characteristics of collaborative optimization among source, grid, load, and storage. By identifying uncertain risk factors fully, the present work develops a multi-level coordination-level evaluation of source-grid-load-storage, which reflects interactive characteristics of the collaborative optimization of source-grid-load-storage. Meanwhile, in developing the multi-level coordination-level evaluation of source-grid-load-storage, indicator weighting is important. Though a series of methods to determine the indicator weighting are presented, including fuzzy analytic hierarchy process, gray relation analysis, inverse entropy weight method, principal component clustering analysis [21,22,23,24], the results are unlikely to reflect subjective indicator weighting and objective indicator weighting.
To determine the indicator weighting more reasonably, the AHP-entropy weighting is adopted; this method combines advantages of subjective AHP weighting and objective entropy weighting. The present work develops a multi-level coordination-level evaluation of source-grid-load-storage based on AHP-entropy weighting and is organized as follows. Firstly, the multi-level coordination-level evaluation of source-grid-load-storage is introduced, including direct factors and indirect factors. Next, based on AHP-entropy weighting, the indicator weighting of the multi-level coordination-level evaluation is determined. Then, to validate the effectiveness of the multi-level coordination-level evaluation of source-grid-load-storage, a case study is conducted and the coordination level of the power system of three regions is evaluated. Lastly, the present work is concluded.

2. Multi-Level Coordination-Level Evaluation of Source-Grid-Load-Storage

With the increase in the rate of renewable energy penetration, the energy supply is becoming more diversified [25,26]. Zhan et al. [25] proposed a strategy that aggregated multiple distributed resources, such as distributed photovoltaics, energy storage, and controllable load, emphasizing the coordination and optimization between distributed resources. Li et al. [26] established a new day-ahead optimal dispatching model for a power system with a high proportion of photovoltaic energy sources Firstly, the consumption of the renewable energy is promoted by the development of the energy-storage technology. Secondly, in the demand-response strategy, the user is willing to actively adjust the load based on the power output. Therefore, as the structure of the power system becomes more complex, the coordination level of the power system is significantly affected by a series of uncertain risk factors, including direct factors and indirect factors. The direct factors are divided into single-link and link-interaction factors, where single-link factors include power sources, power grids, load resources and energy storage, link interaction includes source-grid interaction, source-load interaction, source-storage interaction, grid-load interaction, grid-storage interaction, and load-storage interaction. The indirect factors are divided into greenhouse gas emission-reduction benefits and disasters. The power sources are responsible for generating electricity, which is transported to the power grids. To keep the balance between power sources and power grids, the amount of electricity generated by power sources should be equal to the amount of electricity absorbed by power grids. However, different types of power sources are used to generate electricity, including traditional thermal-power plants, water-power plants, and renewable wind or solar power plants. The fluctuation of renewable wind and solar power plants is strong and is affected by environment factors. The balance between power sources and power grids affects the coordination level. Meanwhile, the load resources are not constant, but vary significantly with time. To improve the economy and stability of the power system, achieving balance between power grids and load resources is important. If power generation exceeds load demand, wind and solar energy may be wasted, negatively affecting economic efficiency. Conversely, if load demand exceeds power generation, system stability decreases, impairing the power system’s level of coordination.
With the development of energy-storage technology [27,28], the imbalance between power generation and load demand is managed by utilizing the fast charging and discharging capabilities of energy-storage devices. When power generation exceeds load demand, surplus electricity is stored in energy-storage devices; when load demand exceeds power generation, stored electricity is discharged to cover the deficit, thereby improving the power system’s level of coordination. To evaluate the economy and stability of the power system, it is necessary to develop the capacity for comprehensive coordination-level evaluation that reflects the level of coordination among power sources, power grids, load resources, and energy storage. To evaluate the economy and stability of the power system, it is necessary to develop a comprehensive coordination-level evaluation method that accurately reflects the interplay among power sources, power grids, load resources, and energy storage. In conducting a comprehensive coordination-level evaluation of the power system, the effects of single-link, link-interaction and indirect indicators on the power system are evaluated quantitatively, providing guidance for planning and optimization decisions and enhancing the coordination of source-grid-load-storage. To conduct the comprehensive coordination-level evaluation of the power system, firstly, the direct and indirect indicators are defined; secondly, the direct and indirect indicators are calculated quantitatively. Meanwhile, in the development of a multi-level coordination-level evaluation of source-grid-load-storage, indicator weighting is important. To determine the indicator weights more reasonably, the AHP-entropy weighting is adopted; this approach combines advantages of subjective AHP weighting and objective entropy weighting. Lastly, the comprehensive indicator score of the power system is calculated; this score reflects the level of coordination among power sources, power grids, load resources, and energy storage, providing a reference for planning optimization decisions and promoting coordination of source-grid-load-storage. According to the decomposition of direct factors and indirect factors, a multi-level coordination-level evaluation of source-grid-load-storage is developed, as shown in Figure 1.
Firstly, the direct factors are calculated. Single links include power sources, power grids, load resources, and energy storage. Link interactions include source-grid, source-load, source-storage, grid-load, grid-storage, and load-storage interactions. The indicators of power sources are effect of new energy development F source 1 , new energy output fluctuation F source 2 , and new energy utilization efficiency F source 3 ; these are defined as follows:
F source 1 = I source new I source total
F source 2 = E source max E source min E source max
F source 3 = E source actual E source theoretical
where I source new is the benefit of new energy development during the evaluation period, I source total is the total benefit of the power system, E source max is the maximum output of new energy on typical days, E source min is the minimum output of new energy on typical days, E source actual is the actual output of new energy on typical days, E source theoretical is the theoretical output of new energy on typical days. In the present work, the new energy sources mainly include wind and photovoltaic energy, which are characterized by strong randomness. The capacity of wind and photovoltaic constitute the main portion of developed new energy. To calculate the effect of new energy development, we should measure the benefit of new energy development and the total benefit. The benefits of new energy development and the total benefit include economic and environmental benefits. The economic benefit refers to the value of power generated by new energy plants, while the environmental benefit corresponds to the reduction in equivalent carbon emissions, offset by thermal power plants. The indicators for power grids are the ratio of transformer capacity to load F grid 1 , fault self-healing rate F grid 2 , and cost of grid-structure differentiated planning F grid 3 , which are defined as follows:
F grid 1 = E grid total E grid max
F grid 2 = N grid fault N grid total
F grid 3 = C grid line + C grid metal + C grid tower + C grid trans
where E grid total is the total transformer capacity of the maximum load, E grid max is the maximum load, N grid fault is the number of fault self-healing events, N grid total is the total fault number, C grid line is the construction cost of the lines, C grid metal is the cost of the metal and insulators, C grid tower is the construction cost of the towers, and C grid trans is the construction cost of the transformers. The indicators of load resources are demand-response load rate F load 1 , load prediction accuracy F load 2 , and load reliability rate F load 3 , which are defined as follows:
F load 1 = L load res L load total
F load 2 = L load pre L load pos
F load 3 = i = 1 n ω i 1 T i T
where L load res is the demand-response load at the peak load period, L load total is the total load, L load pre is the predicted load that is consistent with the actual load, L load pos is the posterior actual load, n is the number of important loads, ω i is the ratio of important loads to total loads, T i is the fault duration time for important loads, and T is the total time. The energy storage indicators are energy storage unit investment F storage 1 and energy storage unit operation cost F storage 2 , which are defined as follows:
F storage 1 = C kW E ES C ( l , r )
F storage 2 = μ C kW E ES
where C kW is the energy storage cost of 1 kW, E ES is the capacity of the energy-storage system, C ( l , r ) is the coefficient of the investment, l is the service life of the devices, r is the depreciation rate of the devices, and μ 0.5 % is the daily decay rate. Besides the single-link indicators, the link-interaction indicators are calculated, including source-grid interaction, source-load interaction, source-storage interaction, grid-load interaction, grid-storage interaction, and load-storage interaction. The source-grid interaction indicators are new energy abandonment loss rate F source-grid 1 , grid-connected investment rate F source-grid 2 , and grid-connected accident loss rate F source-grid 3 , which are defined as follows:
F source-grid 1 = E abandoned E capacity
F source-grid 2 = C con C total
F source-grid 3 = C accident C accident total
where E abandoned is the abandoned new energy power output, E capacity is the capacity of new energy power output, C con is the investment cost to connect new energy to the grid, C total is the total investment in the grid, C accident is the accident loss caused by the new energy being connected to the grid, and C accident total is the total accident loss of the grid. The source-load interaction indicators include the contribution rate of new energy to power interruptions F source-load 1 , which are defined as follows:
F source-load 1 = E shortage before E shortage after P NE
where E shortage before is the electricity shortage before the new energy is connected to the grid, E shortage after is the electricity shortage after the new energy is connected to the grid, and P NE is the capacity of the new energy. The source-storage interaction indicators are new energy fluctuation F source-storage 1 and transmission-line overload loss F source-storage 2 , which are defined as follows:
F source-storage 1 = E storage E NE
F source-storage 2 = ( C 1 C 0 ) E G h + I S
where E storage is the regulation capacity of the energy-storage system in the low-load periods, E NE is the capacity of the new energy, C 1 is the on-grid electricity price, C 0 is the unit cost of power generation, E G is the reduced electricity generation caused by the generator faults, h is the duration of the power interruption, and I S is the increased cost of device operation and maintenance. The grid-load interaction indicators are fluctuation in load resources F grid-load 1 , load difference rate F grid-load 2 , and cost of a new line F grid-load 3 , which are defined as follows:
F grid-load 1 = L max L min L max
F grid-load 2 = σ T η ave
F grid-load 3 = i Ω L L i n i m 0 N i ϵ
where L max is the maximum load of the grid, L min is the minimum load of the grid, σ T is the standard error of the load rate, η ave is the average of the main transformer, L i is the length of the i-th line, n i is the number of split lines, m 0 is the weight of the line, N i is the number of line circuits, ϵ is the price of the line, and Ω L is the set of transmission lines. The grid-storage interaction indicator is the load-shedding loss F grid-storage 1 , which is defined as follows:
F grid-storage 1 = ( C i C 1 ) E i h + r i E i h + I shedding
where C i is the price of the i-th type electricity, C 1 is the on-grid electricity price, E i is the capacity of load shedding, h is the duration of the power interruption, r i is the power-outage compensation price, and I shedding is the cost of load shedding. The load-storage interaction indicators are load rate F load-storage 1 and contribution rate of energy storage to power interruption F load-storage 2 , which are defined as follows:
F load-storage 1 = L ave L max
F load-storage 2 = E shortage before E shortage after E ES
where L ave is the average load, L max is the maximum load, E shortage before is the electricity shortage before the new energy is connected to the grid, E shortage after is the electricity shortage after the new energy is connected to the grid, and E ES is the capacity of the energy-storage system.
Secondly, the indirect factors are calculated, including greenhouse gas emission-reduction benefits and disaster impacts, which are defined as follows:
F env 1 = Δ Q emi Q emi initial
F env 2 = Δ Q CO 2 Q CO 2 initial
F dis 1 = C resist C sys
F dis 2 = C cut + C repair
where F env 1 is the pollutant reduction, F env 2 is the cost of the CO2 emissions penalty, Q emi initial is the initial pollutant emissions, Δ Q emi is the reduced pollutant emissions, Q CO 2 initial is the initial CO2 emission, Δ Q CO 2 is the reduced CO2 emissions, F dis 1 is the investment in disaster resistance, F dis 2 is the cost imposed by disasters, C resist is the cost of disaster resistance, C sys is the construction cost of the system, C cut is the power-outage compensation cost, C repair is the cost of repairs after disasters.

3. Ahp-Entropy Weighting Method

After calculating the values of various evaluation indicators, we choose to determine the weights of the indicators, which are the quantitative reflections of the importance of the indicators relative to the evaluation objectives [29,30,31,32]. We should point out that use of the reference-point method is unnecessary to determine the weights of the indicators [33,34]. For example, Chintala et al. [33] proposed a new inverse-model-based multiobjective evolutionary algorithm for meter placement in active distribution system state estimation, employing an adaptive reference-point method. However, developing a comprehensive coordination-level evaluation of source-grid-load-storage depends on expert recommendations. To incorporate expert experience, AHP-entropy weighting is adopted, combining the advantages of subjective expert judgment and objective entropy weighting, with indicator weights requiring determination. In developing a comprehensive coordination-level evaluation of source-grid-load-storage, indicator weighting is important; given that need, the analytic hierarchy process (AHP) has been adopted widely.
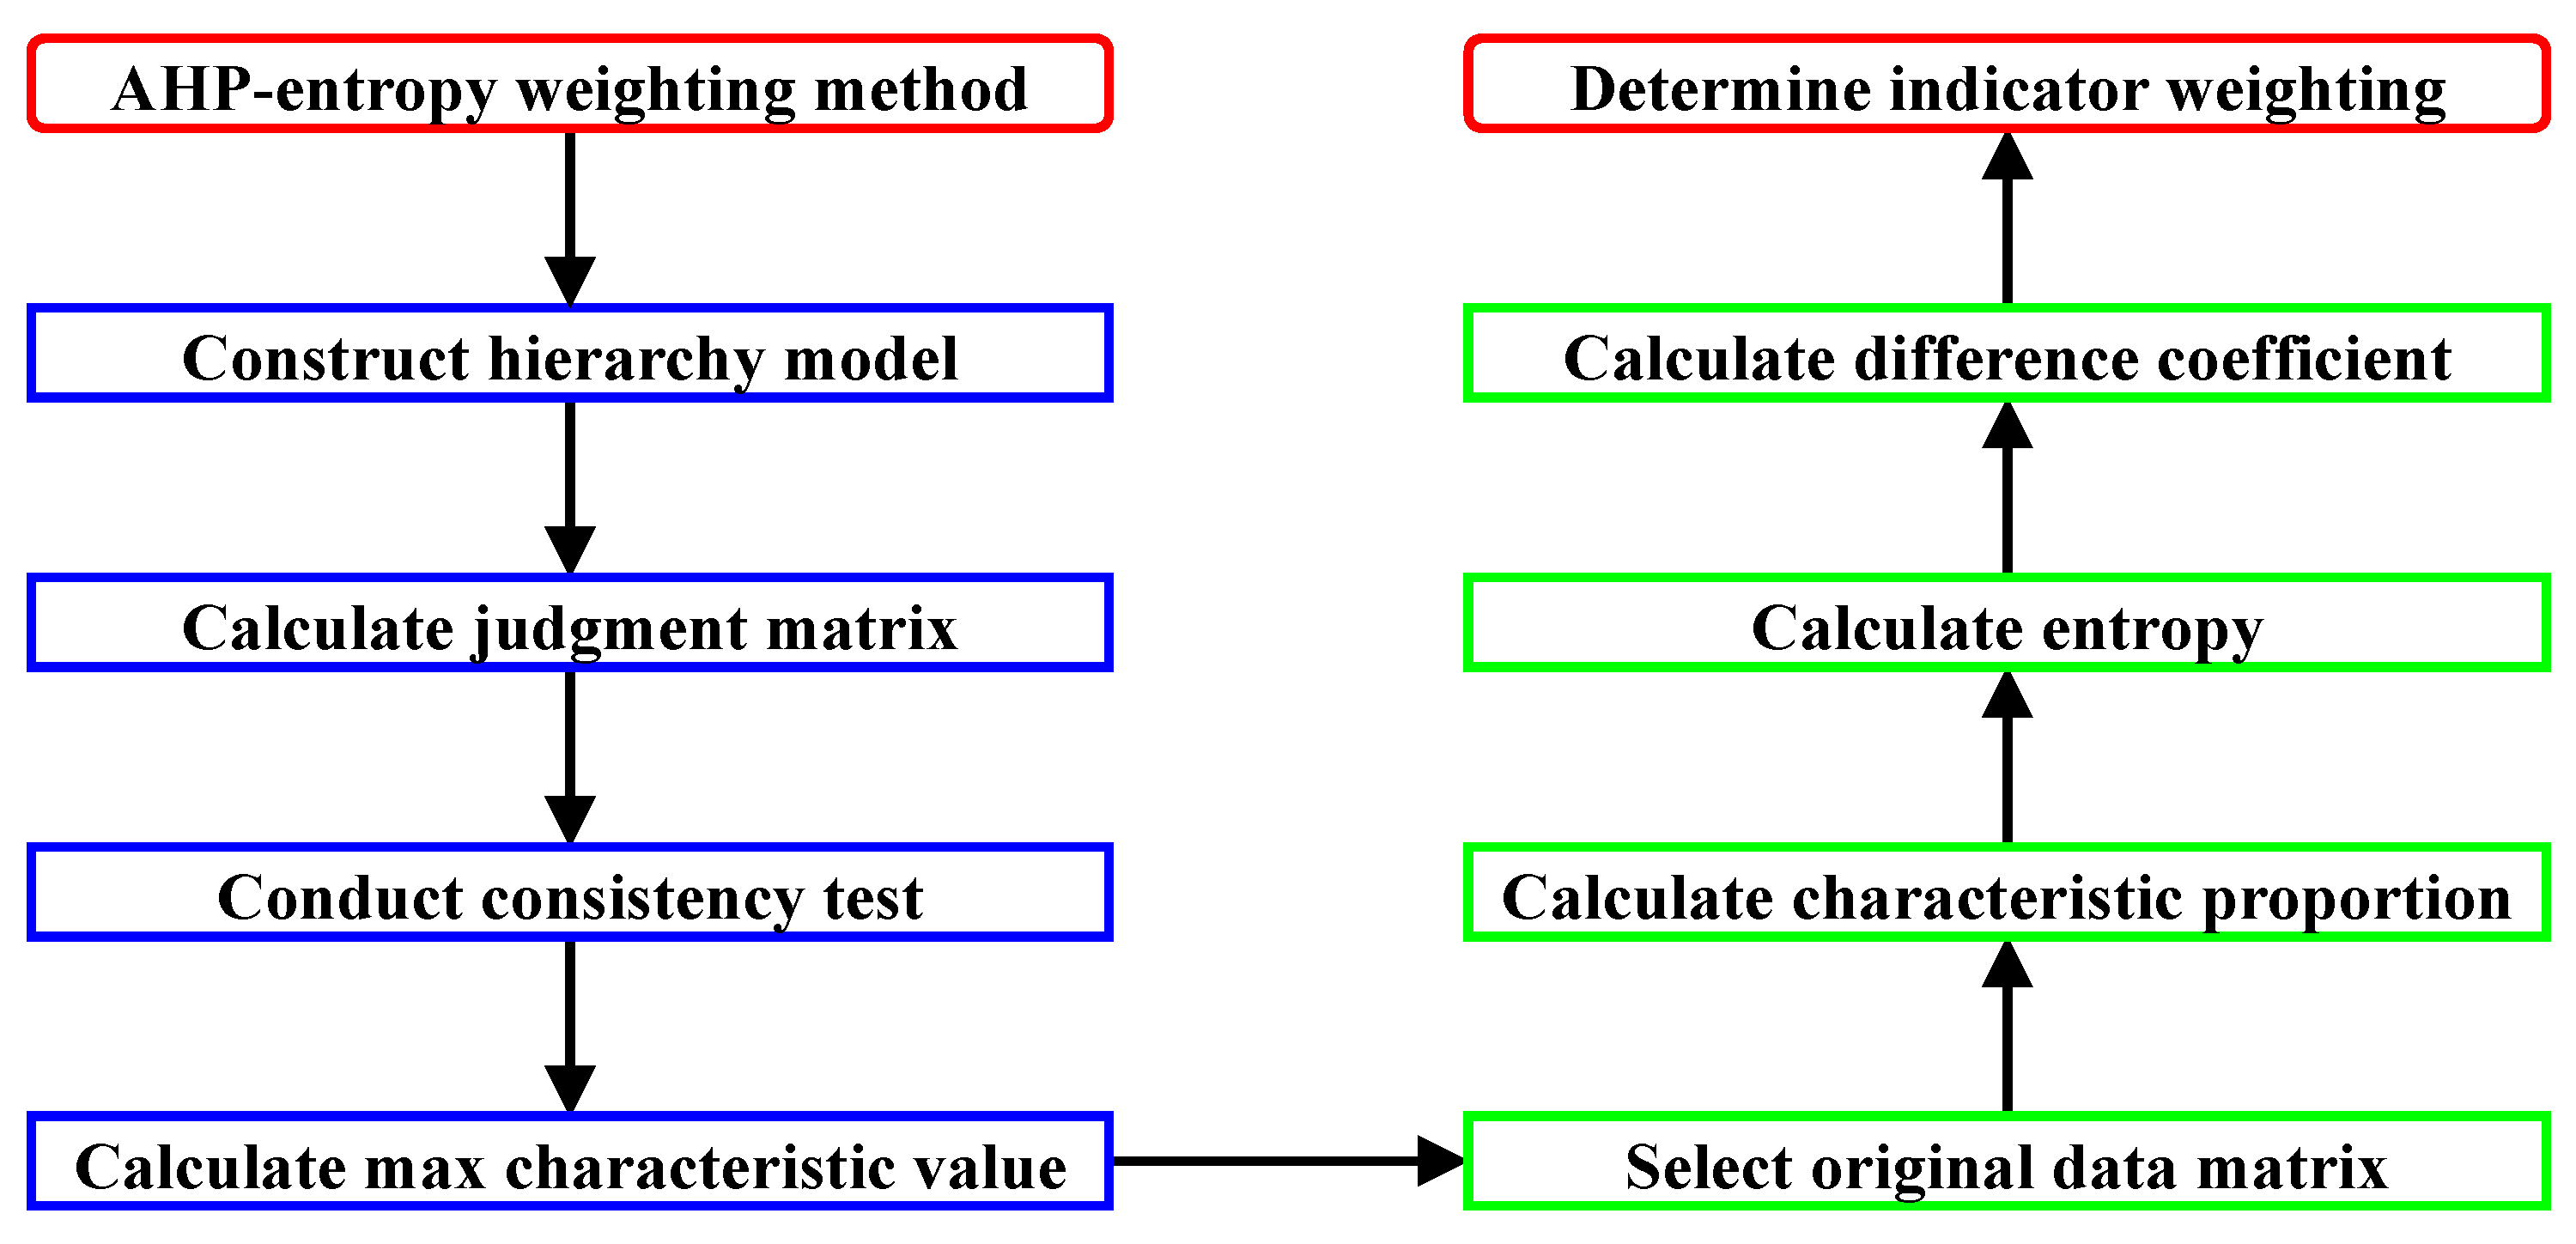
However, the indicator weighting determined by AHP is significantly influenced by the evaluator’s understanding of the evaluation problem, making it a subjective method. To overcome the subjectivity in the indicator weighting of AHP, the entropy weighting method is adopted, as it is more objective. To combine the advantages of AHP and the entropy weighting method, the AHP-entropy weighting method is adopted to determine the indicator weighting to be used in comprehensive coordination-level evaluation. Figure 2 shows the flowchart of the AHP-entropy weighting method. Firstly, construct the hierarchy model of the evaluation object, including the target layer, principle layer, and indicator layer. Secondly, calculate the judgment matrix, where every two indicators are compared. If the importance of the indicator i is equal to that of the indicator j, the value of the judgment matrix r i j = 1 ; if the indicator i is slightly more important than the indicator j, the value of the judgment matrix r i j = 3 ; if the indicator i is clearly important compared to the indicator j, the value of the judgment matrix r i j = 5 ; if the indicator i is very important compared to the indicator j, the value of the judgment matrix r i j = 7 ; if the indicator i is extremely important compared to the indicator j, the value of the judgment matrix r i j = 9 . We should point out that the value of the indicator j relative to that of the indicator i is the reciprocal of the value of the indicator i to the indicator j. These are defined as follows: r j i = 1 / r i j . Thirdly, conduct the consistency test, which is defined as follows:
CR = CI RI
where CR is the consistency ratio. If CR < 0.1 , the consistency of the judgment matrix is accepted; otherwise, the judgment matrix should be corrected.
CI = λ max n n 1
is the consistency index, λ max is the maximum characteristic value of the judgment matrix, n is the order of the judgment matrix, and RI is the average random consistency index, which is listed in Table 1.
After the consistency test, calculate the maximum characteristic root λ max , which is the indicator weighting, defined as follows:
ω i AHP = λ i i = 1 n λ i
where ω i AHP is the indicator weighting of the i-th evaluation indicator determined with AHP. Furthermore, calculate the indicator weighting with the entropy weighting method. First, select the original data matrix, which is defined as follows:
r 11 r 12 r 1 n r 21 r 22 r 2 n r m 1 r m 2 r m n
where r i j is the j-th evaluation value of the i-th evaluation indicator. Secondly, calculate the characteristic proportion of the evaluation object, as follows:
p i j = r i j / i = 1 n r i j
where p i j is the characteristic proportion of the j-th evaluation indicator of the i-th evaluation object. Thirdly, calculate the entropy of the j-th evaluation indicator, which is defined as follows:
e j = k i = 1 n p i j ln p i j
After the calculation of the entropy, the difference coefficient is calculated as follows:
α j = 1 e j
where α j is the difference coefficient of the j-th evaluation indicator. Lastly, the entropy weighting is calculated as follows:
ω j entropy = α j j = 1 n α j
where ω j entropy is the indicator weighting of the j-th evaluation indicator determined with the entropy weighting method. After the indicator weighting is determined with AHP and entropy weighting, respectively, the AHP-entropy weighting method takes advantage of AHP and entropy weighting, where the complementary indicator weighting is
ω j com = ω j AHP ω j entropy j = 1 n ω j AHP ω j entropy

4. Case Study

To validate the multi-level coordination-level evaluation of source-grid-load-storage, the case study is conducted. With the rapid development of artificial intelligence technologies, data centers have become strategic resources in relation to economic and social development. To promote the green and high-quality development of data centers, developing green power direct supply for data centers is a promising approach. The western region of China is vast, with abundant renewable resources, making it a convenient region in which to conduct the coordination-level evaluation of source-grid-load-storage.
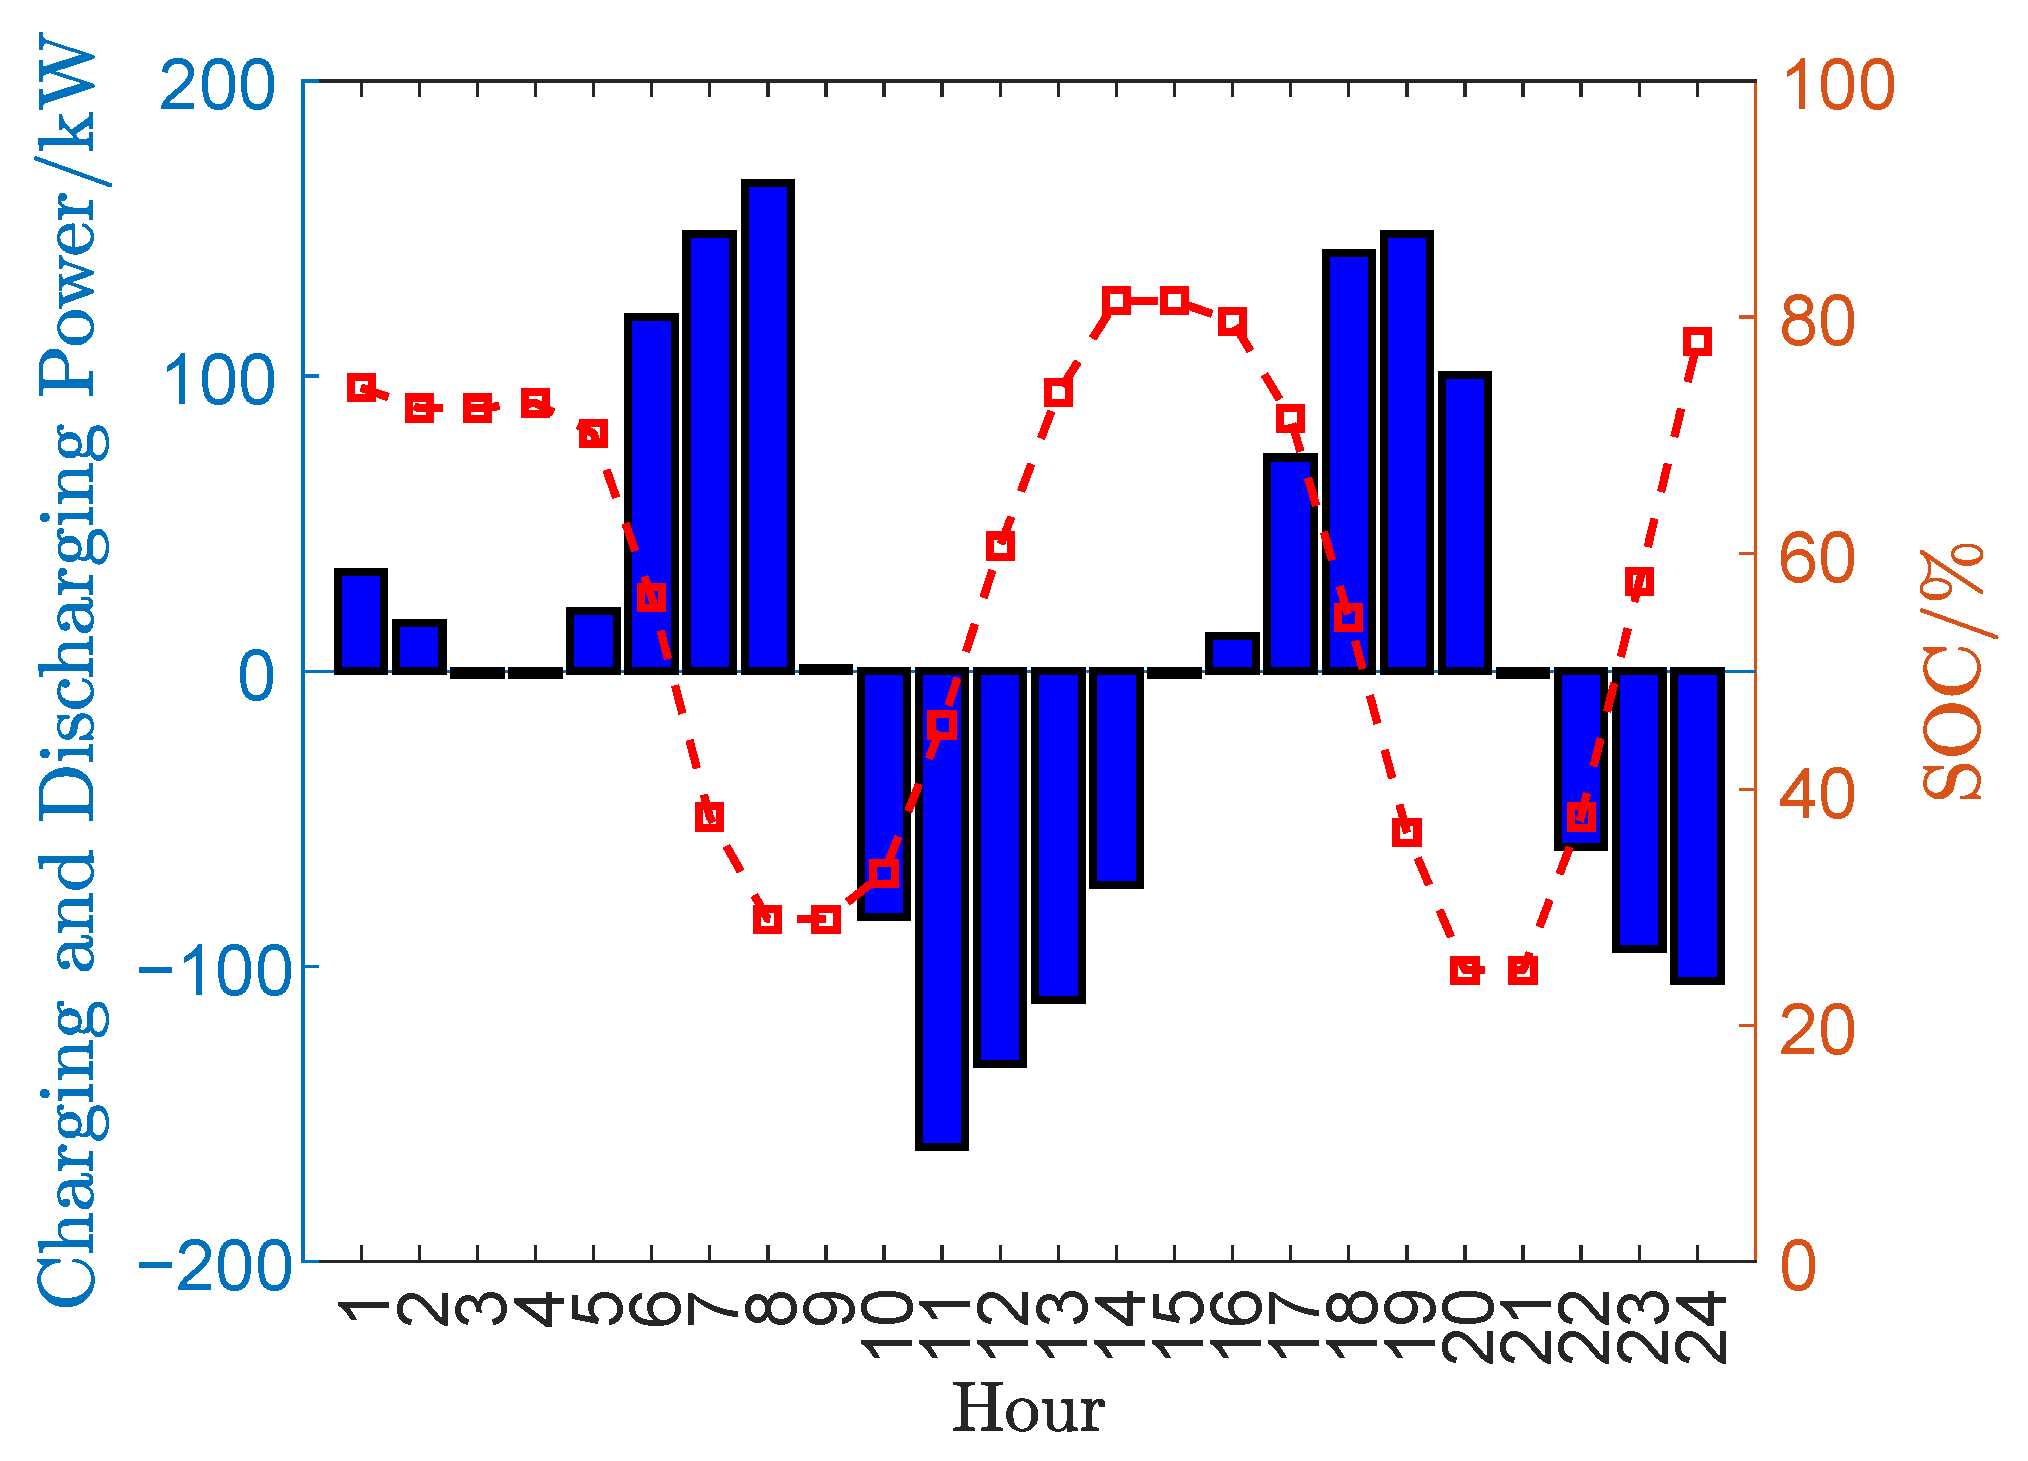
Figure 3 shows wind and photovoltaic output and data-center load on a typical day in Xining City, Qinghai Province. The randomness of wind and photovoltaic output and the fluctuation in the data-center load require balancing; therefore, the fast charging and discharging capabilities of energy-storage devices are useful. As shown in Figure 4, energy-storage devices discharge to compensate for insufficient wind and photovoltaic output during peak load periods; energy-storage devices charge to reduce the amount of abandoned wind and photovoltaic output during low-load periods; where charging power is negative, discharging power is positive.
To conduct the coordination-level evaluation of source-grid-load-storage, three regions were selected. The temperature of region A is low; there, ice-related disasters are prone to occur. The temperature of region B is mild; there, wildfires are the main disaster. The temperature of region C is high; there, the heavy rainfall contributes to landslides. To decrease the subjectivity of the expert input, ten experts from the relevant field are invited to evaluate the coordination level of the three regions, and the values of indicator i relative to indicator j are averaged. Considering the inconsistent dimensions of indicators and the coexistence of cost and benefit indicators in the indicator system, the indicators are nondimensionalized. For cost indicators x j 0 , the lower the value, the lower the coordination level of the evaluation object. For benefit indicators x j + 0 , the higher the value, the higher the coordination level of the evaluation object. Use the min-max method to nondimensionalize the indicators, which are defined as follows:
X j = max ( x j ) x j max ( x j ) min ( x j )
X j + = max ( x j + ) x j + max ( x j + ) min ( x j + )
where X j is the nondimensionalized cost indicators and X j + is the nondimensionalized benefit indicators. The indicator weightings for single links and link interactions among direct factors are listed in Table 2 and Table 3. Based on the data in Table 2 and Table 3, the indicator weightings for both single links and link interactions passed the consistency test.
Adopting the AHP-entropy weighting method, the complementary indicator weightings for these three regions, including single link, link interaction, and indirect indicators, are calculated and listed in Table 4. According to Table 4, the scores of single-link and link-interaction indicators for region C are relatively low, mainly due to the unreasonable location and capacity of new energy grid connections under the district’s planning scheme. The association of the highest indirect indicator score with region B is due to this region’s having the largest proportion of new energy installed capacity, a high environmental indicator score, and relatively lower impact from natural disasters, which results in a high disaster indicator score. Due to climate factors, natural disasters occur more frequently in regions A and C, leading to higher disaster-loss indicators and greater investment in disaster prevention, which affect overall safety and the economy. The final evaluation results, as per the weight calculation of the comprehensive coordination-level quantification value, are listed in Table 5. Overall, under the planning scheme, the system coordination in regions A, B, and C is at a general level, with the schemes for regions A and B being relatively reasonable. The comprehensive index score of region B is the highest, which means that under the planning scheme of region B, the level of coordination and interaction among sources, grids, loads, and storage is relatively the highest due to the low frequency of natural disasters and relatively safe operating environment in the region. The relatively low score of the planning scheme of region C is due to the high weights of indicators, such as fluctuations in new energy output, rate of investment in grid-connected technology, fluctuation in the power-supply load, and the contribution of energy storage to power interruption, which contribute significantly to the overall score. However, these values for region C are relatively small, resulting in a low comprehensive indicator score. To improve the coordination level of the power system, these indicators should be given special attention in planning and corresponding improvement measures should be proposed and implemented. For example, investment in grid-connection technology can reduce the impact of power electronic devices on the grid, lower the impact on power quality, improve the response mechanisms of controllable loads to effectively track new energy output, and add energy-storage devices of appropriate capacity to stabilize the uncertainty of sources and loads.

5. Conclusions

A comprehensive and reasonable coordination-level evaluation of source-grid-load-storage is developed to guide the optimization planning of the new energy power system. The present work integrates various factors that affect the coordination level of the power system and constructs a hierarchical evaluation index system with multiple interactions. Through the establishment of mathematical models of various indicators, a source-grid-load-storage coordination-level evaluation based on AHP-entropy weighting is presented. The coordination-level evaluation is validated by comprehensively assessing the reasonableness of the actual planning schemes from three regions, providing a reference for planning optimization decisions and promoting the coordination level of source-grid-load-storage.

Author Contributions

Conceptualization, F.Z.; methodology, F.Z.; software, P.Z.; validation, P.Z.; formal analysis, L.W.; investigation, L.W.; resources, J.G.; data curation, J.G.; writing—original draft preparation, B.W.; writing—review and editing, B.W. All authors have read and agreed to the published version of the manuscript.

Funding

The present study was supported by the China Yangtze Power Co., Ltd. (No. Z212302041).

Data Availability Statement

The original contributions presented in this study are included in the article. Further inquiries can be directed to the corresponding author.

Conflicts of Interest

Authors Benhong Wang, Ligui Wu, Peng Zhang were employed by the company China Yangtze Power Co., Ltd. The remaining authors declare that the research was conducted in the absence of any commercial or financial relationships that could be construed as a potential conflict of interest.

References

  1. Yang, G.; Qian, A.; Muhammad, Y.; Wang, X. Source-load-storage consistency collaborative optimization control of flexible DC distribution network considering multi-energy complementarity. Int. J. Electr. Power Energy Syst. 2019, 107, 273. [Google Scholar]
  2. Ni, S.; Zhang, L.; Hu, Z. Active distribution network source coordination planning method considering the timing characteristics of power supply and load. Power Syst. Prot. Control 2020, 48, 12. [Google Scholar]
  3. Huang, H.; Li, Y.; Liu, H. Collaborative optimization strategy of source-grid-load-storage considering dynamic time series complementarity of multiple storages. IET Gener. Transm. Distrib. 2023, 17, 4007. [Google Scholar] [CrossRef]
  4. Simonic, E.; Seme, S.; Sredensek, K. Research on the modelling and analysis of the penetration of renewable sources and storage into electrical networks. Energies 2025, 18, 2263. [Google Scholar] [CrossRef]
  5. Huang, J.; Xu, Y.; Ghias, A. Wind power plant dispatch for power grid frequency dynamics improvement: A surrogate model-based method. IEEE Trans. Power Syst. 2025, 40, 3261. [Google Scholar] [CrossRef]
  6. Wei, J.; Wei, L.; Huang, S.; Wang, B.; Huang, G.; Shen, F. Optimal coordinated post-event voltage control with energy storage boundary analysis for large-scale wind farms. IEEE Trans. Power Syst. 2025, 40, 3374. [Google Scholar] [CrossRef]
  7. Bogdan, M.; David, P. Three-level coordination in power system stabilization. Electr. Power Syst. Res. 2014, 111, 40. [Google Scholar] [CrossRef]
  8. Gong, Y.; Qin, H.; Fu, H. Optimal dispatch strategy of photovoltaic power-generation system considering source load uncertainty. J. Electr. Power Sci. Technol. 2019, 34, 112. [Google Scholar]
  9. Gao, N.; Zhang, H.; Wang, Z. Location and capacity planning for distributed energy storage in regional power grids. High Volt. Appar. 2020, 56, 52. [Google Scholar]
  10. Jiang, T.; Li, Y.; Ju, P. Overview of flexible load control and model research. Smart Electr. Power 2020, 48, 1. [Google Scholar]
  11. Shao, Z.; Zou, X.; Yuan, X. A review of energy storage applications under the background of flexible distribution networks. Electr. Meas. Instrum. 2020, 57, 86. [Google Scholar]
  12. Armghan, H.; Xu, Y.; Ali, N.; Farooq, U. Coordination control in hybrid energy storage based microgrids providing ancillary services: A three-layer control approach. J. Energy Storage 2024, 93, 112221. [Google Scholar] [CrossRef]
  13. Huang, Z.; Liu, L.; Liu, J. Multi-time-scale coordinated optimum scheduling technique for a multi-source complementary power-generating system with uncertainty in the source-load. Energies 2023, 16, 3020. [Google Scholar] [CrossRef]
  14. Mi, Y.; Chen, Y.; Yuan, M.; Li, Z.; Tao, B.; Han, Y. Multi-timescale optimal dispatching strategy for coordinated source-grid-load-storage interaction in active distribution networks based on second-order cone planning. Energies 2023, 16, 1356. [Google Scholar] [CrossRef]
  15. Zhao, L.; Wang, Z.; Yi, H.; Li, Y.; Wang, X.; Xiao, Y.; Hu, Z.; Zhou, H.; Zhang, X. Source-storage-load flexible scheduling strategy considering characteristics complementary of hydrogen storage system and flexible carbon-capture system. Energies 2024, 17, 3894. [Google Scholar] [CrossRef]
  16. Wang, B.; Tian, Z.; Yang, H.; Li, C.; Xu, X.; Zhu, S.; Du, E.; Zhang, N. Collaborative planning of source-grid-load-storage considering wind and photovoltaic support capabilities. Energies 2025, 18, 2045. [Google Scholar] [CrossRef]
  17. Che, B.; Zhang, Z.; Wei, D.; Jin, P.; Yang, Y. Coordinated planning of source-grid-load-storage power system to promote large-scale renewable energy consumption. Asian Conf. Front. Power Energy 2022, 2022, 694. [Google Scholar]
  18. Qi, X.; Liu, L.; Zhang, Z.; Pan, Z.; Wu, W. Study on the cooperative optimized operation of power system source-grid-load-storage based on Gurobi mathematical programming. In Proceedings of the IEEE 7th Information Technology and Mechatronics Engineering Conference, Chongqing, China, 15–17 September 2023; p. 1085. [Google Scholar]
  19. Liu, X.; Li, J.; Huang, C.; Li, X.; Wang, Y.; Chen, X. Research on source-grid-load-storage coordination planning method of centralized-distributed form. In Proceedings of the IEEE PES 16th Asia-Pacific Power and Energy Engineering Conference, Nanjing, China, 25–27 October 2024; p. 1. [Google Scholar]
  20. Wang, H.; Guo, P.; Liu, G. Optimization of source-grid-load-storage coordination of power systems based on multiple time scale model. In Proceedings of the 4th International Conference on New Energy System and Power Engineering, Fuzhou, China, 25–27 April 2025; p. 112. [Google Scholar]
  21. Hirankittiwong, P.; Thanh, N.; Pattanaporkratana, A.; Chattham, N.; Jeenanunta, C.; Seng, V. Intelligent fuzzy multi-criteria decision-making for energy-saving building designs in construction. Energies 2025, 18, 2726. [Google Scholar] [CrossRef]
  22. Xie, F.; Yin, Z.; Luo, A.; Yuan, J. Prediction of distribution network line loss based on grey relation analysis and XGboost. In Proceedings of the IEEE 2nd International Conference on Big Data, Artificial Intelligence and Internet of Things Engineering, Nanchang, China, 26–28 March 2021; p. 279. [Google Scholar]
  23. Zhu, Y.; Tian, D.; Yan, F. Effectiveness of entropy weight method in decision-making. Math. Probl. Eng. 2020, 2020, 3564835. [Google Scholar] [CrossRef]
  24. Jaworski, S.; Chrzanowska, M.; Monica, Z.; Robert, P.; Aleksandra, J.; Piotr, Z. Evaluating the progress of renewable energy sources in Poland: A multidimensional analysis. Energies 2023, 16, 6431. [Google Scholar] [CrossRef]
  25. Zhan, Q.; Su, J.; Lin, J.; Guo, S. Coordinated optimization of source-storage–load in distribution network based on edge computation. Energy Rep. 2023, 9, 492. [Google Scholar] [CrossRef]
  26. Li, M.; Tian, Y.; Zhang, H.; Zhang, N. The source-load-storage coordination and optimal dispatch from the high proportion of distributed photovoltaic connected to power grids. J. Eng. Res. 2024, 12, 421. [Google Scholar] [CrossRef]
  27. Xie, L.; Jiang, J.; Huang, A.; Tang, Y.; Liu, Y.; Zhou, H.; Xing, Z. Calorimetric Evaluation of Thermal Stability of Organic Liquid Hydrogen Storage Materials and Metal Oxide Additives. Energies 2022, 15, 2236. [Google Scholar] [CrossRef]
  28. Zhang, F.; Guo, J.; Yuan, F.; Shi, Y.; Li, Z. Research on Denoising Method for Hydroelectric Unit Vibration Signal Based on ICEEMDAN–PE–SVD. Sensors 2023, 23, 6368. [Google Scholar] [CrossRef] [PubMed]
  29. Rogge, N. Composite indicators as generalized benefit-of-the-doubt weighted averages. Eur. J. Oper. Res. 2018, 267, 381. [Google Scholar] [CrossRef]
  30. Hashem, O.; Mahsa, V.; Saeid, J. Construct a composite indicator based on integrating common weight data envelopment analysis and principal component analysis models: An application for finding development degree of provinces in Iran. Soc. Econ. Plan. Sci. 2019, 68, 100618. [Google Scholar]
  31. Bao, Q.; Zhu, Y.; Wang, Y.; Feng, Y. Can entropy weight method correctly reflect the distinction of water quality indices. Water Resour. Manag. 2020, 34, 3667. [Google Scholar] [CrossRef]
  32. Galym, T.; Aidana, T.; Serdar, D.; Nurlan, O.; Mert, G.; Ali, T.; Ferhat, K. Stakeholder based weights of new sustainability indicators providing pandemic resilience for residential buildings. Sustain. Cities Soc. 2021, 75, 103300. [Google Scholar] [CrossRef]
  33. Chintala, B.; Kumar, D. Multiobjective meter placement in active distribution system state estimation using inverse-model-based multilabel Gaussian classification with adaptive reference point method. Int. Transation Electr. Energy Syst. 2021, 31, 12935. [Google Scholar]
  34. Chen, L.; Miettinen, K.; Xin, B.; Vesa, O. Comparing reference point based interactive multiobjective optimization methods without a human decision maker. J. Glob. Optim. 2023, 85, 757. [Google Scholar] [CrossRef]
Figure 1. A multi-level coordination-level evaluation of source-grid-load-storage.
Energies 18 04321 g001
Figure 2. Flowchart of AHP-entropy weighting method.
Energies 18 04321 g002
Figure 3. Wind and photovoltaic output and data-center load on a typical day in Xining City, Qinghai Province.
Energies 18 04321 g003
Figure 4. Charging and discharging power and SOC of energy-storage devices on a typical day in Xining City, Qinghai Province.
Energies 18 04321 g004
Table 1. Average random consistency index.
n123456789
RI0.000.000.520.891.121.261.361.411.46
Table 2. Indicator weightings of single links for direct factors.
Single LinkCharacteristic VectorIndicator WeightingMaximum Characteristic ValueCI
power sources0.4158.296%5.1140.029
power grids2.61352.26%
load resources1.15423.07%
energy storage0.2535.057%
Table 3. Indicator weightings of link interactions for direct factors.
Link InteractionCharacteristic VectorIndicator WeightingMaximum Characteristic ValueCI
source-grid0.4297.140%3.0000.000
source-load0.85714.28%
source-storage1.71428.57%
grid-load1.00014.28%
grid-storage0.5007.140%
load-storage2.00028.57%
Table 4. Calculation of the coordination-level evaluation indicators.
RegionSingle LinkLink InteractionIndirect Indicators
A0.5850.5930.773
B0.6060.5950.783
C0.5420.5300.765
Table 5. Final evaluation results of three regions.
RegionComprehensive Indicator ScoreCoordination Level Evaluation
A0.627slightly high
B0.631slightly high
C0.582medium
Disclaimer/Publisher’s Note: The statements, opinions and data contained in all publications are solely those of the individual author(s) and contributor(s) and not of MDPI and/or the editor(s). MDPI and/or the editor(s) disclaim responsibility for any injury to people or property resulting from any ideas, methods, instructions or products referred to in the content.